Gold-supported cerium-doped NiOx catalysts for water oxidation · 2016-05-06 · Gold‐Supported...
17
SUPPLEMENTARY INFORMATION ARTICLE NUMBER: 16053 | DOI: 10.1038/NENERGY.2016.53 NATURE ENERGY | www.nature.com/natureenergy 1 Jia Wei Desmond Ng 1 , Max García‐Melchor 2 , Michal Bajdich 2 , Pongkarn Chakthranont 1 , Charlotte Kirk 1 , Aleksandra Vojvodic 2 *, Thomas F. Jaramillo 1,2 * 1 Department of Chemical Engineering, Stanford University, Stanford, CA 94305, USA 2 SUNCAT Center for Interface Science and Catalysis, SLAC National Accelerator Laboratory, Menlo Park, CA 94025, USA. * Authors to whom correspondence should be addressed: [email protected], [email protected] Gold-supported cerium-doped NiO x catalysts for water oxidation
Transcript of Gold-supported cerium-doped NiOx catalysts for water oxidation · 2016-05-06 · Gold‐Supported...

SUPPLEMENTARY INFORMATIONARTICLE NUMBER: 16053 | DOI: 10.1038/NENERGY.2016.53
NATURE ENERGY | www.nature.com/natureenergy 1
Supplementary Information
Gold‐Supported Cerium‐Doped NiOx Catalysts for Water Oxidation
Jia Wei Desmond Ng1, Max García‐Melchor2, Michal Bajdich2, Pongkarn Chakthranont1, Charlotte Kirk1, Aleksandra Vojvodic2*, Thomas F. Jaramillo1,2*
1 Department of Chemical Engineering, Stanford University, Stanford, CA 94305, USA
2 SUNCAT Center for Interface Science and Catalysis, SLAC National Accelerator Laboratory, Menlo Park, CA 94025, USA.
* Authors to whom correspondence should be addressed: [email protected], [email protected]
Gold-supported cerium-doped NiOx catalysts for water oxidation
2 NATURE ENERGY | www.nature.com/natureenergy
SUPPLEMENTARY INFORMATION DOI: 10.1038/NENERGY.2016.53
Supplementary Figures
(a)
Supplementary Figure 1. Physical and chemical characterization of NiCeOx−Au. (a) Ni and Ce elemental mappings and the corresponding SEM image of NiCeOx−Au taken using Auger electron spectroscopy. (b) High resolution XPS spectra of the O 1s region of NiCeOx−Au. The dotted vertical lines indicate the region where O is expected to exist as hydroxide. (c) XRD diffractograms of NiCeOx−Au and bare Au‐coated glassy carbon substrate. The "•" symbol indicates a peak arising from the glassy carbon substrate.
533 532 531 530 529
NiCeOx-Au(b)
Inte
nsity
(a.u
.)
hydroxide
Binding Energy (eV)10 20 30 40 50 60 70 80 90
(c)
Au
(222
)
Inte
nsity
(a.u
.)
Au
(111
)2 (degrees)
Bare Au-GC substrate NiCeOx-Au
NATURE ENERGY | www.nature.com/natureenergy 3
SUPPLEMENTARY INFORMATIONDOI: 10.1038/NENERGY.2016.53
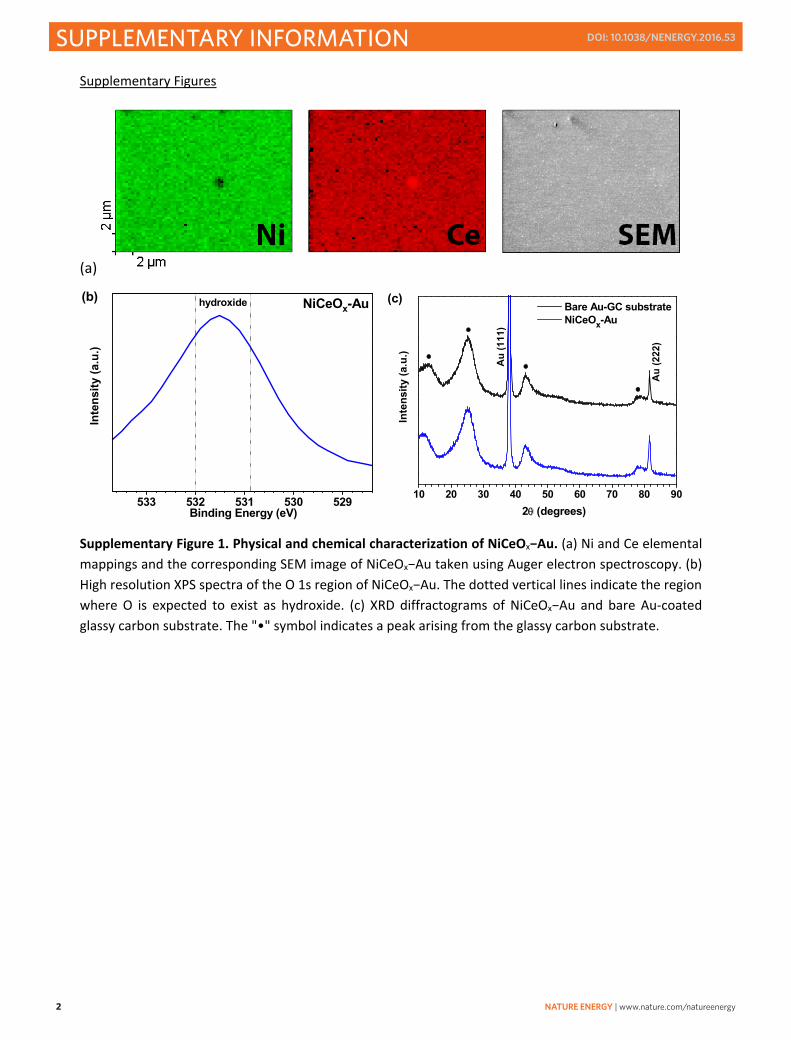
Supplementary Figure 2. Optimization of the Ni to Ce ratio of Ni1‐xCexOy−Au. (a) Cyclic voltammograms displaying the OER performance of the Ni1‐xCexOy−Au catalysts. The sweeps are color‐coded according to the rainbow spectrum in order of increasing amounts of Ce. (b) Activity of Ni1‐xCexOy−Au as a function of the percentage of Ni in the deposition solution. The left y‐axis represents the current density at 350 mV overpotential, while the right y‐axis represents the overpotential required to reach 10 mA/cm2.
1.2 1.3 1.4 1.5 1.6 1.7-20
-10
0
10
20
30
40
50
60
70(a) NiOx-Au Ni99Ce1Ox-Au Ni97Ce3Ox-Au Ni95Ce5Ox-Au Ni90Ce10Ox-Au Ni80Ce20Ox-Au Ni75Ce25Ox-Au Ni50Ce50Ox-Au CeOx-Au
Potential (V versus RHE)
Cur
rent
Den
sity
(mA
/cm
2 geo)
1 M NaOH, 10 mV/s
0 50 60 70 80 90 1000
10
20
30
40
50
60
70
Ove
rpot
entia
l to
Rea
ch 1
0 m
A/c
m2 ge
o (V)
Mol % Ni in Ni1-xCexOy-Au
Cur
rent
Den
sity
at 3
50 m
VO
verp
oten
tial (
mA
/cm
2 geo)
1M NaOH, 10 mV/s
0.20
0.25
0.30
0.35
0.40
0.45
0.50
0.55
0.60(b)
4 NATURE ENERGY | www.nature.com/natureenergy
SUPPLEMENTARY INFORMATION DOI: 10.1038/NENERGY.2016.53
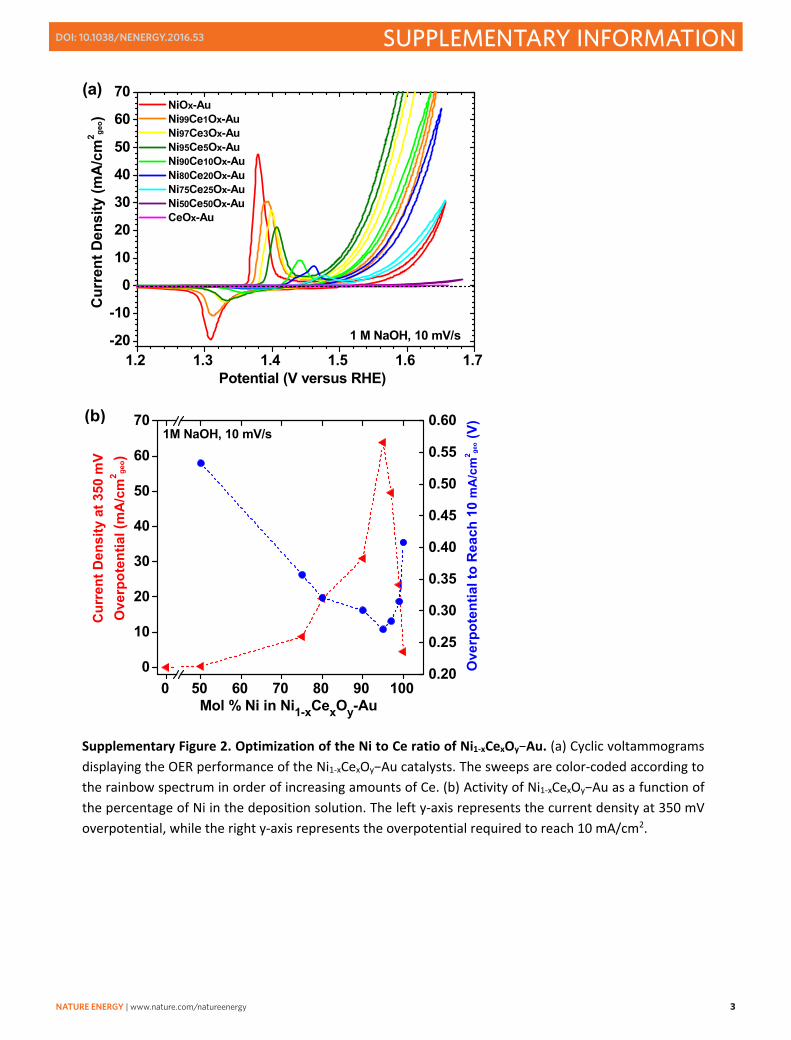
Supplementary Figure 3. Electrochemical profile of NiCeOx−Au in two distinct systems. Cyclic voltammograms displaying the electrochemical profile of NiCeOx‐Au in an unpurified system and a Fe‐free system.
1.2 1.3 1.4 1.5 1.6 1.7-20
-10
0
10
20
30
40
50
60
70 Unpurified system Fe-free system
Potential (V versus RHE)
Cur
rent
Den
sity
(mA
/cm
2 geo)
1 M NaOH, 10 mV/s
NATURE ENERGY | www.nature.com/natureenergy 5
SUPPLEMENTARY INFORMATIONDOI: 10.1038/NENERGY.2016.53
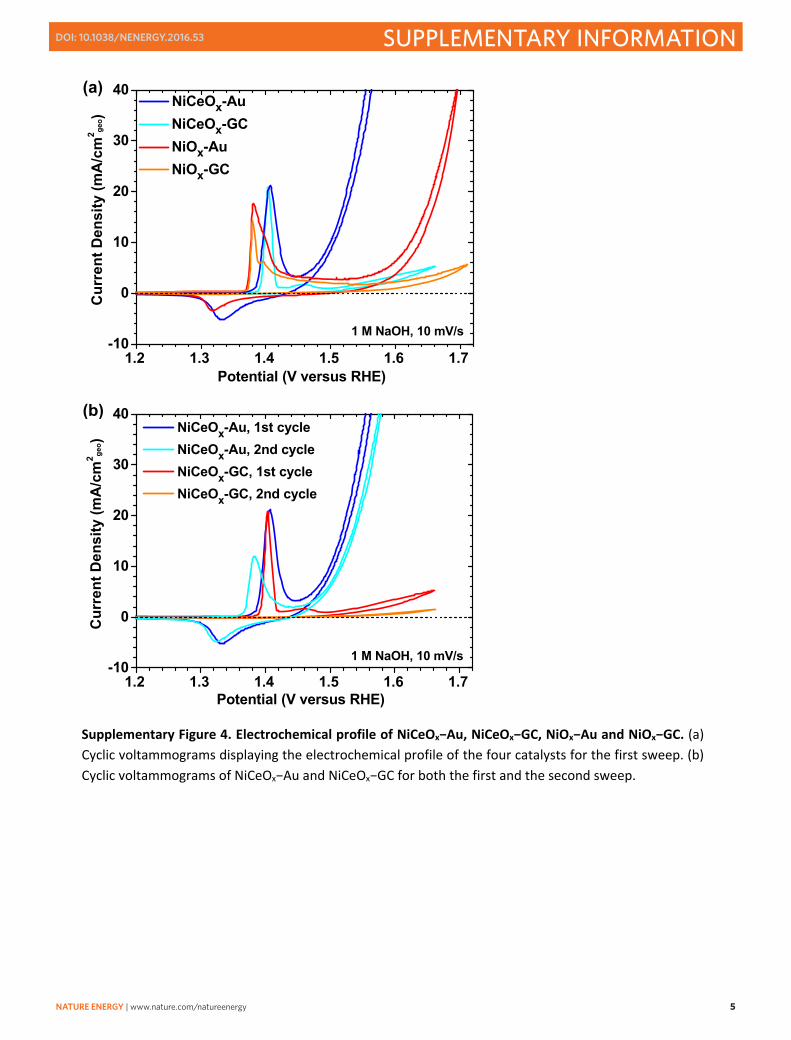
Supplementary Figure 4. Electrochemical profile of NiCeOx−Au, NiCeOx−GC, NiOx−Au and NiOx−GC. (a) Cyclic voltammograms displaying the electrochemical profile of the four catalysts for the first sweep. (b) Cyclic voltammograms of NiCeOx−Au and NiCeOx−GC for both the first and the second sweep.
1.2 1.3 1.4 1.5 1.6 1.7-10
0
10
20
30
40(a) NiCeOx-Au NiCeOx-GC NiOx-Au NiOx-GC
Potential (V versus RHE)
Cur
rent
Den
sity
(mA
/cm
2 geo)
1 M NaOH, 10 mV/s
1.2 1.3 1.4 1.5 1.6 1.7-10
0
10
20
30
40(b) NiCeOx-Au, 1st cycle NiCeOx-Au, 2nd cycle NiCeOx-GC, 1st cycle NiCeOx-GC, 2nd cycle
Potential (V versus RHE)
Cur
rent
Den
sity
(mA
/cm
2 geo)
1 M NaOH, 10 mV/s
6 NATURE ENERGY | www.nature.com/natureenergy
SUPPLEMENTARY INFORMATION DOI: 10.1038/NENERGY.2016.53
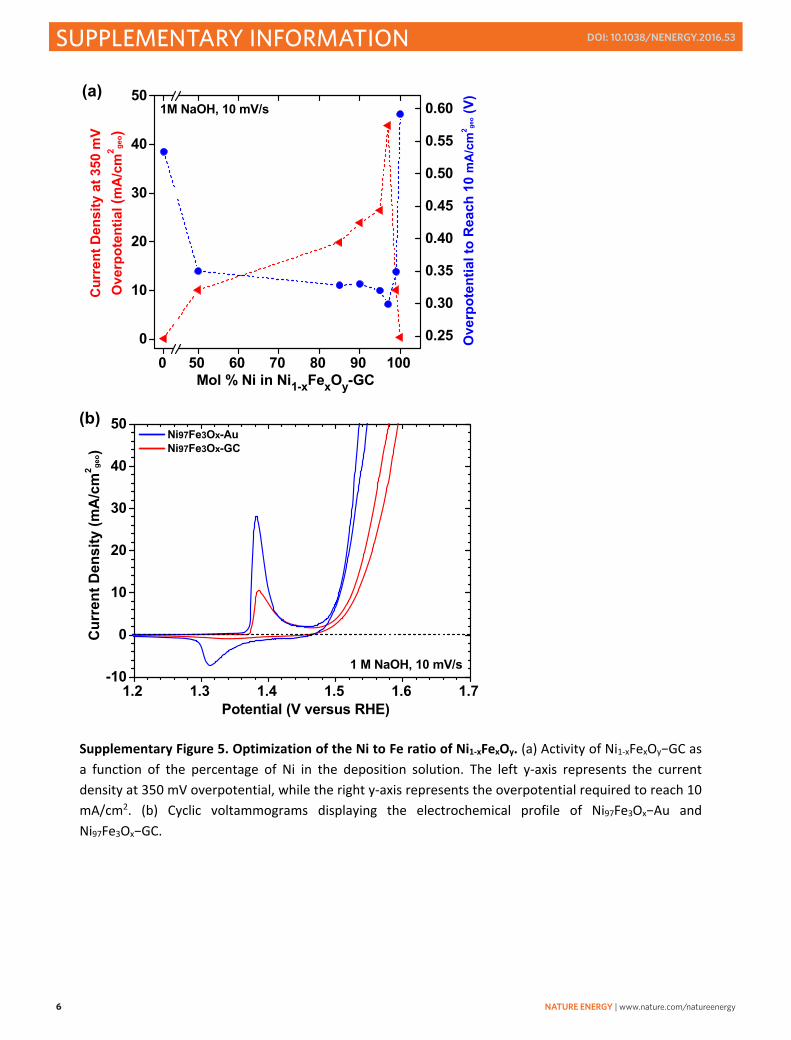
Supplementary Figure 5. Optimization of the Ni to Fe ratio of Ni1‐xFexOy. (a) Activity of Ni1‐xFexOy−GC as a function of the percentage of Ni in the deposition solution. The left y‐axis represents the current density at 350 mV overpotential, while the right y‐axis represents the overpotential required to reach 10 mA/cm2. (b) Cyclic voltammograms displaying the electrochemical profile of Ni97Fe3Ox−Au and Ni97Fe3Ox−GC.
0 50 60 70 80 90 1000
10
20
30
40
50
Ove
rpot
entia
l to
Rea
ch 1
0 m
A/c
m2 ge
o (V)
Mol % Ni in Ni1-xFexOy-GC
Cur
rent
Den
sity
at 3
50 m
VO
verp
oten
tial (
mA
/cm
2 geo)
1M NaOH, 10 mV/s
0.25
0.30
0.35
0.40
0.45
0.50
0.55
0.60(a)
1.2 1.3 1.4 1.5 1.6 1.7-10
0
10
20
30
40
50(b) Ni97Fe3Ox-Au Ni97Fe3Ox-GC
Potential (V versus RHE)
Cur
rent
Den
sity
(mA
/cm
2 geo)
1 M NaOH, 10 mV/s

NATURE ENERGY | www.nature.com/natureenergy 7
SUPPLEMENTARY INFORMATIONDOI: 10.1038/NENERGY.2016.53
(a) (b)
(c) (d)
Supplementary Figure 6. Images of the electrodes used for water electrolysis. SEM images of (a) NiCeOx on Au‐coated Ni foam, (b) NiMo on Ni foam, and (c) bare Ni foam for comparison. (d) Photograph of the three electrodes.

8 NATURE ENERGY | www.nature.com/natureenergy
SUPPLEMENTARY INFORMATION DOI: 10.1038/NENERGY.2016.53
Supplementary Figure 7. Evaluation of the performance of the NiCeOx−Au‐ and NiMo‐coated electrodes versus a bare Ni foam substrate. Chronopotentiometric runs of the individual electrodes at 50 mA in a three‐electrode electrochemical cell setup. The electrolyte was 6 M KOH, while the counter and reference electrodes were a carbon rod and Ag/AgCl respectively.
0 1 2 3 4 5-0.5
0.0
0.5
1.0
1.5
2.0
2.53-Electrode Testing
NiCeOx on Au-coated Ni foam NiMo on Ni foam bare Ni foam
Time (minutes)
Pote
ntia
l (V
vers
us R
HE)

NATURE ENERGY | www.nature.com/natureenergy 9
SUPPLEMENTARY INFORMATIONDOI: 10.1038/NENERGY.2016.53
Supplementary Figure 8. Photograph of electrolyser setup. The NiCeOx on Au‐coated Ni foam anode and the NiMo on Ni foam cathode was held in separate halves of an H‐cell in a 6 M KOH electrolyte and separated by an anion‐exchange membrane.
10 NATURE ENERGY | www.nature.com/natureenergy
SUPPLEMENTARY INFORMATION DOI: 10.1038/NENERGY.2016.53
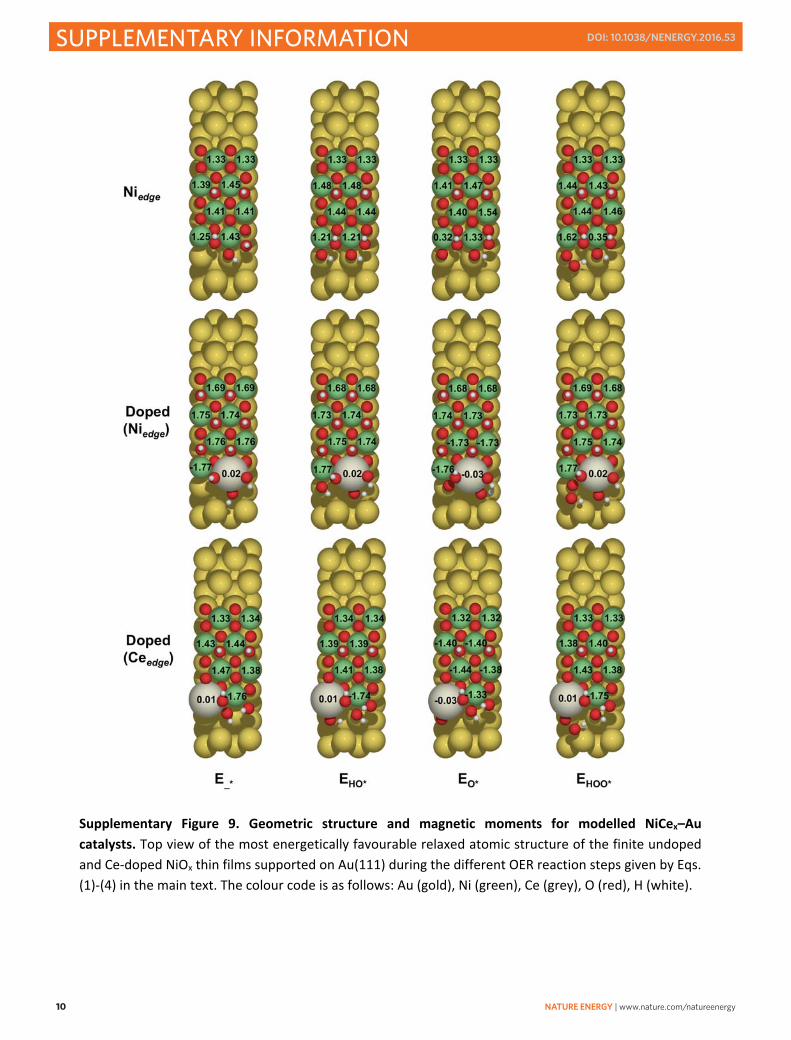
Supplementary Figure 9. Geometric structure and magnetic moments for modelled NiCex–Au catalysts. Top view of the most energetically favourable relaxed atomic structure of the finite undoped and Ce‐doped NiOx thin films supported on Au(111) during the different OER reaction steps given by Eqs. (1)‐(4) in the main text. The colour code is as follows: Au (gold), Ni (green), Ce (grey), O (red), H (white).
NATURE ENERGY | www.nature.com/natureenergy 11
SUPPLEMENTARY INFORMATIONDOI: 10.1038/NENERGY.2016.53
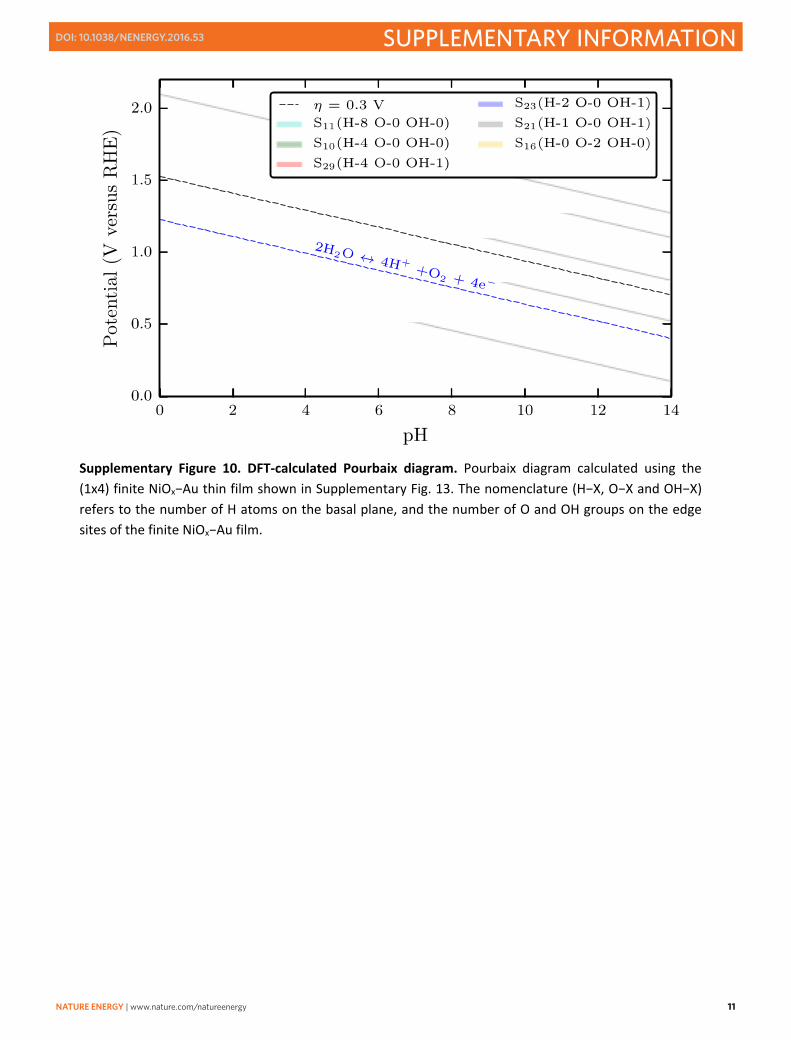
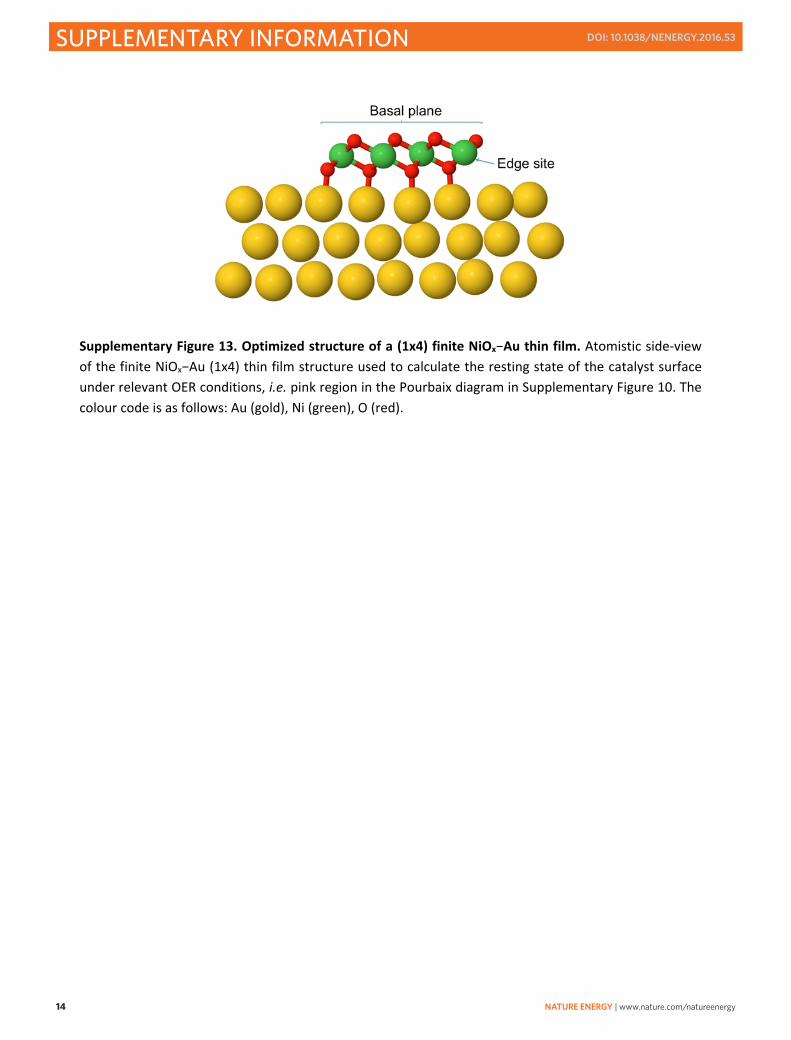
Supplementary Figure 10. DFT‐calculated Pourbaix diagram. Pourbaix diagram calculated using the (1x4) finite NiOx−Au thin film shown in Supplementary Fig. 13. The nomenclature (H−X, O−X and OH−X) refers to the number of H atoms on the basal plane, and the number of O and OH groups on the edge sites of the finite NiOx−Au film.
12 NATURE ENERGY | www.nature.com/natureenergy
SUPPLEMENTARY INFORMATION DOI: 10.1038/NENERGY.2016.53
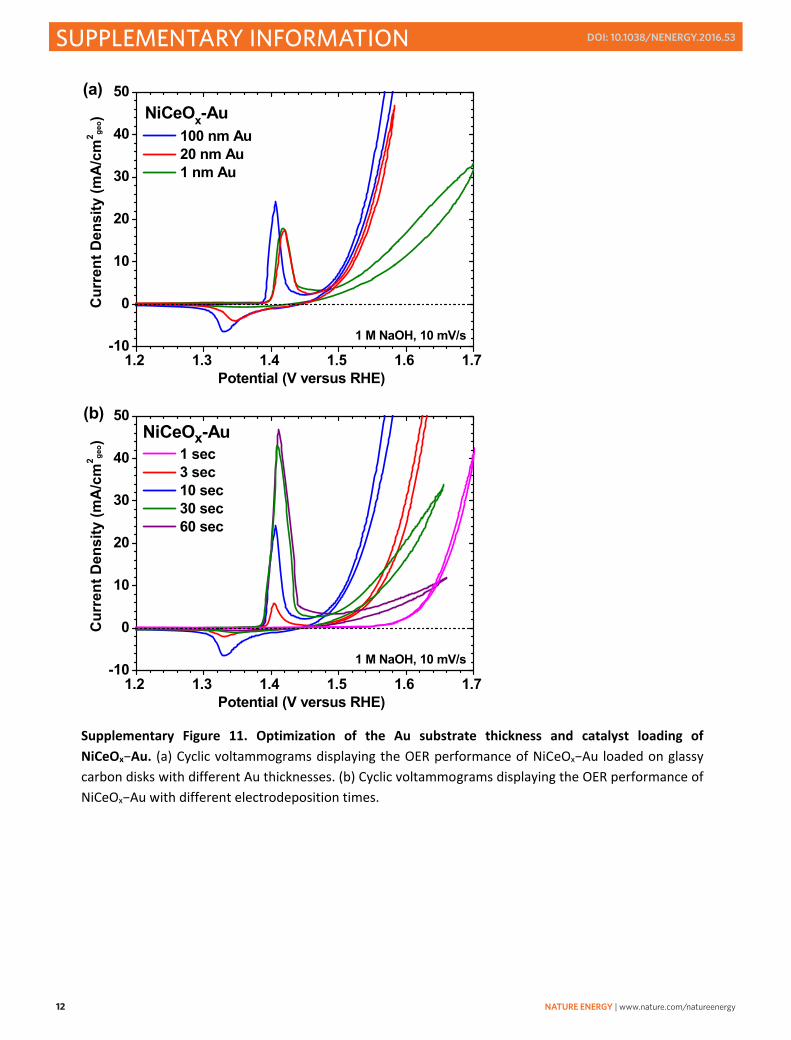
Supplementary Figure 11. Optimization of the Au substrate thickness and catalyst loading of NiCeOx−Au. (a) Cyclic voltammograms displaying the OER performance of NiCeOx−Au loaded on glassy carbon disks with different Au thicknesses. (b) Cyclic voltammograms displaying the OER performance of NiCeOx−Au with different electrodeposition times.
1.2 1.3 1.4 1.5 1.6 1.7-10
0
10
20
30
40
50NiCeOx-Au
(a)
100 nm Au 20 nm Au 1 nm Au
Potential (V versus RHE)
Cur
rent
Den
sity
(mA
/cm
2 geo)
1 M NaOH, 10 mV/s
1.2 1.3 1.4 1.5 1.6 1.7-10
0
10
20
30
40
50NiCeOx-Au
(b)
1 sec 3 sec 10 sec 30 sec 60 sec
Potential (V versus RHE)
Cur
rent
Den
sity
(mA
/cm
2 geo)
1 M NaOH, 10 mV/s
NATURE ENERGY | www.nature.com/natureenergy 13
SUPPLEMENTARY INFORMATIONDOI: 10.1038/NENERGY.2016.53
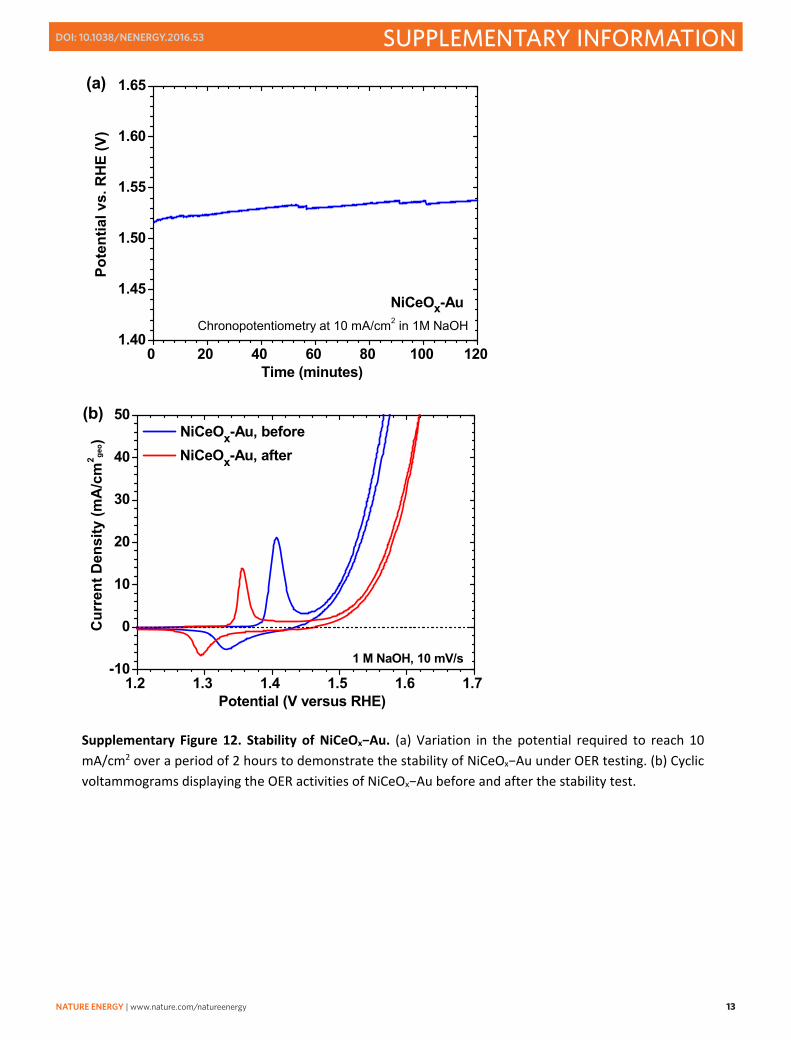
Supplementary Figure 12. Stability of NiCeOx−Au. (a) Variation in the potential required to reach 10 mA/cm2 over a period of 2 hours to demonstrate the stability of NiCeOx−Au under OER testing. (b) Cyclic voltammograms displaying the OER activities of NiCeOx−Au before and after the stability test.
0 20 40 60 80 100 1201.40
1.45
1.50
1.55
1.60
1.65
NiCeOx-AuChronopotentiometry at 10 mA/cm2 in 1M NaOH
(a)
Time (minutes)
Pote
ntia
l vs.
RH
E (V
)
1.2 1.3 1.4 1.5 1.6 1.7-10
0
10
20
30
40
50(b) NiCeOx-Au, before NiCeOx-Au, after
Potential (V versus RHE)
Cur
rent
Den
sity
(mA
/cm
2 geo)
1 M NaOH, 10 mV/s
14 NATURE ENERGY | www.nature.com/natureenergy
SUPPLEMENTARY INFORMATION DOI: 10.1038/NENERGY.2016.53
Supplementary Figure 13. Optimized structure of a (1x4) finite NiOx−Au thin film. Atomistic side‐view of the finite NiOx−Au (1x4) thin film structure used to calculate the resting state of the catalyst surface under relevant OER conditions, i.e. pink region in the Pourbaix diagram in Supplementary Figure 10. The colour code is as follows: Au (gold), Ni (green), O (red).
NATURE ENERGY | www.nature.com/natureenergy 15
SUPPLEMENTARY INFORMATIONDOI: 10.1038/NENERGY.2016.53
Supplementary Tables
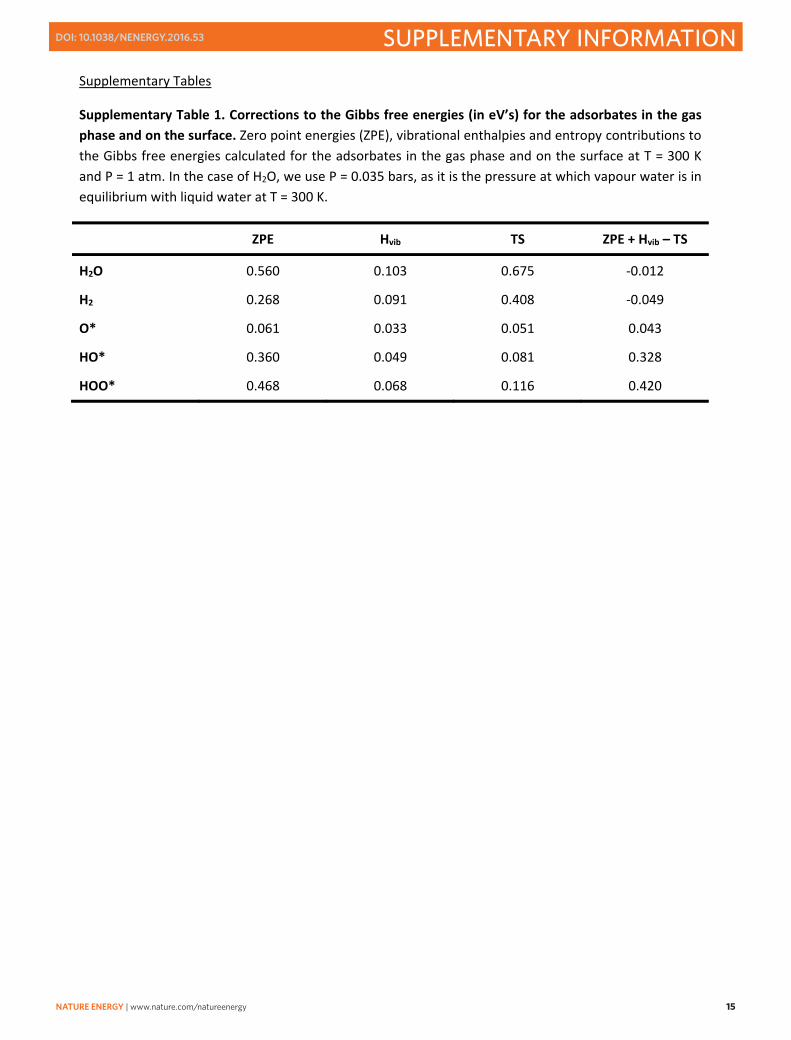
Supplementary Table 1. Corrections to the Gibbs free energies (in eV’s) for the adsorbates in the gas phase and on the surface. Zero point energies (ZPE), vibrational enthalpies and entropy contributions to the Gibbs free energies calculated for the adsorbates in the gas phase and on the surface at T = 300 K and P = 1 atm. In the case of H2O, we use P = 0.035 bars, as it is the pressure at which vapour water is in equilibrium with liquid water at T = 300 K.
ZPE Hvib TS ZPE + Hvib – TS
H2O 0.560 0.103 0.675 ‐0.012
H2 0.268 0.091 0.408 ‐0.049
O* 0.061 0.033 0.051 0.043
HO* 0.360 0.049 0.081 0.328
HOO* 0.468 0.068 0.116 0.420

16 NATURE ENERGY | www.nature.com/natureenergy
SUPPLEMENTARY INFORMATION DOI: 10.1038/NENERGY.2016.53
Supplementary Discussion
Optimization of the thickness of the gold support and the catalyst loading
A study varying the thickness of the gold film on the GC substrate from 1 to 100 nm was conducted. Electrochemical testing revealed that increasing the amount of gold from 1 to 20 nm results in a significant improvement in activity possibly due to the increased number of metal oxide‐gold interfacial sites; however, an additional 80 nm of gold only leads to a slightly further boost in the OER activity which suggests that only a limited amount of additional gold came into contact with the catalyst layer (Supplementary Fig. 11a).
The amount of catalyst deposited on 100 nm of gold was also varied by modifying the deposition times from 1 to 60 seconds, which translates to 8 to 480 nm of catalyst assuming a linear relation between deposition time and catalyst thickness. We found that the 10‐second deposition sample (80 nm catalyst thickness) delivers the best performance (Supplementary Fig. 11b). This suggests that shorter deposition times result in less active sites to turnover the water molecules to oxygen, while longer deposition times lead to films that are structurally unstable or too thick to benefit from the influence of gold1.
Stability of NiCeOx−Au under OER testing
The stability of NiCeOx−Au was examined using the benchmarking protocol, which consists in a chronopotentiometry run with the catalyst held at 10 mA/cm2 for 2 hours in 1 M NaOH (Supplementary Fig. 12a)2. The observed slow and steady increase in potential might be attributed to a number of reasons: blocking of active sites by the O2 bubbles formed during the reaction, morphological changes of the catalyst leading to reduced access to active sites, and/or loss of catalytic material possibly due to dissolution or collateral loss of catalyst, which might also be induced by the O2 bubbles leaving the electrode surface.
The removal of O2 bubbles on the catalyst surface after the chronopotentiometry run, followed by a typical cyclic voltammetry scan, revealed that the catalyst requires only an additional 39 mV overpotential to reach 10 mA/cm2 (Supplementary Fig. 12b), thus demonstrating the excellent stability of NiCeOx−Au.

NATURE ENERGY | www.nature.com/natureenergy 17
SUPPLEMENTARY INFORMATIONDOI: 10.1038/NENERGY.2016.53
Supplementary References
1 Yeo, B. S. & Bell, A. T. In situ Raman study of nickel oxide and gold‐supported nickel oxide catalysts for the electrochemical evolution of oxygen. J. Phys. Chem. C 116, 8394‐8400 (2012).
2 McCrory, C. C. L. et al. Benchmarking hydrogen evolving reaction and oxygen evolving reaction electrocatalysts for solar water splitting devices. J. Am. Chem. Soc. 137, 4347‐4357 (2015).