Gold Ridge Elementary School Circadian Lighting Study
37
Gold Ridge Elementary School Circadian Lighting Study Sacramento Municipal Utility District October 30, 2018 Prepared by: Dave Bisbee, CEM The information in this report is provided by SMUD as a service to our customers. SMUD does not endorse products or manufacturers. Mention of any product or manufacturer in this report should not be construed as an implied endorsement.
Transcript of Gold Ridge Elementary School Circadian Lighting Study

Gold Ridge Elementary School
Circadian Lighting Study
Sacramento Municipal Utility District
October 30, 2018
Prepared by:
Dave Bisbee, CEM
The information in this report is provided by SMUD as a service to our customers.
SMUD does not endorse products or manufacturers. Mention of any product or
manufacturer in this report should not be construed as an implied endorsement.

Gold Ridge Elementary School Circadian Lighting Project page 2
TABLE OF CONTENTS
TABLE OF CONTENTS ....................................................................................................... 2
1. Executive Summary ....................................................................................................... 3
1.1 Introduction .............................................................................................................. 3
1.2 Project Objectives ................................................................................................... 3
1.3 Results ..................................................................................................................... 4
1.4 Recommendations .................................................................................................. 5
1.5 Acknowledgements ................................................................................................. 5
2. Project Description ......................................................................................................... 7
2.1 Project Scope .......................................................................................................... 7
2.2 Research Questions & Methodology...................................................................... 8
2.3 Classroom Lighting Systems .................................................................................. 9
2.4 Residential Lighting (Homes) ............................................................................... 11
3. Project Results ............................................................................................................. 12
3.1 Classrooms ............................................................................................................ 12
3.2 Families.................................................................................................................. 24
3.3 Observations and Lessons Learned .................................................................... 27
4. Recommendations & Next Steps ................................................................................ 28
Appendices.......................................................................................................................... 29
Appendix A – Morning Student Survey ...................................................................... 29
Appendix B – End of Day Student Survey ................................................................. 30
Appendix C – Parent Questionnaire ........................................................................... 31
Appendix D – Weekly Parent Survey Questions ....................................................... 34
Appendix E – Parent Interview Questions ................................................................. 35
Appendix F – Monitoring Equipment .......................................................................... 36

Gold Ridge Elementary School Circadian Lighting Project page 3
1. Executive Summary
1.1 Introduction
Research conducted by the Lighting Research Center (LRC), part of the Rensselaer Polytechnic
Institute1, DOE and others has shown that lighting affects our circadian rhythms, and
consequently may have significant impacts upon our health. Specifically, the spectrum and the
intensity of the light source, as well as the duration and timing of the exposure affect our sleep
patterns. Studies have shown that prolonged sleep deprivation can lead to memory deficits,
limited attention spans, poorer balance and higher rates of depression and anxiety. Several
other recent studies conducted in Europe suggest that the wavelength and intensity of
classroom lighting systems may have an impact upon students as well.
Representatives from the Folsom Cordova Unified School District (Folsom-Cordova) heard
about the results of SMUD’s previous research projects at the ACC Care Center and Eskaton’s
Monroe Lodge2 and asked us to help them explore potential benefits of tunable-white lighting for
children with Autism Spectrum Disorder (ASD).
Although Folsom-Cordova has behavioral experts and teachers with specialized training in ASD,
they needed funding and technical lighting expertise to conduct this research. SMUD responded
by creating a research project and invited Pacific Northwest National Laboratories (PNNL) to
participate. PNNL plans to create two reports for this project under DOE’s GATEWAY program.
The first report has been completed and is available via the DOE website3.
1.2 Project Objectives
This project included two major segments: (1) installing tunable-white LED lighting in three
classrooms, (2) installing tunable-white lighting in the homes of up to 14 students with Autism
Spectrum Disorder (ASD). The main objective for this project was to answer the following
research questions:
1. Did the new classroom lighting system produce any observable behavioral changes for
the students with ASD? Did it produce any observable behavioral changes for the
general education students?
2. Did the new classroom lighting system make the teachers’ jobs easier? What features
did they use? How satisfied were they with the system?
1 For more information, please visit the Lighting Research Center w ebsite: http://w ww.lrc.rpi.edu/
2 To learn more about these projects, please dow nload the full reports at https://w ww.smud.org/en/Business-
Solutions-and-Rebates/Business-Rebates/Advanced-Tech-Solutions
3 For more information, please visit: https://w ww.energy.gov/eere/ssl/articles/report-documents-trial-installation-
tunable-led-classroom-lighting.
Gold Ridge Elementary School Circadian Lighting Project page 4
3. What are the performance characteristics of the new classroom lighting systems? What
are the estimated annual energy (kWh) and cost savings? What is the reduction in
electrical demand (kW)?
4. Did the new lighting systems installed in the homes of the students with ASD produce
any observable behavioral changes? Did it help them sleep better?
5. How easy was the technology to operate? How well did the parents understand it? What
information is necessary for other people to fully use the technology?
6. How satisfied are customers with the technology? Would they recommend it to others
who have children with ASD?
7. What barriers to market adoption exist? Should SMUD promote the technology? If so,
through what programs or channels?
1.3 Results
To answer the research questions listed above, this study included:
• Nearly 4,000 surveys completed by students from the three classrooms. Teachers
assisted the students with ASD.
• Interviews with the three teachers in charge of the classrooms.
• Sixteen months of energy monitoring.
• Eight weeks of monitoring the settings of the classroom lighting controls.
• Illumination measurements for the original and new classroom lighting systems.
• Baseline surveys, weekly surveys and final interviews with the two families who chose
to participate in the home study.
A high-level summary of the results for this project is presented below:
• Students reported a slight increase in overall feelings of wellness and slightly lower
energy levels.
• Feedback from the teachers was overwhelmingly positive. All of them said the new
classroom lighting system helped them teach more effectively.
• The lighting control modes (aka scenes) used most frequently by the teachers were
“General” and the “AV” mode. One teacher used the “Calm” setting on a regular basis.

Gold Ridge Elementary School Circadian Lighting Project page 5
• The new classroom lighting system reduced electrical demand by 60 to 74% and energy
consumption by 26 to 57%. The energy savings were adversely impacted by high stand-
by losses of the lighting controls. Please see the Project Results section for more
information.
• The installed cost of the tunable-white classroom lighting system was an estimated 36%
higher than a comparable system without tuning.
• Unfortunately, based upon the energy and demand savings alone, the simple financial
payback for the classroom lighting system exceeds the rated life of the system.
However, further evidence of non-energy benefits (student achievement, less
absenteeism, greater teacher retention, etc.) could have a large impact on the
economics in the future.
• One of the two families that participated in the home lighting upgrades reported dramatic
improvements in the behavior of their child. The other family reported modest behavioral
improvements and a dramatic reduction in the amount of time it took their child to fall
asleep at night.
1.4 Recommendations
• Based upon the feedback from the teachers and the positive student survey results,
school districts should install LED lighting systems that are dimmable and include
lighting control scenes such as “General” lighting and “AV” modes.
• School districts should consider installing tunable-white LED systems for new
classrooms—especially classrooms that will be used during the evening hours or used
for teaching students with ASD. Hopefully the cost of tunable-white LED lighting systems
will become lower in the future.
• Based upon the improvements experienced by the two families who participated in this
project, more research should be done in the homes for students with ASD. Electric
utilities should consider partnering with non-profit organizations that provide support to
families who have children suffering from ASD.
1.5 Acknowledgements
While many people contributed to this project, we particularly appreciate the cooperation and
efforts of:
• David Frankel (Folsom Cordova Unified School District)
• Tammy Goins (Folsom Cordova Unified School District)
Gold Ridge Elementary School Circadian Lighting Project page 6
• Mike Hammond (Folsom Cordova Unified School District)
• Bethanee Hunnicutt (Folsom Cordova Unified School District)
• Kevin Smith (Folsom Cordova Unified School District)
• Teachers at Gold Ridge Elementary School
• The Gunter Family
• Brian Pizzi (Cadmus)
• Emily Shackleton (Cadmus)
• Sepideh Shahinfard (Cadmus)
• John Walczyk (Cadmus)
• Stephen Radovitch (Finelite)
• Aaron Smith (Finelite)
• Jane White (Finelite)
• Robert Davis (Pacific Northwest National Labs)
• Sarah Safranek (Pacific Northwest National Labs)
• Mike Corbett (Sacramento Muncipal Utility District)
• Connie Samla (Sacramento Muncipal Utility District)
• Damien Waples (Sacramento Muncipal Utility District)
• Brittany Woodard (Sacramento Muncipal Utility District)

Gold Ridge Elementary School Circadian Lighting Project page 7
2. Project Description
2.1 Project Scope
This project included two major areas: installing tunable-white LED lighting in three classrooms
and installing tunable-white lighting in the homes of up to 14 students with Autism Spectrum
Disorder (ASD). The project was organized into three phases:
• Phase 1: Baseline Period. During this phase the project team monitored the energy
consumption of the classrooms (fluorescent lighting systems) and developed the student
surveys that were used during Phase 2 and Phase 3. At the end of Phase 1, the
classroom lights were replaced with tunable-white LED systems (Figure 1).
• Phase 2: LED Lighting Static Mode. During this phase the tunable-white feature was
disabled. Teachers could dim the lights and use lighting control scenes (e.g. AV Mode),
but the Correlated Color Temperature (CCT) was fixed at 4100K. The project team
monitored the energy consumption and administered student surveys throughout this
phase. The main purpose of this phase was to establish a clean baseline for assessing
the effects of the circadian mode upon student behavior during Phase 3.
During the last two weeks of Phase 2, the project team worked with two families of
students with ASD to install tunable-white lighting (mostly light bulbs) in their homes.
Although fourteen families were eligible, only two chose to participate.
• Phase 3: LED Lighting Circadian Mode. During this phase of the project, the lights in the
classrooms were set to automatically change color temperatures and two new lighting
control scenes were made available: “Calm” and “Energize”. During this phase, the
project team continued to monitor the energy consumption of the classrooms and
administer student surveys. The project team also monitored the lighting control set
points for eight weeks to track which control scenes (modes) the teachers used.
The parents of the two families who participated in
the home lighting upgrades completed baseline
questionnaires and weekly surveys. They were
also interviewed at the end of the monitoring
period. Complete copies of these surveys can be
found in the appendix section of this report.
Figure 1: one of the three
classrooms included in the study.

Gold Ridge Elementary School Circadian Lighting Project page 8
2.2 Research Questions & Methodology
The research questions and methodologies used for obtaining the answers are described below.
• Questions: did the new classroom lighting system produce any observable behavioral
changes for the students with ASD? Did it produce any observable behaviora l changes
for the general education students?
Methodology: Folsom-Cordova’s
Behavioral Specialists developed electronic
and paper surveys to assess the overall
alertness and energy levels of the 44
students who participated in the study.
Thirty of these students were general
education students and 14 of them were
students with ASD. During this study a total
of nearly 4,000 surveys were completed
over a period of eight months. A sample
survey is shown in Figure 2. Copies of the
complete surveys are included in the
Appendix section of this report.
• Questions: Did the new classroom lighting system make the teachers’ jobs easier?
What features did they use? How satisfied were they with the system?
Methodology: At the end of Phase 3, the project team met with the teachers to discuss
their experiences with the lighting system. The team also used custom software to track
the setpoints used by the teachers during the last eight weeks of Phase 3.
• Questions: What are the performance characteristics of the new classroom lighting
systems? What are the estimated annual energy (kWh) and cost savings? What is the
reduction in electrical demand (kW)?
Methodology: the energy consumption of the classroom lighting systems was
monitored at the circuit level throughout the entire project. The project team measured
the illumination levels as well. Information regarding the specific types of equipment
used during this project may be found in the Appendix section of this report.
• Questions: Did the new lighting systems installed in the homes of the students with
ASD produce any observable behavioral changes? Did it help them sleep better?
Methodology: The parents of the participating families completed an initial
questionnaire followed by weekly surveys. They were also interviewed at the end of
Figure 2: sample of one of the student
surveys used during this study.

Gold Ridge Elementary School Circadian Lighting Project page 9
Phase 3. Copies of the initial questionnaire, weekly survey and final interview questions
may be found in the Appendix section of this report.
• Questions: How easy was the technology to operate? How well did the parents
understand it? What information is necessary for other people to fully use the
technology? How satisfied are customers with the technology? Would they recommend it
to other parents who have children with ASD?
Methodology: The project team interviewed the parents of the participating families at
the end of Phase 3.
• Questions: What barriers to market adoption exist? Should SMUD promote the
technology? If so, through what programs or channels?
Methodology: The project team interviewed teachers, administrators and parents who
participated in the project.
2.3 Classroom Lighting Systems
Original Lighting
The original lighting systems consisted of twenty-four,
2 x 4 recessed fluorescent fixtures installed as shown
in Figure 3 and Figure 4. The light fixtures included two
4ft. T8 fluorescent lamps (4100K) and electronic
ballasts and each consumed 56 Watts of power.
The lights were controlled by two switches located near
the door. These switches enabled the teachers to turn
off every other fixture. However, the students often had
trouble seeing the presentations, so the teachers had
to turn off all the lights.
The measured illumination levels with all lights turned
on ranged from 57 to 91 foot-candles (fc) at the desk
level.
New Lighting
The new lighting system for each classroom included
twelve Finelite LED 2 x 2 recessed, tunable-white
fixtures and a linear wall-wash fixture installed as
shown in Figures 5 & 6. All new lights are dimmable
and can be set from 2700K to 6500K. The 2 x 2 fixtures
Figure 3: the original lighting system
consisted of 26 f luorescent lights as
show n above. Photo credit: PNNL
Figure 4: layout for the original
lighting system. Credit: PNNL

Gold Ridge Elementary School Circadian Lighting Project page 10
each consume a maximum of 42 Watts. The wall-wash
fixtures consume up to 40 Watts each (Figure 7).
The new lights are controlled via keypads (similar to
the one shown in Figure 8). The new controllers feature
sliders to control intensity and CCT and five preset
scenes. The lighting control scenes described below
were programmed in the field during the
commissioning process:
1. General: all lights in the room set for 56% of
maximum output, CCT: 4397K. The average
measured illumination levels were around 36 fc.
2. AV Mode: wall-wash fixture off; recessed lights
set for 11% of maximum output. CCT: 3197K.
3. Screen: wall-washer fixture set for 80% of
maximum output. Recessed lights set for
21% of maximum. CCT for all lights: 4397K.
4. Calm: wall-wash fixture off; recessed lights
set for 6% of maximum output. CCT for all
lights: 2997K. The average measured
illumination levels were around 3 fc.
5. Energize: wall-wash fixture off; recessed
lights set for 62% of maximum output. CCT:
5304K. The average measured illumination
levels were around 36 fc.
Figure 8: the new classroom lighting systems
w ere controlled by keypads w ith slider controls
and preset lighting scenes. Photo credit: PNNL.
Figure 6: layout for the new LED
lighting system. Credit: PNNL.
Figure 5: the new lighting system for
each classroom includes tw elve 2 x 2
recessed, tunable-w hite LED fixtures.
Photo credit: PNNL
Figure 7: the new classroom lighting systems
included w all w ash f ixtures that could be controlled
independently from the recessed f ixtures. This
feature w as especially helpful during presentations.

Gold Ridge Elementary School Circadian Lighting Project page 11
2.4 Residential Lighting (Homes)
Ultimately, only two families chose to participate in the home lighting portion of the project. At
the end of Phase 2, the project team conducted lighting audits and provided recommendations
for the new tunable lighting systems. The original lights for the two homes were fairly-typical:
recessed downlights, ceiling fans, bathroom vanity lights, table and floor lamps (Figure 9). Many
of the original light bulbs were compact fluorescents with CCTs of 2700K.
During the recruiting process, the families were provided with a presentation that included the
basics of lighting and circadian lighting principles. After the lighting audits were completed, the
families purchased and installed Philips Hue products including:
• White Ambiance A19 LED bulbs
• White and Color Ambiance A19
LED bulbs
• White Ambiance BR30 LED
Flood Lights
• Smart Dimmer Switches with
Remote
• Smart Motion Sensors
• White Ambiance Wellness
Dimmable Smart LED Table
Lamp
After the lights were installed and inspected, SMUD provided reimbursements of $1,500 per
family.
Figure 9: the original lights for the tw o homes w ere fairly-
typical and included recessed dow nlights, ceiling fans,
bathroom vanity lights, table lamps and floor lamps.

Gold Ridge Elementary School Circadian Lighting Project page 12
3. Project Results
3.1 Classrooms
Hours of Operation
The project team monitored the energy consumption of classrooms D2, F6 and G1. The monthly
operating hours are shown in Figure 10. The total annual operating hours ranged from 1,482 to
1,529 hours per year. These hours of operation are typical for elementary school classrooms
but much lower than office buildings.
Demand Savings
The lighting demand savings are shown in
Figure 11. Typical electrical demand profiles for
each classroom are shown in Figure 12. The new
lighting system reduced the electrical demand by
74% for classroom D2, 73% for classroom F6 and
60% for classroom G1. It is also interesting to
note that the maximum measured wattages for
the classrooms were around 24% less than the
total connected lighting load. This indicates that
the teachers consistently dimmed the lights
and/or used the lighting control scenes.
Figure 10: monthly hours of use for the three classrooms at Gold Ridge Elementary School.
Figure 11: electrical demand for the original
f luorescent and new LED lighting systems.

Gold Ridge Elementary School Circadian Lighting Project page 13
Figure 12: the new classroom lighting systems reduced peak electrical demand from 60 to 74%. It is also
interesting to note that the maximum measured w attages for the classrooms w ere around 24% less than the total
connected lighting load—a clear indication that the teachers consistently dimmed the new lights.

Gold Ridge Elementary School Circadian Lighting Project page 14
Energy Savings
Based upon the monitoring data, the estimated energy savings ranged from 26 to 57.3%
(Figure 13). The savings were less for classroom G1 because the teacher frequently turned on
only half of the original fluorescent lighting. The energy savings for this project were adversely
impacted by standby losses of the lighting controls (Figure 14). Standby losses (or vampire
loads) refer to the energy consumed by a device when it is switched off.
Although the standby losses were only
between 3-4 Watts per fixture, they
collectively accounted for 40% of the
overall energy consumption of the LED
lighting system. One reason this
percentage is so high is that the lighting
systems are only used around 1,500
hours per year, whereas the standby
loads occur during the remaining 7,260
hours. Fortunately, Finelite has
developed options to avoid these losses
for future projects.
Figure 13: estimated annual energy consumption for the
original f luorescent and new LED lighting systems.
Figure 14: demand graph show ing the standby losses due to the DMX lighting controls. Collectively
these losses account for 25% of the overall annual energy consumption of the LED lighting system.
Fortunately, Finelite has developed options to avoid these losses for future projects .
Standby
losses

Gold Ridge Elementary School Circadian Lighting Project page 15
Illumination levels
The illumination levels for the original fluorescent
lighting system ranged from 57- 91 fc. These
levels were significantly higher than the current
IES recommended level of 30 fc for classrooms.
The project team measured the illumination levels
for the new LED system with all lights set for the
General, Energize and Calm modes. The results
are shown in Figure 15. The average illumination
levels in the General and Energize modes were
still slightly higher than IES recommendations but
much closer than the original fluorescent system.
Controller usage patterns
After providing the teachers with an overview of circadian lighting principles and showing them
how to use the lighting controls, the project team tracked their choices. Figure 16 shows the
results normalized for a four-week period. Before discussing the results, it is important to note
that the default for the lighting controls was the “General” setting. Key observations include the
following:
• The teacher in classroom F6 switched between "Calm" and "Energize" setting multiple
times per day. However, she used the "Calm" mode most of the time. This classroom is
used for teaching students with ASD.
• The teacher in classroom G1 frequently
used both the preset modes and the slider
controls. She mainly chose to use the
“General” mode but also used the
“Energize” and “A/V” modes. This
classroom is used for teaching students
with ASD.
• The teacher in classroom D2
experimented with the different control
modes but usually left the lights in the
“General” (default) mode except during
presentations. This classroom was used
for general education students.
Figure 15: illumination measurements the new
lighting system. All values are in foot-candles except
the max/min ratios w hich are unitless. Source: PNNL.
Figure 16: lighting control usage over a typical
four-w eek period.

Gold Ridge Elementary School Circadian Lighting Project page 16
Feedback from teachers
At the end of this project, the teachers were interviewed in person. The questions and their
responses are presented below.
Question 1: Did you regularly use the different “scene” button controls? If so, how did you use
them?
• Teacher #1 (teaches general education students in room D2)
o Mostly used “General” in the morning and would switch to “AV” or the “Screens”
setting during presentations.
o Used the “Energize”, “Calm” and “Screens” settings to get the students’ attention.
• Teacher #2 (teaches students with autism in room F6)
o Used the “Energize” and “Calm” buttons the most often.
o After a while, she realized the “Energize” setting was too bright and tried to stick
with the warmer settings for the rest of the project.
o Used the “Calm” setting for transitioning from outside into the classroom or
during reading time.
• Teacher #3 (teaches students with autism in room G1)
o Used the “General” setting the most often.
o Did not use the “Energize” setting very often because she felt it was too bright.
Note: based upon the monitoring data, she used the “Energize” mode frequently
at first but must have abruptly discontinued using it after that.
o Used the “AV” and “Screens” setting during presentations
• Overall the teachers said they enjoyed having the preset buttons (rated this feature at
10/10). They preferred the buttons in the back of the class rather than monitoring it
through an IPAD. The children were also trained on adjusting the controls as well.
Question #2: Did you regularly use the up and down slider-bars for dimming controls of the
downlights and whiteboard light?
• Teachers #1 & #2 said they rarely used them.
• Teacher #3 used the slider bars for dimming

Gold Ridge Elementary School Circadian Lighting Project page 17
Question #3: Did you regularly use the up and down slide-bar for color control?
• Teacher #1 (teaches general education students in room D2)
o Sometimes. The blue light seemed to stimulate the kids while the yellower light
quieted the kids down.
o Tried the different settings each week and had the kids take the survey. He
noticed he didn’t have to repeat himself on directions for activities.
o The yellower light seemed to help improve the kids’ attentiveness.
• Teacher #2 (teaches students with autism in room F6)
o Kept the room at the warmer settings after noticing the blue was too much for her
eyes as well as the kids.
• Teacher #3 (teaches students with autism in room G1)
o Used the slider bars for dimming but not for color adjustments.
Question #4: Overall, in what ways did the lighting system help you in your teaching and student
engagement? Similarly, in what ways did the lighting hinder you?
• All three teachers made the following comments:
o They enjoyed the colors, but especially liked the ability to dim the lights.
o The different color options changed the ‘mood’ of the classroom. For example, it
was great to press one button to calm the kids down after coming in from lunch
or recess.
o It was nice for them to be able to simply press one button and then get back to
teaching rather than having to make a lot of adjustments.
o It would be difficult for them to go back to “regular” lighting. Overall the new
lighting system improved their working environment as well as well-being of their
students.
Question #5: Do you have any ideas for improvements of the control interface or capabilities?
Likes/dislikes?
• A remote control for the lighting options would be nice

Gold Ridge Elementary School Circadian Lighting Project page 18
• They do not recommend using an I-Pad (or smart phone).
• They liked the location of the control pad (which was mounted at the front of the
classrooms near the projection screens / whiteboards.
• Said it was nice to use the lighting as a method of getting the students ’ attention. In the
past they used a bell or spoke very loudly. Changing the lighting color is much more
effective.
Student surveys
As mentioned earlier this research study was organized into three phases:
1. Baseline period (fluorescent lighting)
2. LED lighting in static mode
3. LED lighting in user-selectable circadian mode
During the Static LED and Circadian phases of this project, students were asked to complete
simple survey forms at the beginning (morning) and end of the school day (Figure 17). Some of
the surveys were completed in hard copy, but the majority of were completed electronically
through Google Forms. Students completed a total of 3,995 surveys:
• Morning survey: students completed 372 hardcopy surveys and 1,855 electronic surveys.
• End-of-day survey: students completed 353 hardcopy surveys and 1,415 electronic
surveys
The student surveys included questions such as “Did you sleep well last night?” with the option
to answer either “yes” or “no.” Another question, “How is my energy level?” had options to
answer either “low,” “medium,” or “high.” The survey responses were treated like categorical
data (e.g. a response of “medium” is not treated as representing a quantitative difference from
an answer of “low” or “high,” but simply being categorically between “low,” and “high.”)
Data are presented as the proportion of respondents that answered in a particular way. For
example, in response to the question “Did you sleep well last night?” 88.4% of the student
responses in the LED Static condition were “yes.” The survey data was analyzed by Folsom’s
Behavioral Specialist and the results were reviewed by the Project Team. Key findings for the
morning surveys include:
• A higher proportion of responses in the Circadian Lighting phase were “Yes” to the
question “Did you sleep well?” (93.85% verses 88.44%).

Gold Ridge Elementary School Circadian Lighting Project page 19
• The Circadian Lighting phase had a
higher proportion of Smiley and Sad face
responses to the question “How am I
feeling?” than the Static Lighting phase.
There was a smaller proportion of Neutral
face responses to the same question in
the Circadian Lighting phase compared to
the Static Lighting phase (Figure 18).
• In response to the question “How is my
energy level?” there was a higher
proportion of responses for the answers
“Low” and “Medium” in the Circadian
Lighting condition and a lower proportion
of responses to the answer “High” (Figure
19). The project team believes this may
have been linked to the use of the “Calm”
setting by some of the teachers.
Figure 17: students completed nearly 4,000
surveys during this study. These surveys
w ere completed at the start and end of the
school day. The form show n above w as
used for the morning surveys.
Figure 18: the Circadian Lighting phase had a higher proportion of Smiley and Sad face
responses to the question “How am I feeling?” than the Static Lighting phase, and a smaller
proportion of Neutral face responses.

Gold Ridge Elementary School Circadian Lighting Project page 20
The end-of-day surveys (Figure 20) included two additional, similar questions: “How was my on-
task behavior today?” and “How well did I follow classroom expectations today?” After analyzing
the data, the project team made the following observations:
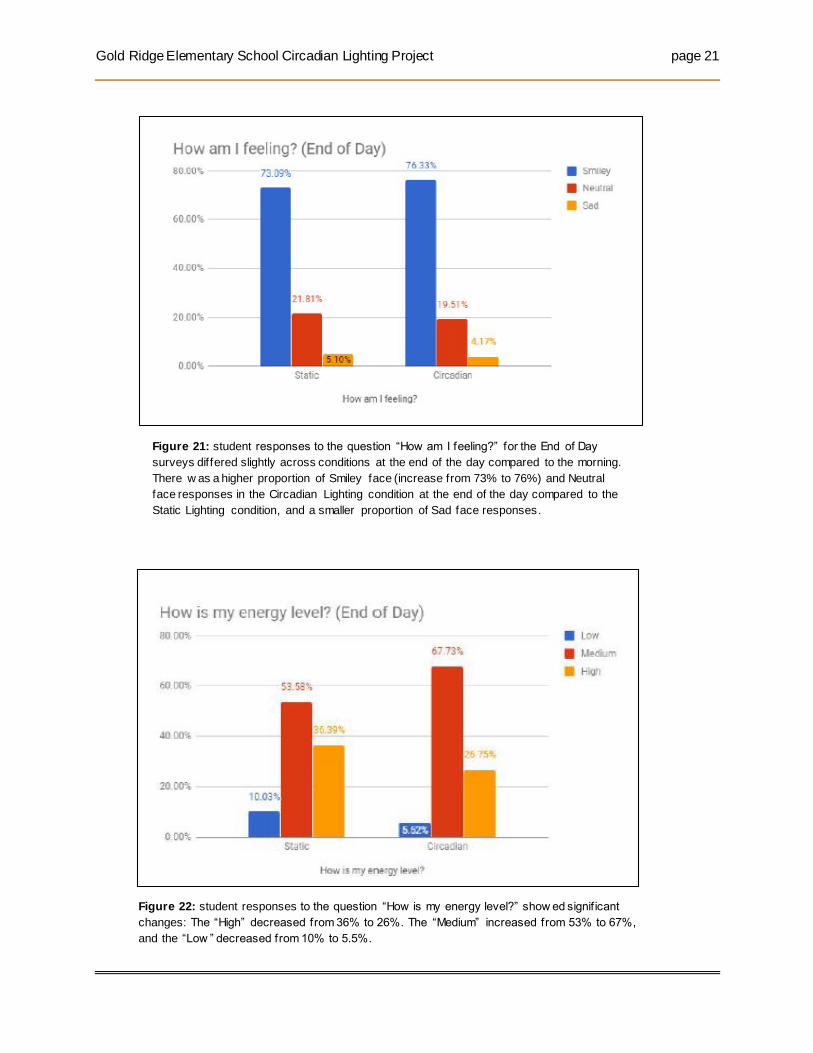
• Responses to the question “How am I
feeling?” differed slightly across conditions
at the end of the day compared to the
morning. There was a slightly higher
proportion of Smiley face (increase from
73% to 76%) and Neutral face responses
in the Circadian Lighting condition at the
end of the day compared to the Static
Lighting condition and a smaller proportion
of Sad face responses (Figure 21).
• Responses to the question “How is my
energy level?” (Figure 22) showed the
following changes:
o “High” decreased from 36% to 26%
o “Medium” increased from 53% to 67%
o “Low” decreased from 10% to 5.5%
Figure 19: student responses to the question “How is my energy level?” for the
morning surveys. Note that the number of respondents w ho said their energy levels
w ere “Low ” and “Medium” increased w hile the number w ho said their energy levels
w ere “High” decreased. The project team believes this may have been linked to the
use of the “Calm” setting by some of the teachers.
Figure 20: The form show n above w as used
for the surveys that w ere completed at the end
of the school day.
Gold Ridge Elementary School Circadian Lighting Project page 21
Figure 21: student responses to the question “How am I feeling?” for the End of Day
surveys differed slightly across conditions at the end of the day compared to the morning.
There w as a higher proportion of Smiley face (increase from 73% to 76%) and Neutral
face responses in the Circadian Lighting condition at the end of the day compared to the
Static Lighting condition, and a smaller proportion of Sad face responses.
Figure 22: student responses to the question “How is my energy level?” show ed signif icant
changes: The “High” decreased from 36% to 26%. The “Medium” increased from 53% to 67%,
and the “Low ” decreased from 10% to 5.5%.

Gold Ridge Elementary School Circadian Lighting Project page 22
• The last two questions in the end-of-day survey had very similar responses - the two
questions were probably too similar to each other: “How was my on-task behavior
today?” and “How well did I follow classroom expectations today?” However, the
similarities across these two questions illustrate that:
o These students overwhelmingly perceive their own behavior as being “Great.”
o There were indeed slight increases across lighting conditions to the proportion of
responses corresponding with higher levels of self-reported “Great” behavior
(Figure 23)
Figure 23: student responses to the question “How is my energy level?” show ed
signif icant changes: The “High” decreased from 36% to 26%. The “Medium”
increased from 53% to 67%, and the “Low ” decreased from 10% to 5.5%.

Gold Ridge Elementary School Circadian Lighting Project page 23
Survey conclusions
1. The circadian lighting may have had a positive effect on:
o Students’ self-reported on-task behavior
o Students’ self-reported sleep quality
o Students’ self-reported mood
2. The circadian lighting might have some effect on:
o Students’ self-reported sleep quality by day of the week
o A small portion of students may be ambiguously impacted by circadian lighting
(e.g. proportion of “Sad” responses to the “How am I feeling?” question in the
morning). Maybe students just need exposure to the circadian lighting throughout
the day to experience the effects - the proportion of “Sad” responses went down
from the static to circadian lighting conditions in the end-of-day survey
responses.
3. Based upon the responses that were given, the circadian lighting did not demonstrate
any negative effects.
Considerations and limitations:
• There are fewer data points for the static lighting condition than the circadian lighting
condition.
• None of the data has thus far been run for statistical significance - this is a plain
reporting of the “proportion of responses”.
• Students entered data anonymously, so morning to end-of-day effects couldn’t be
tracked by student.
• Many of the hard copy responses did not include a date. That data could not be coded
for lighting condition and largely went unused.
• The progression of the school year coincided with the lighting conditions progressing
from the static lighting to the circadian lighting condition. All of the effects observed could
simply be students becoming more familiar to the school, classroom routine, teacher and
peers, etc.
Gold Ridge Elementary School Circadian Lighting Project page 24
Suggestions for future studies:
• Survey a control class.
• Have a more robust mechanism for surveying teaching staff.
• Consider doing an A-B-A cycle of conditions through the year, and maybe a B-A-B cycle
of conditions for a different classroom for comparison. The way this study was
structured, all three classrooms went from static LED lighting (condition A) to circadian
lighting (condition B), so the study progressed from the A condition to the B condition for
all classrooms. A limitation of this approach is that it also coincides with the progression
of the school year, changes in weather and other conditions that occur throughout the
year.
• Track students anonymously through morning to end-of-day surveys to better explore
lighting effects across the school day.
3.2 Families
As mentioned previously, only two families chose to participate in the home portion of this study.
At the end of Phase 2, the project team conducted lighting audits and provided
recommendations for the new tunable lighting system. After the systems were installed and
commissioned, the parents completed an initial questionnaire followed by 14 weekly surveys.
These surveys occurred during Phase 3 of the project. At the end of Phase 3, the project team
conducted on-site interviews with the parents. Copies of the initial questionnaire, the weekly
survey questions, and the final interview quesitons may be found in the appendix section of this
report.
Results for Family #1:
• The child who lives in this home is an 11 year-old boy who would be classified
somewhere between low and moderately functioning on the Autism Spectrum Disorder .
• The results for the weekly surveys did not indicate any changes in sleep patterns that
could be attributed to the lighting system. This makes sense since this young man did
not have any issues with sleeping before the study began.
• The mother told us that she and her son used to argue daily about the kitchen lights.
Apparently her son thought the lights were too bright and kept switching them off. Since
the original lights could not be dimmed and she needed them on in order to cook dinner,
their son started to isolate himself. After the tunable lights were installed, they were able
to agree upon a certain light level. The son now spends much more time with the family.
Understandiblly, the mother is elated about this development. Furthermore, the behavior
specialists said this very important since isolation is not heathly, and once it has become
a pattern, is a very hard habit to break.

Gold Ridge Elementary School Circadian Lighting Project page 25
• The mother uses the color tuning features of the new lights as a visual cue for different
activiies. For example, when it is time for her children to do homework (in the afternoon),
she switches to color temperature to “cool” (~5000K). When they are done with the ir
homework, she switches the color temperature back to “warm” (~2700K). She said that
the lights really help her boys focus on getting their homework done.
• The family uses wireless occupancy sensors to control the lights in the hallways and
bathrooms. The lights are programmed to come on at very low levels and warm color
temperatures at night.
• During our final interview, the mother offered the following comments:
o “Overall better lighting quality – we are sleeping better through the night, less
waking up at night.”
o “Our preferred method for programming the lights is the phone app. We tried
using a computer but it didn’t work well. It was not finding the lights so we had to
enter the serial numbers. The app was much easier to use.”
o “As far as operating the lights, we like to use the phone app and Google
Assistant. Our older son connected the lights to his video games for effect .”
o “We love the occupancy sensors!”
o “The main barriers for others adopting this technology are cost and having to
leave the old light switches turned on all of the time. We had to buy switch
covers to prevent our kids from turning them off.”
o “We would recommend this system to others. It is very easy to use.
Results for Family #2:
• The child who lives in this home is a 10 year-old boy who has been diagnosed with
Autism Spectrum Disorder (moderate to severe). His parents indicated that he had
trouble falling asleep, but once he did, he did not typically wake up during the middle of
the night.
• The weekly surveys indicated a dramatic change in sleep patterns—specifically for the
amount of time it took for the young man to fall asleep after being put to bed—from 30
minutes to 5 minutes over a 14 week period (Figure 24). At first, his mother would go in
and check on him since he was so quiet—wondering if he had gotten up and went
somewhere else, but he was asleep.

Gold Ridge Elementary School Circadian Lighting Project page 26
• The mother said that her son’s behavior remained fairly constant during the study with
one exception: before the new lights were installed, he used to run upstairs in the dark
(which made her nervous). Now her son waits for his parents to turn the upstairs lights
on (via the phone app). The lights provide a visual cue to their son that it is time to go
upstairs.
• During our final interview, the mother offered the following comments:
o “The lights keep my son more centered and definitely help him fall asleep much
faster.”
o “We don’t consider ourselves technical but had no problem using the phone to
program and operate the lihgts. We use the phone 90% of the time since it has
all the features.”
o “We prefer using the phone app to program and operate the lights because it
puts us in control. If we had a remote, my son would try to change the settings”
o “The main barriers to other parents adopting this technology are cost, lack of
awareness and the complexity of the technologies that are out there.”
o “The Philips Hue app was easy to use, no big deal to learn.”
o “I would recommend using this system to anyone.”
Figure 24: after the tunable lighting w as installed in this home, the time required
for this young man to fall asleep after being put to bed w as dramatically reduced.
Note that no data w as available for w eek 6.

Gold Ridge Elementary School Circadian Lighting Project page 27
3.3 Observations and Lessons Learned
This project provided valuable insights regarding using tunable-white LED lighting in classrooms
and homes of students with ASD. Key observations:
• The feedback from the teachers regarding the new lighting system was overwhelmingly
positive. All of them said the new system helped them teach more effectively. They loved
the presets (e.g. Calm”) that were easily accessed via the keypad. Surprisingly, none of
them wanted to use an I-Pad or smartphone to control the lights.
• The student surveys indicated slightly positive results with no negat ive impacts.
• The LED lighting system reduced the electric demand by 60-74%. However, the overall
energy savings were adversely impacted by standby losses from the DMX controls. The
standby losses comprised 40% of the total energy consumption of the new system.
In terms of percentage of load, these losses are disproportionally high, because the
classroom lighting is only used around 1,500 hours per year, whereas the standby
losses occur the remaining 7,260 hours per year. Customers who intend to use this
system for future projects should work with the manufacturer to reduce or eliminate
these losses.
• Training the teachers is the key to successful engagement. During a previous study
conducted by the DOE4, the teachers did not actively use the lighting controls on a
regular basis. During this project, two out of three teachers in this project actively used
the controls because they were provided with an overview of circadian lighting principles
and shown how to use the controls.
• The costs of the classroom lighting system were relatively high due to prevailing wages
and the wiring of the original lighting system. The tunable-white feature and controls
added 36% to the overall cost.
• Recruitment efforts for parents did not work very well. The project team believes that the
parents did not believe the potential benefits were worth the effort to change. Working
with agencies that provide support to children with ASD would likely have increased the
credibility of this project and produced better results.
• The biggest impact from this project came from working with the families in the students’
homes. Both families reported very positive results and strongly recommended using
tunable-white lighting systems to other parents who have children suffering from ASD.
4 For more information, please visit:
https://w ww.energy.gov/sites/prod/f iles/2017/10/f37/2017_gatew ay_tuning-classroom_0.pdf

Gold Ridge Elementary School Circadian Lighting Project page 28
4. Recommendations & Next Steps
• Based upon the feedback from the teachers and the positive student survey results,
school districts should install LED lighting systems that are dimmable and include
lighting control scenes such as “General” and “AV” mode.
• Schools districts should consider installing tunable-white LED systems for new
classrooms—especially classrooms that will be used during the evening hours or for
teaching students with ASD. Hopefully the cost of tunable-white LED lighting systems
will become lower in the future.
• Based upon the dramatic improvements experienced by the two families who
participated in this project, more research should be done in the homes for students with
ASD.
SMUD’s next project (2019) will include partnering with non-profit organizations that
provide support to families who have children with ASD. The new project will include
providing circadian lighting systems for 30 families within our service territory. The 2019
study will focus on identifying changes in sleep and behavioral patterns.

Gold Ridge Elementary School Circadian Lighting Project page 29
Appendices
Appendix A – Morning Student Survey

Gold Ridge Elementary School Circadian Lighting Project page 30
Appendix B – End of Day Student Survey

Gold Ridge Elementary School Circadian Lighting Project page 31
Appendix C – Parent Questionnaire

Gold Ridge Elementary School Circadian Lighting Project page 32

Gold Ridge Elementary School Circadian Lighting Project page 33

Gold Ridge Elementary School Circadian Lighting Project page 34
Appendix D – Weekly Parent Survey Questions

Gold Ridge Elementary School Circadian Lighting Project page 35
Appendix E – Parent Interview Questions

Gold Ridge Elementary School Circadian Lighting Project page 36
Appendix F – Monitoring Equipment
Cadmus monitored the classroom lighting energy consumption using current transducers,
Wattnode energy meters, pulse adapters, and Hobo RX3000 loggers. The RX3000s
provided a cellular connection so all data points were visible from the online portal at
Hobolink.com. A summary of installed power metering devices is provided below.
Device Description Location (Panel), Service Quantity
Magnelab Current Transformers
Panel HD, Classroom D2 Lighting Panel HF, Classroom F6 Lighting Panel HG, Classroom G1 Lighting
1 1 1
Continental Control Systems WattNode AC Energy Meters Onset S-UCC-M006 Electronic Switch Pulse Input Adapters
Panel HD, Classroom D2 Lighting Panel HF, Classroom F6 Lighting Panel HG, Classroom G1 Lighting
1 1 1
Hobo RX3000 Remote Monitoring Station Data Loggers
Panel HD, Classroom D2 Lighting Panel HF, Classroom F6 Lighting Panel HG, Classroom G1 Lighting
1 1 1

Gold Ridge Elementary School Circadian Lighting Project page 37
We monitored the pre-installation classroom light switch usage with on/off loggers and
the post-installation keypad controller usage with custom Finelite data logging equipment.
A summary of this equipment is provided in the table below.
Device Description Service Quantity
Onset On/Off Data Loggers
Classroom D2 Lighting Classroom F6 Lighting Classroom G1 Lighting
2 2 3
Finelite Custom ‘FineTune’ Control Loggers
Classroom D2 Lighting Classroom F6 Lighting Classroom G1 Lighting
1 1 1