Gold quest corporate-presentation-september 2016
26
www.goldquestcorp.com September 2016
-
Upload
goldquest-mining-corp -
Category
Investor Relations
-
view
27 -
download
0
Transcript of Gold quest corporate-presentation-september 2016

www.goldquestcorp.comSeptember 2016
www.goldquestcorp.com
Statements contained in this presentation that are not historical facts are forward-looking information that involves known and unknown risks and uncertainties. Forward-
looking statements in this presentation include, but are not limited to, statements with respect to the pre-feasibility study for the Romero Project (the “PFS”), the results of the
PFS, including the mine plan, the production schedule, infrastructure, capital and operating costs and financial analysis, opportunities to enhance the project economics, the
advancement of Romero, the potential of the remaining resources and surrounding area, opportunities for growth beyond the mine plan, plans for Romero South, interpretation
of the results of the PFS, the merits of the Company's mineral properties, mineral reserve and resource estimates, the Dominican Republic and the Company's plans,
exploration programs and studies for its mineral properties, including the timing of such plans, programs and studies. In certain cases, forward-looking statements can be
identified by the use of words such as "plans", “proposed”, "has proven", "expects" or "does not expect", "is expected", “upside”, "potential", "appears", "budget", "scheduled",
"estimates", "forecasts", “goal”, "at least", "intends", "anticipates" or "does not anticipate", or "believes", or variations of such words and phrases or state that certain actions,
events or results "may", "could", "would", "should", "might" or "will be taken", "occur" or "be achieved".
Forward-looking statements involve known and unknown risks, uncertainties and other factors which may cause the actual results, performance or achievements of the
Company to be materially different from any future results, performance or achievements expressed or implied by the forward-looking statements. Such risks and other factors
include, among others, the assumptions and risks associated with the results of the PFS; commodity prices; changes in general economic conditions; market sentiment;
currency exchange rates; the Company's ability to continue as a going concern; the Company's ability to raise funds through equity financings; risks inherent in mineral
exploration; risks related to operations in foreign countries; future prices of metals; failure of equipment or processes to operate as anticipated; accidents, labor disputes and
other risks of the mining industry; delays in obtaining governmental approvals; government regulation of mining operations; environmental risks; title disputes or claims;
limitations on insurance coverage and the timing and possible outcome of litigation. Although the Company has attempted to identify important factors that could affect the
Company and may cause actual actions, events or results to differ materially from those described in forward-looking statements, there may be other factors that cause
actions, events or results not to be as anticipated, estimated or intended. There can be no assurance that forward-looking statements will prove to be accurate, as actual
results and future events could differ materially from those anticipated in such statements. Accordingly, do not place undue reliance on forward-looking statements. All
statements are made as of the date of this presentation and the Company is under no obligation to update or alter any forward-looking statements.
Forward-looking statements are based on assumptions that the Company believes to be reasonable, including expectations regarding mineral exploration and development
costs; expected trends in mineral prices and currency exchange rates; the accuracy of the Company's current mineral resource estimates; that the Company's activities will be
in accordance with the Company's public statements and stated goals; that there will be no material adverse change affecting the Company or its properties; that all required
approvals will be obtained and that there will be no significant disruptions affecting the Company or its properties.
Certain technical information in this presentation was taken from the press released dated September 27, 2016 announcing the results of the Romero Project PFS.
The technical information in this presentation related to the PFS is based on information prepared by Mr. Makarenko, P.Eng. and Ms. McLeod, P.Eng. of JDS Energy & Mining
Inc. (“JDS”), who are each a Qualified Person and independent of the Company as defined by NI 43-101.
Jeremy K. Niemi, P.Geo., VP Exploration of the Company, is the Qualified Person who supervised the preparation of the technical information related to exploration in this
presentation.
Please refer to the Company's most recent Management's Discussion & Analysis (available at www.sedar.com) for further information regarding the Company and its mineral
properties.
All values are in U.S. Dollars unless otherwise stated.

A Growth Company
www.goldquestcorp.com
Exploring The Tireo Formation surrounding our discovery
Over 50 km in length- substantially under-explored
Multiple targets developed 2014-2016
10,000 meter drill program began in August 2016
Careful With Funds Over C$9 million in cash, post recent financings,
sufficient to comfortably continue BOTH development
and exploration
Accelerating Newsflow Feasibility studies, permitting and exploration results
The Romero Gold/Copper mine, Dominican Republic
GQC discovered the multi-million ounce gold deposit in
2012
Pre-feasibility study (PFS) released Sept.27th, 2016 @
28% IRR and $595/oz All in Sustaining Costs (AISC)
Permitting in progress
Developing

The Dominican Republic4
www.goldquestcorp.com
Canada
USA
Romero Project
Santo Domingo
San Juan
Puerto Plata
Falcondo
Mine
Pueblo Viejo Mine
Cerro de Maimon Mine
Tireo
Concessions
• No Government Royalties
• Reasonable Taxes (32%)
• One of the fastest growing
economies in the Americas
(World Bank)
Dominican
Republic
source www.barrack.com
source www.periyla.com/au

Proven Track Record of Mine Building in the Dominican Republic
Bill Fisher
Executive
Chairman
• P.Geo
• Former CEO
GlobeStar
• Chairman of
Aurelian
• VP Exploration
of Boliden ltd.
• Former
Construction
Manager for
GlobeStar’s
Cerro de
Maimon
Paul Robertson
CFO
JP Le Blanc
Engineering
Manager
5
www.goldquestcorp.com
Fisher and Espaillat were instrumental in the
development of GlobeStar’s Cerro de Maimon
copper/gold mine in 2008 in the Dominican Republic
Acquired for $350,000 in 2001…
… sold for $186,000,000 in 2008
(Aurelian Resources $0.15 to $40.0 in two years)
• Geologist and
Mining Engineer
• Former Country
Manager
GlobeStar
• Native to
Dominican
Republic
• CPA, CA
• Former CFO
Grayd
Resources
(acquired by
Agnico)
Jeremy Niemi
VP, Exploration
• P.Geo
• Former VP
Exploration
Noront
• Former Kinross
Julio Espaillat
CEO
6
www.goldquestcorp.com
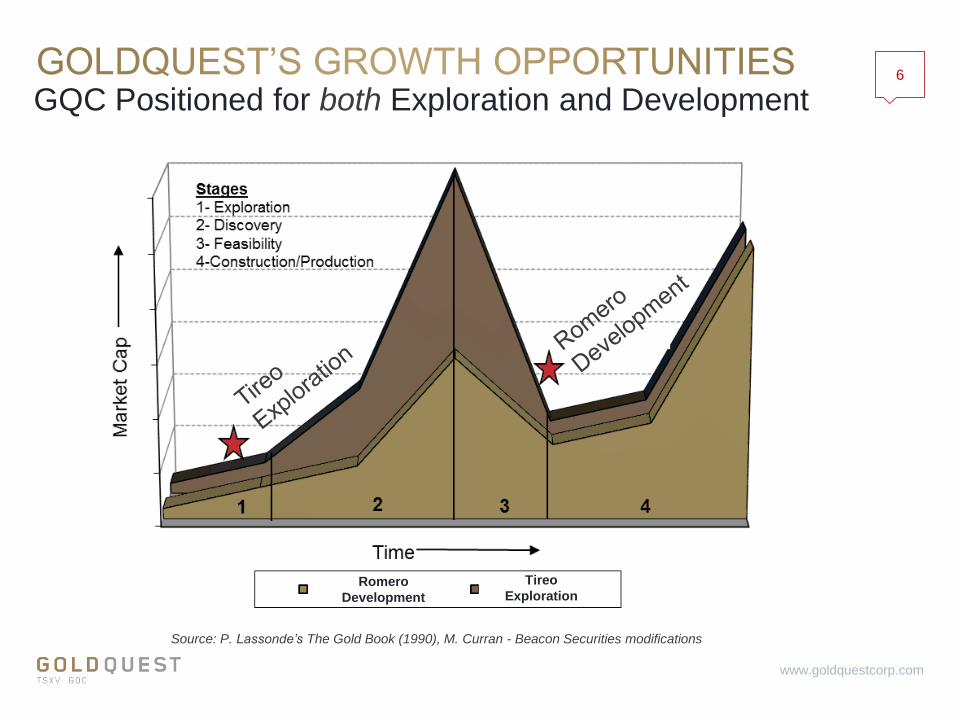
Source: P. Lassonde’s The Gold Book (1990), M. Curran - Beacon Securities modifications
GQC Positioned for both Exploration and Development
Romero
Development
Tireo
Exploration

2016 Prefeasibility Study Highlights7
www.goldquestcorp.com
* Net Present Value (“NPV”), Internal Rate of Return (“IRR”), All-In Sustaining Costs (“AISC”)
** Gold Equivalent (“AuEq.”) ounces are calculated as follows: Au oz. payable + ((Cu lbs. payable * $2.50/lb.) + (Ag oz. payable * $20/oz.))/$1,300 oz.)
$203M
NPV*5% IRR*
28%AFTER TAX
PAYBACK
2.5YRS
AISC*
$595/OZ.AuEq.**
Pre-Feasibility Study September 2016
LTP-94
158.6m to 160.0m
288.6 g/t Gold 5.6%
Copper
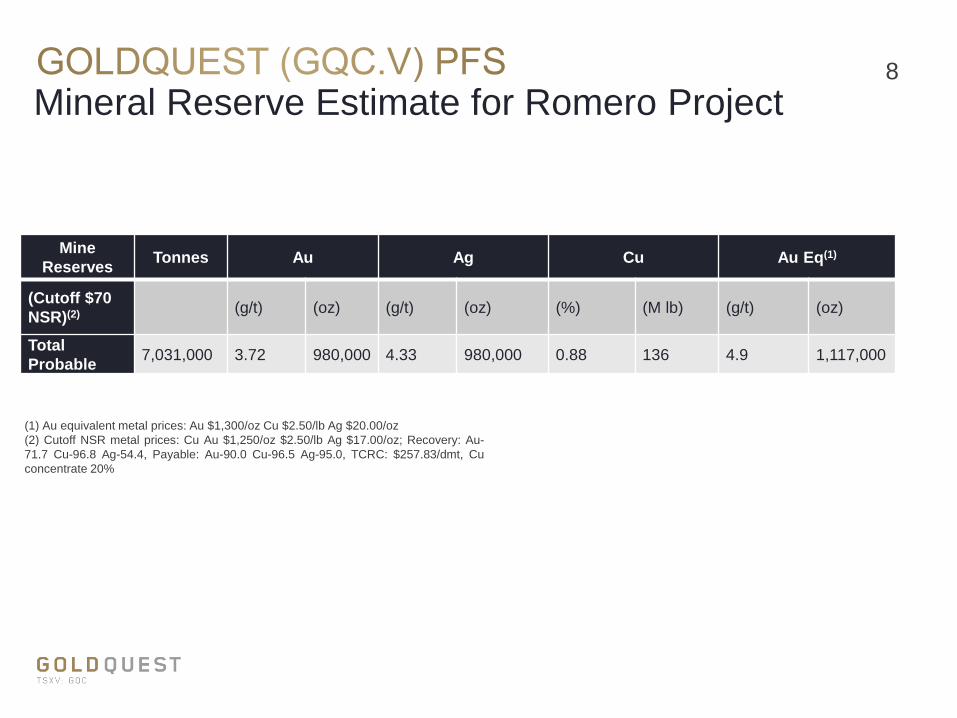
Mineral Reserve Estimate for Romero Project8
Mine
ReservesTonnes Au Ag Cu Au Eq(1)
(Cutoff $70
NSR)(2) (g/t) (oz) (g/t) (oz) (%) (M lb) (g/t) (oz)
Total
Probable 7,031,000 3.72 980,000 4.33 980,000 0.88 136 4.9 1,117,000
(1) Au equivalent metal prices: Au $1,300/oz Cu $2.50/lb Ag $20.00/oz
(2) Cutoff NSR metal prices: Cu Au $1,250/oz $2.50/lb Ag $17.00/oz; Recovery: Au-
71.7 Cu-96.8 Ag-54.4, Payable: Au-90.0 Cu-96.5 Ag-95.0, TCRC: $257.83/dmt, Cu
concentrate 20%
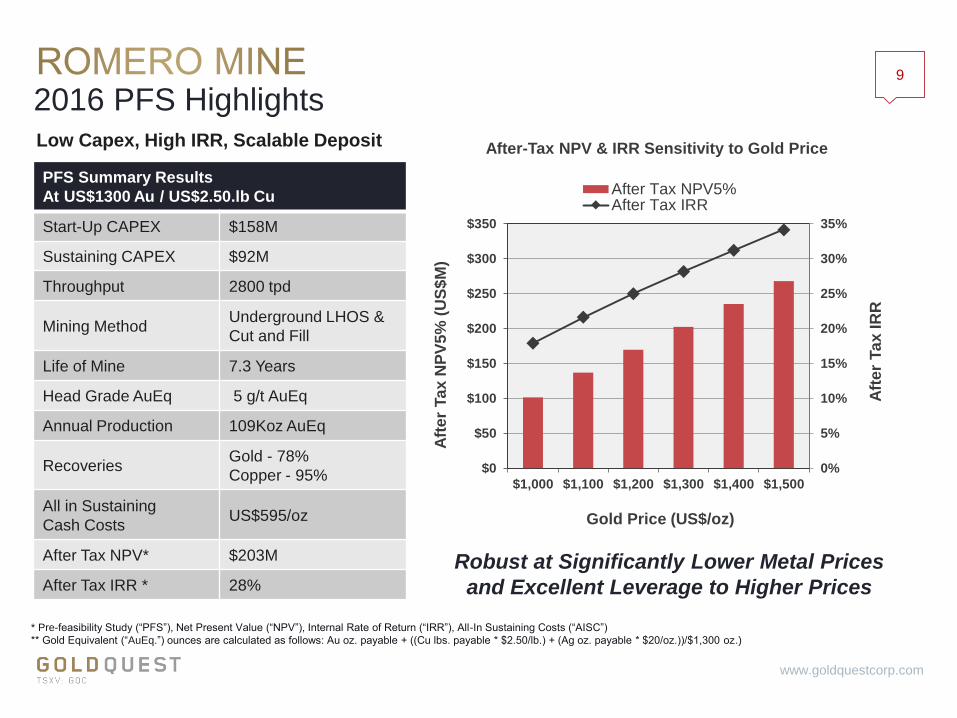
2016 PFS Highlights9
www.goldquestcorp.com
PFS Summary Results
At US$1300 Au / US$2.50.lb Cu
Start-Up CAPEX $158M
Sustaining CAPEX $92M
Throughput 2800 tpd
Mining MethodUnderground LHOS &
Cut and Fill
Life of Mine 7.3 Years
Head Grade AuEq 5 g/t AuEq
Annual Production 109Koz AuEq
RecoveriesGold - 78%
Copper - 95%
All in Sustaining
Cash CostsUS$595/oz
After Tax NPV* $203M
After Tax IRR * 28%
Robust at Significantly Lower Metal Prices
and Excellent Leverage to Higher Prices
Low Capex, High IRR, Scalable Deposit
* Pre-feasibility Study (“PFS”), Net Present Value (“NPV”), Internal Rate of Return (“IRR”), All-In Sustaining Costs (“AISC”)
** Gold Equivalent (“AuEq.”) ounces are calculated as follows: Au oz. payable + ((Cu lbs. payable * $2.50/lb.) + (Ag oz. payable * $20/oz.))/$1,300 oz.)
0%
5%
10%
15%
20%
25%
30%
35%
$0
$50
$100
$150
$200
$250
$300
$350
$1,000 $1,100 $1,200 $1,300 $1,400 $1,500
Aft
er
Ta
x IR
R
Aft
er
Ta
x N
PV
5%
(U
S$
M)
Gold Price (US$/oz)
After-Tax NPV & IRR Sensitivity to Gold Price
After Tax NPV5%After Tax IRR

Gold-Copper Starter Mine10
www.goldquestcorp.com
Surface Portal
Access RampVentilation
Production
Ramp
Remaining
Mineral Resources
2800 tpd – 75% Longhole
Large Stopes (up to 20m
x 20m x 50m)
Options to expand mine
as metal prices rise
View Looking North

0
20
40
60
80
100
120
140
160
180
1 2 3 4 5 6 7 8
Go
ld E
qu
iva
len
t O
un
ce
s
Year
Gold Equivalent Ounces Payable
The ‘Au/Cu Concentrate’ Mine11
www.goldquestcorp.com
$203M
NPV5% IRRAFTER TAX
28%
PAYBACK
2.5YEARS
AISC$595/OZ.
AuEq.
GOAL: maintain or exceed 150,000 oz per year
Conversion of
Resources
* GQC’s product is a copper concentrate containing precious metals. Accordingly, the Company
reports in gold equivalent terms because by revenue the precious metals represent 74%.
119,300
153,600
136,800 135,600
124,800
109,500
83,600
11,300
Copper Sales (as Gold Eq.)
Gold Sales
Silver Sales (as Gold Eq.)
(Remaining Resource = Potential)

AISC*$595/OZ.
AuEq.All in Sustaining Costs (AISC)12
www.goldquestcorp.com
NPV6%
$203M
PAYBACK
2.5YEARS
IRRAFTER
TAXES
28%
$0
$200
$400
$600
$800
$1,000
$1,200
$1,400
1
Go
ld P
ric
e
Gross
Margin
$705
AISC*
$595per oz.
AuEq.
LOM($/tonne)
LOM
($/oz.)
Mining $27.7 $222.4
Processing $11.6 $93.1
Tailings Management $1.3 $10.3
G & A (Site) $5.4 $43.8
Total Cash Costs $46.0 $369.6
Transportation &
Refining$13 $104.7
Royalties $1.9 $14.9
Sustaining & Closure $13.1 $105.5
All-in Sustaining
Cost*$74 $594.7
* All-in Sustaining Costs (“AISC”) are presented less Corporate G&A
Note: Gold Equivalent (“AuEq.”) ounces are calculated as follows: Au oz. payable + ((Cu lbs. payable * $2.50/lb.) + (Ag oz. payable * $20/oz.))/$1,300 oz.)

The 100% Owned, 50 km Long Tireo Belt13
www.goldquestcorp.com
Romero Project
Romero Mineral Reserves Gold
Equivalent*
1.12 Million oz Probable
*Gold Equivalent (“AuEq.”) ounces are calculated as follows: Au oz. payable + ((Cu lbs. payable * $2.90/lb.) + (Ag oz. payable * $17/oz.))/$1,225 oz.)
Exploration Applications &
Concessions
Mining Application
10 Km
N
The Tireo Formation
• 50 km-100% owned by GQC
• Surrounds Romero Deposit
• Superior potential recognized upon
Romero discovery (2012)
Belt-wide exploration
• Airborne Geophysics
• Ground Geophysics
• Geological and Alteration Mapping
• Surface Sampling
• Drilling

Seeking Gold & Copper14
www.goldquestcorp.com
2016 IP &
Drilling Program
Romero
Romero South
North
Drill Area 1
Drill Area 2
IP Chargeability (mV/V)
15 k
mRomero
Project
2016 IP
& Drilling
Program
40 hole (10,000m) drill program
underway- assays in due course
N2014-2016 Exploration Program
• Generated multiple targets
• Same geology as Romero
• Encouraging hydrothermal alteration
• Same geophysical signature (Induced
Polarization, “IP”) as Romero
• Strong gold mineralization at surface
(up to 167.5 g/t)

Significant Exploration Potential15
Romero-style deposits often occur in clusters along
geological plate boundaries
Program focuses on never-been-drilled targets
Ongoing news flow for at least 6 months
A A’N
40 m
1.4
g/t G
old
18 m
of 4.5
g/t G
old
80m
of 0.5
g/t G
old
>225 m
pyr
ite
Inc. 2.4
m 6
.7 g
/t G
old
26 m
11.4
g/t G
old
234 m
7.9
g/t G
old
Romero Holes
1,2 & 3
Romero
ProjectA
A’
N
Initial drill targets
Gold intersections
>3 gram*metres
Current IP Targets
(ongoing survey)

Sulphide mineralization has a strong IP signature
Outstanding potential untested surrounding Romero
16
www.goldquestcorp.com
A’’
A
Surface
Hydrothermal
Alteration
Section Width: 50 m
20
0 m
200
m
Romero
A
A’
A’’
PLAN VIEWRomero
IP Footprint
1 km
Romero
Resource
Outline
A
’
IP Chargeability (Discrete Inversion)
Mineral
Growth
Potential
Rom
ero
Dis
co
ve
ry I
P C
ross-
Se
ctio
n
N
Mineral
Growth
Potential
IP Geophysics and Alteration Vectors

Romero
A
Drill Hole 1B’
B
200 m A
’
Romero Discovery
IP Cross-Section
DDH-1
IP Cross Section
Drilling Romero-like Targets17
www.goldquestcorp.com
A
A’
A’’ B B’ DDH 1
PLAN VIEWDrill Hole 1
IP Footprint
1 km
Surface
Hydrothermal
Alteration
Section Width: 50 m
Romero
Resource
Outline
IP Chargeability (Discrete Inversion)

Drilling Romero-like Targets18
www.goldquestcorp.com
Surface
Hydrothermal
Alteration
Section Width: 50 m
Romero
Resource
Outline
IP Chargeability (Discrete Inversion)
C’CDDH 2 & 3
C’
C
A
Drill Holes
2 & 3
200 m A’
Romero Discovery
IP Cross-Section
DDH-2
DDH-3
IP Cross Section
Romero
PLAN VIEWDrill Holes 2 & 3
IP Footprint
1 km

D
D’Drill Hole
Drilling Romero-like Targets19
www.goldquestcorp.com
Surface
Hydrothermal
Alteration
Section Width: 50 m
Romero
Resource
Outline
IP Chargeability (Discrete Inversion) Romero
A200 m A’
Romero Discovery
IP Cross-Section
DDH
IP Cross Section
PLAN VIEWDrill Hole
IP Footprint
1 km
D D’
Many more targets programed….

Exceptional Growth Potential
Well Understood Development Process
We’ve done it before - We’re doing it again
Exploration & Development Programs Delivering Newsflow20
www.goldquestcorp.com
2016 2017 2018
Q3 Q4 Q1 Q2 Q3 Q4 Q1 Q2
Exploration
IP Program
Tireo Drilling
(Phase 1)
Romero
Brownfields
Pre-Feasibility
Planned
Feasibility
Permitting
Studies
- Mine Permit
Application
- Environmental
Prep Period
Potential
Construction

One of few recent significant discoveries globally
Continuing to de-risk our high return project
PFS Release Sept. 27th, 2016 @ 28% IRR and
$595/oz AISC
Permitting underway
Developing
Summary
www.goldquestcorp.com
Careful with Funds
c. C$ 9 million in treasury
Sufficient funds beyond PFS and exploration
program
Exploring
10,000 m. drill program in progress testing new
targets in our 100% owned, 50 km Tireo Belt
Accelerating Newsflow
Feasibility studies, permitting, exploration results

Snapshot of GQC22
www.goldquestcorp.com
GoldQuest Symbol: GQC
Listed Exchange TSX-V
Market Capitalization ~C$100M
Shares Outstanding
Basic215,732,384
Shares Outstanding
Fully Diluted248,755,725
Cash C$9.6M*
Debt $0M
52 Week Trading Range C$0.09 - $0.68
Share Price range for
Sept. 1st-26th 2016
C$0.43–$0.53
/share
“…among the most compelling undeveloped projects globally”
Clarus Securities Inc. May 2016
“GoldQuest ranks among our favourite developers at a time when majors
face a ~28% production decline by 2018” (Cormark Securities, Apr 2016)
Firm Analyst Target Price
Beacon
SecuritiesMichael Curran C$1.20
Cormark
Securities
Tyron
BreytenbachC$0.80
Clarus
SecuritiesJamie Spratt C$0.60
M
Partners
Andrew
MikitchookC$0.55
*cash (actual) as of June 30th, 2016
0.0
0.5
1.0
1.5
2.0
2.5
3.0
3.5
4.0
4.5
$0.00
$0.10
$0.20
$0.30
$0.40
$0.50
$0.60
$0.70
15
-03-2
0
15
-04-2
0
15
-05-2
0
15
-06-2
0
15
-07-2
0
15
-08-2
0
15
-09-2
0
15
-10-2
0
15
-11-2
0
15
-12-2
0
16
-01-2
0
16
-02-2
0
16
-03-2
0
16
-04-2
0
16
-05-2
0
16
-06-2
0
16
-07-2
0
16
-08-2
0
16
-09-2
0
Vo
lum
e (
M)
Sh
are
Pri
ce (
C$)
Volume (M) Share Price
June 9, 2016:
Close $5.75M
Bought Deal
At $0.32/share
Apr 1st, 2016:
Close $3.0M
Prv Plcmnt
At $0.20/share
Nov 6, 2015
Close $3.5M Prv
Plcmnt
At $0.11/share
Apr 29, 2015:
Optimized PEA
Results

23
www.goldquestcorp.com
COMPELLING
ECONOMICS
ROMERO:
Fully Scalable
CLEAR
DEVELOPMENT
PATH
SIGNIFICANT
EXPLORATION
UPSIDE
An Emerging Developer with Exploration upside

Management
Julio Espaillat CEO
Paul Robertson CFO
Jeremy Niemi VP Exploration
JP Le Blanc Consulting Engineer
Directors
Bill Fisher Executive Chairman
Julio Espaillat
Florian Siegfried
Patrick Michaels
Frank Balint
Contact Info:
Bill Fisher
1 (416) 583-5797
Katherine Fedorowicz
1 (877) 919-5979

Mineral Resource Estimate for Romero Project25
(1) Effective data for the Mineral Resource is September 27, 2016
(2) Mineral Resources which are not mineral reserves do not have demonstrated
economic viability. The estimate of Mineral Resources may be materially affected by
environmental, permitting, legal, title, taxation, sociopolitical, marketing or other
relevant issues.
(3) The quantity and grade of reported Inferred Resources in the estimation are
uncertain in nature and there has been insufficient exploration to define these Inferred
Resources as an Indicated or Measured Mineral Resource and it is uncertain if further
exploration will result in upgrading them to an Indicated or Measured Mineral Resource
category.
(4) Gold Equivalent Metal prices used were $1,400/oz Au, $20.00/oz Ag and $2.50/lb
Cu and recoveries of 78.1% for gold, 94.6% for copper and 58.6% for silver.
(5) Columns may not calculate precisely due to rounding errors.
Category Zone Tonnes Au (g/t) Cu (%) Zn (%)Ag
(g/t)
AuEq
(g/t)Au Ounces AuEq Ounces
Indicated Romero 18,390,000 2.57 0.65 0.31 4.2 3.43 1,520,000 2,028,000
Romero
South 1,840,000 3.69 0.25 0.18 1.6 4.01 218,000 237,000
Total Indicated
Mineral Resources20,230,000 2.67 0.61 0.30 4.0 3.48 1,738,000 2,265,000
Inferred Romero 2,120,000 1.80 0.39 0.36 3.2 2.32 123,000 158,000
Romero
South 900,000 2.57 0.20 0.21 2.1 2.84 74,000 82,000
Total Inferred Mineral
Resources3,020,000 2.03 0.33 0.32 2.9 2.47 197,000 240,000
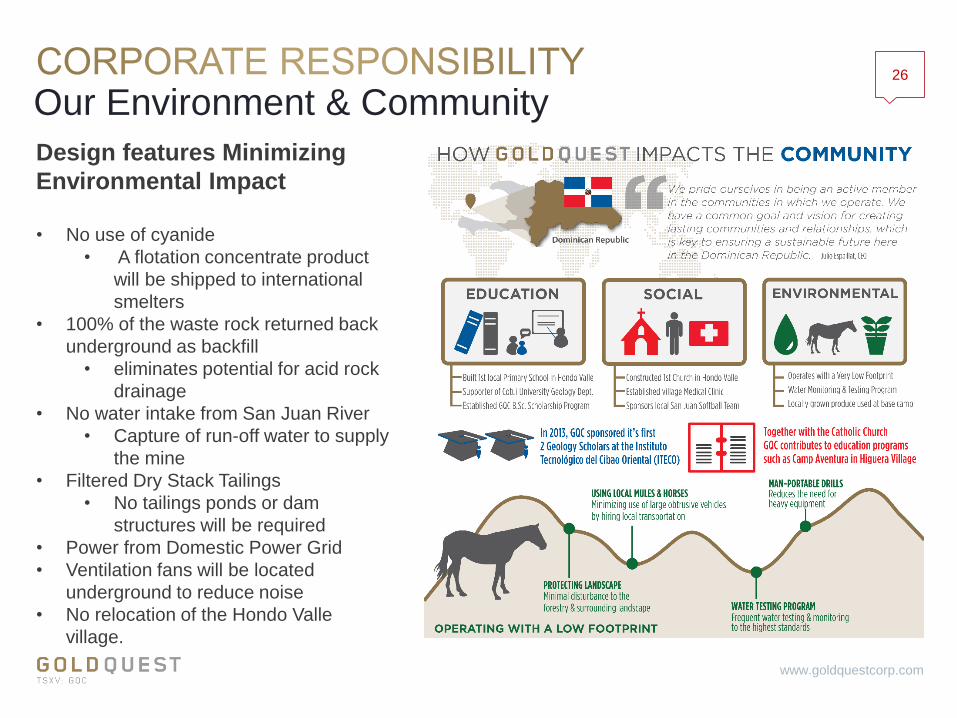
Our Environment & Community26
www.goldquestcorp.com
• No use of cyanide
• A flotation concentrate product
will be shipped to international
smelters
• 100% of the waste rock returned back
underground as backfill
• eliminates potential for acid rock
drainage
• No water intake from San Juan River
• Capture of run-off water to supply
the mine
• Filtered Dry Stack Tailings
• No tailings ponds or dam
structures will be required
• Power from Domestic Power Grid
• Ventilation fans will be located
underground to reduce noise
• No relocation of the Hondo Valle
village.
Design features Minimizing
Environmental Impact


![YNC Action Awards Quest Bronze Silver Gold [draft]](https://static.fdocuments.in/doc/165x107/568ca5e11a28ab186d8ee803/ync-action-awards-quest-bronze-silver-gold-draft.jpg)