GOL Intelligent Airlines
25
GOL Intelligent Airlines September 2019
Transcript of GOL Intelligent Airlines
GOL Intelligent AirlinesSeptember 2019

2
Disclaimer
Source: Appraiser blue books as of July 30, 2019
This presentation has been prepared by GOL Linhas Aéreas Inteligentes S.A. (together with its subsidiaries, “GOL” or the “Company”).
Statements in this presentation that are not historical facts are forward-looking statements and involve risks and uncertainties, including those described in the Company’s
public filings with the U.S. Securities and Exchange Commission. The Company has based forward-looking statements on management’s current expectations and assumptions.
These forward-looking statements involve a number of risks and uncertainties. Among the important factors that could cause actual results to differ materially from those
indicated in such forward-looking statements are those risks and uncertainties described in the Company’s Form 20-F and Form 6-K reports (including all amendments to
those reports). In providing forward-looking statements, the Company is not undertaking any duty or obligation to update these statements publicly as a result of new
information, future events or otherwise, except as required by law. If the Company updates one or more forward-looking statements, no inference should be drawn that it
will make additional updates with respect to those other forward-looking statements. Actual results may vary from projected results and such variations may be material.
This presentation has been prepared solely for informational purposes only and no information should be construed as legal, tax, accounting or investment advice or a
recommendation.

3
+16 Million• Customers in Leading FFP
Program
Brazilian Market Leader
• ASKs
• Passengers Transported
• Corporate Sales
• Customer Satisfaction
+127 Aircraft• Order for 130 Boeing 737MAX
15.500
+450 Million• Passengers Transported
+77 Destinations
18 years
popularizing
air travel
in Brazil
Source: GOL
• Employees
• 1,600 Pilots
• 9 Regional Destinations
• 15 International Destinations

4
GOL | Brazil’s Best Sponsored Airline
Note: (1) Market data as of September 2, 2019.
Boeing U.S. Exim Bank
Constantino Family Public Market Delta Air France/KLM
40 aircraft financed in total (11 current)
MRO and Wi-fi maintenance
One of Boeing’s most important 737 customers
Over 250 737 aircraft operated to date
Order for 130 B737 MAX 8/10
Europe’s #1 airline
Total PAX in 2018: 102MM
Operating fleet: 548
Market cap: US$5 BN
Invested $100 MM
High liquidity
US$45 mm daily trading volume
High standards of disclosure
Quarterly IFRS financials
Supplementary disclosures
IR Website
Independent audit committee
Market cap of free float: US$1 BN
America’s largest airline
Total PAX in 2018: 192MM
Operating fleet: 904
Market cap: US$37 BN
Invested US$150 MM
GOL Board seat
Brazil’s largest transportation operators
Started GOL in 2001
Board members with significant experience and complementary profiles
Invested US$ 250 MM
53% 9% 1% 37%

5
• Experience: over 60 years of combined tenure at GOL
• Consistency: experience managing through all economic cycles
• Commitment: only all-Brazilian team
• Productivity: highly efficient; unique corporate culture
Years of Business
Experience
Paulo Kakinoff
Chief Executive Officer9
Richard Lark
Chief Financial Officer17
Eduardo Bernardes
Vice President, Sales and Marketing18
Captain Celso Ferrer
Vice President, Operations17
22
30
23
19
• CEO 2012 – present
• Board member 2011 – 2012
• CFO 2003 – 2008, 2016 – present
• Board member 2008 – 2016
• VP Sales & Marketing, 2015 – present
• VP, Planning 2015 – 2019
• Active GOL B737 Pilot
Years at GOL
5
GOL | Strong Management Team

6
Market Leader with Irreplaceable, Highly Defendable Network1
World-Class Low Cost Operator: Significantly Better than All South American Peers2
Right-sized Balance Sheet with Strong Liquidity Position5
Best Track Record in Delivering Results and Guiding Investors6
Best-in-Class Operations and Service: Driving Customer Loyalty3
GOL | Investment Highlights
Best Positioned to Benefit from Brazil Economic Recovery and to Deal with Adverse Macro Scenarios
4

7
¹ Bankrupted/Acquired Airlines
² Source: LF - ANAC YTD May and ASK - ANAC and Diio.
The GOL Effect
Fare liberalization in 2002
GOL | Popularized Air Travel in Brazil
02
Domestic LF (%)
Industry
Domestic ASK
GOL
Domestic ASK
ASK - Billion

8
Correlation Between Quantity of Flights and Brazil GDP(7)
Perspective in Terms of Flights
and Seats
Domestic Available Seat Kilometers in Brazil(8)
13,013,514,014,515,015,516,0
600 700 800 900 1000 1100 1200Bra
zil G
DP
Per
Cap
ita
(US$
mm
)
Quantity of Flights (thousands)
2007
2008 2009
2016 2017
2010
2015
2011
20142013
2012
75,486,3
102,7116,1 119,3 115,9 117,1 118,2 111,3 112,8
2008 2009 2010 2011 2012 2013 2014 2015 2016 2017
CAGR(11-18)
0.2%
(Billions)
Underpenetrated Market with High GrowthPotential
20-Year Annual Passenger Growth(4) Flights per capita(3)
4,8% 3,7% 3,6%2,4% 2,0%
Asia-Pacific Brazil LatAm North America Europe
1,76
1,21 1,17
0,53 0,52 0,43 0,43 0,39 0,38 0,360,09
North America has over 4x the number of flights per capita compared to Brazil
55%58%61%64%67%70%73%76%79%82%85%
20
70
120ASK RPK LF
Brazil Domestic Traffic(3)
5th Largest Domestic
Market After the U.S., China, India
and Russia(1)
World’s Largest Domestic Markets - Capacity Growth(2)
(12%)
(2%)
8%
18%
Oct-16 Jan-17 Apr-17 Jul-17 Oct-17 Jan-18 Apr-18 Jul-18 Oct-18
BrazilJapãoAustralia
IndiaChina
USARussia
(% ASK Growth (y.o.y) - Top 7 World Domestic Markets) (Bn Seat km)Load Factor
ASK > RPK
ASK < RPK
+
+
Brazil – Worldwide Relevant Market Primed for Growth in Coming Years
Notes: (1) Capacity growth in Brazil has been one of the most rational among large domestic markets; (2) IATA December 2018 (Top 7 domestic market), responsible for 82% of total World Domestic Market; (3) ANAC December 2018; (4) Airbus - 2018 – 2037; (5) ABEAR; (6) Airbus Global Market Forecasts 2017-2036; (7) ANAC and IBGE; (8) ANAC
Projected 2019-2023 Brazilian Domestic Market
CAGR of 6.8% per year(5)
118,0
2018
8
Brazil | The Right Market

9
(1) Source Airbus Global Market Forecasts 2017-2036
(2) United States and Canada
(3) Airbus - 2016 – 2036
1,76
1,21
1,17
0,53
0,52
0,43
0,43
0,39
0,38
0,36
0,09
- 0,5 1,0 1,5 2,0 2,5
North America
Japan
Europe
Chile
Colombia
Brazil
Peru
Mexico
Argentina
China
India
North America has over 4.1x the number of flights per capita compared to Brazil
20-Year Annual Growth 3Flights per capita 1
5,6%
4,8%
4,1%
3,4%
2,4%
0,0%
1,0%
2,0%
3,0%
4,0%
5,0%
6,0%
Asia-Pacific Brazil LatinAmerica
Europe NorthAmerica
2
9
Brazil | Underpenetrated Market with High Growth

10
Brazil | Improving fundamentals and demand
GDP Growth (%)Inflation Rate (%)
Interest Rates (%) Domestic Passenger Demand Growth (% RPK)
5,9% 6.3% 5,8% 5,9% 6,4%
10,7%
6,9%
3,0%4,2% 4,1%
2010 2011 2012 2013 2014 2015 2016 2017 2018E 2019E
Inflation at historic lows… 7,5%
4,0%1,9% 3,0% 0,5%
-3,5% -3,5%
1,0% 1,5% 2,5%
2010 2011 2012 2013 2014 2015 2016 2017 2018E 2019E
… GDP growth normalizing
23,6%
15,9%
6,9%1,4%
5,8%1,1%
-5,7%
3,2% 3-6% 5-9%
2010 2011 2012 2013 2014 2015 2016 2017 2018E 2019E
10,7% 10,8% 10,9%9,8%
11,6%
14,1% 13,6%
7,0% 6,5%8,0%
2010 2011 2012 2013 2014 2015 2016 2017 2018E 2019E
Source : IBGE, Bacen, ANAC and Focus10
Interest rates at lowest levels…
Demand ~2-4 x GDP Growth
3.1x 4.0x 3.6x 0.5x nm nm11.6x 3.2x

11
37.6%32.6%
22.8%96,4
58,5
32,518,3 17,6 15,7
25% of
customers: >
50% of
revenues
(Millions of passengers carried in 2017)
Type # of planes
Lowest costs
Scheduling and maintenance efficiency
Flexibility
High utilization
GOL has over
37% market share YTD
GOL’s main airports cover
79% of
Brazil’s GDP
B737 127
Simplified fleet enables Gol’s:
Average seats per plane
177
Highly liquid and marketable, residual value stays consistent
GOL | Brazil’s Market Leader and Best Positioned Airline
Unique Profile in Brazilian Air Transport All Boeing Narrow-Body Fleet
Brazil is the #1 Country(1) in LAC(2) Air Transport Company with the Largest Domestic Market Share(3)
#1 34mm PAX
/ year; 750+ flights / day; 77 destinations, including 15 int’l
(by Revenue Passenger Kilometers (RPK), 2018)
GOL is the #1 Player in the #1 Market in Latin America
Brazil is 1.6x the next largest country
Notes: (1) World Bank, 2017
(2) LatAm & Caribbean
(3) ANAC and GOL, 2018
Leader in business passengers

12
GOL Network Evolution | 2019 x 2018
From 61 domestic destinations served in 2018 to104 in 2019
+34 New Destinations
Regional code-shareagreements
+9 New DestinationsOperated by GOL
+R$ 420 MMAdditional investments
in regional markets
GOL Network: the broadest domestic and
most extensive regional in Brazil

13
GOL | The Most Complete Service for a Low-Cost Airline in the World
13
Smiles Diamond Premium Economy Entertainment
On-board Services Premium LoungeWi-Fi and +Pitch

14
GOL | Best-in-Class Operations and Service
Note: (1) First class
Best-in-class product positioning…
CUSTOMER MIXLeisure /
Business / SMEs
LeisureLeisure /
SMEsLeisure / Business
Leisure / Business
Leisure / Business
Leisure / Business
On-board Wi-Fi
Live TV
Free beverages (non-alcoholic)
Free snacks
On-board sales
Tier Elite
Cabin segmentation
Airport lounges
Designated seats
Seat pitch 34’’ / 30’’ 28’’ / 30’’ 30’’ 29’’ 34’’ / 30’’36’’(1) / 34’’
/ 31’’33’’ / 31’’
…combined with leadership across all brand metrics in the eyes of HVC’s
Top of Mind HVC – 1Q’19
BRAND PREFERENCE HVC – 1st Mention 1Q’19
BRAND MOMENTUM HVC – 1Q’19
14

15
Passengers claims for each 100
thousand passengers transported1Regularity 2018 1
98,5%
97,9%INDÚSTRIAEX- GOL
17,5
30,8INDÚSTRIAEX- GOL
Source: https://www.anac.gov.br/noticias/2019/anac-divulga-
dados-de-manifestacoes-de-passageiros-do-transporte-aereo
http://panorama.abear.com.br/1ANAC 2018
2 ICAO 2018 and GOL Database
98,5%
97,9%INDÚSTRIAEX- GOL
17,5
30,8INDÚSTRIAEX- GOL
GOL | Operational Efficiency and Safety
Lost and damaged baggage for
each 1.000 passengers¹
IndustryEx-GOL
IndustryEx-GOL
EuropeAsiaNorth
AmericaBrazil Global
Average
16
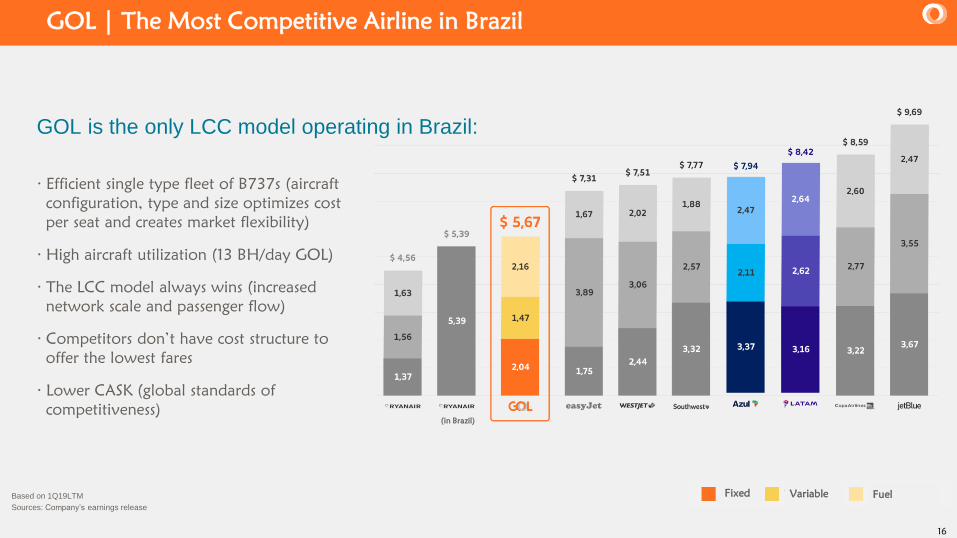
GOL is the only LCC model operating in Brazil:
· Efficient single type fleet of B737s (aircraft
configuration, type and size optimizes cost
per seat and creates market flexibility)
· High aircraft utilization (13 BH/day GOL)
· The LCC model always wins (increased
network scale and passenger flow)
· Competitors don’t have cost structure to
offer the lowest fares
· Lower CASK (global standards of
competitiveness)
Based on 1Q19LTM
Sources: Company’s earnings release
GOL | The Most Competitive Airline in Brazil
Fixed Variable Fuel
(in Brazil)

17
428
812
400
500
600
700
800
900
2012 2013 2014 2015 2016 2017 2018 2Q19
$19,7
$29,2
$19,0
$21,0
$23,0
$25,0
$27,0
$29,0
2012 2013 2014 2015 2016 2017 2018 2Q19
70,2%
82,0%
69,0%
72,0%
75,0%
78,0%
81,0%
84,0%
2012 2013 2014 2015 2016 2017 2018 2Q19
Implemented Operational Improvements Generated Significant EBITDA Growth
(R$ thousands)
Average LTM Net Yield per Passenger Kilometer (2)
(%)
(R$) (centiliter/ASK)
Note: (1) Calculated by dividing LTM RPK by ASK; (2) Average value paid by passenger to fly one kilometer
GOL | Drivers of Margin Expansion
3,2
2,9
2,8
2,9
3,0
3,1
3,2
3,3
2012 2013 2014 2015 2016 2017 2018 2Q19
LTM Net Revenue per Employee Total Load Factor (1)
LTM Fuel Consumption (Liters/ASK)
18
0
5
10
15
20
25
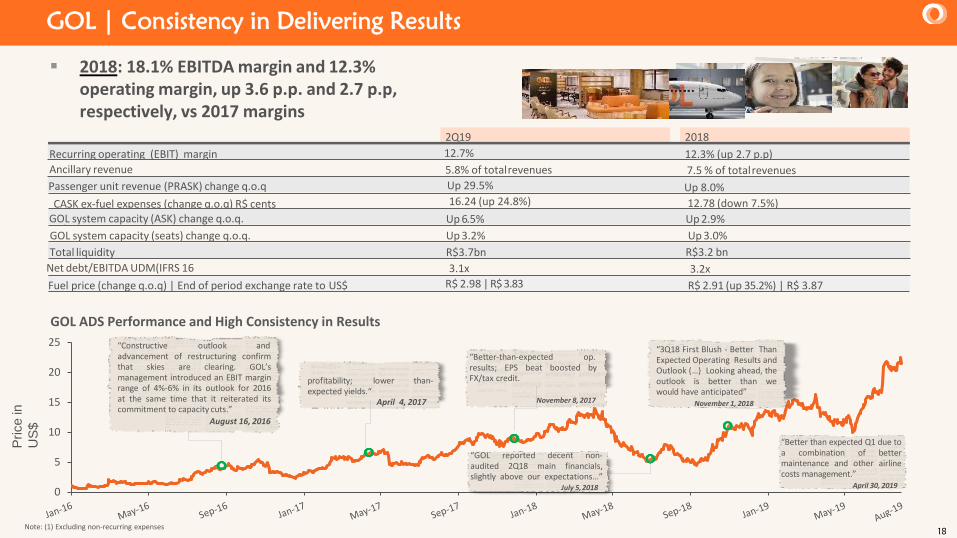
2018: 18.1% EBITDA margin and 12.3% operating margin, up 3.6 p.p. and 2.7 p.p, respectively, vs 2017 margins
Recurring operating (EBIT) margin
Ancillary revenue
Passenger unit revenue (PRASK) change q.o.q
CASK ex-fuel expenses (change q.o.q) R$ cents
R$ centsGOL system capacity (ASK) change q.o.q.
GOL system capacity (seats) change q.o.q.
Total liquidity
Net debt/EBITDA UDM(IFRS 16
2018
12.3% (up 2.7 p.p)
7.5 % of totalrevenues
Up 8.0%
12.78 (down 7.5%)
Up 2.9%
Up 3.0%
R$3.2 bn
3.2x
2Q19
12.7%
5.8% of totalrevenues
Up 29.5%
16.24 (up 24.8%)
Up 6.5%
Up 3.2%
R$3.7bn
3.1x
Fuel price (change q.o.q) | End of period exchange rate to US$ R$ 2.91 (up 35.2%) | R$ 3.87R$ 2.98 | R$ 3.83
GOL ADS Performance and High Consistency in Results
August 16,2016
April 04,2017
“1Q17 preliminary results: good
Price in
US
$
“Constructive outlook andadvancement of restructuring confirmthat skies are clearing. GOL’smanagement introduced an EBIT marginrange of 4%-6% in its outlook for 2016at the same time that it reiterated itscommitment to capacity cuts.”
August 16, 2016
profitability; lower than-expected yields.“
April 4, 2017
“GOL reported decent non-audited 2Q18 main financials,slightly above our expectations…”
July 5,2018
“Better-than-expected op.results; EPS beat boosted byFX/tax credit.
November 8, 2017
“3Q18 First Blush - Better ThanExpected Operating Results andOutlook (…) Looking ahead, theoutlook is better than wewould have anticipated”
November 1, 2018
GOL | Consistency in Delivering Results
Note: (1) Excluding non-recurring expenses
“Better than expected Q1 due toa combination of bettermaintenance and other airlinecosts management.”
April 30, 2019
19
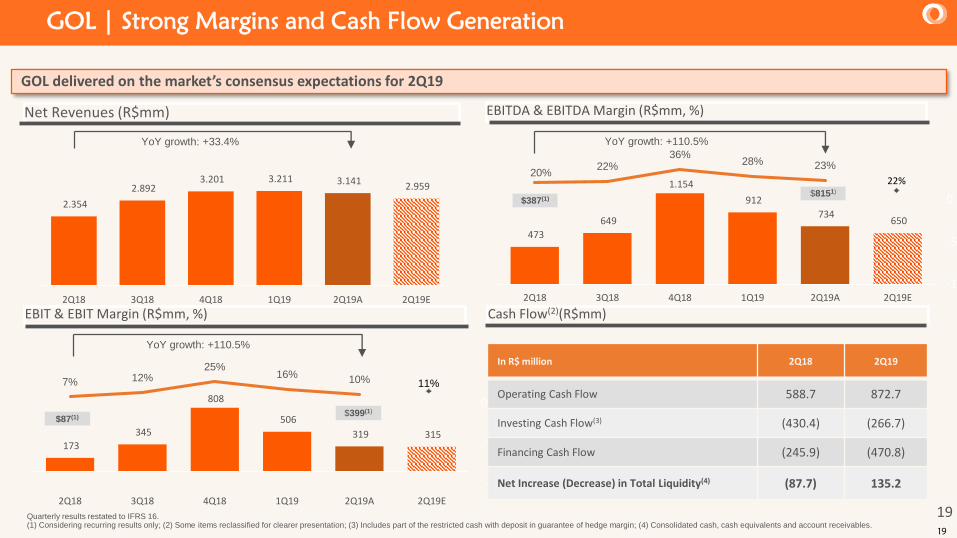
473
649
1.154
912
734 650
20%22%
36%28% 23%
-100
-50
0
2Q18 3Q18 4Q18 1Q19 2Q19A 2Q19E
22%
GOL | Strong Margins and Cash Flow Generation
Net Revenues (R$mm)
19
EBITDA & EBITDA Margin (R$mm, %)
EBIT & EBIT Margin (R$mm, %) Cash Flow(2)(R$mm)
2.354
2.892 3.201 3.211 3.141
2.959
2Q18 3Q18 4Q18 1Q19 2Q19A 2Q19E
GOL delivered on the market’s consensus expectations for 2Q19
YoY growth: +33.4% YoY growth: +110.5%
173
345
808
506
319 315
7% 12%25%
16%10%
-100
-50
0
2Q18 3Q18 4Q18 1Q19 2Q19A 2Q19E
11%
$87(1)
YoY growth: +110.5%
$387(1)$8151)
$399(1)
In R$ million 2Q18 2Q19
Operating Cash Flow 588.7 872.7
Investing Cash Flow(3) (430.4) (266.7)
Financing Cash Flow (245.9) (470.8)
Net Increase (Decrease) in Total Liquidity(4) (87.7) 135.2
Quarterly results restated to IFRS 16.(1) Considering recurring results only; (2) Some items reclassified for clearer presentation; (3) Includes part of the restricted cash with deposit in guarantee of hedge margin; (4) Consolidated cash, cash equivalents and account receivables.

20
GOL | Capital Structure
20
2019 – 2023 Plan
Liability
management
Optimizing
balance sheet
Fleet
transformation
• +R$2 Bn debt reduction in
next 2 years
• +R$300 MM interest
expense reduction in 2019
• No relevant maturities in
next 5 years
• Access to diverse funding
sources
• 100% CAPEX financing for
PDPs and engine overhaul
• Improving working capital
and availability of hedging
• Maximize use of capital
deployed and tax credits
• Improved interest coverage
ratio
• Credit rating back to BB-
• Maintenance capex: lower
by modernization of fleet
• Building free equity on MAX
order

21
Corporate Rating (global): B1
Local Rating: n/a
Outlook: Stable
Corporate Rating (global): B+
Local Rating: A-
Outlook: Stable
Corporate Rating (global): B
Local Rating: brA
Outlook: Stable
Long-term USD debt
finances
Long-term USD assets
1 Operating lease debt capitalized at 7x for 2013-2018
2 On January 1, 2019, the Company adopted CPC 06 (R2) – “Leases” (equivalent to IFRS 16)
6.3114.661
5.6306.444
7.635
2.994
1.7181.476 641
578
7.744
6.9796.578
7.790 5.348
10.5x
5.5x4.5x
3.8x
3.1x
2015 2016 2017 2018 2Q19
Loans and Financings Finance Leases Operating Leases Net debt / EBITDA UDM
21
GOL | Balance Sheet Deleveraging and Improving Credit Profile
(In R$MM)

22
Operated by GOL Operated by GOLCode-Share
Agreement
Code-Share
Agreement
Code-Share
Agreement
Boeing 737-800Boeing 737 MAX-8
Boeing 737-700ATR42ATR72
Grand Caravan Various Widebodies
186 PAX 138 PAX 46-67 PAX 9 PAX < 220 PAX
Core domestic airportsInternational expansion
SP-RJ Shuttle
Regional marketsoperated by GOL
Small Regional Markets+
Connectivity
Ultra-small Regional Markets +
Connectivity
InternationalConnectivity
All markets covered, without deviating from the single-fleet concept, through partnerships and codeshare agreements
GOL’s Market Position – An Aircraft for Every Market
+10 Partners
Single type fleet

23
117 107 97 86 78
15 32 46 59 71
132 139 143 145 149
2019 2020 2021 2022 2023
B737-NG B737-8/10 MAX
GOL’s Fleet Plan provides sustainable cost advantage and flexibility
Fleet Plan (EoY)
Average age of the fleet
138148 152 155 159
119130 134 138 142
132139 143 145 149
2019 2020 2021 2022 2023
Scheduled 737NG Redeliveries (net)
4
910
11
9 9
2019 2020 2021 2022 2023 2024
Redelivery Plan
Fleet Flexibility
GOL has a mature and well-structured aircraft redelivery process
+3% Fleet plan matches capacity with demand
Fleet growth tracks Brazilian GDP growth
Contracts structured to provide flexibility for higher or lower market growth and emerging opportunities
Ability to flex Boeing order and re-deliveries
Average age of 6 years by 2024
24
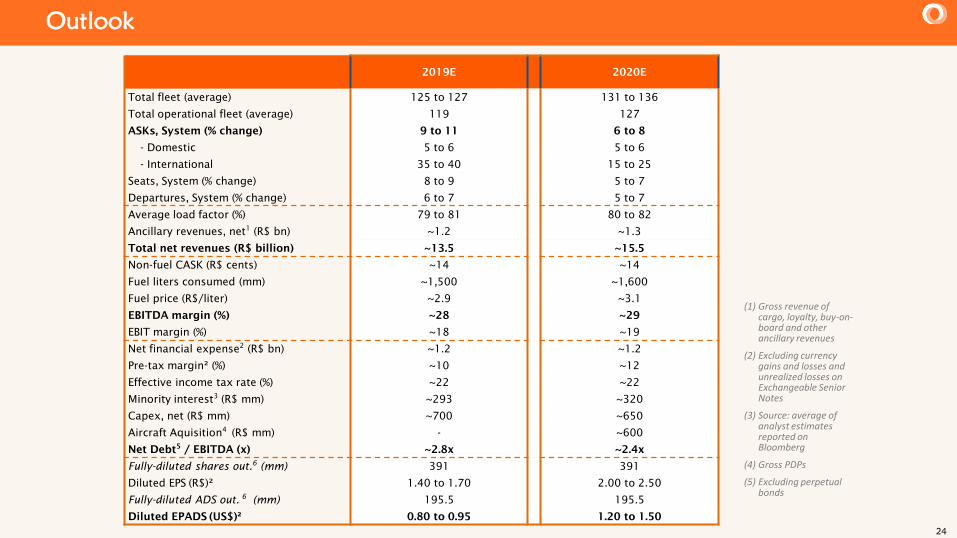
2019E 2020E
Total fleet (average) 125 to 127 131 to 136
Total operational fleet (average) 119 127
ASKs, System (% change) 9 to 11 6 to 8
- Domestic 5 to 6 5 to 6
- International 35 to 40 15 to 25
Seats, System (% change) 8 to 9 5 to 7
Departures, System (% change) 6 to 7 5 to 7
Average load factor (%) 79 to 81 80 to 82
Ancillary revenues, net1
(R$ bn) ~1.2 ~1.3
Total net revenues (R$ billion) ~13.5 ~15.5
Non-fuel CASK (R$ cents) ~14 ~14
Fuel liters consumed (mm) ~1,500 ~1,600
Fuel price (R$/liter) ~2.9 ~3.1
EBITDA margin (%) ~28 ~29
EBIT margin (%) ~18 ~19
Net financial expense2
(R$ bn) ~1.2 ~1.2
Pre-tax margin² (%) ~10 ~12
Effective income tax rate (%) ~22 ~22
Minority interest3
(R$ mm) ~293 ~320
Capex, net (R$ mm) ~700 ~650
Aircraft Aquisition4
(R$ mm) - ~600
Net Debt5
/ EBITDA (x) ~2.8x ~2.4x
Fully-diluted shares out.6
(mm) 391 391
Diluted EPS (R$)² 1.40 to 1.70 2.00 to 2.50
Fully-diluted ADS out.6
(mm) 195.5 195.5
Diluted EPADS (US$)² 0.80 to 0.95 1.20 to 1.50
Outlook
(1) Gross revenue of cargo, loyalty, buy-on-board and other ancillary revenues
(2) Excluding currency gains and losses and unrealized losses on Exchangeable Senior Notes
(3) Source: average of analyst estimates reported on Bloomberg
(4) Gross PDPs
(5) Excluding perpetual bonds