GOING SOLAR - Centre for Science and Environment
36
Centre for Science and Environment New Delhi, India GOING SOLAR Action Plan To Tap Gurugram's Solar Rooftop Potential
Transcript of GOING SOLAR - Centre for Science and Environment

Centre for Science and EnvironmentNew Delhi, India
GOING SOLARAction Plan To Tap Gurugram's
Solar Rooftop Potential
Research direction: Priyavrat Bhati
Writers: Mandvi Singh, Soundaram Ramanathan and Shekhar Deepak Singh
Editor: Tanya Mathur
Cover design and layout: Kirpal Singh
Production: Rakesh Shrivastava and Gundhar Das
CSE is grateful to Shakti Sustainable Energy Foundation for their support. Shakti Sustainable Energy Foundation works to strengthen the energy security of the country by aiding the design and implementation of policies that encourage energy efficiency, renewable energy and sustainable transport solutions, with an emphasis on sub sectors with the most energy saving potential. Working together with policy makers, civil society, academia, industry and other partners, The Foundation takes concerted action to help chart out a sustainable energy future for India (www.shaktifoundation.in).
Disclaimer: the views / analysis expressed in this report / document do not necessarily reflect the views of Shakti Sustainable Energy Foundation. The Foundation also does not guarantee the accuracy of any data included in this publication, nor does it accept any responsibility for the consequences of its use.
© 2018 Centre for Science and Environment
Material from this publication can be used, but with acknowledgement
Citation: Priyavrat Bhati, Shekhar Deepak Singh and Mandvi Singh 2018, Going Solar: Action Plan to Tap Gurugram’s Solar Rooftop Potential, Centre for Science and Environment, New Delhi
Published byCentre for Science and Environment41, Tughlakabad Institutional AreaNew Delhi 110 062Phones: 91-11-40616000Fax: 91-11-29955879E-mail: [email protected] Website: www.cseindia.org

3
ACKNOWLEDGEMENT
We acknowledge the funding agency Shakti Sustainable Energy Foundation for supporting
this work.
From the state government agencies in Haryana, HAREDA was our first point of contact
and we would like to thank Mr Rameshwar Singh Jhangir and Mr Kuldeep Singh for their
support.
We are thankful to DHBVNL—the discom supplying power to Gurugram. Smt. Vineeta
Singh (Superintending Engineer, M&P Circle, Gurgaon), Mr Anil Sharma (Superintending
Engineer, R-APDRP), Mr Nitish Choubey (AE, R-APDRP) and Mr Manoj Kumar (AE, M&P
Section) have helped us get information and key technical inputs for this research.
We would also like to express our gratitude to the officers of other government departments
such as Mr R.S Bath (T&CP) and Mr Sudhir Chaudhary (MCG) who provided critical inputs
for this work.
We would also like to thank Col. Prakash Tewari (Director, Coporate Affairs, DLF Group)
for his support. This research could not have been possible without the first hand data/
information he helped us with.
We are also grateful to Mr Piyush Kumar (ReNew Power), who helped us the developers world
perspective.
We would also like to thank our many stakeholders who have preferred to stay anonymous
for this survey. We express gratitude to our customers for their inputs—which were critical in
writing this report.
Last but not least, we thank the members of the civil society, corporate bodies and solar
developers operational in Gurugram. Especially, Ms Shubhra Puri (Gurgaon First), who gave
all possible support to organize the two round-tables and acted as a facilitator in getting key
contacts from the district.

4
CONTENTS
1. Theglobalrooftopsolarscenario 7
2. WhychooseGurugramforthisstudy? 9
3. SolarrooftopinHaryana 10
3.1 Off-grid solar rooftop systems 11
3.2 Grid connected solar rooftop systems 12
4. DHBVNL’sroleinsolarrooftop 13
5. Understandingthecustomersegments 14
5.1 Residential 15
5.2 Commercial 15
5.3 Industrial 16
6. GurugramPowerSupplyPosition 17
6.1 DHBVNL efforts to tame power cuts 18
7. ExistingpoliciesforsolarrooftopinHaryana 19
7.1 Government schemes 19
8. Futurepotential 20
8.1 Scope of built area 20
8.2 Potential based on HAREDA order 20
9. CompliancewiththeHAREDAorder 23
10.Implementationchallenges 24
10.1 Issues specific to leading implementation agencies 24
10.2 Inadequate funding sources 25
11.Solarfinancing 26
12.Actionplan 29
Annexures 32
References 33

5
LIST OF ABBREVIATIONS
ADC Office of the Additional District Commissioner
AT&C Aggregate technical and commercial losses
CAPEX Capital expenditure
CSE Centre for Science and Environment
DHBVNL Dakshin Haryana Bijli Vitran Nigam Limited
DISCOM Distribution company
DLF Delhi Land and Finance
FAR Floor area ratio
FY Financial year
GW Giga-watt
HAREDA Haryana Renewable Energy Development Agency
HERC Haryana Electricity Regulatory Commission
HPGCL Haryana Power Generation Corporation Limited
HSIIDC Haryana State Industrial and Infrastructure Development
Corporation Limited
HVPNL Haryana Vidyut Prasaran Nigam Limited
kVAh Kilo-volt ampere hours
kW Kilo-watt
kWh Kilo-watt hours
MCG Municipal Corporation Gurgaon
MNC Multinational companies
MNRE Ministry of New and Renewable Energy
MU Million units
MW Mega-watt
R-APDRP Restructured Accelerated Power Development and Reforms Programme
RESCO Renewable Energy Service Company
RWA Residential welfare association
SDO Sub-Divisional Officer
SRT Solar rooftop
T&CP Town and country planning
UHBVNL Uttar Haryana Bijli Vitran Nigam Limited

6
GOING SOLAR: ACTION PLAN TO TAP GURUGRAM’S SOLAR ROOFTOP POTENTIAL
7
GOING SOLAR: ACTION PLAN TO TAP GURUGRAM’S SOLAR ROOFTOP POTENTIAL
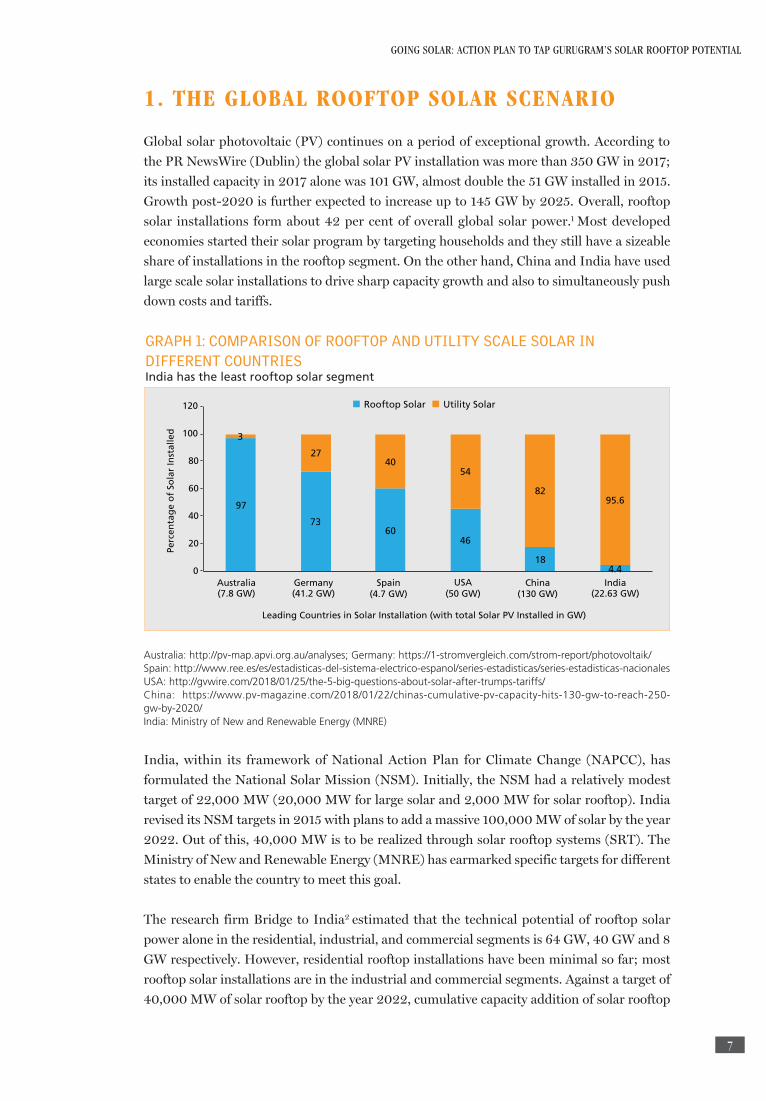
1. THE GLOBAL ROOFTOP SOLAR SCENARIO
Global solar photovoltaic (PV) continues on a period of exceptional growth. According to
the PR NewsWire (Dublin) the global solar PV installation was more than 350 GW in 2017;
its installed capacity in 2017 alone was 101 GW, almost double the 51 GW installed in 2015.
Growth post-2020 is further expected to increase up to 145 GW by 2025. Overall, rooftop
solar installations form about 42 per cent of overall global solar power.1 Most developed
economies started their solar program by targeting households and they still have a sizeable
share of installations in the rooftop segment. On the other hand, China and India have used
large scale solar installations to drive sharp capacity growth and also to simultaneously push
down costs and tariffs.
India, within its framework of National Action Plan for Climate Change (NAPCC), has
formulated the National Solar Mission (NSM). Initially, the NSM had a relatively modest
target of 22,000 MW (20,000 MW for large solar and 2,000 MW for solar rooftop). India
revised its NSM targets in 2015 with plans to add a massive 100,000 MW of solar by the year
2022. Out of this, 40,000 MW is to be realized through solar rooftop systems (SRT). The
Ministry of New and Renewable Energy (MNRE) has earmarked specific targets for different
states to enable the country to meet this goal.
The research firm Bridge to India2 estimated that the technical potential of rooftop solar
power alone in the residential, industrial, and commercial segments is 64 GW, 40 GW and 8
GW respectively. However, residential rooftop installations have been minimal so far; most
rooftop solar installations are in the industrial and commercial segments. Against a target of
40,000 MW of solar rooftop by the year 2022, cumulative capacity addition of solar rooftop
97
73 60
46
18 4.4
3
27 40
54
82 95.6
0
20
40
60
80
100
120
Australia (7.8 GW)
Germany (41.2 GW)
Spain (4.7 GW)
USA (50 GW)
China (130 GW)
India (22.63 GW)
Perc
enta
ge
of
Sola
r In
stal
led
Leading Countries in Solar Installation (with total Solar PV Installed in GW)
Rooftop Solar Utility Solar
GRAPH 1: COMPARISON OF ROOFTOP AND UTILITY SCALE SOLAR IN DIFFERENT COUNTRIESIndia has the least rooftop solar segment
Australia: http://pv-map.apvi.org.au/analyses; Germany: https://1-stromvergleich.com/strom-report/photovoltaik/Spain: http://www.ree.es/es/estadisticas-del-sistema-electrico-espanol/series-estadisticas/series-estadisticas-nacionalesUSA: http://gvwire.com/2018/01/25/the-5-big-questions-about-solar-after-trumps-tariffs/China: https://www.pv-magazine.com/2018/01/22/chinas-cumulative-pv-capacity-hits-130-gw-to-reach-250-gw-by-2020/India: Ministry of New and Renewable Energy (MNRE)

8
GOING SOLAR: ACTION PLAN TO TAP GURUGRAM’S SOLAR ROOFTOP POTENTIAL
stands at only approximately 1,933 MW of which grid-connected rooftop solar is 1,211 MW
and off-grid solar systems is 723 MW as of May 2018. During the nine months (April to
December 2017) only 271 MW was added.
Both the residential and non-residential (industrial and commercial) segments, despite their
large potential, are lagging behind in solar power additions. It raises questions as to why the
SRT segment is not gaining pace and what needs to be done.
9
GOING SOLAR: ACTION PLAN TO TAP GURUGRAM’S SOLAR ROOFTOP POTENTIAL
2. WHY CHOOSE GURUGRAM FOR THIS STUDY?
Gurugram is the second largest district of Haryana. It has rapidly transformed during the past
few decades into Haryana’s largest urban agglomeration with the establishment of numerous
multinational companies (MNCs), IT/BPO and manufacturing units. With a growing middle
class comprising white collar professionals, Gurugram has one of the highest per-capita
incomes among Indian cities. The existing population of Gurugram is estimated to be around
2.5 million which is expected to swell to 4.3 million by 2020.
Given a combination of sizable commercial and industrial activity and relatively rich residents,
Gurugram’s per capita consumption of electricity is around 4000 kWh per annum. With
projected continued strong economic growth, electricity consumption is expected to increase
to 6,400 kWh per person per annum by 2022. DHBVNL’s electricity supply is driven by urban
demand. Of 3,024,921 DHBVNL’s customers/connections 245,206—around 8 per cent—are
from Gurugram district. But, of DHBVNL’s annual electricity sales of 22,761 million kWh
(MU) Gurugram city’s annual share is 28 per cent. Urban focus means that Gurugram’s
demand peaks in the afternoon with air conditioner use—according to the DHBVNL data
the average demand of electricity in Gurugram is around 1,125 MW, however, during peak
summer afternoons the power consumption in Gurugram reaches around 1,700 MW.
Gurugram’s housing sector is dominated by relatively new high-rise residential complexes.
Given the frequent power outages, these societies promise uninterrupted power supply to
its well-off residents through diesel generator (DG) sets to market their apartments. (The
back-up supply ranges from a fraction of household load to almost all its demand, depending
on whether it is a middle income or ultra-rich consumer residential complex.) CSE’s survey of
few dozen societies showed that most of them faced power cuts ranging from 30 minutes to
around an hour per day. The cuts are higher in summer, notwithstanding the DHBVNL claim
of no power cuts. The result is significant use of DG sets in Gurugram to supply electricity.
CSE’s December 20163 study showed that the DG-based electricity supply is extremely
expensive (up to Rs 30 per unit if we include the capital investment in the DG that is being
run for less than an hour per day). Electricity from rooftop solar, in contrast, is around Rs
5–6 per unit. Second, DG is extremely polluting in its immediate vicinity—there have been
instances when the DG has been operated for several hours continuously. This means children
and women, who typically spend a lot of time in the building, are particularly vulnerable.
For all these reasons solar rooftop can drastically cut—if not fully eliminate—DG use in a
city like Gurugram. One reason solar rooftop has not gained traction in the country is the
high upfront cost of installation. But this is less of an issue for well-off residents in high rise
residential buildings. Moreover, the government has introduced fairly progressive policies to
push solar rooftop in the state.
The purpose of this research is to understand the reasons behind slow penetration of solar
rooftop (SRT) and propose actionable solutions to expedite its diffusion in Gurugram. This
template can likely be used for other Indian cities, most of whom have a similar profile of
rising middle class, growing commercial spaces and multi-storied residential buildings.

10
GOING SOLAR: ACTION PLAN TO TAP GURUGRAM’S SOLAR ROOFTOP POTENTIAL
3.SOLAR ROOFTOP IN HARYANA
The government of Haryana has a target of 4,142 MW of total solar power of which 1600 MW
is rooftop by the year 2022. However, the state has cumulatively added only 134.8 MW out of
which both solar rooftop and ground mounted solar is 85 MW and 49.8 MW4, respectively.
(See Graph 2: Year-wise targets for solar rooftop in Haryana)
Solar rooftop in Gurugram
The Gurugram district has installed a total of 24 MW solar rooftop systems. Of this 8 MW
is grid connected solar rooftop and 16 MW is off-grid SRT. It doesn’t appear that the pace of
installation has increased meaningfully over the last couple of years. There are no city-based
targets for rooftop but arguably Gurugram should target around 200MW, in line with its
around 15 per cent share of Haryana’s total energy consumption (See Graph 3: Year-wise
achievements for solar in Haryana).
400
350
300
250
200
150
100
50
05
320
360
280
235
200 200
2015-16 2016-17 2017-18 2018-19 2019-20 2020-21 2021-22
GRAPH 2: YEAR-WISE TARGETS FOR SOLAR ROOFTOP IN HARYANA
Note: Initially, a total of 4,560 MW was the target for Haryana state, which now stands revised by MNRE at 4,142 MWSource: Ministry of New and Renewable Energy (MNRE)
0
2
4
6
8
10
12
14
2011-12 2012-13 2013-14 2014-15 2015-16 2016-17
GRAPH 3: YEAR-WISE ACHIEVEMENTS FOR SOLAR IN HARYANAGrowth was not in pace with the targets
Source: Department of Renewable Energy, Haryana (HAREDA)

11
GOING SOLAR: ACTION PLAN TO TAP GURUGRAM’S SOLAR ROOFTOP POTENTIAL
3.1 Off-grid solar rooftop systems
Ninety-five per cent of the off-grid solar rooftop systems were installed by the industry and
commercial customers (see Graph 4: Off-grid solar rooftop systems—Customer category).
That residential customers have not opted for off-grid is not surprising. Connecting to grid
makes it possible for consumers to obtain capital subsidy (30 per cent of investment) and also
generate revenues by feeding excess supply to the grid.
Over half of the installed capacity comprises plants of large size (100 kW and above (see Graph
5: Off-grid solar rooftop system—Size profile). One could question whether these fall under
the rooftop category from the perspective of ‘distributed generation’, which is targeted at the
small scale residential or commercial sector. Globally, solar rooftops of smaller size are the
norm. For instance, Italy through its solar rooftop program, has been promoting rooftops of
size 20 kW and below.5Israel promotes rooftops of sizes 15–50 kW.6
842
1,768
3,997
8,417
1,361
0 1,000 2,000 3,000 4,000 5,000 6,000 7,000 8,000 9,000
0-20 kW
20-40 kW
40-100 kW
100-500 kW
500+
Capacity in kW
GRAPH 5: OFF-GRID SOLAR ROOFTOP SYSTEM—SIZE PROFILESignificant share of solar rooftop contributed by large systems
Source: DHBVNL, 2018
Commercial, 103 customers 41%
Industry, 96 customers
54%
Residential, 26 customers 5%
Capacity: 16,385 kW
GRAPH 4: OFF-GRID SOLAR ROOFTOP SYSTEMS—CUSTOMER CATEGORYResidential customers’ share is a tiny fraction
Source: DHBVNL, 2018

12
GOING SOLAR: ACTION PLAN TO TAP GURUGRAM’S SOLAR ROOFTOP POTENTIAL
3.2 Grid connected solar rooftop systems
Gurugram has over 8 MW installed net-metered solar rooftop systems. The state allows
customers to install grid connected solar rooftop systems of capacity equivalent to the
sanctioned load. The net-metered segment is more balanced at least in terms of number of
customers with residential consumers dominating (67 per cent of the total). But capacity
installation was dominated by industrial/commercial consumers (see Graph 6: Net metered
solar rooftop systems – Customer Category) given their larger size systems.
A sizeable 5 MW of capacity was installed by just 19 customers (see Graph 7: Net-metered
solar rooftop systems—Size profile). This dominance of commercial/industrial sector in the
rooftop category clearly shows that rooftop is making economic sense. While some of the
installation may well be displacing back-up diesel based power, cost of solar rooftop is lower
than grid for industrial and commercial consumers. It means that an effective communication
and awareness campaign could give a boost to the residential segment also.
347
832
406
516
471
360
5,093
0 1000 2000 3000 4000 5000 6000
5 kW and below
5 to 10 kW
10 to 20 kW
20 to 40 kW
40 to 60 kW
60 to 100 kW
100 kW and above
Capacity in kW
GRAPH 7: NET-METERED SOLAR ROOFTOP SYSTEMS—SIZE PROFILEA sizeable capacity was installed by few customers
Source: DHBVNL, 2018*data not comprehensive
Domestic, 171 customers 18%
Industry, 44 customers 53%
Commercial, 39 customers
29%
Total: 8,025 kW
GRAPH 6: NET METERED SOLAR ROOFTOP SYSTEMS— CUSTOMER CATEGORYDespite sizable number of retail consumers small share of capacity
Source: DHBVNL, 2018

13
GOING SOLAR: ACTION PLAN TO TAP GURUGRAM’S SOLAR ROOFTOP POTENTIAL2
01
7P
OL
ICY
BR
IEF
4. DHBVNL’S ROLE IN SOLAR ROOFTOP
HAREDA coordinates the implementation of the rooftop solar program in Gurugram
with the state-owned discom, Dakshin Haryana Bijli Vitran Nigam Limited (DHBVNL).
DHBVNL distributes power in Gurugram district where it has 3,024,921 domestic,
commercial, industrial and agricultural consumers as of FY 2016. Power is procured
through Haryana Power Purchase Center (HPPC). For the financial year (FY) 2016–17,
the power allocation ratio was 44 per cent and 56 per cent for Uttar Haryana Bijli Vitran
Nigam Limited (UHBVNL) and DHBVNL, respectively. Power is wheeled through the state
transmission utility—Haryana Vidyut Prasaran Nigam Limited (HVPNL)—on the payment
of transmissions charges approved by Haryana Electricity Regulatory Commission (HERC),
the power regulator.
14
GOING SOLAR: ACTION PLAN TO TAP GURUGRAM’S SOLAR ROOFTOP POTENTIAL
5. UNDERSTANDING THE CUSTOMERS SEGMENTS
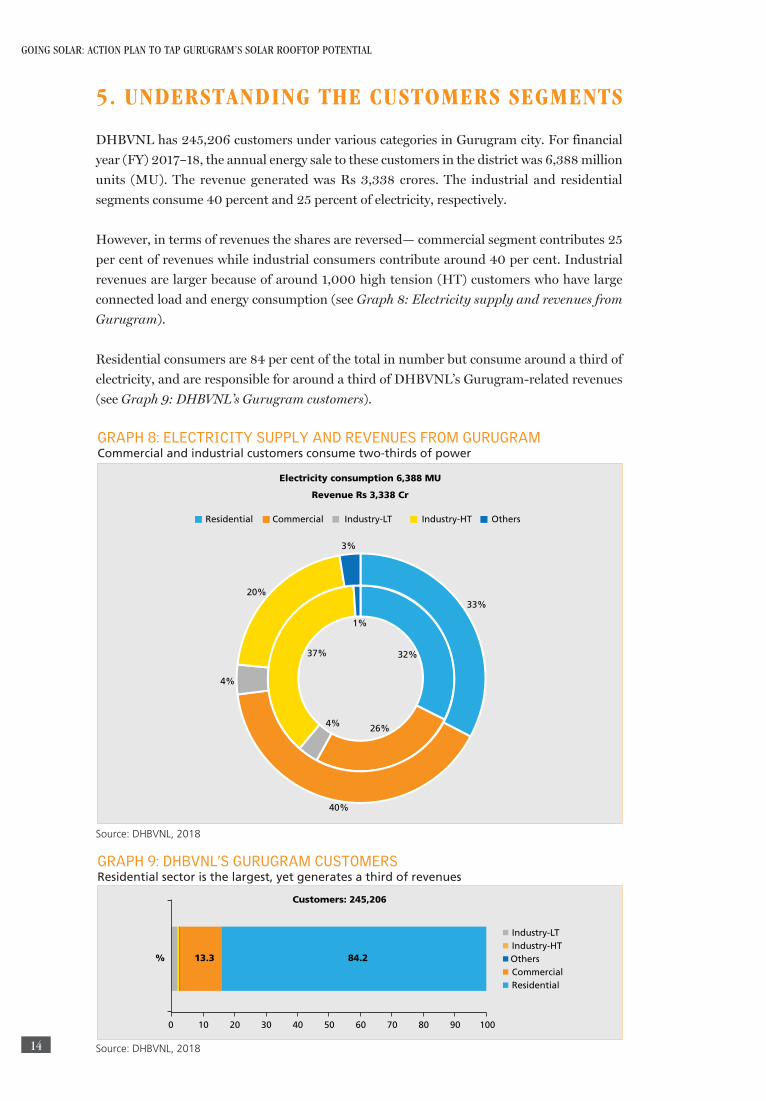
DHBVNL has 245,206 customers under various categories in Gurugram city. For financial
year (FY) 2017–18, the annual energy sale to these customers in the district was 6,388 million
units (MU). The revenue generated was Rs 3,338 crores. The industrial and residential
segments consume 40 percent and 25 percent of electricity, respectively.
However, in terms of revenues the shares are reversed— commercial segment contributes 25
per cent of revenues while industrial consumers contribute around 40 per cent. Industrial
revenues are larger because of around 1,000 high tension (HT) customers who have large
connected load and energy consumption (see Graph 8: Electricity supply and revenues from
Gurugram).
Residential consumers are 84 per cent of the total in number but consume around a third of
electricity, and are responsible for around a third of DHBVNL’s Gurugram-related revenues
(see Graph 9: DHBVNL’s Gurugram customers).
32%
26% 4%
37%
1%
33%
40%
4%
20%
3%
Electricity consumption 6,388 MU
Revenue Rs 3,338 Cr
Residential Commercial Industry-LT Industry-HT Others
GRAPH 8: ELECTRICITY SUPPLY AND REVENUES FROM GURUGRAMCommercial and industrial customers consume two-thirds of power
Source: DHBVNL, 2018
13.3 84.2
0 10 20 30 40 50 60 70 80 90 100
%
Customers: 245,206
Industry-LT Industry-HT Others Commercial Residential
GRAPH 9: DHBVNL’S GURUGRAM CUSTOMERSResidential sector is the largest, yet generates a third of revenues
Source: DHBVNL, 2018

15
GOING SOLAR: ACTION PLAN TO TAP GURUGRAM’S SOLAR ROOFTOP POTENTIAL
5.1 Residential
Residential customers are charged according to their connected load and electricity
consumption. The tariff structure of DHBVNL has three categories of domestic supply for
which the load and energy consumption charges vary. Load charges vary between Rs 75 and
125 per kW and energy charges between Rs 2.7 a unit and Rs 7.10 a unit. Nearly 75 per cent
of the residential consumers in Gurugram have under 10 kW connected load (see Table 1:
Gurugram’s residential customers—Distribution by load). Regulators are pushing policies
to encourage power supply at 11 kV to the residential society customers to reduce losses. For
instance, the HERC allows a rebate of 4 percent to the society in case of single point supply
at 11 kV. In Gurugram just 138 complexes are responsible for a quarter of the residential
supply; in fact the number may even be higher since a number of societies have multiple
connections. Targeting these societies can be an efficient strategy to scale up the solar rooftop.
In addition, around 35,000 customers (17 per cent of this segment) have loads of more than
10 kW. These consist of a mix of large houses, multi-flat building etc and have potential to
add large capacity—the large houses are also likely to benefit more from solar rooftop. The
largest category of less than 10 kW load (83 per cent of the segment) includes sizable number
of customers with 5 kW to 10 kW load as well as apartments in the residential complexes –
solar rooftop is a viable alternative for these too.
TABLE 1: GURUGRAM’S RESIDENTIAL CUSTOMERS—DISTRIBUTION BY LOADLarge customers (over 10 kW of load) consume 40 per cent of power
Load in kW Number of consumers
Electricity sold (million kWh)
% of total sold by DHBVNL
Revenue (in crores)
Under 10 kW 171,172 1,229 19.2 530
10–20 kW 34,234 389 6.1 282
20–30 kW 320 7 0.1 6
30–50 kW 484 17 0.3 14
Above 50 kW 26 3 0.1 3
BLDS 138 416 6.5 260
206,374 2,061 32.3 1,094
Source: DHBVNL, 2018
5.2 Commercial
Commercial segment comprises office spaces, shopping malls, banquet halls, cinemas,
hospitals, clinics, ware houses, guest houses, hotels and restaurants etc. This segment
consumes electricity mostly during the day and they will benefit from solar rooftop given the
fact that their demand overlaps with solar generation. The fixed charges vary between 170
and 225 per kW/kVAh load and energy charges between Rs 6.35 and Rs 7.05 a unit. HERC
has assumed a power factor of 0.8 for conversion of kVAh into kWh. (See Table 2: Load-wise
category of commercial customers in Gurugram).
16
GOING SOLAR: ACTION PLAN TO TAP GURUGRAM’S SOLAR ROOFTOP POTENTIAL
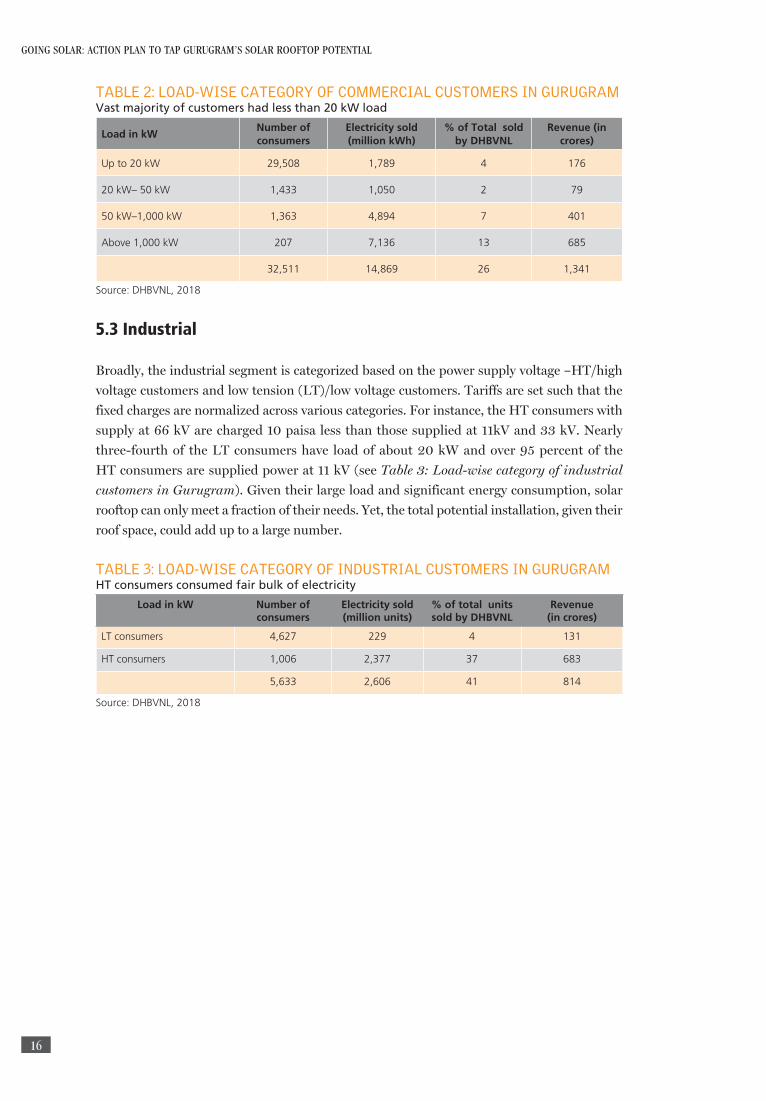
TABLE 2: LOAD-WISE CATEGORY OF COMMERCIAL CUSTOMERS IN GURUGRAMVast majority of customers had less than 20 kW load
Load in kWNumber of consumers
Electricity sold (million kWh)
% of Total sold by DHBVNL
Revenue (in crores)
Up to 20 kW 29,508 1,789 4 176
20 kW– 50 kW 1,433 1,050 2 79
50 kW–1,000 kW 1,363 4,894 7 401
Above 1,000 kW 207 7,136 13 685
32,511 14,869 26 1,341
Source: DHBVNL, 2018
5.3 Industrial
Broadly, the industrial segment is categorized based on the power supply voltage –HT/high
voltage customers and low tension (LT)/low voltage customers. Tariffs are set such that the
fixed charges are normalized across various categories. For instance, the HT consumers with
supply at 66 kV are charged 10 paisa less than those supplied at 11kV and 33 kV. Nearly
three-fourth of the LT consumers have load of about 20 kW and over 95 percent of the
HT consumers are supplied power at 11 kV (see Table 3: Load-wise category of industrial
customers in Gurugram). Given their large load and significant energy consumption, solar
rooftop can only meet a fraction of their needs. Yet, the total potential installation, given their
roof space, could add up to a large number.
TABLE 3: LOAD-WISE CATEGORY OF INDUSTRIAL CUSTOMERS IN GURUGRAMHT consumers consumed fair bulk of electricity
Load in kW Number of consumers
Electricity sold (million units)
% of total units sold by DHBVNL
Revenue (in crores)
LT consumers 4,627 229 4 131
HT consumers 1,006 2,377 37 683
5,633 2,606 41 814
Source: DHBVNL, 2018
17
GOING SOLAR: ACTION PLAN TO TAP GURUGRAM’S SOLAR ROOFTOP POTENTIAL
6. GURUGRAM’S POWER SUPPLY POSITION
If one were to go by the DHBVNL reports, there is virtually no load shedding in Gurugram.
The reason for this is that load shedding is defined as ‘four hours per power cut per day
for four continuous days’. The DHBVNL field engineers refer to sporadic power outages as
‘regular maintenance or line faults’. Not surprisingly, the performance report by DHBVNL
for Gurugram district indicates zero load shedding. System average interruption duration
index (SAIDI), defined as the average duration of interruption per consumer, is a globally used
indicator to identify the electric power utilities’ reliability of power supply. The SAIDI for the
Gurugram District from April 2016 to March 2017 was around 4.41 hours –surveys suggest
cuts that are much higher.
According to DHBVNL officials, the distribution company has a sufficient power supply to
meet the power demand. However, CSE’s December 2016 survey showed that power cuts
in housing societies ranged between 30–60 minutes per day. CSE conducted another survey
in Jan 2018 that looked at power supply for several commercial, industrial and institutional
consumers.
Our survey clearly shows regular power cuts and widespread use of DG in Gurugram. In
addition, DG usage is high in Gurugram because of some unusual reasons. There is anecdotal
evidence that certain buildings don’t even have an electricity connection because the feeder
can’t take on the additional load so these buildings run entirely on DGs. There is also some
evidence of power cuts in residential buildings to increase DG use, which allows the building
owner/managers to collect steep rates from office or apartment occupants. (See Graph 10:
Average power cuts in different category of buildings).
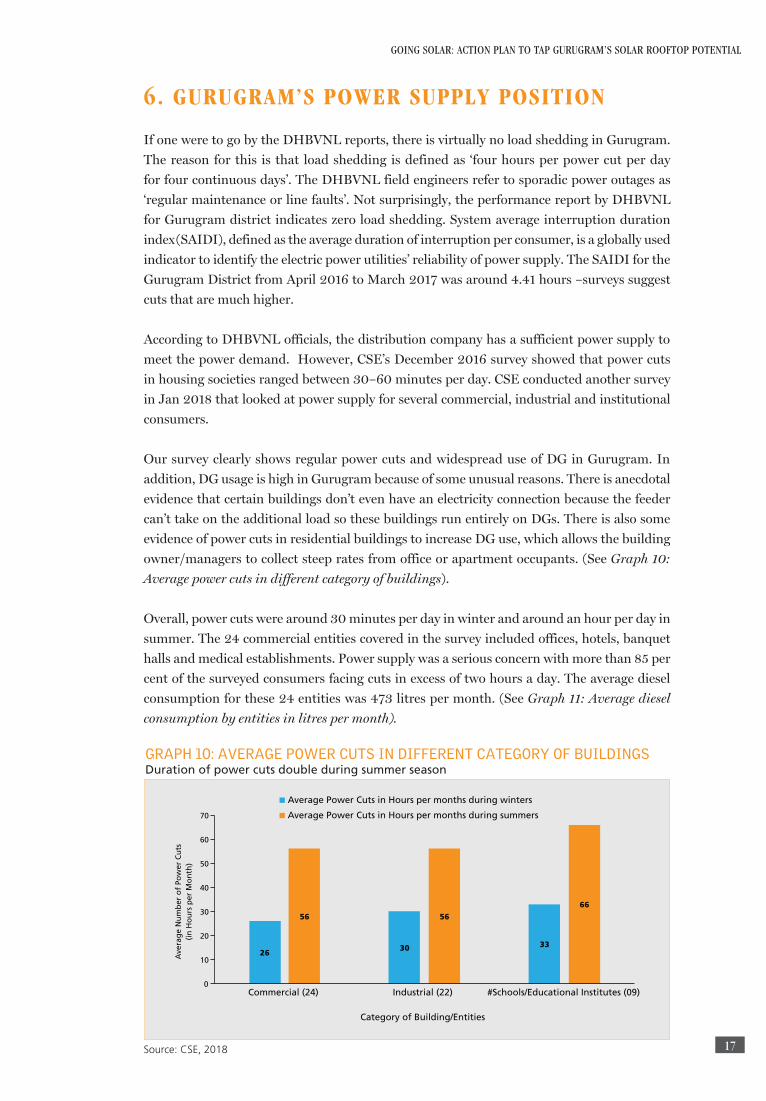
Overall, power cuts were around 30 minutes per day in winter and around an hour per day in
summer. The 24 commercial entities covered in the survey included offices, hotels, banquet
halls and medical establishments. Power supply was a serious concern with more than 85 per
cent of the surveyed consumers facing cuts in excess of two hours a day. The average diesel
consumption for these 24 entities was 473 litres per month. (See Graph 11: Average diesel
consumption by entities in litres per month).
26 30 33
56 56
66
0
10
20
30
40
50
60
70
Commercial (24) Industrial (22) #Schools/Educational Institutes (09)
Ave
rag
e N
um
ber
of
Pow
er C
uts
(i
n H
ou
rs p
er M
on
th)
Category of Building/Entities
Average Power Cuts in Hours per months during winters
Average Power Cuts in Hours per months during summers
GRAPH 10: AVERAGE POWER CUTS IN DIFFERENT CATEGORY OF BUILDINGS Duration of power cuts double during summer season
Source: CSE, 2018
18
GOING SOLAR: ACTION PLAN TO TAP GURUGRAM’S SOLAR ROOFTOP POTENTIAL
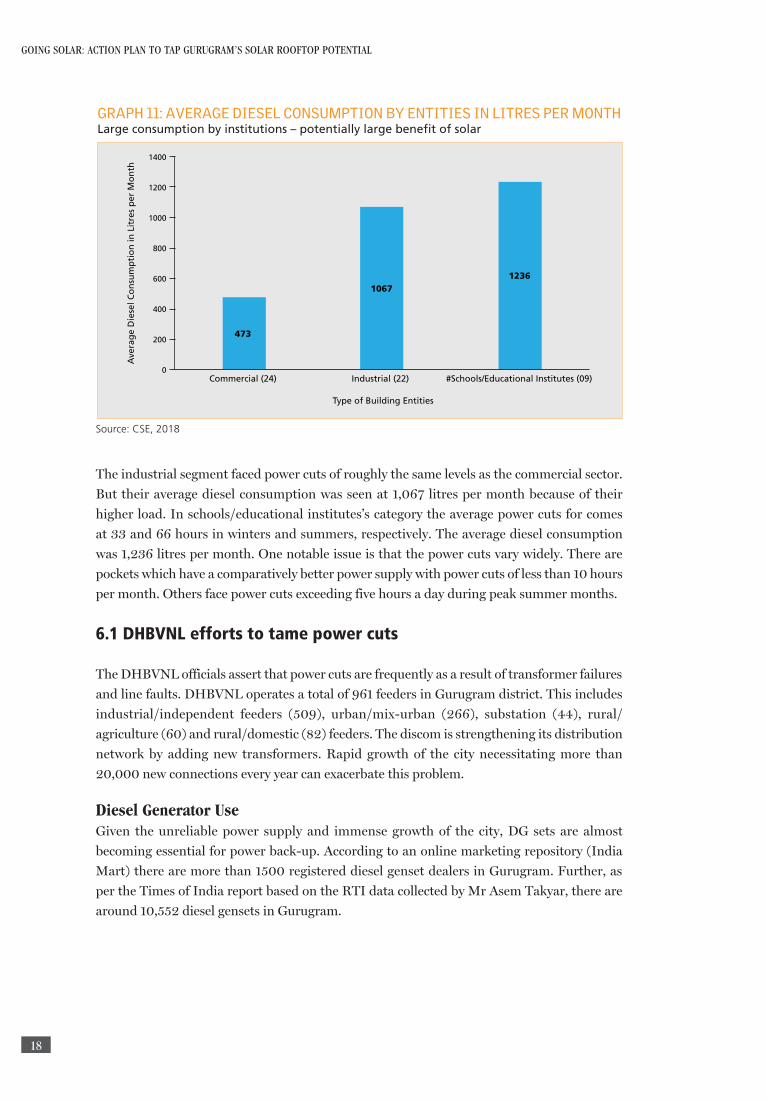
The industrial segment faced power cuts of roughly the same levels as the commercial sector.
But their average diesel consumption was seen at 1,067 litres per month because of their
higher load. In schools/educational institutes’s category the average power cuts for comes
at 33 and 66 hours in winters and summers, respectively. The average diesel consumption
was 1,236 litres per month. One notable issue is that the power cuts vary widely. There are
pockets which have a comparatively better power supply with power cuts of less than 10 hours
per month. Others face power cuts exceeding five hours a day during peak summer months.
6.1 DHBVNL efforts to tame power cuts
The DHBVNL officials assert that power cuts are frequently as a result of transformer failures
and line faults. DHBVNL operates a total of 961 feeders in Gurugram district. This includes
industrial/independent feeders (509), urban/mix-urban (266), substation (44), rural/
agriculture (60) and rural/domestic (82) feeders. The discom is strengthening its distribution
network by adding new transformers. Rapid growth of the city necessitating more than
20,000 new connections every year can exacerbate this problem.
Diesel Generator UseGiven the unreliable power supply and immense growth of the city, DG sets are almost
becoming essential for power back-up. According to an online marketing repository (India
Mart) there are more than 1500 registered diesel genset dealers in Gurugram. Further, as
per the Times of India report based on the RTI data collected by Mr Asem Takyar, there are
around 10,552 diesel gensets in Gurugram.
473
1067 1236
0
200
400
600
800
1000
1200
1400
Commercial (24) Industrial (22) #Schools/Educational Institutes (09)
Ave
rag
e D
iese
l Co
nsu
mp
tio
n in
Lit
res
per
Mo
nth
Type of Building Entities
GRAPH 11: AVERAGE DIESEL CONSUMPTION BY ENTITIES IN LITRES PER MONTHLarge consumption by institutions – potentially large benefit of solar
Source: CSE, 2018

19
GOING SOLAR: ACTION PLAN TO TAP GURUGRAM’S SOLAR ROOFTOP POTENTIAL
7. EXISTING POLICIES FOR SOLAR ROOFTOP IN HARYANA
The state Government of Haryana (HAREDA order dated 21st March 2016) has made it
mandatory for certain category of buildings to instal solar rooftop power plants. Quantum of
sanctioned load (in kW) has been used to determine the minimum solar rooftop installation
that is required for all commercial, industrial and institutional consumers. For the residential
consumers, plot area has been used in addition to the connected load to determine required
rooftop installation. However, rooftop systems are required for only new residential buildings
(See Annexures).
According to the HAREDA order, authorities such as Town and Country Planning Department/
HUDA, Municipal Corporation, HSIIDC and various government departments (police, PWD
etc) are responsible for ensuring that these mandates are complied with. These agencies were
required to incorporate within three months relevant provision in their departmental bye-
laws to facilitate the implementation of the rooftop order. However, many of them have not
done so. In fact survey of consumers revealed that the relevant government body had not even
informed them about the requirement. None of these implementing agencies were monitoring
installation let alone taking action to enforce the HAREDA mandate.
7.1 Government schemes
The Haryana government has invited tenders for installing around 50 MW of solar rooftop
system in various government departments and buildings. The Delhi Metro Rail Corporation
(DMRC) has also taken initiatives to DMRC instal solar plants under the power purchase
agreement (PPA) mode. For instance, they have signed a 25-year PPA agreement with solar
energy developer for the plant at HUDA City Centre metro station. Although the quantum of
the power generated through this program will be limited, such initiatives go a long way in
promoting visibility for the consumers in Gurugram.
In the recent months, two state government departments of Haryana—Health and Education—
have floated tenders for commissioning of solar off-grid power plants. The health department
plans to instal solar PV system of 5 and 10 kW capacities at primary and community health
centres (PHC and CHC) in Haryana. It is a significant step as it will aggregate around 1,650
kW or 1.65 MW of solar electricity. Similarly, the Department of School Education of the state
of Haryana has cleared the tendering for solar rooftop capacity for over 4,600 government
schools in the state.

20
GOING SOLAR: ACTION PLAN TO TAP GURUGRAM’S SOLAR ROOFTOP POTENTIAL
8. FUTURE POTENTIAL
Gurugram has a huge potential for solar rooftop. Although, there is no city-specific target
for rooftop solar, the Gurugram master plan, 2014, has set a goal of saving 155 million
units7(MUs) from renewable energy installation, which amounts to around 100 MW of
rooftop solar installation. As per CSEs analysis of the floor area under the Gurugram Master
Plan–2031, around 200 MW of solar rooftop can be installed just in the city.
8.1 Scope of the built area
According to the Development Plan, 2031, for the Gurugram-Manesar urban complex,
almost 50 per cent of the area has been set aside for residential development (see Graph 12:
Proposed land use in Gurugram-Manesar urban complex). According to the Haryana Urban
Development Authority (HUDA), 8,000 hectares of residential sector has been developed in
Gurugram and an additional 8,000 hectares would be used by the residential sector. The new
residential sector, when developed, will have more than 800 MW potential rooftop capacity
based on fairly conservative estimates of rooftop use. There are another 13,000 hectares under
commercial, industrial, transport and communication, public utilities, and public and semi
public areas which could also be utilized significant solar rooftop capacity.
8.2 Potential based on the HAREDA order
As per the data provided by DHBVNL, out of the total 245,206 consumers there were around
6,200 commercial, industrial and institutional consumers who were required to instal a
prescribed amount of solar rooftop as per the HAREDA Orders.
Defence land 2% Open spaces
9%
Public and semi public 6%
Public utilities 2%
Transport and communication 13%
Industrial 14%
Commercial 5%
Residential 49%
Special zone 0%
GRAPH 12: PROPOSED LAND USE IN GURUGRAM-MANESAR URBAN COMPLEXAlmost half the land use has been set aside for residential development
Source: Development Plan 2031, Town and Country Planning Department, Haryana Government

21
GOING SOLAR: ACTION PLAN TO TAP GURUGRAM’S SOLAR ROOFTOP POTENTIAL
Looking at the detailed breakdown of these customers in various categories, there is a
potential of over 62 MW of solar rooftop installations. This is a low end of potential rooftop
installations.
TABLE 4: ESTIMATES OF POTENTIAL AS PER THE HAREDA ORDER62 MW rooftop potential exists as per the HAREDA order
Connected load Total load in MW
Solar mandate (min kW/ %
load)
Number of customers
Estimated roof top potential
(in MW)
Commercial 50 kW–1000 kW 334.4 10/5 3,957 21
Above 1000 kW 434.7 50/3 207 14
Industrial 50 kW–1000 kW 265 10/5 1,769 21
Above 1000 kW 156.5 50/3 69 5
Educational institutes
Above 30 kW 14.6 5/5 146 0.7
Government buildings
Above 30 kW 8.5 2/5 106 0.4
6,254 62.1
Source: DHBVN, 2018
8.2.1 Commercial/industrial segmentHAREDA’s criteria for mandatory installation of the solar rooftop for both the industrial and
commercial segment is same—customers with a sanctioned load between 50 kW–1000 kW
are required to instal solar rooftop system equalling the higher of 10 kW or 5 per cent of their
load. Customers with connections above 1,000 kW systems are required to instal solar rooftop
system which is the higher of 50 kW or 3 per cent of their load.
An industrial or commercial unit with less than 50 kW connected load is not obligated to instal
solar rooftop unit. The commercial segment has over 32,000 customers but the mandate is
applicable to only 4,164 customers, less than 15% of the total. In the industrial segment, less
than half of approximately 5,600 customers are covered by the mandate. If customers with
loads in excess of 10 kW are included, the potential rooftop would increase significantly.
Governmentbuildings
There are 106 government buildings which are required to comply with this order. As per the
laid criterion for this order, the government building section shows a limited potential of 0.27
MW. The reason for this meagre potential lies in the minimal mandate set for compliance by
the government buildings.
Privateeducationalinstitutes
Private educational/training institutes that have connected load exceeding 30KWas
per DHBVN data, need to comply with the HAREDA order. The estimated potential for
this segment is only to 0.78 MW. However, it is likely that some of these customers have
been classified under commercial and their potential has been captured in that category.
Educational institutes are prime candidates for installing lot more than 5 per cent.
22
GOING SOLAR: ACTION PLAN TO TAP GURUGRAM’S SOLAR ROOFTOP POTENTIAL
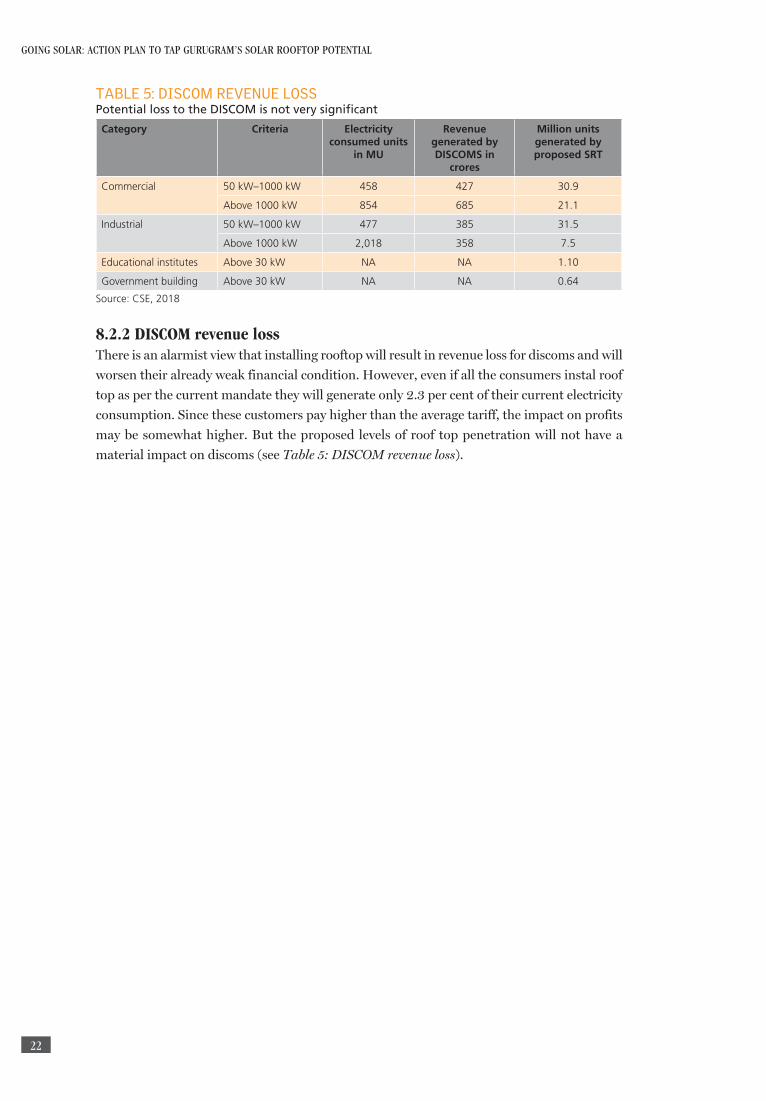
TABLE 5: DISCOM REVENUE LOSSPotential loss to the DISCOM is not very significant
Category Criteria Electricity consumed units
in MU
Revenue generated by DISCOMS in
crores
Million units generated by proposed SRT
Commercial 50 kW–1000 kW 458 427 30.9
Above 1000 kW 854 685 21.1
Industrial 50 kW–1000 kW 477 385 31.5
Above 1000 kW 2,018 358 7.5
Educational institutes Above 30 kW NA NA 1.10
Government building Above 30 kW NA NA 0.64
Source: CSE, 2018
8.2.2 DISCOM revenue lossThere is an alarmist view that installing rooftop will result in revenue loss for discoms and will
worsen their already weak financial condition. However, even if all the consumers instal roof
top as per the current mandate they will generate only 2.3 per cent of their current electricity
consumption. Since these customers pay higher than the average tariff, the impact on profits
may be somewhat higher. But the proposed levels of roof top penetration will not have a
material impact on discoms (see Table 5: DISCOM revenue loss).

23
GOING SOLAR: ACTION PLAN TO TAP GURUGRAM’S SOLAR ROOFTOP POTENTIAL
9. COMPLIANCE WITH THE HAREDA ORDER
According to the HAREDA order, over 6,200entities—whose connected load capacity is more
than 30 kW (institutional) or more than 50 kW (industrial/commercial segment)—were
supposed to instal solar rooftop systems. However, as per the data provided by DHBVNL’s
metering and protection (M&P) report, only 254entities have applied for the net-metering
connection. Of these, only 83 are industrial and commercial customers. Another 199 industrial
and commercial entities have installed off-grid solar. Taken together it is a small fraction of
the number of consumers that were required to instal solar rooftop.
The HAREDA order had asked the discoms to disconnect the electricity connections— a
severe and perhaps impractical measure—in the event of non-compliance of this order within
six months after serving due notice on expiry of the deadline. DHBVNL officials claim that
technical glitches at state DISCOMs inhibited smooth net-metering and administrative
services; therefore the penal provision was withdrawn by the State discom DHBVNL in June
2017. However, this reasoning seems to be self-serving. Discoms are not keen to disconnect
electricity for consumers who are paying bills and have been accused of slow net metering
approval process; therefore, they seem to be more than willing to give up the enforcement
tools they were given.

24
GOING SOLAR: ACTION PLAN TO TAP GURUGRAM’S SOLAR ROOFTOP POTENTIAL
10. IMPLEMENTATION CHALLENGES
HAREDA’s order for mandatory SRT installation across industrial, commercial and new
residential apartments has had limited impact so far. This is partly due to the reluctance
among consumers across residential, commercial and industrial categories to instal rooftop
panels due to many reasons, and partly it is due to the government’s failure in ensuring effective
implementation of net metering policy and HAREDA’s mandate. Implementation has been
further derailed due to inadequate avenues for raising low-cost funds and an underdeveloped
RESCO market.
Consumerreluctance:Consumers in Gurugram (like in the rest of the country) have been
reluctant to adopt SRT plants due their unwillingness/inability to invest in high cost panels,
limited trust in technology and a lack of effective incentives.
• High upfront costs (Rs 50,000–Rs 60,000 per kW) make an SRT installation impractical
for households even with a 30 per cent subsidy. Commercial and industrial consumers shy
away from spending large amounts on a non-core business activity.
• Perceived technology risk—Consumers are unsure about reliability of technology, perfor-
mance and life of panels.
• Doubts exist regarding the expertise and credibility of rooftop installers as most are small
in size with limited track record. Concerns over operations and maintenance over the
20–25 year lifetime.
• Reluctance to use rooftop space, a valuable asset in India, for installing solar panels.
• Unsuitability of industrial rooftops which are often unstable and lightweight. Reluctance
to incur additional cost for making structural changes to accommodate solar panels.
• Limited knowledge regarding government programmes, subsidy availability, eligibility
and application process. Fear of bureaucratic hassle and red-tape while availing govern-
ment programmes.
• Doubts regarding net metering—Efficiency of implementation, ambiguity over future tar-
iff rates and associated commercial benefits.
Governanceissues:There has been a serious lapse in communication as a sizable portion
of the target consumer segment has limited knowledge of the HAREDA mandate. In fact,
senior officials in certain nodal agencies also remain unaware of the order or of their role in
implementing it. Most agencies have not even amended their bylaw to ensure compliance
to the mandate. There is a complete lack of co-ordination among various departments and
agencies. Monitoring mechanisms have not been put in place to track compliance and penalize
non-compliance.
10.1 Issues specific to leading implementation agencies
HAREDA’s Gurugram office • Limited staff (of two officers) and resources allocated for implementing 120 MW plus of
SRT mandate
• Lack of capacity to engage in strategic activities—Communication with other depart-
ments, advising interested ones, coordinating with stakeholders to build customer aware-
ness, monitoring and reporting progress etc.
• Unable to identify and target consumers included in the HAREDA mandate due to in-
complete/non-existent data set/contact information.

25
GOING SOLAR: ACTION PLAN TO TAP GURUGRAM’S SOLAR ROOFTOP POTENTIAL
DHBVNL• Reluctance to SRT promotion/support—Incremental task with no commercial benefits.
In fact, clear dis-incentive due to resulting migration of high-paying consumers.
• Missing systems and processes for effective net metering implementation—Long time
taken for net metering application processing and approval, inadequate sourcing of bi-di-
rectional meters, inadequate transformer capacity for net-metering, and faulty billing due
to software-hardware of glitch, etc.
• Inadequate workforce and technical capacity of staff across three junior tiers (SDO/JE,
lineman and meter reader).
• Withdrawal of penalty to enforce compliance (disconnection of power supply of custom-
ers that have not installed rooftop solar).
Other nodal agencies• Most state nodal agencies, including Haryana State Industrial and Infrastructure De-
velopment Corporation (HSIIDC), have not incorporated mandatory SRT provisions in
respective customer categories as per the HAREDA order.
• Only T&CP and MCG have incorporated clause of additional floor area ratio (FAR) for
new buildings with SRT, primarily because customers (builders) started asking for it.
However, the monitoring and penalty mechanism has not been specified for possible de-
fault by such consumers.
10.2 Inadequate funding sources
Lack of low-cost funding is a major impediment for all consumer categories for the large scale
adoption of SRT. Government has taken measures to support SRT installations in residential
segment though concessional housing loan, which has not taken off due to perceived
development, operations and performance risks. Some of the key financial/market related
impediments are:
• Banks and FIs are not keen to lend for solar rooftop projects on a standalone basis. Large
industrial and commercial firms may be able to raise money on their financial strength
but they may hesitate to divert funds that they can use for their business.
• Banks may lend to homeowners against property but homeowners may not be keen on
the upfront investment in solar rooftop. Banks are unlikely to extend loan to residential
society for rooftop project
• RESCOs are unwilling to serve small/residential consumers and enter into long term
PPAs with them due to their unknown credit profile and lower profitability. RESCOs are
also unwilling to take the risk of having to repossess rooftop equipment if the customer
defaults.
• Limited bank debt financing available to RESCOs, especially if they increase their expo-
sure to the consumer segment.

26
GOING SOLAR: ACTION PLAN TO TAP GURUGRAM’S SOLAR ROOFTOP POTENTIAL
11. SOLAR FINANCING
Limited access to low cost finance presents a huge barrier for SRT growth. Overall, funding
requirement for meeting the national target of installing 40 GW of SRT systems by 2022 is
massive—estimated to be over Rs 2.8 lakh crore.
There are clear benefits in encouraging households to instal rooftop solar systems relative to
large scale renewable such as financial benefits to households, reduced T&D losses, energy
independence and perhaps even grid stability given demand matching at source. However,
sizable installation (in existing capacity terms) as well as future focus appears to be towards
larger scale (commercial, industrial and institutional). Clear evidence of this is the 5 GW
of SRT target set for the residential sector, despite its high potential, under the draft solar
rooftop scheme (SRISTI) against the commercial and industrial (C&I) sector target of 20 GW.
Funding is an important barrier to SRT adoption among households. Even for installing 5
GW of residential SRT capacity, an aggregate investment of Rs 35,000 crore will be required.
Capital subsidy support from the government of 30 per cent will cover about Rs 10,500 crores
of this cost; households will be required to raise the remaining Rs 24,500 crore, which will
need to come from bank.
In recent years, the government has taken steps to improve availability of debt for SRT
projects. The Reserve Bank of India has identified SRT as a priority sector for lending. Eight
public sector banks have included SRT systems under the housing or housing improvement
loans. Significantly, multilateral banks are providing concessional loans against sovereign
guarantee to public sector banks to support subsidized lending to the segment. In 2017, the
collective lending from World Bank, Asian Development Bank and New Development Bank
to State Bank of India, Punjab National Bank and Canara Bank for SRT financing was $1.4
billion.8
However, despite improving availability of low cost bank loans, residential consumers are
likely to be reluctant to take sizable loan to set up rooftop plant. Given this scenario, renewable
energy service companies (RESCOs) are best positioned to serve the residential SRT market.
RESCOs instal, own and operate SRT assets at consumer premises, and sell the generated
power to the consumers under a long-term PPA. Such a business arrangement shifts a number
of the risks from the consumers to the developer—including that of high initial financial burden
and development, performance, and O&M risks—who are better positioned to manage these.
The RESCOs raise funds (debt or equity), and instal, own and operate SRT assets. These
companies may undertake the entire range of activities—market their services; assess
customer’s credit risk, enter into a long term contract to supply power, set up roof top plant,
maintain and operate it for the life of the deal, bill customer and collect payment.
At present, there is a limited penetration of the RESCO model. Nearly 84 per cent of India’s
estimated SRT capacity of 1.25 GW (as of December 2016) is set up through the capital
expenditure (CAPEX) model of self financing,9 while the remaining 16 per cent is put up by
RESCOs. Furthermore, even this small share is focused on large consumers. Commercial and

27
GOING SOLAR: ACTION PLAN TO TAP GURUGRAM’S SOLAR ROOFTOP POTENTIAL
industrial consumers are showing a preference for RESCOs (either through PPAs or rooftop
leasing or PV system leasing) due to the capping of accelerated development benefit at 40 per
cent since April 2017 (in addition to the advantages of transfer of technology and performance
risk).
Government institutions are also signing PPAs with RESCOs to avoid upfront investments.
BNEF estimates that over 70 per cent of the 1 GW of SRT projects auctioned by various
government bodies in the first nine months of 2017 were awarded to RESCOs.10
RESCOs have generally stayed away from domestic consumers due to high risks associated
with enforceability of PPAs, difficulty in repossessing rooftop assets in case of default and
assessing customer credit risk.
So far RESCOs have primarily raised the funding from equity sources. However, their success
going forward will depend on their capacity to raise funding from banks and other FIs at
reasonable rates. Third party financing is one of the key drivers for SRT growth in major
markets, especially in the US. It helps resolve some of the key investment barriers—high
upfront costs, low debt access of individual consumers, and development and operation risks.
For growth in the segment to pick up, urgent measures are needed to improve debt availability
to RESCOs, implementation efficiency of net metering policies and the effectiveness of
consumer credit assessment:
• To increase debt availability, capacity of banks and FIs should be built to evaluate SRT
project applications. Standardized financing products, instruments and guidelines should
be put in place to allow easy access to debt and reduce cost of transactions.
• To ensure payment security for RESCO, discoms need to be made business partners.
Existing capabilities of discoms can easily be leveraged for various services, such as sale
support, customer aggregation and even O&M of assets. Discom consumer data on load
patterns and payment history can also help RESCOs in optimum system sizing and as-
sessing off-taker credibility.
• Discoms can play a vital role in managing customer risk for RESCOs by billing and col-
lecting on behalf of RESCO. Essentially, the consumer’s bill would have two compo-
nents—one for the electricity supplied by the discom and another for the supply by the
RESCO. Discom must be compensated appropriately for providing these services.
• To reduce credit risk, repossession of SRT assets in case of default needs to be made
simpler and easier. This can be achieved through standardized PPAs and enforcement
by local specialized courts to fast track dispute resolution. However, this will remain
challenging given India’s legal system.
• Develop and implement consistent net metering policies across all states. Further, dis-
coms must be incentivized to effectively implement net metering though higher RPO
credit or stronger penalties.
SecuritizationofSRTprojects:The bond market provides an alternative source for raising
funds for installation of SRT systems, which can be developed over the coming years. Raising
low cost funds through the bond market would require aggregation of credit-worthy SRT
projects by a financial aggregator to sufficiently increase the deal size. For instance, the
aggregate funding requirement of 1,000 customers for setting up 5 kW installations each

28
GOING SOLAR: ACTION PLAN TO TAP GURUGRAM’S SOLAR ROOFTOP POTENTIAL
would be around Rs 30 crores, which can be raised from the bond market. Private investment
facilities can be set up to aggregate projects and raise funds through the green bonds market.
Alternatively, municipal entities can be trusted with this responsibility through municipal
bonds.
Municipalities have several advantages in their potential role as finance aggregators for SRT
projects due to defined institutional goals under the solar city programme; and better access
to debt capital market compared to developers due to larger balance sheets, superior credit
profiles and diverse revenue sources. However to make securitization of SRT projects possible
through municipalities or even private finance aggregators, innovative transaction structures
would need to be developed.
29
GOING SOLAR: ACTION PLAN TO TAP GURUGRAM’S SOLAR ROOFTOP POTENTIAL
12. ACTION PLAN
Successful implementation requires a fair amount of support from the state level including
policy changes, budgetary support etc. In this document we will try to focus on steps that
district level officials need to take:
1. Based on the Haryana RE goals and Gurugram’s master plan, a clear rooftop target and
timelines with annual targets need to be established. We believe solar rooftop installations
of 200MW by 2022 are achievable.
2. Targets for the government are low and need to be increased by at least 3–4 times. It is
essential that the government leads from the front since it will help the government un-
derstand firsthand the administrative bottlenecks and market/installer pitfalls.
3. A nodal office headed by the Deputy Commissioner should co-ordinate efforts between
different key implementation departments—MCG, HUDA/Town and Country planning,
DHBVNL, HSIIDC—and also monitor progress.
4. HAREDA, with assistance from DHBVNL and other govt departments needs to prepare
an exhaustive list of consumers who are required to instal solar rooftop as per the order
and also current installations.
5. All implementing departments need to incorporate the HAREDA order into their guide-
lines/orders within 90 days which should be sent to the relevant consumers within 30
days. Agencies should confirm this to the DC office.
6. Consumer grievance cell, preferably in DC office, should be established at least till the
teething problems associated with subsidy approval, net metering connection, billing
issues, installers/panel quality etc., are sorted out. The cell should have a mix of retired
judicial officers, technical people and representatives from the DC office, HAREDA and
DHBVNL to quickly resolve such issues.
RESCO model promotionDHBVNL can play a key role in supporting the RESCO model, which in turn can resolve
financing issues, especially for the residential sector. HAREDA can empanel RESCOs based
on a certain criteria (financial strength, consumer feedback, installed capacity etc.). DHBVNL
may enter into an agreement with RESCOs to collect their dues from customers (based on
PPAs that the RESCOs have signed) along with the discom’s electricity bills. DHBVNL can
provide this service for a fee (say 10 to 25 paisa per unit). Residential societies are unlikely to
default on their electricity bills, which makes it easier for RESCO to offer their services to the
residential sector.
Incentives and penalties1. HAREDA’s order empowers discoms to disconnect electricity in case of non-compliance.
The provision is too harsh to be practical and has actually been withdrawn by DHBVNL.
One option is to have a monetary penalty that increases over time—say Rs 125 per KW
of mandated solar capacity per month after a six-month delay (roughly translates to just
under Rs 1 per unit of expected solar generation), Rs 250/KW after 12 months, and Rs
500/KW after 2 years.
2. According to the HERC order an incentive of Rs 1/kWh was given by the discoms starting
from August 2016, till March 2017, an. As per the latest discussion paper of HERC these
incentives are further recommended for an extension.
3. HERC’s 2018 RE tariff paper suggests several incentives for solar rooftop under net meter
such as: a) Banking facility to carry forward of excess energy generation from one billing

30
GOING SOLAR: ACTION PLAN TO TAP GURUGRAM’S SOLAR ROOFTOP POTENTIAL
cycle to the next billing cycle and also to the next financial year, b) exemption of wheeling
and cross subsidy charges, c) permit sale of electricity to utilities should be exempted, d)
allow solar rooftop capacity of up to 100 per cent of transformer capacity, d) customers
be allowed to instal more than their sanctioned load.
4. Approvals by various authorities—consent to operate by PCB, license by HSIIDC, occu-
pancy certificate/completion certificate by HUDA/municipal authorities.
Awareness building programPublic awareness is considered to be one of the biggest impediments in development of solar
in Gurugram. A number of officials and RWA representatives and PV installers believe lack
of public awareness is one of the biggest impediments in the spread of solar rooftop. This
view is supported by the fact that solar rooftop installations are dominated by the industrial/
commercial sector and even within the residential sector in larger, well-off societies.
1. After Gurugram announced its vision to become a solar city, MNRE gave a Rs 47 lakh
financial assistance out of which Rs 20 lakh were to be used for promotional activities,
trainings, workshops and study tours within the first three years. Not much appears to
have been spent.
2. Gurugram is home to many large companies that can be persuaded to use CSR obligations
to promote solar.
3. Gurugram also has a very active civil society interested in environmental issues. HAREDA
should actively solicit their cooperation to push rooftop in residential buildings.
4. HAREDA/HSIIDC must also engage with industry associations like local wings of CII,
FICCI, ASSOCHAM and trade groups.
5. Gurugram is home to many renewable energy companies that are focussed on large scale
solar. HAREDA should encourage them to participate in local rooftop market—their in-
puts on issues that are blocking rooftop growth could help accelerate growth.
HAREDA1. The organization needs to add far more people to pay an effective role in coordinating,
monitoring and creating awareness, none of which are currently possible given the orga-
nization appears to be overwhelmed with the approval of rooftop applications.
2. Monitoring and reporting—an online portal should be created and reports from all agen-
cies as well as consolidated reports can be posted. The portal should have a) list of all con-
sumers and capacity they need to instal, b) quarterly progress report by various agencies
and a consolidated report by HAREDA. The report can act as a source of information and
give a positive message to the consumers.
3. Awareness about the program by organization of solar mela or camps by the coordination
of various stakeholders.
4. Assistance in bid documents contract writing for certain govt offices—police, hospitals,
schools etc.
DHBVNLDHBVNL’s top management needs to be on board to aggressively push solar rooftop, the pro-
posed SRISTI scheme, notwithstanding its shortcomings, incentivizes discoms for promoting
solar and partly compensates them for the potential revenue loss.
1. Smoothening of net-metering process—approval of application, purchase and connec-
tions and removal of billing glitches are urgently needed. Management should establish
timelines (less than 30 days to approve and install net meter) and monitor actual perfor-
mance.
31
GOING SOLAR: ACTION PLAN TO TAP GURUGRAM’S SOLAR ROOFTOP POTENTIAL
2. Training of staff especially of engineers/technicians as well as staff involved in approval
of net metering applications so they are fully conversant with the net metering process.
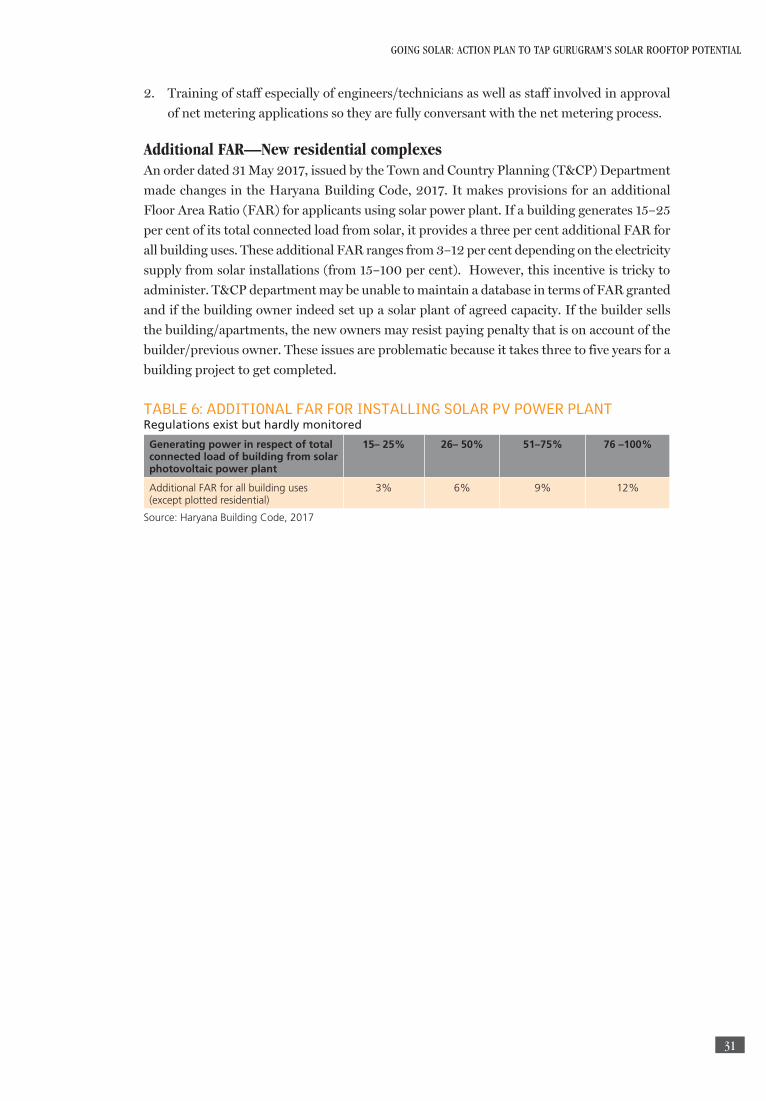
Additional FAR—New residential complexesAn order dated 31 May 2017, issued by the Town and Country Planning (T&CP) Department
made changes in the Haryana Building Code, 2017. It makes provisions for an additional
Floor Area Ratio (FAR) for applicants using solar power plant. If a building generates 15–25
per cent of its total connected load from solar, it provides a three per cent additional FAR for
all building uses. These additional FAR ranges from 3–12 per cent depending on the electricity
supply from solar installations (from 15–100 per cent). However, this incentive is tricky to
administer. T&CP department may be unable to maintain a database in terms of FAR granted
and if the building owner indeed set up a solar plant of agreed capacity. If the builder sells
the building/apartments, the new owners may resist paying penalty that is on account of the
builder/previous owner. These issues are problematic because it takes three to five years for a
building project to get completed.
TABLE 6: ADDITIONAL FAR FOR INSTALLING SOLAR PV POWER PLANTRegulations exist but hardly monitored
Generating power in respect of total connected load of building from solar photovoltaic power plant
15– 25% 26– 50% 51–75% 76 –100%
Additional FAR for all building uses (except plotted residential)
3% 6% 9% 12%
Source: Haryana Building Code, 2017

32
GOING SOLAR: ACTION PLAN TO TAP GURUGRAM’S SOLAR ROOFTOP POTENTIAL
ANNEXURES
TABLE 7: MANDATE FOR ROOFTOP SOLAR PV INSTALLATIONS. No. Category of buildings/area Qualification Size of the system
1 New residential buildings Built on a plot size of 500square yards
Minimum 1 KWpor5% of sanctioned load,whichever is higher
2 Private educational institutes Sanctioned load of 30 KW and above
Minimum 5 KWpor5% of sanctioned load,whichever is higher
3 Government buildings and offices Sanctioned load of 30 KW and above
Minimum 2 KWpor5% of sanctioned load,whichever is higher
4 Private hospitals and nursing homes, industrial establishments, commercial establishments
Sanctioned load of 50 KW to 1000 KW
Minimum 10 KWpor5% of connected load, whichever ishigher
Sanctioned load above 1000 KW
Minimum 50 KWpor3% of sanctioned load, whichever is higher
Source: Haryana Government Renewable Energy Department
TABLE 8: CRITERIA MENTIONED BY HAREDA ORDER FOR MINIMUM SOLAR INSTALLATION REQUIRED FOR THE NEW RESIDENTIAL SEGMENT
All new residential buildings Above 500 square yard plot size
1kW/5% of the sanctioned load
All new housing complexes
A 0.5–1 Acre 10 kW
B 1–2 Acre 20 kW
C 2–5 Acre 30 kW
D Above 5 Acre 40 kW
Source: HAREDA

33
GOING SOLAR: ACTION PLAN TO TAP GURUGRAM’S SOLAR ROOFTOP POTENTIAL
REFERENCES
1. http://www.iea.org/publications/freepublications/publication/MTRMR2016.pdf, as accessed on .
2. “Beehives or Elephants? How should India drive its Solar Transformation”, Bridge to India, 2014, New Delhi.
3. Priyavrat Bhati and Rajan Kalsotra 2017, Solar Rooftop: Replacing diesel generators in residential societies, Centre for Science and Environment, New Delhi
4. Haryana Renewable Energy Development Agency, HAREDA (2018)
5. Emiliano Bellini. Israel to reintroduce FITs for rooftop PV up to 50 kW, December 21, 2017
6. https://www.pv-magazine.com/2017/12/21/israel-to-reintroduce-fits-for-rooftop-pv-up-to-50-kw/
7. https://mercomindia.com/development-banks-loaned-indian-solar-rooftops-2017/
8. “India Solar Handbook 2017”, Bridge to India, New Delhi.
9. Accelerating India’s Clean Energy Transition, Bloomberg New Energy Finance, November 2017
10. “Solar Rooftop Policy Coalition: Unleashing Private Investment in Rooftop Solar in India”, The Climate Group, 2015, New Delhi.

34
GOING SOLAR: ACTION PLAN TO TAP GURUGRAM’S SOLAR ROOFTOP POTENTIAL


36
GOING SOLAR: ACTION PLAN TO TAP GURUGRAM’S SOLAR ROOFTOP POTENTIAL
Centre for Science and Environment41, Tughlakabad Institutional Area, New Delhi 110 062, India Ph: +91-11-40616000 Fax: +91-11-29955879E-mail: [email protected] Website: www.cseindia.org