
Goals and Objectives of this Module - Universität zu Köln
76
0
Transcript of Goals and Objectives of this Module - Universität zu Köln

0
Goals and Objectives of this ModuleOverview
This module:
• Describes how defining a soil characterization site supports scientific understanding of the Earth system
• Provides step-by-step instructions in how to characterize soils using this GLOBE protocol
Learning Objectives
After completing this module, you will be able to:
• Explain why soil characteristics are important
• Conduct soil characterization steps
• Report these data to GLOBE
• Visualize these data using GLOBE’s Visualization Site
Estimated time needed for completion of this module: 1.5 hours 1

Why is defining soil characteristics important?
Soil characterization is a fundamental stepin describing and analyzing soil as part ofthe Earth system. The characteristics youidentify will help to explain the role of thesoil in exchanging matter and transferringenergy with the atmosphere, biosphereand hydrosphere.
Soil characterization measurements aretaken for many reasons, including:
• supporting the interpretation of soilmoisture and temperature, land cover,and atmosphere measurements;
• complementing and extending landcover mapping;
• developing soil maps of a region; and
• providing information for computermodeling.
Image: Jenn Glaser and Russanne Low
2
Introduction to Soil Characterization
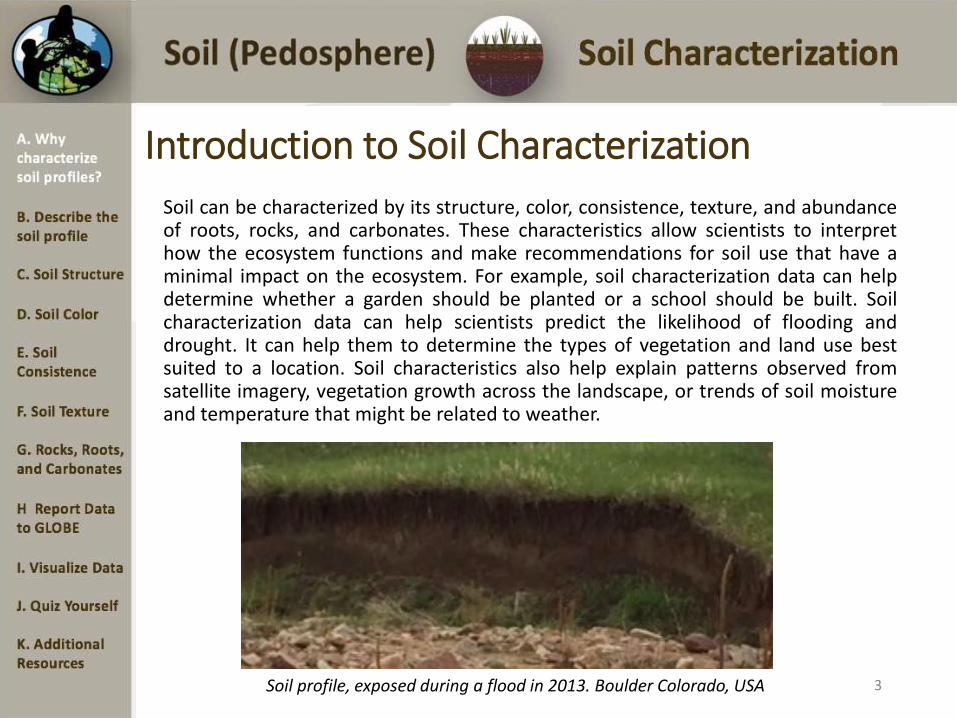
Soil can be characterized by its structure, color, consistence, texture, and abundanceof roots, rocks, and carbonates. These characteristics allow scientists to interprethow the ecosystem functions and make recommendations for soil use that have aminimal impact on the ecosystem. For example, soil characterization data can helpdetermine whether a garden should be planted or a school should be built. Soilcharacterization data can help scientists predict the likelihood of flooding anddrought. It can help them to determine the types of vegetation and land use bestsuited to a location. Soil characteristics also help explain patterns observed fromsatellite imagery, vegetation growth across the landscape, or trends of soil moistureand temperature that might be related to weather.
Soil profile, exposed during a flood in 2013. Boulder Colorado, USA 3
Overview of Protocol
Time: Preparation: 2-3 45 minute class sessionsField: 90 minutes
Experience Level: All
Frequency:Soil characterization measurements are taken once for a specific soil site. Collected samples can be stored for study and analysis at another time during the school year.
Prerequisites:Selecting and Defining a Site for Soil Characterization Protocols: Exposing a Soil Profile
Documents: Soil Characterization ProtocolSite Definition Sheet
4
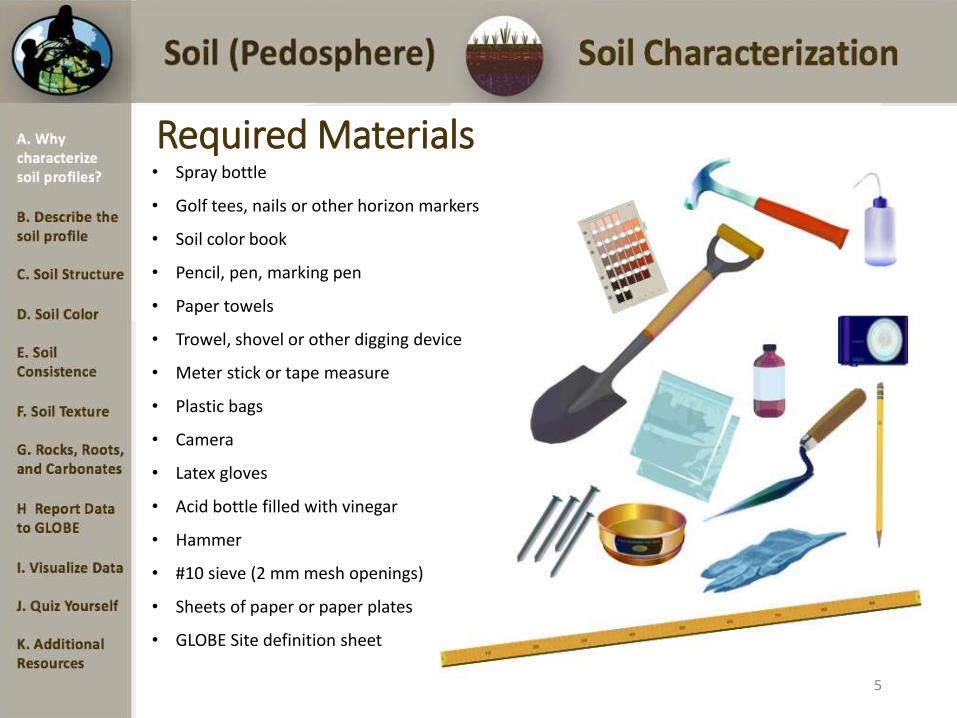
Required Materials• Spray bottle
• Golf tees, nails or other horizon markers
• Soil color book
• Pencil, pen, marking pen
• Paper towels
• Trowel, shovel or other digging device
• Meter stick or tape measure
• Plastic bags
• Camera
• Latex gloves
• Acid bottle filled with vinegar
• Hammer
• #10 sieve (2 mm mesh openings)
• Sheets of paper or paper plates
• GLOBE Site definition sheet
5
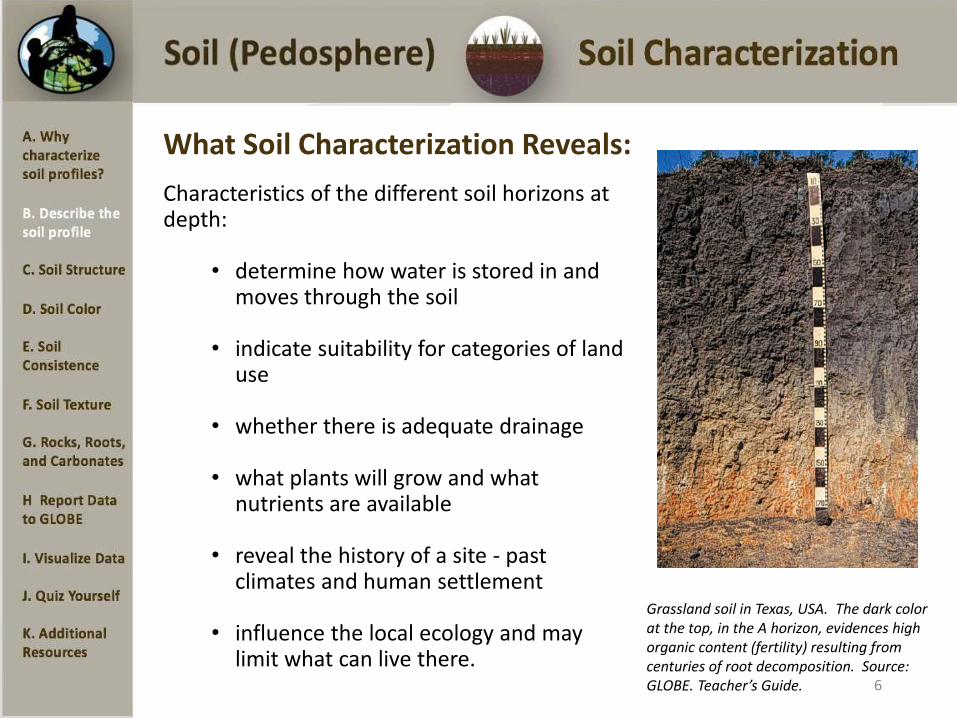
What Soil Characterization Reveals:
Characteristics of the different soil horizons at depth:
• determine how water is stored in and moves through the soil
• indicate suitability for categories of land use
• whether there is adequate drainage
• what plants will grow and what nutrients are available
• reveal the history of a site - past climates and human settlement
• influence the local ecology and may limit what can live there.
Grassland soil in Texas, USA. The dark color at the top, in the A horizon, evidences high organic content (fertility) resulting from centuries of root decomposition. Source: GLOBE. Teacher’s Guide. 6

Characterization of an Exposed Soil Profile
Follow the instructions in the Selecting, Exposing,and Defining a Soil Characterization Protocol toexpose a soil profile for characterization.
These instructions apply to an exposed profilefound in a road cut or erosional feature, as wellas profiles exposed using the Pit method. Thismethod is adapted for profiles exposed using theAuger Method and will follow.
Starting from the top, observe the profile todetermine properties and differences betweenhorizons.
7

Identifying Soil Horizons
Starting from the top, you will observe the soillooking for differences between layers.
Look for: different colors and shapes, roots,the size and amount of rocks, small darknodules (called concretions), worms or othersmall animals and insects, worm channels,and anything else that is noticeable.
To identify the top and bottom of each horizon,a golf tee or other marker is placed at eachdepth where you see a change in theappearance of the soil.
A soil layer must be at least 3 cm thick to beconsidered a Horizon. If you see a layer that isless than 3 cm thick, consider it a part of thehorizon above or below and note this in yourmetadata.
8

Identifying the First Horizon
The top or first horizon always starts at thesurface of the soil and is always measured as0 cm.
The bottom of the first horizon is where adifference in color, consistence, structure,chemistry, texture is evidenced by a change inappearance.
The bottom of one horizon is the top of thenext horizon down. So, where Horizon 1 endsis where Horizon 2 begins.
9

Identifying the Second Horizon
The top or first horizon always starts at the surface of the soil and is always measured as 0 cm.
Where the soil changes appearance is the bottom of the first horizon and the top of the second horizon.
Where the soil again changes in appearance is the bottom of the second horizon.
10
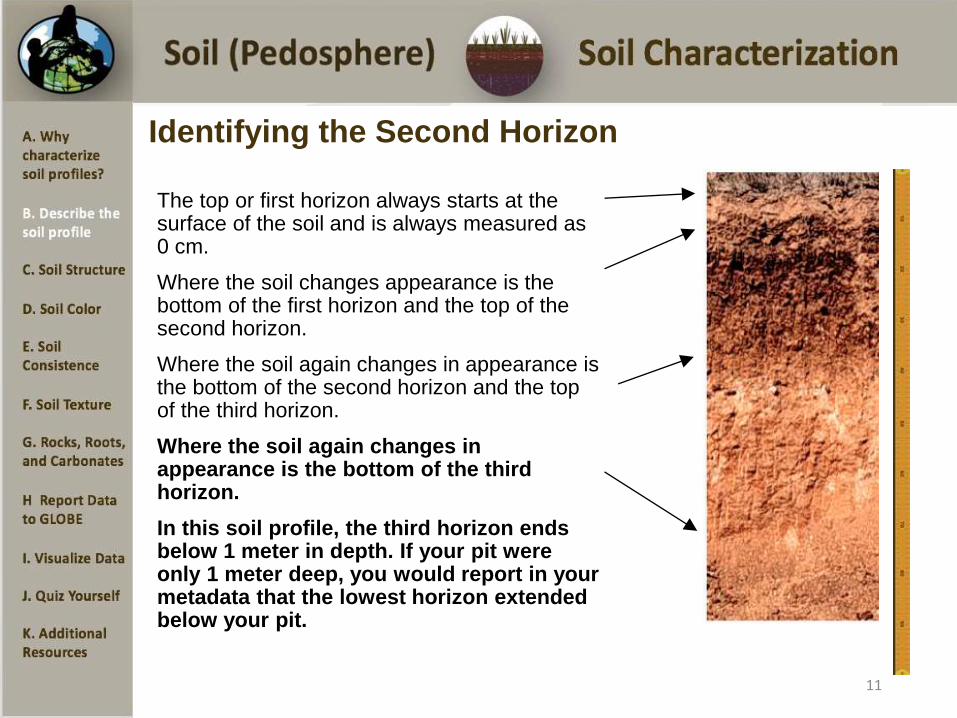
Identifying the Second Horizon
The top or first horizon always starts at the surface of the soil and is always measured as 0 cm.
Where the soil changes appearance is the bottom of the first horizon and the top of the second horizon.
Where the soil again changes in appearance is the bottom of the second horizon and the top of the third horizon.
Where the soil again changes in appearance is the bottom of the third horizon.
In this soil profile, the third horizon ends below 1 meter in depth. If your pit were only 1 meter deep, you would report in your metadata that the lowest horizon extended below your pit.
11
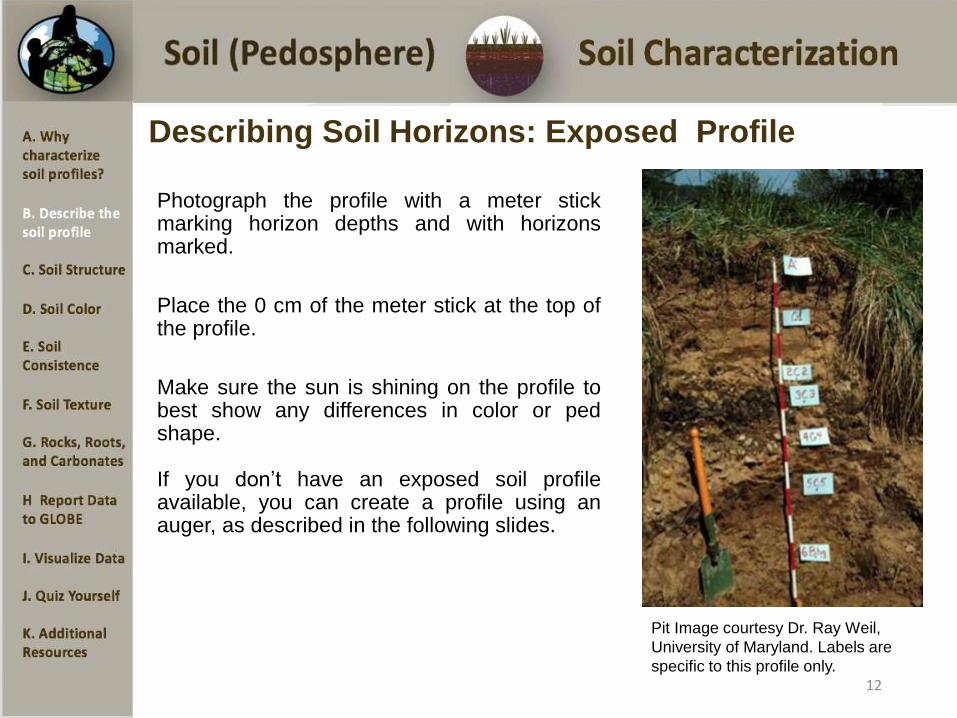
Describing Soil Horizons: Exposed Profile
Photograph the profile with a meter stickmarking horizon depths and with horizonsmarked.
Place the 0 cm of the meter stick at the top ofthe profile.
Make sure the sun is shining on the profile tobest show any differences in color or pedshape.
If you don’t have an exposed soil profileavailable, you can create a profile using anauger, as described in the following slides.
Pit Image courtesy Dr. Ray Weil,
University of Maryland. Labels are
specific to this profile only. 12
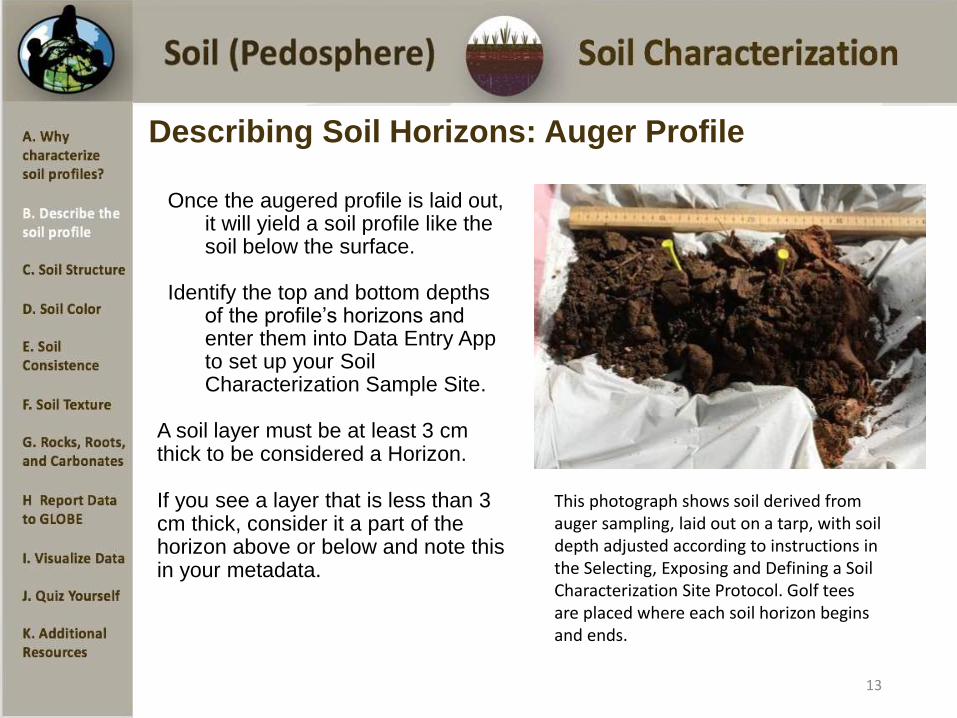
Describing Soil Horizons: Auger Profile
Once the augered profile is laid out, it will yield a soil profile like the soil below the surface.
Identify the top and bottom depths of the profile’s horizons and enter them into Data Entry App to set up your Soil Characterization Sample Site.
A soil layer must be at least 3 cm thick to be considered a Horizon.
If you see a layer that is less than 3 cm thick, consider it a part of the horizon above or below and note this in your metadata.
This photograph shows soil derived from auger sampling, laid out on a tarp, with soil depth adjusted according to instructions in the Selecting, Exposing and Defining a Soil Characterization Site Protocol. Golf tees are placed where each soil horizon begins and ends.
13
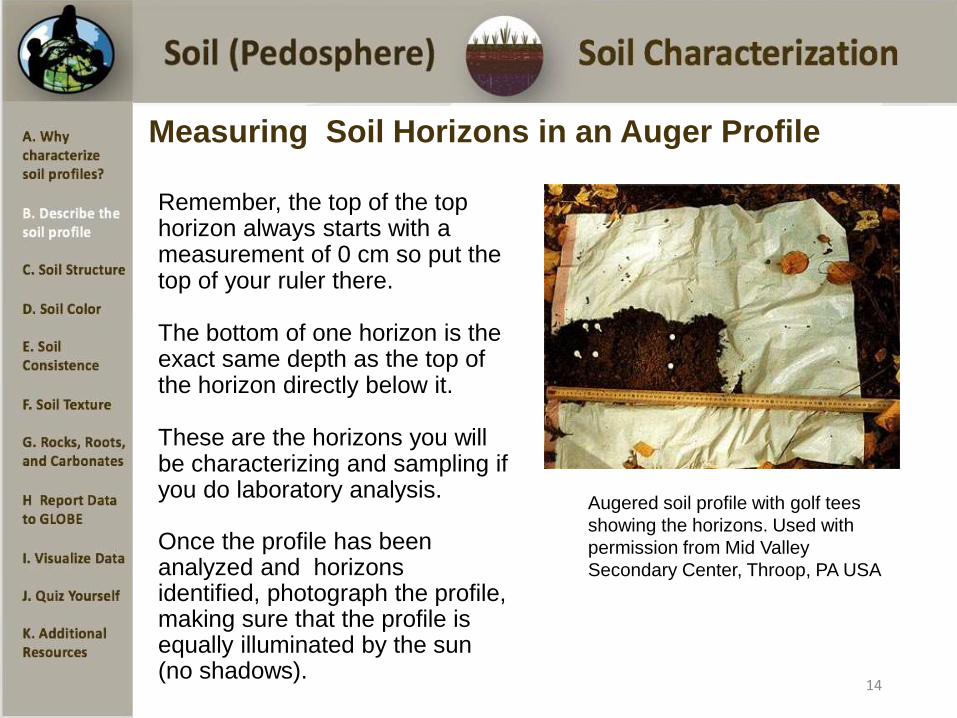
Measuring Soil Horizons in an Auger Profile
Remember, the top of the top horizon always starts with a measurement of 0 cm so put the top of your ruler there.
The bottom of one horizon is the exact same depth as the top of the horizon directly below it.
These are the horizons you will be characterizing and sampling if you do laboratory analysis.
Once the profile has been analyzed and horizons identified, photograph the profile, making sure that the profile is equally illuminated by the sun (no shadows).
Augered soil profile with golf tees
showing the horizons. Used with
permission from Mid Valley
Secondary Center, Throop, PA USA
14
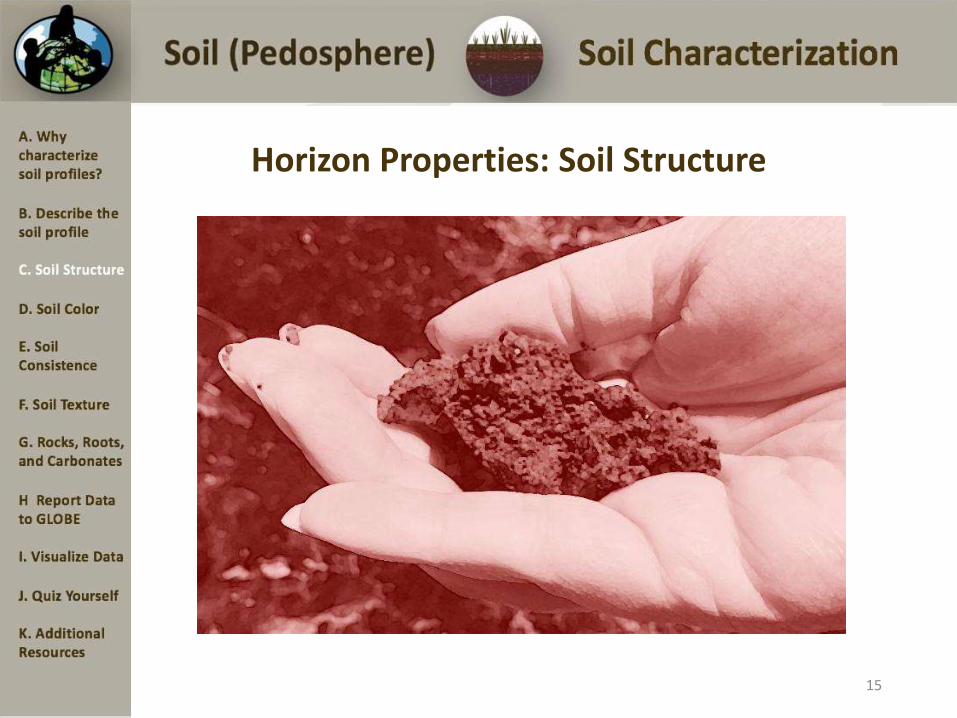
Horizon Properties: Soil Structure
15
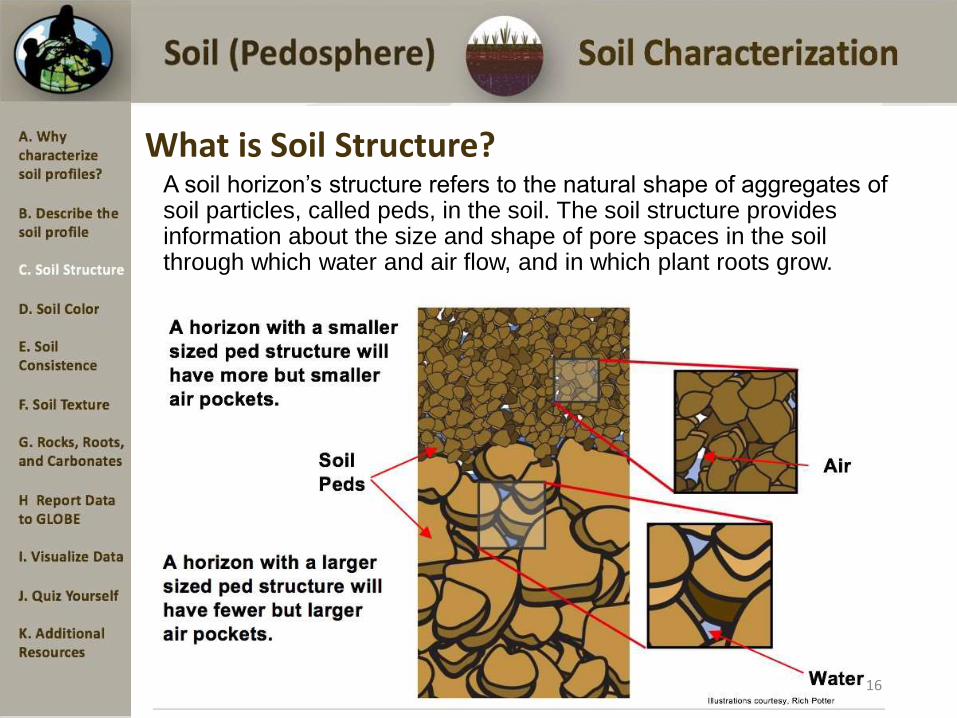
What is Soil Structure?A soil horizon’s structure refers to the natural shape of aggregates of soil particles, called peds, in the soil. The soil structure provides information about the size and shape of pore spaces in the soil through which water and air flow, and in which plant roots grow.
16
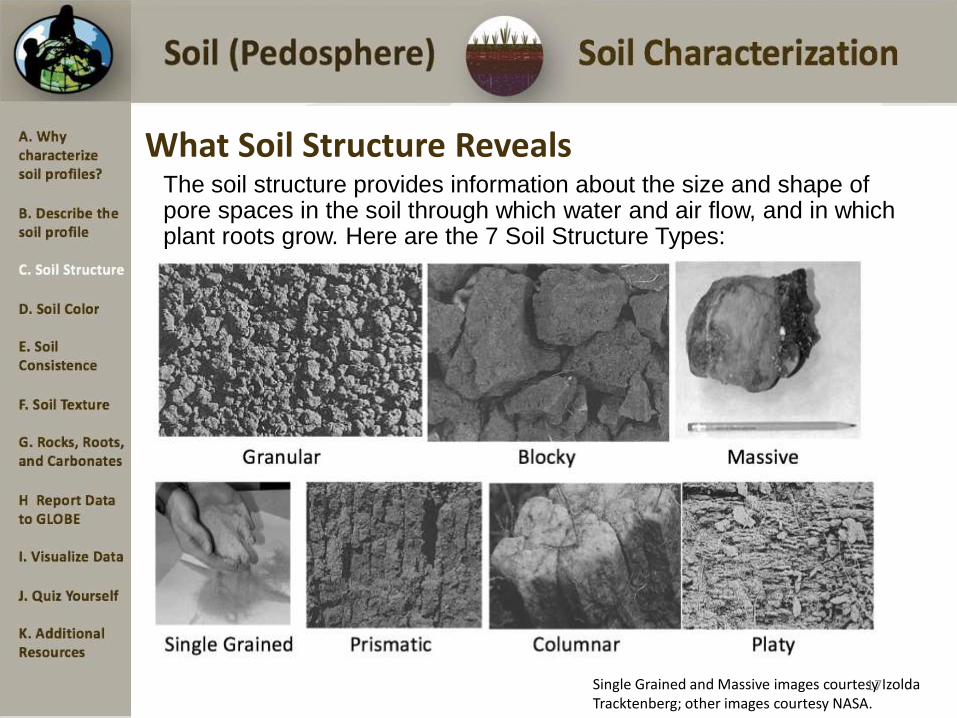
What Soil Structure RevealsThe soil structure provides information about the size and shape of pore spaces in the soil through which water and air flow, and in which plant roots grow. Here are the 7 Soil Structure Types:
Single Grained and Massive images courtesy Izolda Tracktenberg; other images courtesy NASA.
17
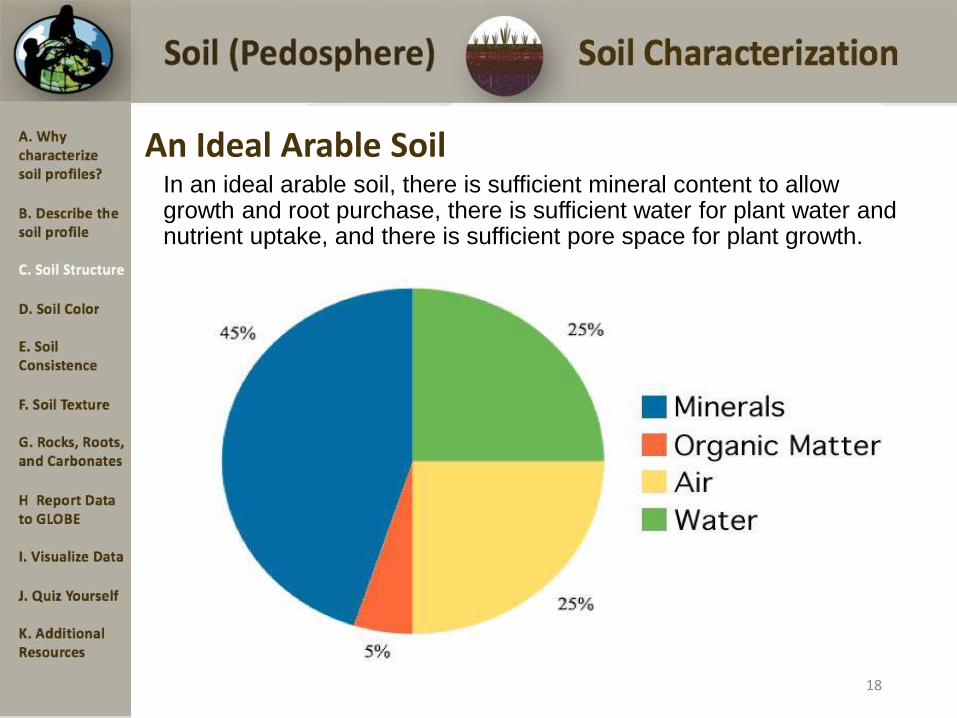
An Ideal Arable SoilIn an ideal arable soil, there is sufficient mineral content to allow growth and root purchase, there is sufficient water for plant water and nutrient uptake, and there is sufficient pore space for plant growth.
18

Examining a Ped
• For each part of this protocol, startwith a clump of soil, called a “ped”.
• Remember, you can change a soil’sstructure by doing anything otherthan looking at it.
• Use a trowel or other digging deviceto remove a soil sample from thehorizon being studied.
• Hold the sample gently in your handand look closely at the soil toexamine its structure.
• Identify the soil structure of thehorizon you are examining. Seeoptions in the next slides.
19

Granular and Block Structure
Granular: Resembles cookiecrumbs and is usually less than0.5 cm in diameter. Commonlyfound in surface horizons whereroots have been growing
Blocky: Irregular blocks that areusually 1.5-5.0 cm in diameter.
20

Prismatic, Columnar and Platy Structure
Prismatic: Vertical columns of soil; usually found in lower horizons.
Columnar: Vertical columns of soil that have a salt "cap" at the top. Found in soils of arid climates.
Platy: Thin, flat plates of soil
that lie horizontally; usually
found in compacted soil. 21
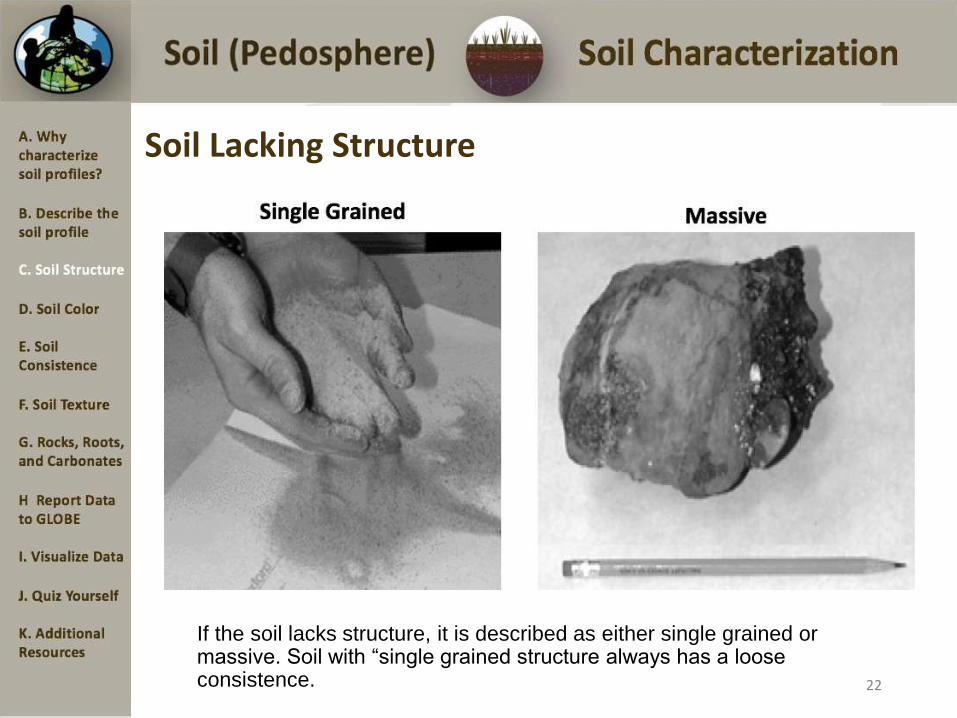
Soil Lacking Structure
If the soil lacks structure, it is described as either single grained or massive. Soil with “single grained structure always has a loose consistence. 22
Horizon Properties: Soil Color
23

What Soil Color Reveals
Soil color indicates the chemical content of the soil or or the coatings on the soilparticles. For instance, dark colors usually indicate the presence of organicmaterial. The presence of Iron and some other minerals can produce red andyellow soils.
24
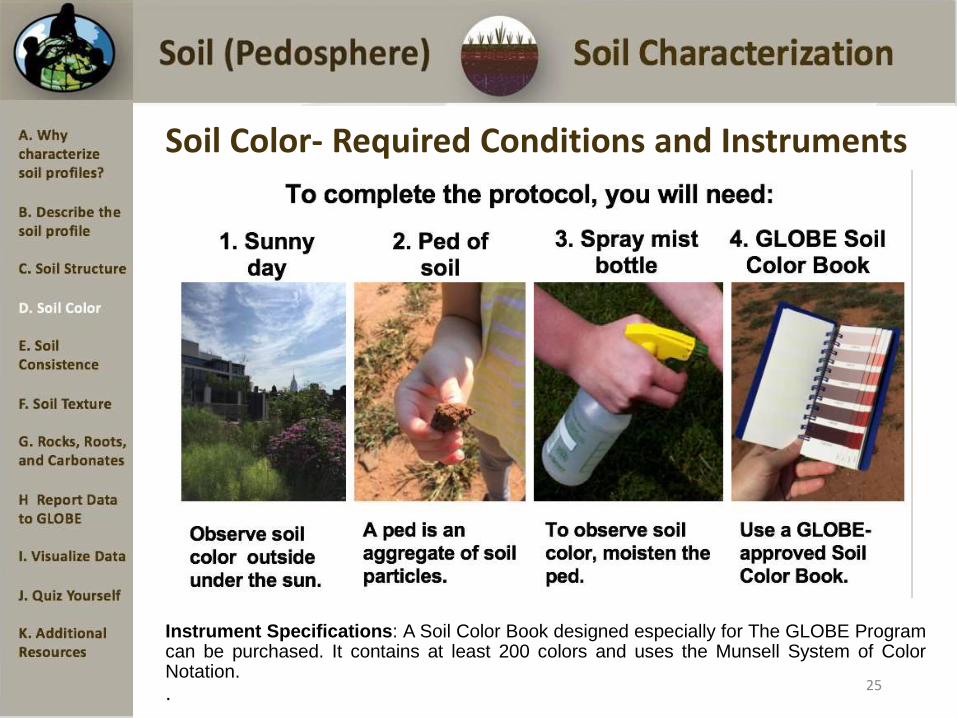
Soil Color- Required Conditions and Instruments
Instrument Specifications: A Soil Color Book designed especially for The GLOBE Programcan be purchased. It contains at least 200 colors and uses the Munsell System of ColorNotation.
. 25

Soil Color- Munsell Notation
In the Munsell color system, colors are identified by three properties.
26
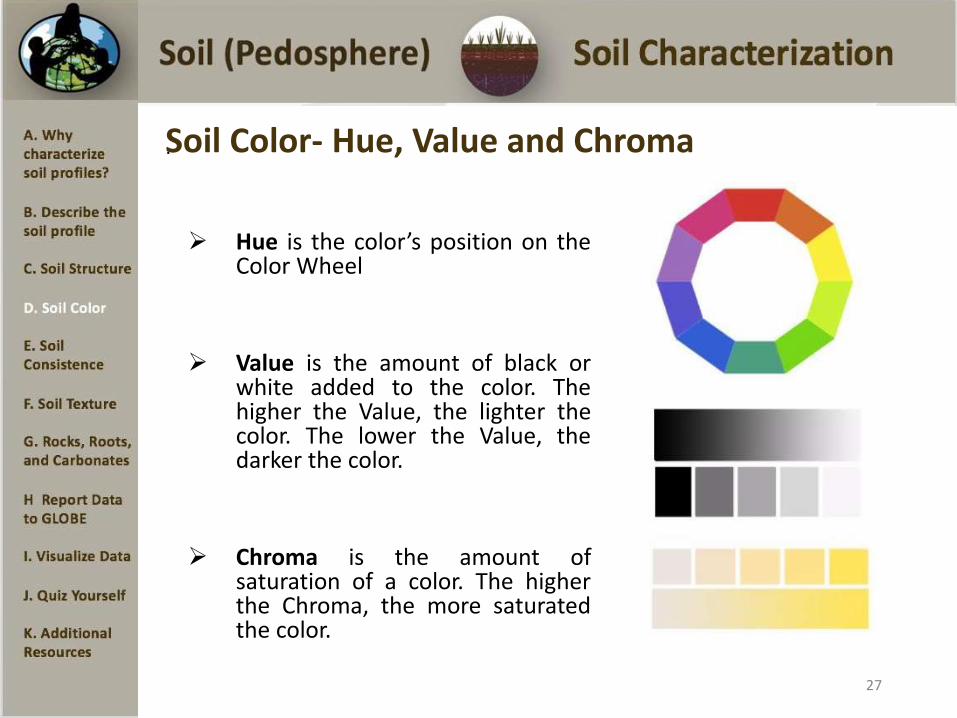
Hue is the color’s position on theColor Wheel
Value is the amount of black orwhite added to the color. Thehigher the Value, the lighter thecolor. The lower the Value, thedarker the color.
Chroma is the amount ofsaturation of a color. The higherthe Chroma, the more saturatedthe color.
.Soil Color- Hue, Value and Chroma
27
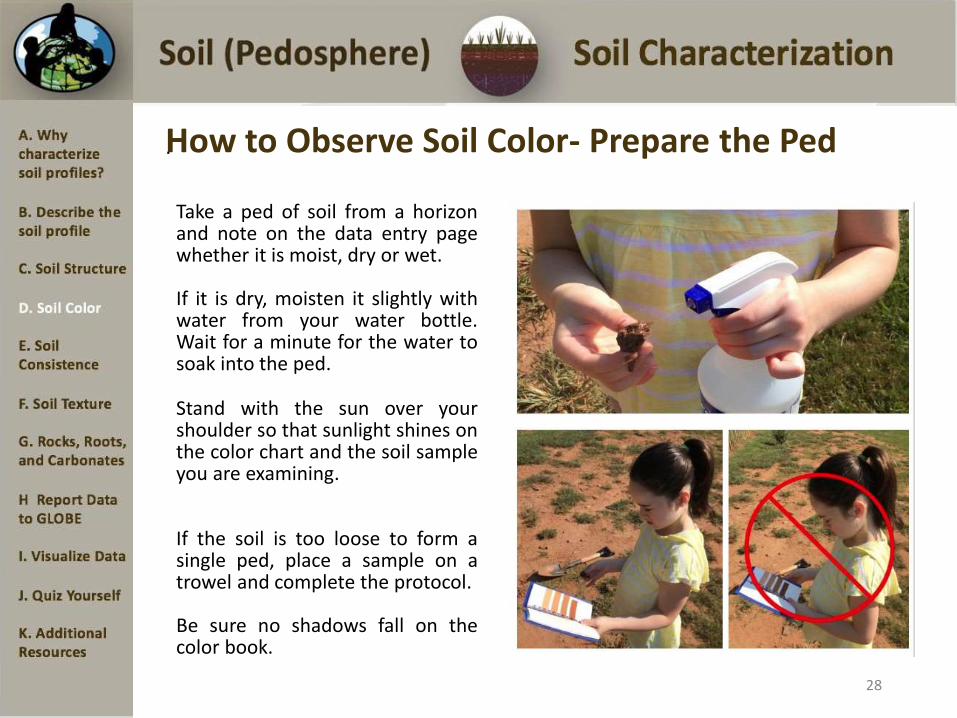
Take a ped of soil from a horizonand note on the data entry pagewhether it is moist, dry or wet.
If it is dry, moisten it slightly withwater from your water bottle.Wait for a minute for the water tosoak into the ped.
Stand with the sun over yourshoulder so that sunlight shines onthe color chart and the soil sampleyou are examining.
If the soil is too loose to form asingle ped, place a sample on atrowel and complete the protocol.
Be sure no shadows fall on thecolor book.
.How to Observe Soil Color- Prepare the Ped
28

Break the ped and compare the color of the insidesurface with the soil color chart.
Look through the entire book as some similar soilcolors appear throughout the book.
Sometimes, a soil sample may have more than onecolor. If so record a maximum of two colors, andindicate (1) the Main (dominant color) and (2) theOther (secondary) color. This is only when yoursample contains two distinctly different colors. It isnot two estimates for the same color
.How to Observe Soil Color- Steps
29

Horizon Properties: Soil Consistence
30
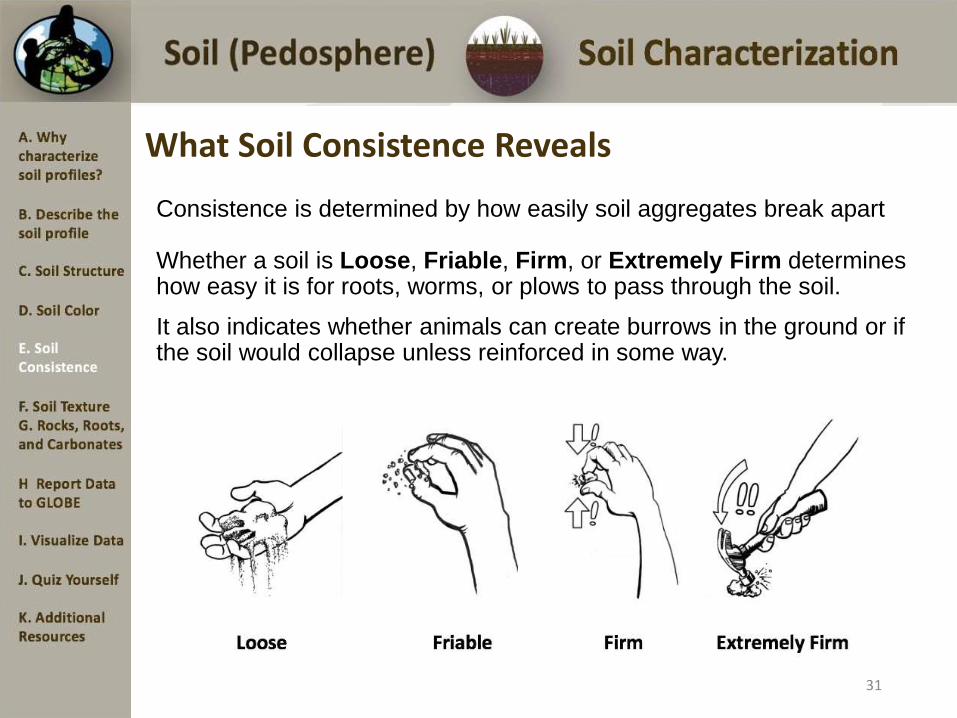
What Soil Consistence Reveals
Consistence is determined by how easily soil aggregates break apart
Whether a soil is Loose, Friable, Firm, or Extremely Firm determines how easy it is for roots, worms, or plows to pass through the soil.
It also indicates whether animals can create burrows in the ground or if the soil would collapse unless reinforced in some way.
31

What is Soil Consistence?
Consistence describes the firmness of theindividual peds and the ease with which theybreak apart.
The terms used to describe soil consistence areloose, friable, firm, and extremely firm.
For example, a soil with friable consistence willbe easier for roots, shovels, or plows to movethrough than a soil with a firm consistence. Onthe other hand, a soil with extremely firmconsistence will be harder for roots, shovels, andtrowels to move through.
32

Identify Soil ConsistenceRecord one of the following categories of soil ped consistence on the Soil Characterization Data Entry Page.
* Soils with “single grained” structure always have loose consistence. 33

Horizon Properties: Soil Texture
34

Definitions of Sand, Silt, and Clay
The way a soil “feels” is called soil texture.
Soil texture depends on the amount of each size of particle in the soil.
Sand, silt, and clay are names that describe the size of individual particles in the soil.
-Sand are the largest particles and they feel “gritty.”
-Silt are medium sized, and they feel soft, silky or “floury.”
-Clay are the smallest sized particles, and they feel “sticky,” and they are hard to squeeze.
35
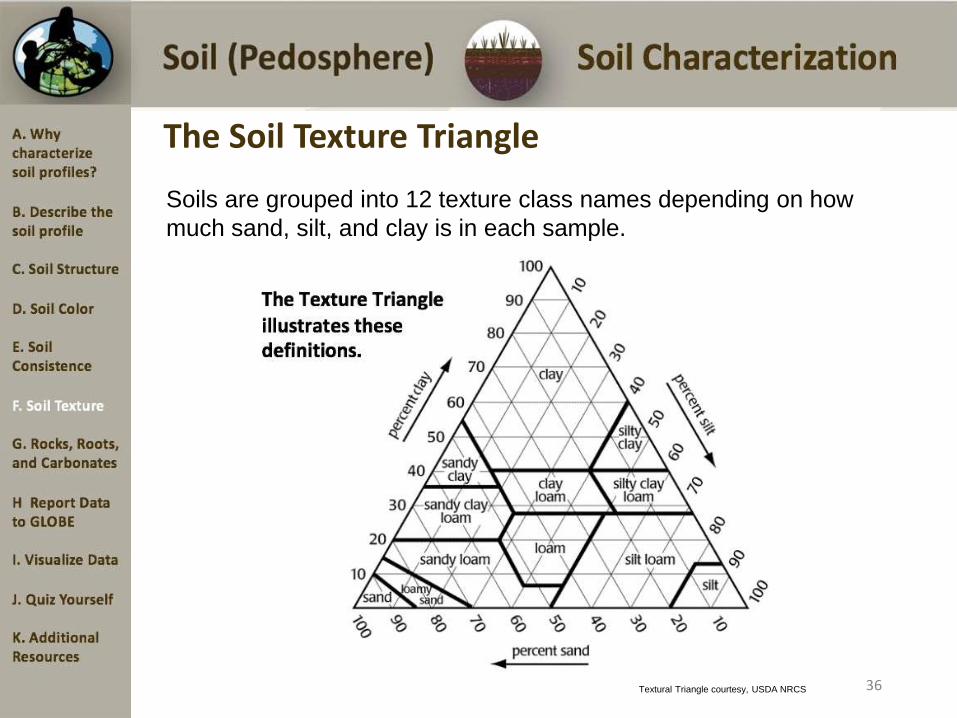
The Soil Texture Triangle
Soils are grouped into 12 texture class names depending on how
much sand, silt, and clay is in each sample.
Textural Triangle courtesy, USDA NRCS 36

Soil Texture: Required Equipment
To determine this soil property, you will need:
37
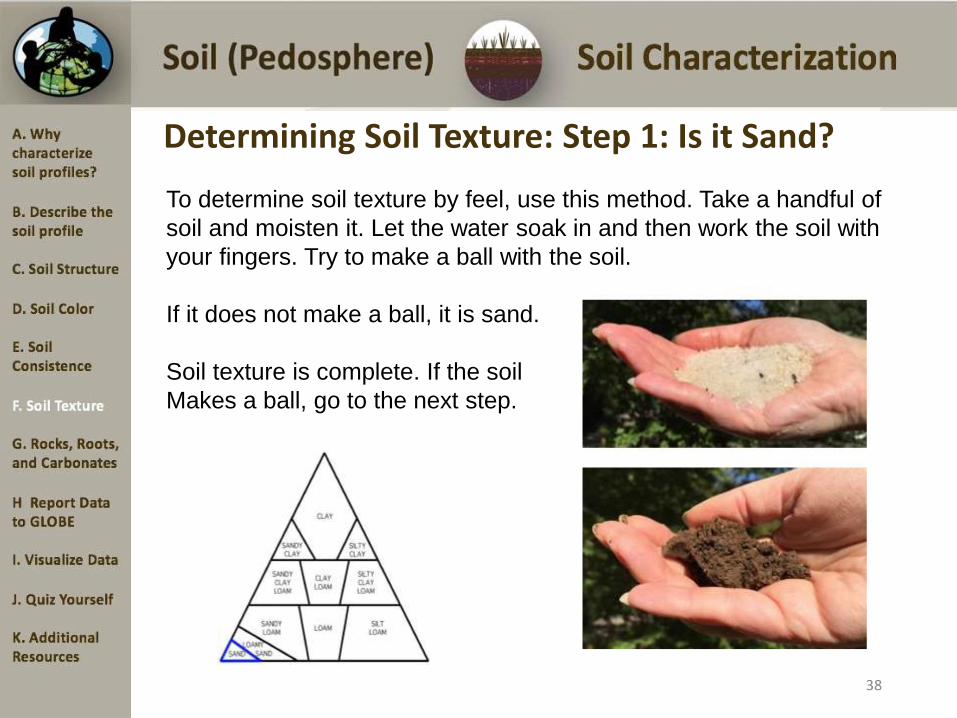
Determining Soil Texture: Step 1: Is it Sand?
To determine soil texture by feel, use this method. Take a handful of
soil and moisten it. Let the water soak in and then work the soil with
your fingers. Try to make a ball with the soil.
If it does not make a ball, it is sand.
Soil texture is complete. If the soil
Makes a ball, go to the next step.
38

Determining Soil Texture: Step 2: Is it Loamy Sand?
Squeeze the soil ball, and try to make a
ribbon between your two fingers.
If the soil does not make a ribbon, call it a Loamy Sand., and Soil Texture is complete.
If the soil makes a ribbon, go to the next steps. First the length of the ribbon will determine whether it is a Clay, a Clay Loam, or a Loam
39

Determining Soil Texture: Step 3: Is it Clay?
Feel for clay. Does the soil stain your
hands and keep its shape in your
hand? Is it sticky and hard to
squeeze? Is it shiny?
Does the sample make a long ribbon
of about 5cm? There is a lot of clay,
it is a Clay, and you will feel for sand
or silt in step 4.
40

Determining Soil Texture: Step 3: Is it Clay Loam?
If there is some clay but it is softer
than a dense clay and makes a
ribbon that is about 2-5 cm long, it
is a Clay Loam, and you will feel
for sand or silt in step 4. If not, goto the next step.
41
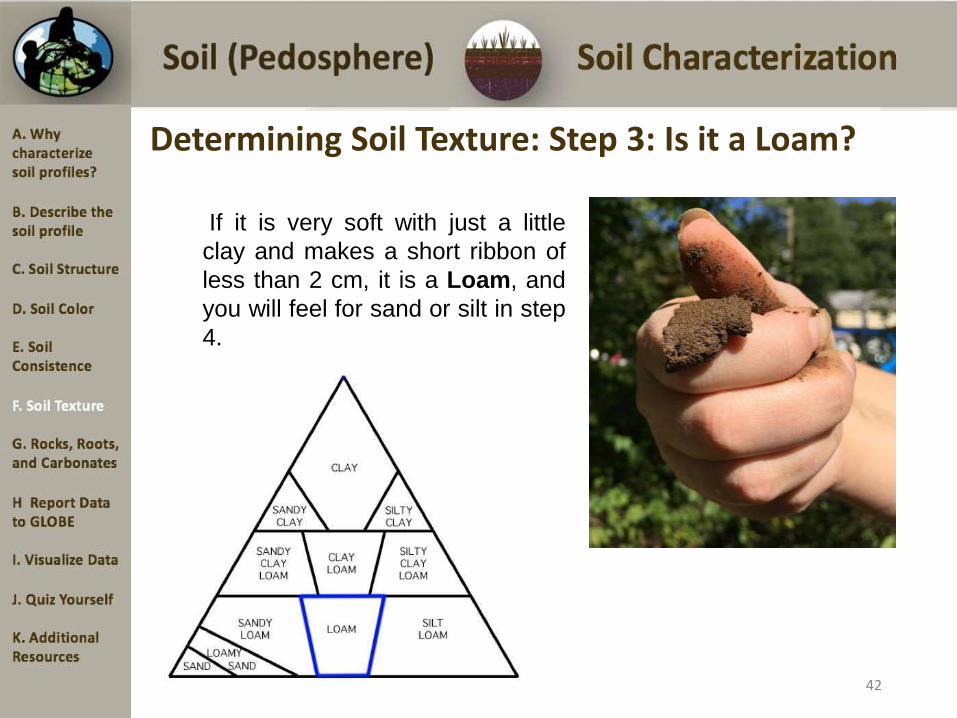
Determining Soil Texture: Step 3: Is it a Loam?
If it is very soft with just a little
clay and makes a short ribbon of
less than 2 cm, it is a Loam, and
you will feel for sand or silt in step
4.
42

Determining Soil Texture: Step 4: Is it Sandy?
Wet a small pinch of the soil in your palm and rub it with a
forefinger. If the soil feels very gritty it is sandy.
Add the word “sandy” to your original soil texture name fromstep 3; it is either Sandy Clay, Sandy Clay Loam, or SandyLoam. Soil Texture is complete.
If not, go to next step.
43
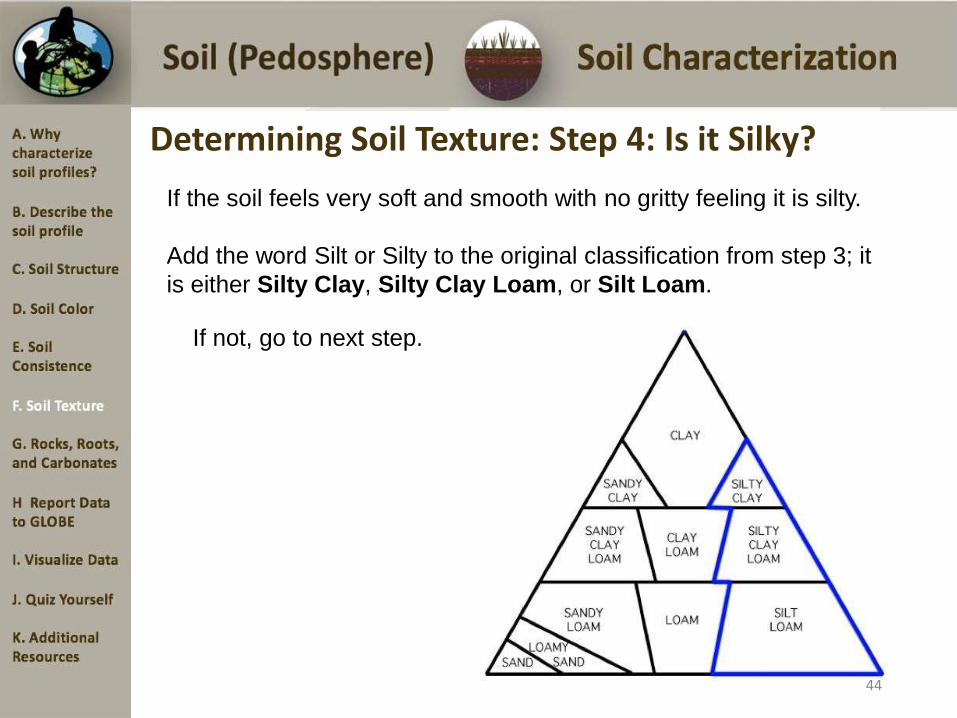
Determining Soil Texture: Step 4: Is it Silky?
If the soil feels very soft and smooth with no gritty feeling it is silty.
Add the word Silt or Silty to the original classification from step 3; it
is either Silty Clay, Silty Clay Loam, or Silt Loam.
If not, go to next step.
44

Determining Soil Texture: Step 4: Is it Neither Sandy or Silky?
If the soil feels neither very gritty nor very soft, it is Clay, Clay
Loam, or Loam.
Soil Texture is complete.
45
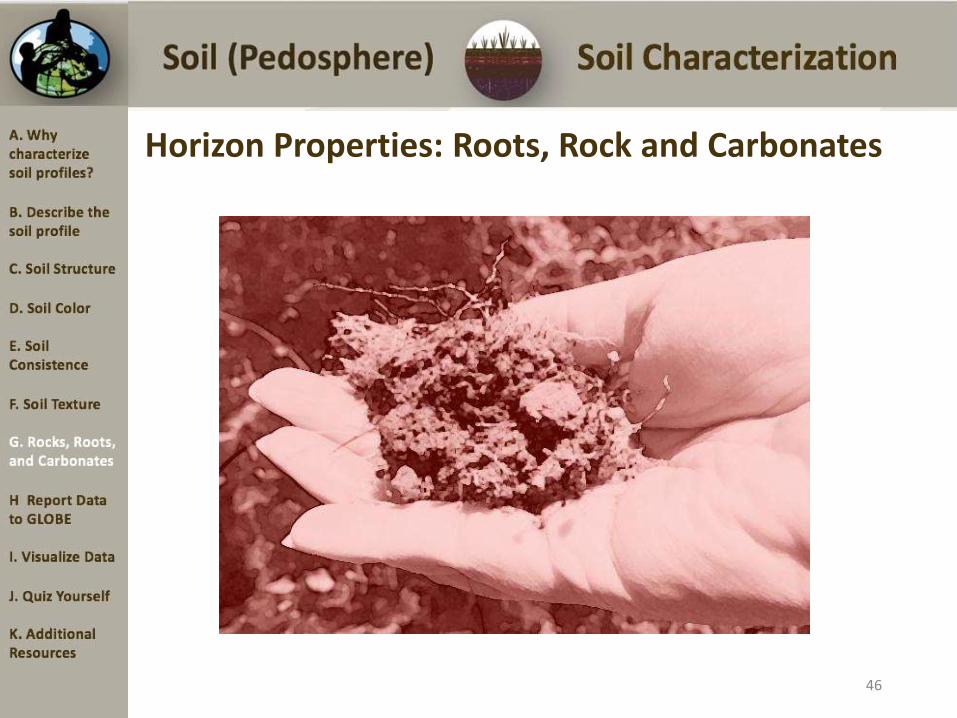
Horizon Properties: Roots, Rock and Carbonates
46
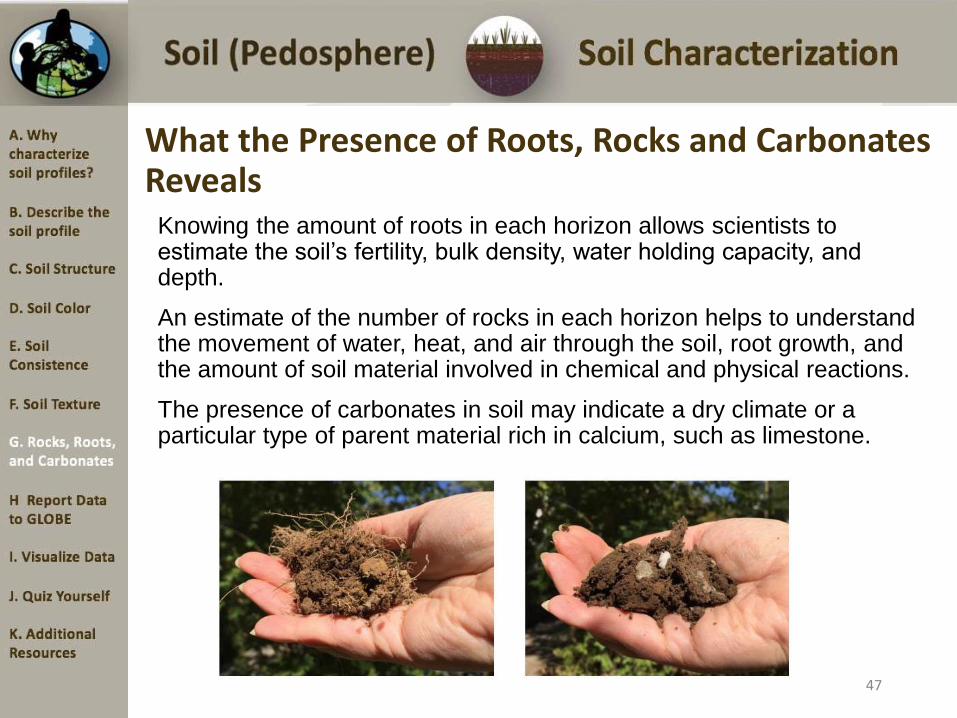
What the Presence of Roots, Rocks and Carbonates RevealsKnowing the amount of roots in each horizon allows scientists to estimate the soil’s fertility, bulk density, water holding capacity, and depth.
An estimate of the number of rocks in each horizon helps to understand the movement of water, heat, and air through the soil, root growth, and the amount of soil material involved in chemical and physical reactions.
The presence of carbonates in soil may indicate a dry climate or a particular type of parent material rich in calcium, such as limestone.
47
Horizon Properties: Roots
An estimate of the roots in each horizonin a soil profile illustrates the depth towhich roots go to obtain nutrients andwater.
The more roots found in a horizon, themore water and nutrients are beingremoved from the soil, and the moreorganic matter being returned.
Observe and record if they are none,few or many roots or root fragments ineach horizon.
48
Horizon Properties: Rocks
An estimate of the number of rocks in each horizon helps to understand the movement of water, heat, and air through the soil, root growth, and the amount of soil material involved in chemical and physical reactions.
Soil particles greater than 2 mm in size are considered to be rocks or pebbles.
Observe and record if there are none, few or many rocks or rock fragments in the horizon
49
Horizon Properties: Free Carbonates
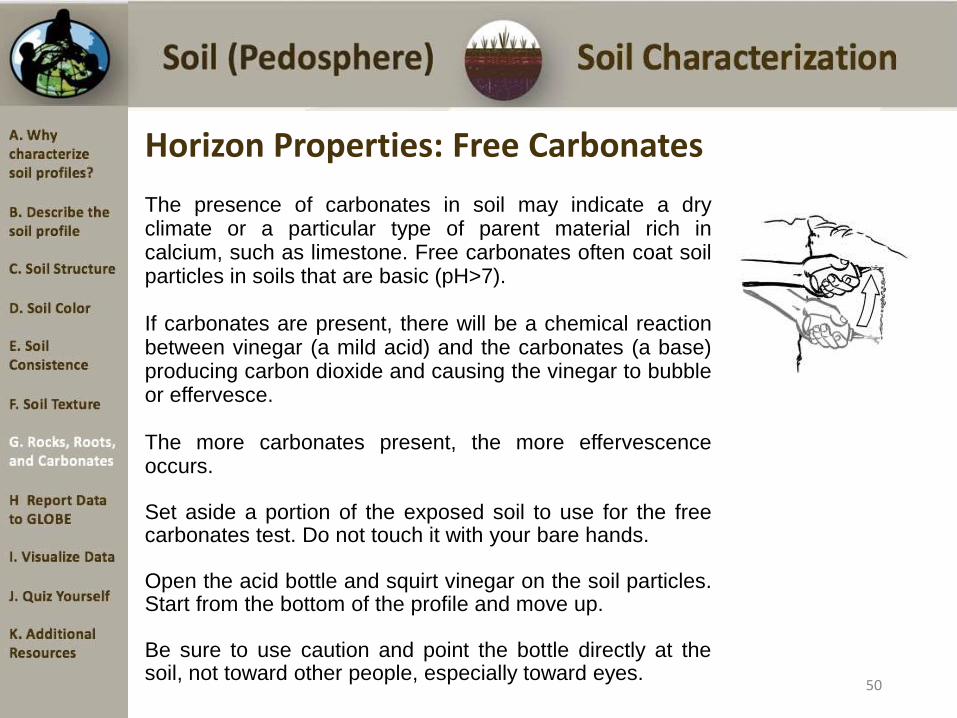
The presence of carbonates in soil may indicate a dryclimate or a particular type of parent material rich incalcium, such as limestone. Free carbonates often coat soilparticles in soils that are basic (pH>7).
If carbonates are present, there will be a chemical reactionbetween vinegar (a mild acid) and the carbonates (a base)producing carbon dioxide and causing the vinegar to bubbleor effervesce.
The more carbonates present, the more effervescenceoccurs.
Set aside a portion of the exposed soil to use for the freecarbonates test. Do not touch it with your bare hands.
Open the acid bottle and squirt vinegar on the soil particles.Start from the bottom of the profile and move up.
Be sure to use caution and point the bottle directly at thesoil, not toward other people, especially toward eyes.
50

Observing Free Carbonates
Look carefully for the presence of effervescence. Themore carbonates that are present, the more bubbles(effervescence) you will observe.
Observe and record whether the effervescence is none,slight or strong.
None: if you observe no reaction, the soil has no freecarbonates present.
Slight: if you observe a very slight bubbling action; this indicates the presence of some carbonates.
Strong: if there is a strong reaction (many, and/or large bubbles). This indicates there may be many carbonates present.
51
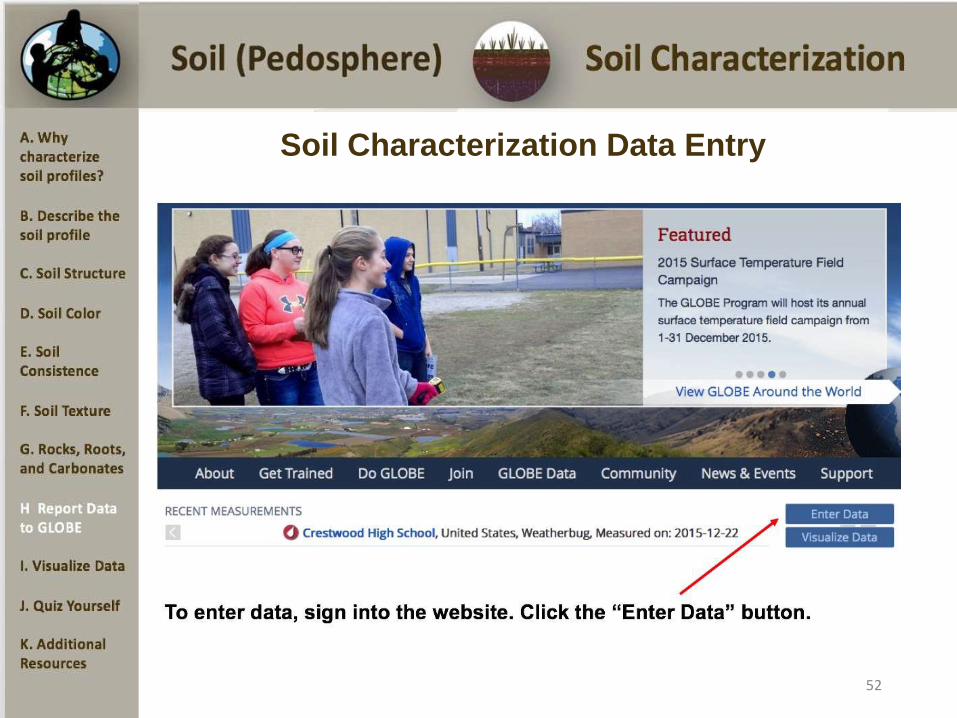
Soil Characterization Data Entry
52

Soil Characterization Site Data Entry-1After defining horizons and completing the Soil Characterization Field Measurements, it is time to enter data. Go to Data Entry and select Site Definition for your school. Fill in the general site definition information.
53
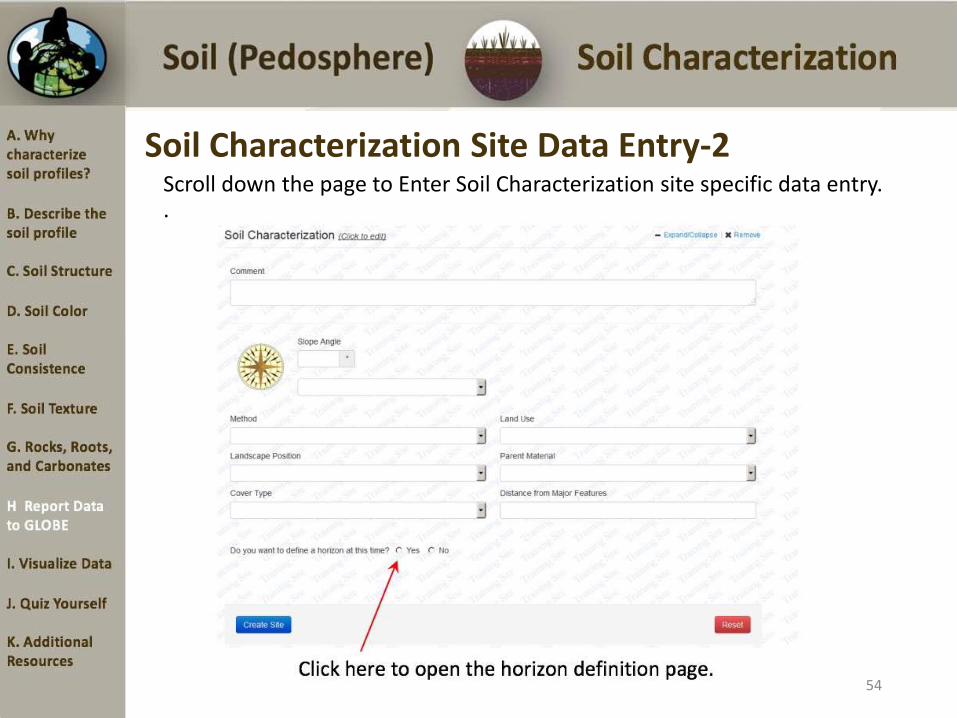
Soil Characterization Site Data Entry-2Scroll down the page to Enter Soil Characterization site specific data entry..
54
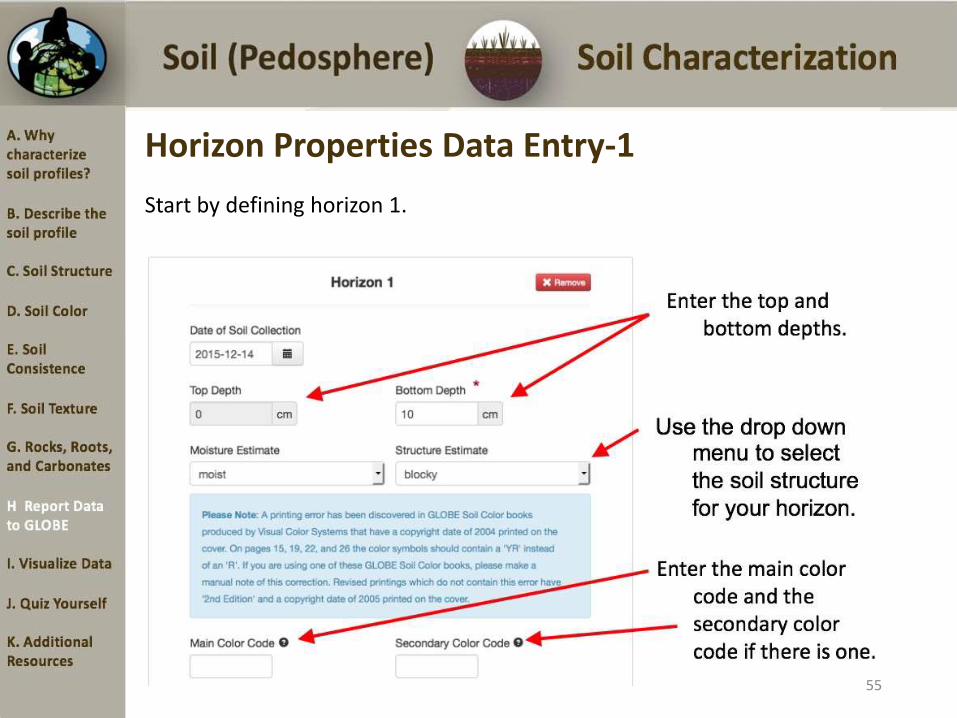
Horizon Properties Data Entry-1
Start by defining horizon 1.
55

Horizon Properties Data Entry-2
Start by defining horizon 1.
56
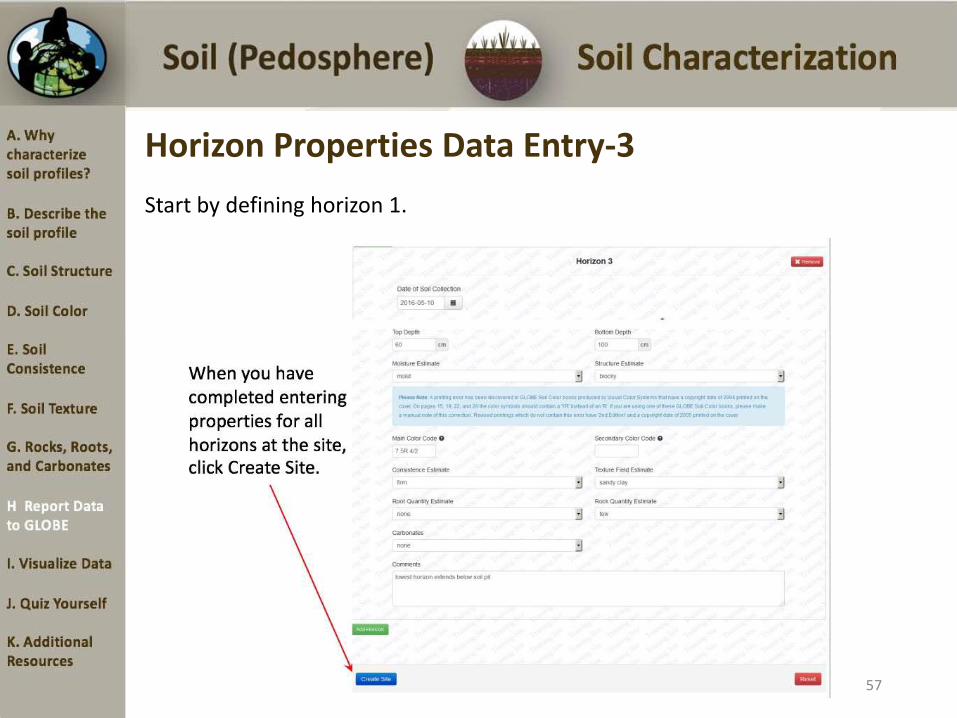
Horizon Properties Data Entry-3
Start by defining horizon 1.
57

Soil Characterization Site Data VisualizationGLOBE Soil Characterization data visualization has several aspects that aredifferent from the visualization of other types of data.
The map shows the data for the most recent soil characterization at every sitesince the start of this GLOBE protocol. It is a soil map and soil character changesslowly often forming over centuries or longer.
If you change the date of the visualization, data taken more recently than thisdate will not be shown.
The depth of each horizon is important data; it is not just part of defining thehorizon. So, there are visualizations of horizon depth for the top 5 horizons.
It is interesting and useful to know the soil properties for the horizons where soilmoisture and temperature data are taken. There are visualizations showing whichhorizon occurs at these different measurement depths.
Data from multiple horizons may be displayed by opening multiple data layers andarranging them so that the layer with the smallest dots is on top. In this way, datafrom the layers appear in a stack (like a child’s toy).
58
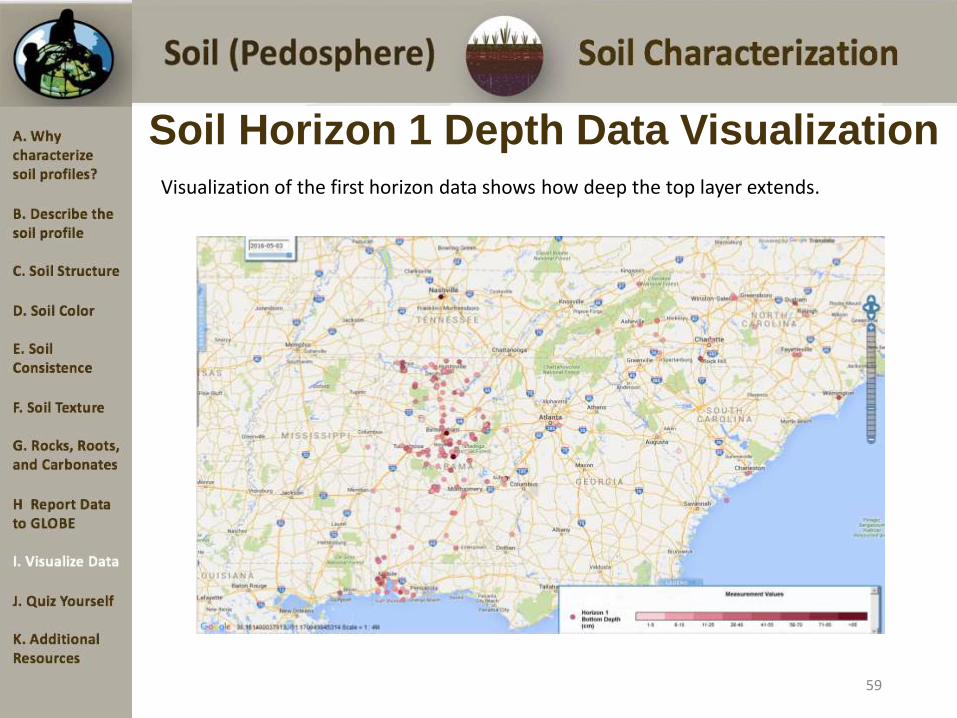
Soil Horizon 1 Depth Data VisualizationVisualization of the first horizon data shows how deep the top layer extends.
59
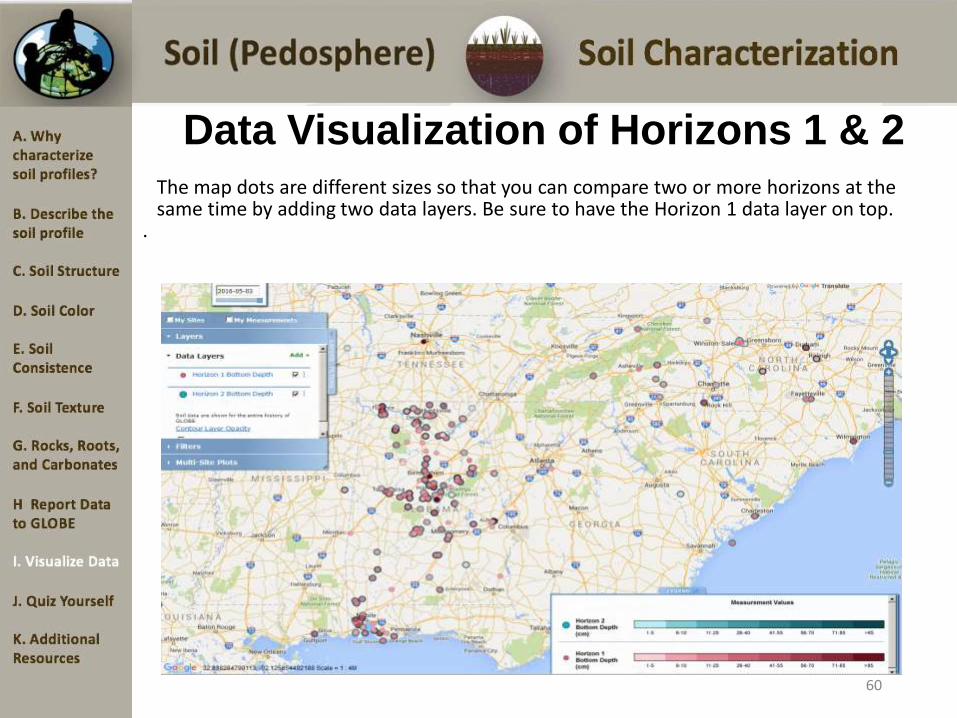
Data Visualization of Horizons 1 & 2The map dots are different sizes so that you can compare two or more horizons at the same time by adding two data layers. Be sure to have the Horizon 1 data layer on top.
.
60
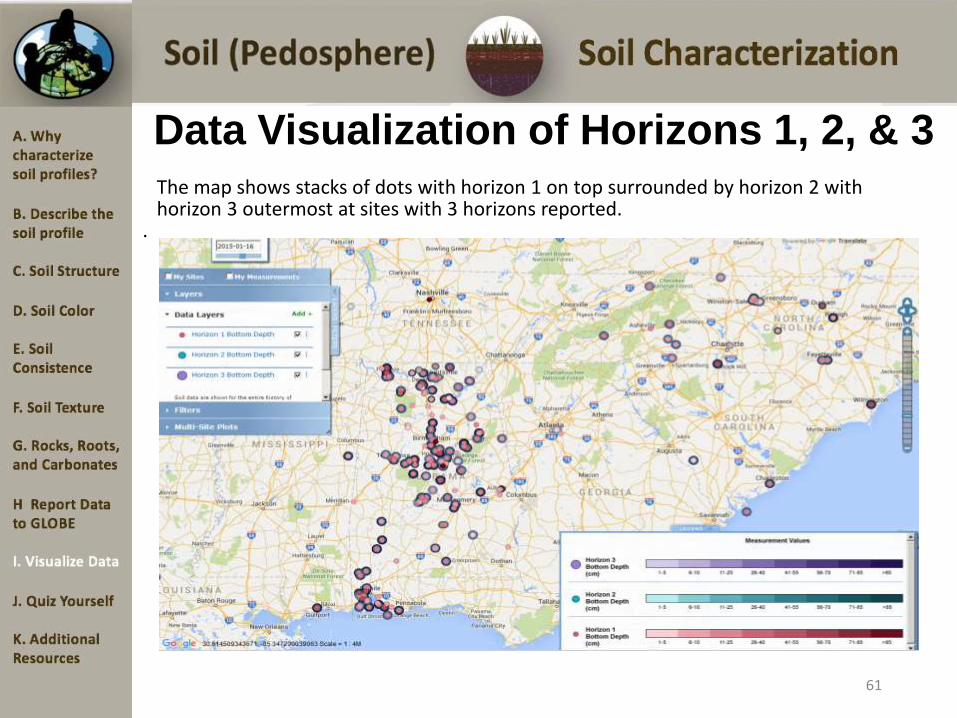
Data Visualization of Horizons 1, 2, & 3The map shows stacks of dots with horizon 1 on top surrounded by horizon 2 with horizon 3 outermost at sites with 3 horizons reported.
.
61
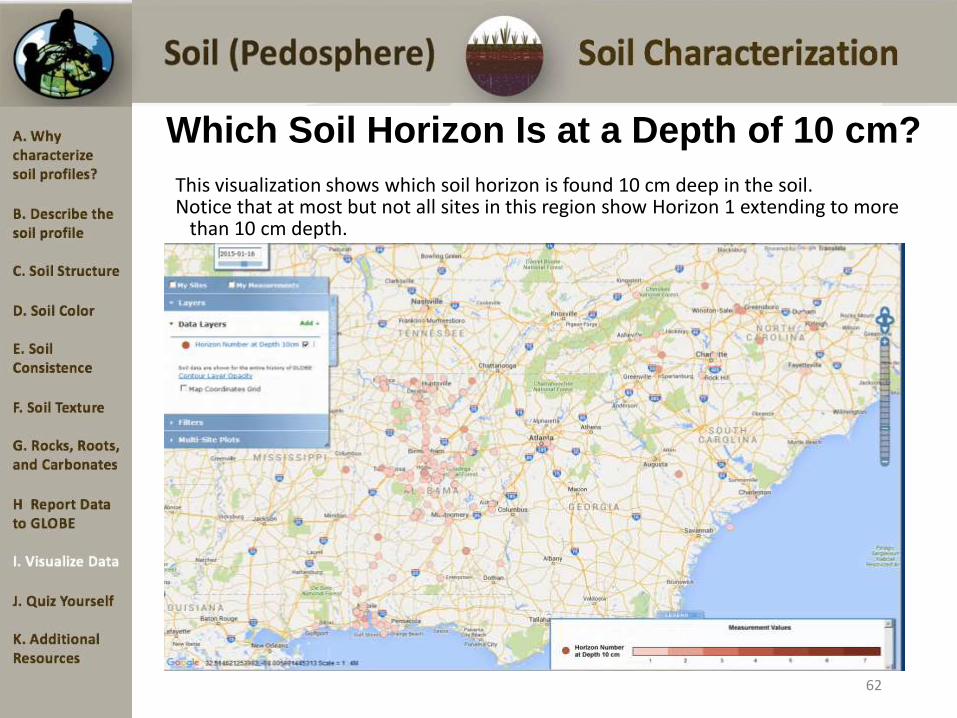
Which Soil Horizon Is at a Depth of 10 cm?
This visualization shows which soil horizon is found 10 cm deep in the soil.Notice that at most but not all sites in this region show Horizon 1 extending to more
than 10 cm depth.
62

Which Soil Horizon Is at a Depth of 50 cm?This visualization show which soil horizon is found 50 cm deep in the soil.This depth corresponds to the location of the deepest soil temperature sensor.
63

Which Soil Horizons Are at 30, 60, & 90 cm?This visualization shows which soil horizons are found at the depths of the three deepest soil moisture measurements. Dots for the three depths are nested on top of one another.
64

Soil Structure Data VisualizationVisualization of the first horizon data shows the soil’s Structure values.
65

Soil Color Data VisualizationVisualization for the first horizon may provide clues as to the mineral and organic
content of these soil samples
66

Visualizing Soil Consistence DataVisualization for the first horizon shows Soil Consistence Measurements.
67

Soil Texture Data VisualizationVisualization for the first horizon shows soil’s Texture By Feel.
68
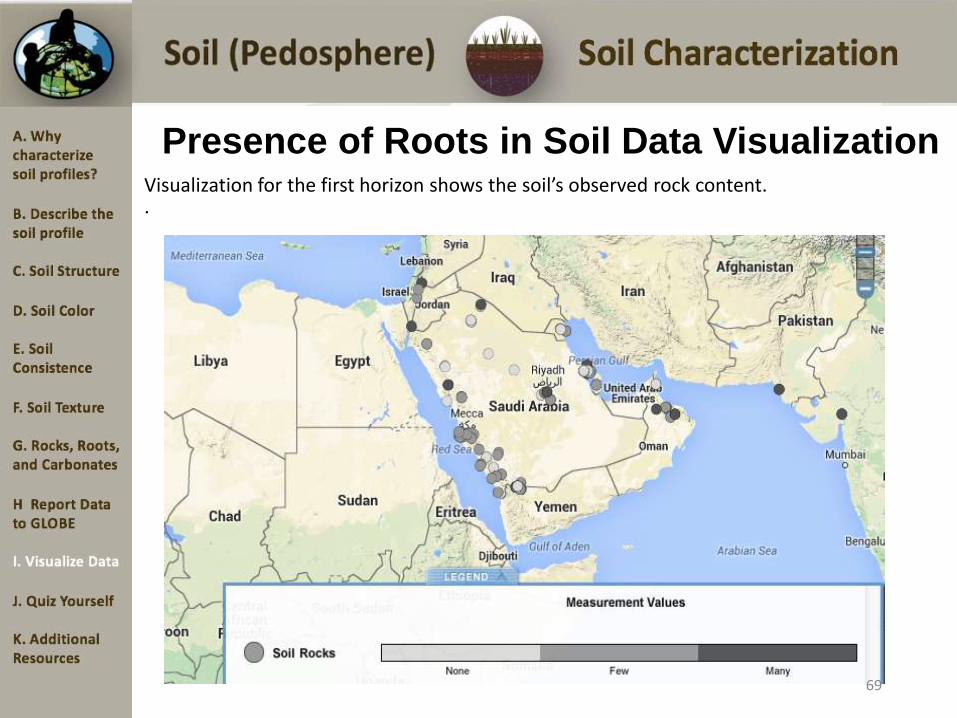
Presence of Roots in Soil Data VisualizationVisualization for the first horizon shows the soil’s observed rock content..
69
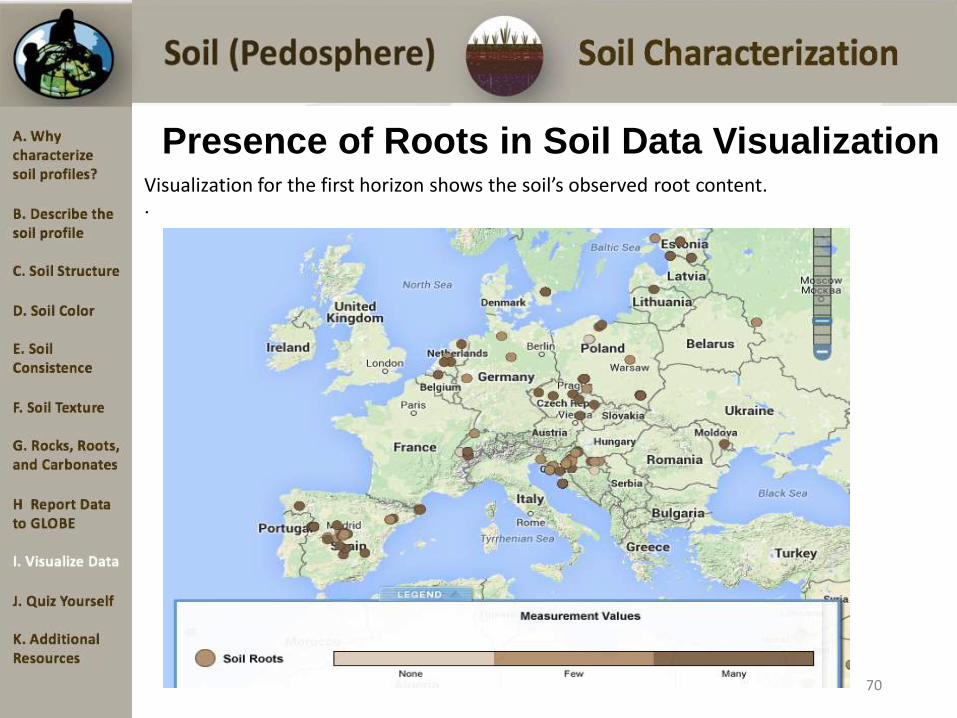
Presence of Roots in Soil Data VisualizationVisualization for the first horizon shows the soil’s observed root content..
70
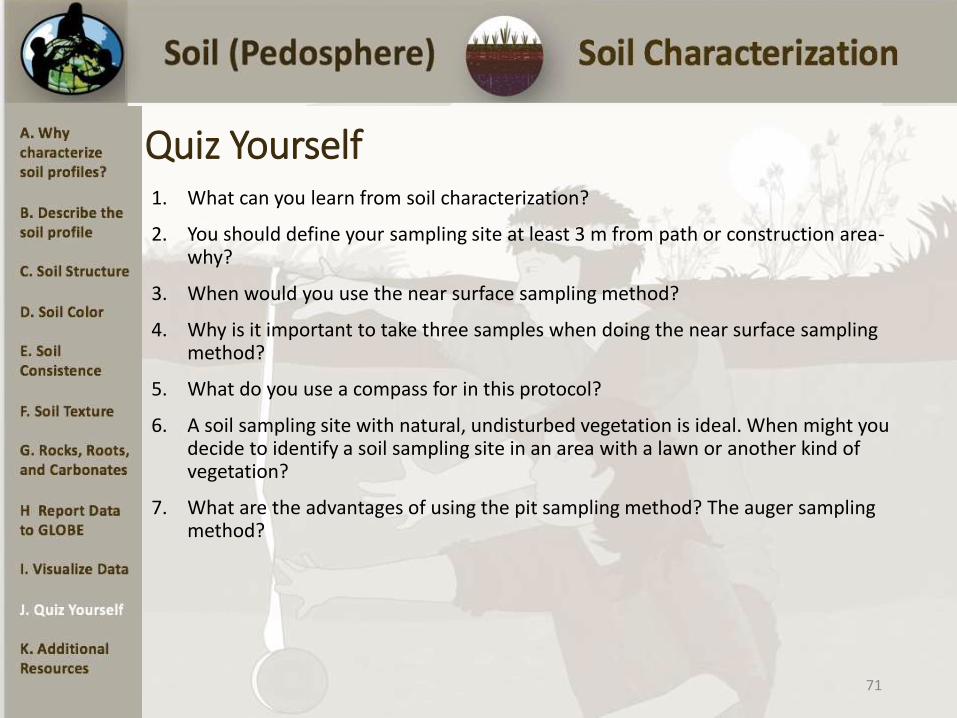
Quiz Yourself1. What can you learn from soil characterization?
2. You should define your sampling site at least 3 m from path or construction area-why?
3. When would you use the near surface sampling method?
4. Why is it important to take three samples when doing the near surface sampling method?
5. What do you use a compass for in this protocol?
6. A soil sampling site with natural, undisturbed vegetation is ideal. When might you decide to identify a soil sampling site in an area with a lawn or another kind of vegetation?
7. What are the advantages of using the pit sampling method? The auger sampling method?
71

Questions for Further Investigation• What creates the different horizons in a soil profile?
• What natural changes could alter the soil horizons?
• How long might it take to alter the depths of the different horizons?
• How do soil profiles change from one location to another?
• How do soil horizons change from one location to another?
72

Frequently Asked QuestionsWhat do the numbers and letters describing the soil color mean?
• For GLOBE, the universal Munsell notation is used to identify the color of the soil.
• The system is made up of 3 symbols representing the hue, value, and chroma of the soil color.
• The hue is described by the first set of number and letter symbols in the Munsell system. Hue represents the position of the color on the color wheel (Y=Yellow, R=Red, G=Green, B=Blue, YR=Yellow Red, RY=Red Yellow).
• The value is the number before the slash in the Munsell system. Value indicates the lightness of a color. The scale of value ranges from 0 for pure black to 10 for pure white.
• The chroma is the number after the slash in the Munsell system. Chroma describes the “intensity” of a color. Colors of low chroma values are sometimes called weak, while those of high chroma are said to be highly saturated, strong, or vivid. The scale starts at zero, for neutral colors, but there is no arbitrary end to the scale.
73
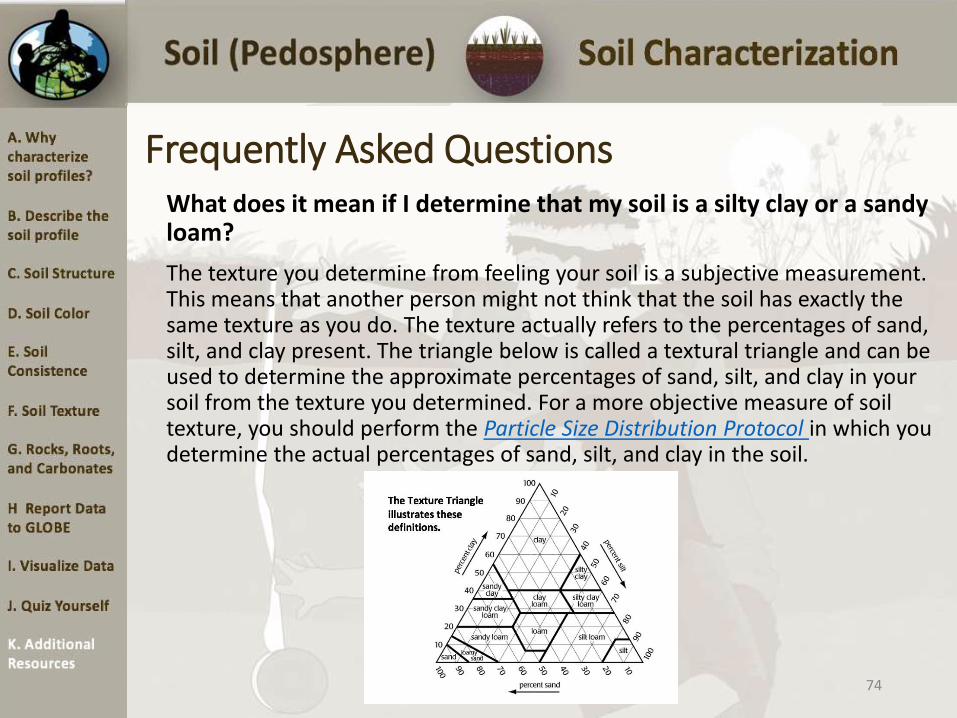
Frequently Asked QuestionsWhat does it mean if I determine that my soil is a silty clay or a sandy loam?
The texture you determine from feeling your soil is a subjective measurement. This means that another person might not think that the soil has exactly the same texture as you do. The texture actually refers to the percentages of sand, silt, and clay present. The triangle below is called a textural triangle and can be used to determine the approximate percentages of sand, silt, and clay in your soil from the texture you determined. For a more objective measure of soil texture, you should perform the Particle Size Distribution Protocol in which you determine the actual percentages of sand, silt, and clay in the soil.
74

75
Please provide us with feedback about this module. This is a community project and we welcome your comments, suggestions and edits! eTraining Feedback
Questions abut this module: Contact GLOBE eTraining, [email protected]
Slides: Izolda Trachtenberg, Dixon Butler, and Russanne Low
Photographs: Izolda Trachtenberg
Illustrations, unless otherwise identified: Rich Potter
Cover Art: Jenn Glaser, ScribeArts
More Information:
The GLOBE Program
NASA Earth Science
NASA Global Climate Change: Vital Signs of the Planet
The GLOBE Program is sponsored by these organizations:
Version 12/1/16. If you edit and modify this slide set for use for educational purposes, please note “modified by (and your name and date) “ on this page. Thank you.