MICROFINANCE IN THE LAO PDR, 2009 - Universität zu Köln
109
MICROFINANCE IN THE LAO PDR, 2009
Transcript of MICROFINANCE IN THE LAO PDR, 2009 - Universität zu Köln

MICROFINANCE IN THE LAO PDR, 2009
EDITORIAL BOARD
Mr. Souphith DARACHANTHARA Deputy Director General, National Economic Research Institute
Suyvey Team Leader - Analyst, Editor
Mr. Phokhong THEPKAYSONE Director, Development Research Division
Survey Team Leader Assistant - Analyst
Mr. Thanongsai SOUKKHAMTHAT
Deputy Director, Development Research Division Project Coordinator - Analyst
Ms. Phoutthasone SINTHAVONG Ms. Dorkfa SIYOTHA
Ms. Viengsavanh SOULIYA Mr. Bounmy SOUTPILA
Survey and Research Team Members
Prof. (em.) Dr. Hans Dieter Seibel
Mr. Klaus Prochaska GIZ Project Director
Editors
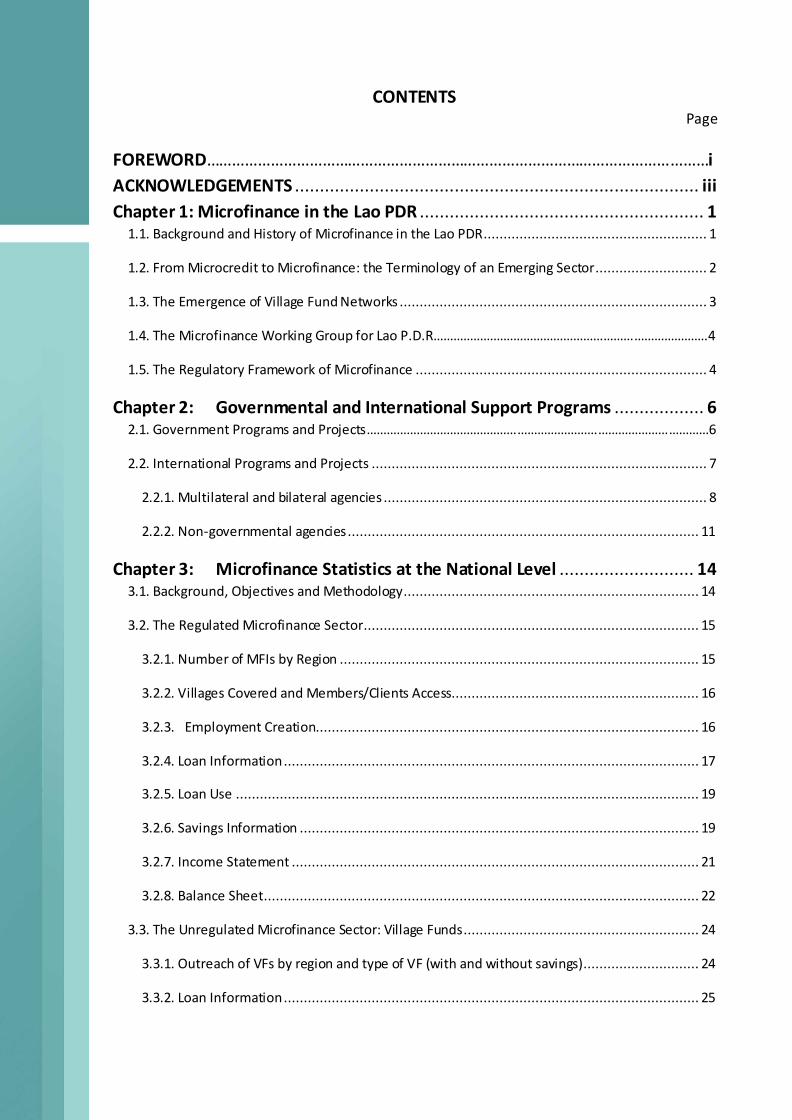
CONTENTS
Page
FOREWORD………………………………………………………………………………………………………i
ACKNOWLEDGEMENTS ................................................................................. iii
Chapter 1: Microfinance in the Lao PDR ......................................................... 1
1.1. Background and History of Microfinance in the Lao PDR........................................................ 1
1.2. From Microcredit to Microfinance: the Terminology of an Emerging Sector............................ 2
1.3. The Emergence of Village Fund Networks ............................................................................. 3
1.4. The Microfinance Working Group for Lao P.D.R……………………………………………………………………….4
1.5. The Regulatory Framework of Microfinance ......................................................................... 4
Chapter 2: Governmental and International Support Programs .................. 6
2.1. Government Programs and Projects…………………………………………………………………………………………6
2.2. International Programs and Projects .................................................................................... 7
2.2.1. Multilateral and bilateral agencies ................................................................................. 8
2.2.2. Non-governmental agencies ........................................................................................ 11
Chapter 3: Microfinance Statistics at the National Level ........................... 14
3.1. Background, Objectives and Methodology .......................................................................... 14
3.2. The Regulated Microfinance Sector .................................................................................... 15
3.2.1. Number of MFIs by Region .......................................................................................... 15
3.2.2. Villages Covered and Members/Clients Access.............................................................. 16
3.2.3. Employment Creation................................................................................................ 16
3.2.4. Loan Information ........................................................................................................ 17
3.2.5. Loan Use .................................................................................................................... 19
3.2.6. Savings Information .................................................................................................... 19
3.2.7. Income Statement ...................................................................................................... 21
3.2.8. Balance Sheet ............................................................................................................. 22
3.3. The Unregulated Microfinance Sector: Village Funds ........................................................... 24
3.3.1. Outreach of VFs by region and type of VF (with and without savings)............................. 24
3.3.2. Loan Information ........................................................................................................ 25
3.3.3. Savings Information .................................................................................................... 27
3.3.4. Income Statement...................................................................................................... 27
3.3.5. VF’s Balance Sheet ...................................................................................................... 28
3.3.6. Return on Assets - Comparing regulated MFIs and unregulated VFs ............................... 30
3.4. Summary and conclusions ................................................................................................. 31
Chapter 4: Microfinance Statistics at the Provincial Level ......................... 34
1. Phongsaly Province .............................................................................................................. 34
2. Luangnamtha Province ......................................................................................................... 37
3. Bokeo Province .................................................................................................................... 40
4. Oudomxay Province ............................................................................................................. 43
5. Luangprabang Province ........................................................................................................ 46
6. Huaphan Province ................................................................................................................ 49
7. Xayabuly Province ................................................................................................................ 52
8. Vientiane Capital.................................................................................................................. 55
9. Xiengkhuang Province .......................................................................................................... 58
10. Vientiane Province ............................................................................................................. 61
11. Bolikhamxay Province......................................................................................................... 64
12. Khammuane Province......................................................................................................... 67
13. Savannakhet Province ........................................................................................................ 70
14. Saravanh Province.............................................................................................................. 73
15. Sekong Province................................................................................................................. 76
16. Champasak Province .......................................................................................................... 79
17. Attapeu Province ............................................................................................................... 82
References ................................................................................................... 85
Annexes ....................................................................................................... 86
Annex 1: List of 5 DTMFIs and 8 NDTMFIs.................................................................................. 86
Annex 2: List of 13 Saving and Credit Unions (SCUs) ................................................................... 87
Annex 3: List of 192 village fund promoters and village funds ..................................................... 88
Annex 4: Questionnaire............................................................................................................ 94

List of Tables Page
Table 1: Number of Providers by Region ...................................................................................16
Table 2: Microfinance outreach ................................................................................................16
Table 3: Employment...............................................................................................................17
Table 4: Loan information ........................................................................................................17
Table 5: Number of borrowers by region ..................................................................................18
Table 6: Loan outstanding by region .........................................................................................18
Table 7: Interest rate of loan provision per month.....................................................................19
Table 9: Savings information ...................................................................................................20
Table 10: Number of savers by region.......................................................................................20
Table 11: Amount of savings by region......................................................................................21
Table 12.1: Income statement ..................................................................................................21
Table 12.2: Average Income statement per type of MFI .............................................................22
Table 13.1: Balance Sheet ........................................................................................................23
Table 13.2: Average Balance Sheet per type of MFI ...................................................................23
Table 14: Microfinance outreach by region ...............................................................................24
Table 15: Loan information by region .......................................................................................25
Table 16: Interest rate of loan provision per month ...................................................................26
Table 17: Loan use...................................................................................................................26
Table 18: Savings information by region....................................................................................27
Table 19.1: Income statement ..................................................................................................27
Table 19.2: Income statement, average per VF ..........................................................................28
Table 20.1: VFs’ Balance sheet .................................................................................................29
Table 20.2: Average Balance sheet per VF .................................................................................30
Table 21: Return on Assets.......................................................................................................31
Abbreviations and Acronyms
ACCU Association of Asian Confederation of Credit Unions
ADB Asian Development Bank
APB Agricultural Promotion Bank
APRACA Asia Pacific Rural and Agricultural Credit Association
BoL Bank of Lao PDR
BSRP Banking Sector Reform Program
BWPN Banking with the Poor Network
CARD MRI Center for Agriculture and Rural Development Mutually Reinforcing
Institutions
CGAP Consultative Group for Assistance to the Poor
CPC Committee for Planning and Cooperation (before CPI)
CPI Committee for Planning and Investment (now MPI)
CODI Community Organizational Development Institute
DGRV German Cooperative and Raiffeisen Confederation
DPI Department of Planning and Investment
DTMFI Deposit-taking microfinance institution
DTVF Deposit-taking village fund
FIAM Foundation for Integrated Agriculture Management, a Thai NGO
GAA German Agro Action
GDP Gross national product
GIZ Deutsche Gesellschaft für Internationale Zusammenarbeit GmbH
GTZ Deutsche Gesellschaft für Technische Zusammenarbeit GmbH
IFAD International Fund for Agricultural Development
INGO International non-government organization
LCSDPA Lao Community Sustainable Development Promotion Association
LCRDPE Leading Committee for Rural Development and Poverty Eradication
LPRYU Lao People’s Revolutionary Youth Union
LVCA Lao Village Credit Association
LWU Lao Women’s Union
LECS Lao Expenditure and Consumption Survey
MCBR Microfinance Capacity Building and Research Project
MFC Microfinance Center
MFI Microfinance institution
MFWG Microfinance Working Group
MOF Ministry of Finance
MPI Ministry of Planning and Investment
NDTMFI Non-deposit-taking microfinance institution
NDTVF Non-deposit-taking village fund
NERI National Economic Research Institute

NGO Non-governmental organization
NGPES National Growth and Poverty Eradication Strategy
OSS Operational self-sufficiency
PAR Portfolio at risk
ROA Return on assets
SBFIC Savings Banks Foundation for International Cooperation
RFSDP Rural Finance Sector Development Program
SCU Savings and credit union
SRDP Small Rural Development Project
UNDP/CDF United Nations Development Program/Capital Development Fund
VB Village bank
VDF Village Development Fund
VF Village Fund
VFP Village Fund Promoter
VSCG Village Savings and Credit Groups
VWU Vietnamese Women’s Union
WCEP Women and Community Empowering Project
WFDF Women and Family Development Fund
WIDP Women in Development Project

i
FOREWORD
From 2003 to 2006 the National Economic Research Institute (NERI) of the Ministry of Planning
and Investment (MPI) conducted and published four annual rural and microfinance surveys under
the Microfinance Capacity Building and Research Project (MCBR), supported by Concern
Worldwide. Due to a lack of funding no surveys were carried out in 2007 and 2008. The present
survey for the year 2009 has been supported by GIZ through BoL and MPI.
The surveys since 2003 indicate that outreach of microfinance institutions including village funds has significantly increased: in terms of savers and borrowers, villages with their own funds, savings mobilized, and loans disbursed. Among the most remarkable achievements have been (i) the establishment of a regulatory framework for the formal microfinance sector; and (ii) the widespread transition of the semiformal microfinance sector from unsustainable credit-driven revolving funds to increasingly self-reliant savings-led village savings and credit funds.
With the growth of the sector new challenges emerge: expanding outreach to remote areas and the very poor, extending monitoring services to the semiformal microfinance sector, and, most
seriously, capacity building for staff, management and governing bodies as well as clients of all types of microfinance institutions. A major challenge has resulted from the closing of projects
supported by international organizations and their transfer to government agencies, which lack the necessary experience and technical competence. Therefore the Government has transferred
responsibility for the rapidly growing number of village funds and their promoting agencies and projects from the Ministry of Planning and Investment to the National Leading Committee for
Rural Development and Poverty Eradication. However, numerous government agencies are
involved in the promotion of village funds, which cover about half the villages of the country, without the required technical and financial skills. An alternative strategy has emerged in recent
years: establishing sustainable network organizations with a range of services to member institutions. Owned by the village funds, these organizations are based on principles of self -
financing, self-management and self-governance. They may eventually replace the functions of their governmental and international support organizations; but this will require further capacity
building on a substantial scale. Their potential goes beyond technical and financial services for their members. They already provide monitoring and reporting services to their members and
prepare consolidated financial reports, of which this survey has made good use. These are actually functions of the supervisor, BoL, which does not possess the resources for monitoring and
supervising such large numbers of institutions. However, once BoL recognizes the network organizations as legal representatives of the village funds and helps strengthening their capacity as
monitoring and reporting agencies, a system of delegated supervision might evolve as in a number of developed and developing countries with large numbers of small financial institutions. This
survey has included some network organizations as promoters and as providers of data, but has not focused on them as a special subject; this may be left to future surveys or special studies. The National Economic Research Institute of the Ministry of Planning and Investment is pleased to
present the results of its fifth survey of the microfinance sector. I do hope that this publicati on will
be a helpful reference for policymakers, donors, other concerned stakeholders, researchers and
students and all those who are interested in microfinance.
ii
On this occasion I would like to express my gratitude to the esteemed officials of provinci al and district organizations, projects and counterparts for their active cooperation with the survey team
of NERI and their valuable contributions to the collection of data. Let me finally express my sincere thanks to BoL and GIZ for their greatly appreciated support to the national microfinance statistical
survey 2009.
______________________________________
Dr. Leeber LEEBOUAPAO
Director General National Economic Research Institute, MPI

iii
FOREWORD
It is with great pleasure and also some relief that we are finally able to publish this report. The
careful reader will notice that it is somewhat different from NERIs previous statistical studies on
microfinance, the last one being from 2006, because present a much more differentiated picture
of the microfinance sector in Laos. The main reason for such a more differentiated view was the
emergence of a formal, regulated microfinance sector after the introduction of a specific
regulatory window for Deposit and Non-Deposit Taking MFIs as well as SCUs through BoL in 2008.
Another reason is our recognition of the fact that the large semi-formal sector of village funds
itself is quite diverse. The most significant differentiating criterion of village funds is the ir focus - or
lack thereof- on the mobilization of savings. Our findings of analyzing deposit taking and credit-
only village funds separately speak a very clear language. They will leave the reader without a
doubt about which model holds more promise for successful financial service provision to poor
people. I am happy that we are able to publish the first report since 2006 that provides complete
primary data on the supply of microfinance in Laos.
I congratulate the National Economic Research Institute (NERI) of the Ministry of Planning and
Investment for doing a solid job in collecting the primary data from all over the country. I also
would like to thank Professor Dieter Seibel for leading the team in writing this report and Jutta
Rehag for valuable support with data cross checking and data analysis.
I am hopeful that our cooperation could contribute to making this study a valuable source of
information for the Lao Government as well as the national and international microfinance
community.
_____________________________________ Klaus Prochaska
Project Director
Microfinance in Rural Areas - Access to Finance for the Poor (AFP)
GIZ - German International Cooperation

iv
ACKNOWLEDGEMENTS
The National Economic Research Institute (NERI) of the Ministry of Planning and Investment is happy to announce that after an interruption of two years, 2007 and 2008, we have been able to resume our annual surveys for 2009, thanks to the support of GIZ to BoL.
On behalf of the editorial board I would like to convey our gratitude to the esteemed agencies and
individuals who have provided assistance in our data collection, data analysis and publication of the national annual microfinance statistics report for the year 2009. This publication would not have been possible without the support of government organizations, projects and microfinance institutions, especially Planning and Investment, Social Welfare, Lao Women’s Union, Youth Union, Trade Union, Lao National Front for Construction and Rural Developmen t and Poverty Eradication offices at provincial and district levels.
We express our sincere thanks to the Bank of the Lao PDR and the Ministry of Planning and
Investment for their confidence in NERI in launching this microfinance statistical survey. Many thanks also go to the members of the survey team for their great effort in developing the
methodology, preparing the questionnaire, coordinating with relevant agencies and individuals, collecting data in the field and for their comprehensive and insightful analysis of the data. Once again we would like to express our s incere thanks to GIZ for their valuable technical and financial support to this microfinance statistical survey. It would have been impossible without their assistance to prepare this publication.
_____________________________________
Souphith DARACHANTHARA Deputy Director General National Economic Research Institute, MPI Team Leader

1
Chapter 1: Microfinance in the Lao PDR
1.1. Background and History of Microfinance in the Lao PDR
The development of microfinance in the LAO PDR dates back to the early 1990s when the country
opened up and began evolving towards a market economy. The process started with support by
multilateral and bilateral organizations for the establishment of village-based credit schemes and
revolving funds. Between 1994 and 1996 NGOs followed suit. By 1996 more than 20 international
organizations were involved in rural credit funds across all 17 provinces. Projects were
implemented through district level administrations with the LWU, agriculture and forestry offices
and other local government entities. Virtually all projects started with credit; over time many also
got involved in savings. Villages are small in Laos, many with less than 100 households on average.
Thus, most of the emerging credit groups were small. With donor support the number of credit
schemes and revolving funds grew rapidly. According to a national survey of access to finance by
UNDP/UNCDF (1997), the number village funds in cash or kind had reached 1,640 by mid-1996,
covering about 15% of all villages. They included more than 1,000 rice banks, some livestock banks
and revolving credit funds. Given the low degree of monetization of the rural economy, most
credit was in kind. All projects were carried out in cooperation with government organizations,
among them the Department of Social Welfare and mass organizations. Prominent among them
were the Lao Women’s Union (LWU) and the Lao People’s Revolutionary Youth Union (LPRYU)
whose outreach encompasses almost every village. UNDP/UNCDF also compiled a list, albeit
incomplete, of donor-financed projects with Lao Village Credit Associations (LVCA), as they were
called at the time. The list comprised 28 projects by 13 NGOs in 1,050 villages (CARE being the
largest, covering 649 villages) and 9 projects by multilateral organizations in 518 villages (UNICEF
being the largest, covering 489 villages).
The rapid growth in the number of village funds, their credit bias and donor dependence led to
increasing concerns about their viability and sustainability. These concerns were articulated by a
Microfinance Roundtable of government and donor agencies, coordinated by UNDP/UNCDF. Three
microfinance conferences were held in 1995 and 1996 1. Two major issues emerged: enhancing
savings mobilization and improving the regulatory environment for microfinance services. These
issues were subsequently taken up by a national consultation workshop in March 1997, jointly
organized by BoL, APRACA and GTZ, which concluded that,
Laos needs a well-functioning system of microfinance with viable institutions and sustainable financial
services for all segments of the population. There was consensus that such a system: (i) should be
savings-driven; (ii) comprise basic microsavings, microcredit and microinsurance services; and (iii)
must be based on the cultural traditions of Laos in which women play a crucial role in microfinance;
decisions must be reached with local level participation; and microfinance services must reinforce the
existing networks of solidarity. (BoL, APRACA & GTZ 1997: 21)
1 By GRETT, CCL, IRAM and BOL in October 1995, by UNDP/ UNCDF in August 1996 and by UN-ESCAP during the same
month.

2
In the following years progress was rapid. In June 2008 BoL promulgated microfinance regulations,
and by 2009 when this survey was carried out 26 MFIs were registered or licensed by BoL, either as
private companies or as savings and credit cooperatives. In addition, as a result of a very fruitful
collaboration of donor agencies with provincial and district authorities, up to 5,000 village funds
have come into existence, covering about half the villages of the Lao PDR, the majority savings -
based. 4,113 village funds have been identified through VFPs 2 in this survey. The data collected
indicate a revolutionary change from revolving funds to deposit-taking funds, or in other words:
from providers of credit-only to semiformal savings-based microfinance institutions. These
deposit-taking funds account for 76% of all village funds in the survey, 92% of their members and
87% of their loan portfolio.
Growth in the number and membership of village funds continues not least due to its support by
various government institutions and donors. Between 2003 and 2007 the Lao Government had
channeled an amount of some 41.7 billion Kip (about USD 5 million) from domestic resources into
the establishment of village funds in the 47 poorest districts.
1.2. From Microcredit to Microfinance: the Terminology of an Emerging Sector
The term microfinance has been introduced in the early 1990s to replace the term microcredit.
The new term microfinance was meant to refer to financial intermediation between low-income
savers and borrowers without access to commercial banks and comprises microsavings and
microcredit as well as other financial services. In the Lao PDR, the policy statement on the
development of sustainable microfinance defines microfinance as “the provision of a broad range
of financial services, such as cash-based credit, deposits, insurance, etc., to the poor, low-income
households, and their micro-enterprises”.3 Microfinance institutions (MFIs) in the broader sense
include formal, semiformal and informal financial intermediaries 4 providing both microsavings and
microcredit as well as other financial services.5 Microfinance overlaps with more recent terms such
as ‘inclusive finance’, denoting access to finance for all, particularly low-income people, and
‘responsible finance’, particularly among commercial banks. There is no agreement on what
constitutes microsavings and microloans, which vary widely in size between countries and
institutions, except that the amounts should be small, which is relative. Only a few countries have
defined what they mean by ‘microloan’, among them Laos, which in its current regulations has set
a ceiling of 10 million Kip (USD 1,175). Some argue that such a definition is better left to individual
institutions, lest a narrow definition excludes the enterprising poor from access to larger loans and
2 See definition on page 4.
3 Endorsed by the Prime Minister, PMO/1760, 17 December 2003.
4 Formal financial institutions fall under the regulation and supervision of the central bank; semiformal financial
institutions are officially recognized, but not regulated; other financial ins titutions, such as indigenous savings and credit groups, are informal financial institutions. From a central bank perspective both semiformal and informal financial institutions are nonformal. 5 According to CGAP (2008: xiii) “MFIs are defined as licensed and unlicensed financial institutions that include
nongovernmental organizations, commercial banks, credit unions and cooperatives, and agricultural, development, and postal savings banks. They range from specialized microfinance providers to programs within larger, multipurpose development organizations.”

3
from graduating to employment-generating small enterprises, while allowing the MFI to diversify
its risk.
In its regulations of June 2008 BoL has defined formal microfinance (see next chapter). However,
the vast majority of microfinance institutions or activities is village based and continues to be non-
formal. These have come under many different names and guises. In the mid-1990s, UNDP/UNCDF
(1997) used the term Lao Village Credit Associations (LVCA) but the term association should now
be reserved for organizations that fall under the Decree on Associations of September 2009, which
precludes the registration of funds as associations. In their own terminology government agencies
and donors have promoted credit groups, revolving fund groups, village revolving funds,
community-managed loan funds, village savings and credit groups (VSCGs), savings and credit
societies, microfinance and rural financial services. In the last unofficial draft of the forthcoming
Prime Minister’s Decree on microfinance institutions they are jointly referred to as “microfinance
projects”.
The early emphasis on ‘credit groups’ goes back to the assumption in the past that people in Laos
are too poor to save and therefore need revolving funds. Over the last decade many have learned
that Laotians have a high propensity to save, particularly women as the holders of the family purse
strings. Therefore credit groups have shown to varying degrees a tendency to evolve into savings
and credit groups. This survey will show that they now account for 70% of the funds.
In recent years government agencies have mainly used the term Village Development Fund (VDF)
to refer to village-based funds, expressing their concern for village development. Major donors like
ADB, GIZ and ILO have referred to them as village banks, even though they do not fall under the
banking law. In this survey we use the term village funds (VFs) for village-based financial
institutions owned and managed by their members. These village funds comprise both credit funds
and deposit-taking funds. We use the term village fund promoters (VFPs) for governmental, non-
governmental and international organizations, which establish village funds and provide technical
assistance to them.
1.3. The Emergence of Village Fund Networks
Self-financing (through member savings), self-management (through an elected management
committee) and self-governance (through an advisory committee of representatives of the
community) are the basic principles of the majority of village funds in the Lao PDR. One of the
most remarkable features of the nascent subsector of village funds has been the emergence of
service networks of village funds which are built on these principles. In 2003 the Thai NGOs FIAM
and CODI started to establish service networks among the village funds (453 village funds as of
2009) that had been promoted in the municipality since 1998. The network of Saithany District has
served as a model, which has spread throughout the districts of Vientiane Capital and, with
modifications, to other provinces and donor-supported projects.6 Since 2005 GIZ has supported
6 Cf. Seibel 2010

4
the creation of so called network support organizations, which provide technical assistance and
financial services to their member village funds. The promotion of these village bank support
structures is a key element of GIZ’s approach to village funds in Laos. Both models will be
described in greater detail in section 2.1. below.
The emerging networks have a crucial role to play in the development of the village funds. Several
development organizations pursue the approach of creating sustainable associations as service
apexes of village funds. However they require further strengthening, in particular with their ability
to carry out core network functions such as registration of village funds within the network,
reporting, monitoring, guidance and supervision. Support might also include the establishment of
specialized services for training, liquidity exchange and auditing. Increased communication among
the promoters should lead to a certain harmonization of bylaws, operations and development
strategies. The currently existing networks have no appropriate legal status, and thus lack
recognition and sustainability as such: a challenge to stakeholders. Efforts should be made to have
the networks registered and recognized as facilitators of a process aimed at establi shing a properly
monitored system of village funds, perhaps as a first step to a future system of delegated
supervision. 7
1.4. The Microfinance Working Group for the Lao PDR (MFWG)
The Microfinance Working Group for the Lao PDR (MFWG) is the national microfinance industry
network and was established in May 2007. It aims at bringing together microfinance practitioners
and other relevant stakeholders to share experience and information about the sector with the
goal to improve sector coordination, transparency, sustainability and quality of microfinance
services. Its services focus on three core areas: knowledge management/research &
representation, capacity building and advocacy.
MFWG members presently comprise regulated microfinance institutions (DTMFIs, NDTMFIs, SCUs
and Network Support Organizations) as well as donors, bi/multi -lateral agencies, INGOs, service
providers and resource persons working in microfinance. The network is a member of reputed
regional and global networks (such as SEEP, BWTP and Social Performance Task Force Working
Group) to ensure exposure to global microfinance trends & developments and international sector
representation. Since January 2011 the MFWG has a secretariat and full-time staff and strives to
become a professional, sustainable organization representing the industry interests and
responding to its needs.8
1.5. The Regulatory Framework of Microfinance
The basic legal framework for the financial sector of Laos was laid down in the early 1990s. BoL
was created in 19909 as a central bank with licensing, supervision and prudential regulatory
powers over financial institutions, which were defined as legal persons doing banking or similar
7 Seibel 2010
8 Microfinance Working Group [[email protected]]
9 Law No 04/PSA of 27 June 1990.
5
business. The framework for the regulation of financial institutions was laid down in 199210 and
covered commercial banks and non-bank financial institutions. Non-banks were restricted from
mobilizing funds from the general public and from issuing shares or bonds. BoL was empowered to
make separate regulations for banks and non-banks. During the same year, a draft law on credit
cooperatives was prepared but not enacted due to the negative experience with credit
cooperatives and their collapse in the late 1980s. Initiatives in the mid-1990s led to a consensus on
the need to promote sustainable microfinance institutions, which would require a legal
framework. In 2004 a Microfinance Division was created, which converted into the Department of
Financial Institution Supervision of BoL in 2010.
In 2005 BoL launched a Regulation on the Establishment and Implementation of Microfinance
Institutions in Lao PDR (No.10/BoL), announcing that large microfinance institutions had to apply
for licenses while smaller ones such as credit unions, cooperatives, saving and loan associations
and village funds had to be registered, depending on their scale of operation. This was followed by
a notice by the Prime Minister on microfinance supervision in 2007 11 and finally the
announcement of three regulations, issued in June 2008.
There are two basic provisions in the regulation of 2008: the first one stipulating that any
organization, group or enterprise – governmental, non-governmental or private – that carries out
microfinance activities, including village banks, savings groups, village funds, development funds
and others, is required to register (Regulation No. 02/BoL Art. 3); the second one requiring any
microfinance entity with voluntary deposits exceeding 200 million Kip or annual revenues
exceeding one billion Kip to be licensed as a prudentially regulated MFI (Regulation No. 02/BoL
Art. 20); however, this requirement has not been enforced. BoL has set a ceiling of 10 million Kip
on microloans, but imposes no interest rate restrictions. The three regulations are summarized
below: No. 02/BoL on Non-Deposit-taking Microfinance Institutions: NDTMFIs which do not exceed voluntary
deposits of 200 million Kip or revenues of one billion Kip are required to register with BoL and relevant
government authorities; there is no minimum size below which registration would not be required.
Within this framework NDTMFIs are authorized to mobilize savings from their members and grant
microloans up to 10 million Kip. They have to apply BoL’s provisioning rules and submit annual reports
using BoL’s chart of accounts.
No. 03/BoL on Savings and Credit Unions: SCUs can be local, single units or have branches and offices
nationwide. 10 founding members together with 100 initial members, or 250 members with voluntary
deposits of 300 million Kip, can establish an SCU; minimum capital requirements are 100 million Kip .
SCUs are only allowed to provide financial services to members. With regard to credit, the regulation
does not explicitly restrict SCUs to microloans. Prudential requirements include a maximum NPL ratio of
5%, provisioning as prescribed by BoL, writing-off loans overdue >180 days, a risk-weighted CAR of 12%
and liquidity ratios of 4% of cash in hand and 20% overall. SCUs have to be audited by external
chartered accountants and supervised by BoL. Reporting is quarterly and annually.
10
Decree No. 3 of 23 January 1992. 11
No. 05/PM, dated 04 April 2007

6
No. 04/BoL on Deposit-taking MFIs: DTMFIs can be local, single units or have branches and offices
nationwide. Establishing a DTMFI requires five shareholders and one major shareholder with at least
20% of registered capital, a total registered capital of one billion Kip divided into shares, and a five-year
business plan demonstrating sustainability. Voting is by simple share majority. DTMFIs may provide
financial services to the general public; but at least 80% of their portfolio must be comprised of
microloans not exceeding ten million Kip.12 Prudential requirements include: voluntary deposits not
exceeding 10 times the capital, a single-borrower limit of 10% of capital, provisioning as prescribed by
BoL, including 5% on performing loans, a maximum NPL ratio of 5%, a risk-weighted CAR of 12%,
liquidity ratios of 4% of cash in hand and 20% overall, and investments in other MFIs up to a maximum
of 10% of registered capital. DTMFIs have to be audited by external chartered accountants and are
supervised by BoL. Reporting is monthly, quarterly and annually.
The above mentioned regulations on Non-Deposit-taking Microfinance Institutions and on
Deposit-taking MFIs are likely to be modified soon by a forthcoming Prime Ministerial Decree on
Microfinance and subsequent regulations there under, which is currently developed with the
assistance of GIZ. A final draft of the Decree is currently under review of the Prime Minister’s
Office and is expected to be published in the second half of the year 2011.
Chapter 2: Governmental and International Support Programs
2.1. Government Programs and Projects
The National Growth and Poverty Eradication Strategy (NGPES) was approved in 2003 by the 4th
Ordinary Session of the National Assembly identifying 47 priority districts for poverty eradication.
Regarding the lack of capital for income-generating activities as one of the main obstacles to
poverty eradication, the Government allocated an amount of 25 billion kip for the 47 poorest
districts in the 2003-2004 budget to establish village funds as a source funds for production and
services13. This should enable the poor to gradually change from traditional to modern
technologies and respond to market demand. This in turn was expected to strengthen
communities and their development potential in the framework of the NGPES.
To monitor and supervise the utilization of the budgetary resources, the Government established
village fund supervision committees (VFSCs) at central, provincial and district levels.14 This was
followed by an instruction of the Prime Minister’s Office and President of the Leading Committee
for Rural Development and Poverty Eradication (LCRDPE) on the financial management of the
village funds, issued on 14 January, 2009. So far, the current structure of VFSCs is still in force as
presented in Figure 1.
12
This may be a serious constraint on their viability and on their ability to graduate borrowers from microenterprises
to employment-creating small enterprises. 13
Notice Letter No. 72/CPC, 28 January, 2004. 14
Decree of the President of the Committee for Planning and Cooperation No. 408/CPC, dated 29 April, 2004.

7
Figure 1: Village Fund Supervision Committees (VFSCs) Chart
From 2003-2007 the Government allocated some 41.7 billion Kip to the development of village
funds across the country. 15 10% of the budget was used for technical support at central, provincial
and district levels. 90% was dedicated as seed funds for VFs. By September 30, 2009 the
Government’s support for VFs in the 47 poorest districts covered 528 villages and 34,865 families.
The number of active members comprised 21,759 families, and total revolving funds stood at 42.5
billion kip.16
2.2. International Programs and Projects
Currently there is no institution that can provide a complete overview of the various international
programs and projects that support microfinance in Laos in collaboration with government
agencies and mass organizations. However the MFWG is currently preparing a donor mapping and
will be best positioned to provide such information in the future. The following overview is to be
seen as indicative only.
15
Source: Instruction of the Minister for the Prime Minister Office and President of the Leading Committee for Rural Development and Poverty Eradication (LCRDPE) 16
LCRDPE , Annual Report on Village Development Fund Performance, 2008 -2009, .
District Chairman Vice District Governor
Provincial Chairman Vice Governor
Vice Chairman DG of Provincial
DPI
Committee DG of Provincial DF
Vice Chairman Head of planning
office
Committee Head of Financial
Office
Central VF supervisor
LCRDPE
Provincial Members Mass organization, Lao front offices…
District Members Mass organization, Lao front offices…
District VF supervisor Rural Development Office
Provincial VF supervisor
Rural Development Office
Village Funds

8
2.2.1. Multilateral and bilateral agencies
ADB has played a prominent role in the development of the financial sector in Laos. Its emphasis
has been on the formal sector and included banks and MFIs. In microfinance ADB has focused on
the policy framework for MFIs and on strengthening such institutions as a poverty reduction
mechanism. ADB has completed a project, which included the preparation of three regulations
together with the related charts of accounts (enacted in June 2008), and the establishment and
strengthening of the Microfinance Division in BoL. Another ADB project established some of the
first SCUs in Lao PDR, but faced tremendous challenges: their managers and staff were
inexperienced, their boards were weak, and their outreach was low. To address these weaknesses
and to provide continuous support to the nascent microfinance sector, ADB together with BoL
launched ‘Catalyzing Microfinance for the Poor’ in 2007. The project targeted the rapidly
increasing number of MFIs, comprising 5 DTMFIs, 8 NDTMFIs and 13 SCUs. The two main
instruments of support were capacity-building to all 26 formal MFIs and the provision of matching
grants to 18 MFIs which had fulfilled the eligibility criteria. Capacity-building included the
development of training materials adapted to the Laotian context in business planning, awareness-
raising, microfinance best-practice, credit and delinquency management, governance,
management information systems/Micro Banker as well as accounting training with MFC.
Matching equity grants between $3,000 and $50,000 per MFI were provided in tranches over a
three-year period. ADB found that the absorptive capacity for matching grants was greatest among
profit-oriented DTMFIs funded by private shareholders. But overall the capacity of MFIs to
mobilize their own resources was limited; only about half of the $800,000 earmarked for matching
grants were absorbed. The financial performance of the 18 MFIs supported under Catalyzing
Microfinance for the Poor project from 2008 to 2010 was found to vary widely.17 As of September
2010, the challenge was to bring 13 out of the 18 assessed MFIs below the prudential limit of a
portfolio at risk (PAR >30 days) of 5%, and 8 out of 18 MFIs above an operational self-sufficiency
ratio (OSS) of 100%. In 2009 ADB also examined the feasibility of an apex microfinance fund. It
concluded that, given the small number and scale of qualified regulated MFIs, there would be no
scope for such an apex institution within the foreseeable future, t he core challenge being shortage
of human resources and technical assistance.
17
At baseline (Sep 08 – May 09) portfolio at risk (PAR >30 days) averaged 15%, ranging from 0% to 61%; by September
2010 it had deteriorated to an average of 17%, ranging from 0% to 69%. In contrast, the trend of the operational self-
sufficiency ratio (OSS, with a break-even at 100%) was more positive. At baseline it stood at an average of 109%, with
a range from 14% to 177%; by September 2010 it had improved to an average of 111 %, with a range from 57% to
196%.

9
GIZ18 has worked on the creation and the support of village funds in Laos since 1998. It started in
three provinces (Bokeo, Luang Namtha and Sayaboury) under the project “Rural Development in
Mountainous Areas (RDMA)”. By mid 2009 there were a total of 298 village funds with 23,923
member accounts. Since May 2009 GIZ’s support of village funds is part of a new project
“Microfinance in Rural Areas - Access to Finance for the Poor (AFP)” with BoL as government
partner. AFP now works in Bokeo, Luang Namtha, Sayaboury, Attapeu and Savannakhet. Since the
inception of the project the number of project village funds has increased to 346. By April 2011
there were 26,142 member accounts, some 4 billion Kip in savings and 10.6 billion Kip in loans
outstanding. Total assets amounted to 13.13 billion Kip, which included grants of some 6.68 billion
Kip. GIZ originally provided seed capital and keeps providing technical assistance and also
cooperated with several other actors. Most prominently IFAD provided seed capital and
equipment to village banks in Bokeo (1998-2004), Sayaboury (since 2006) and Attapeu (since
2009). The total amount of seed capital provided by GIZ, IFAD, Lao Government and Norwegian
Church Aid (NCA) between 1998 to 2011 amounted to 7.24 billion Kip (56% of which was given to
Bokeo). In 2011 GIZ widened its outreach to Savannakhet in cooperation with Mining and Minerals
Group (MMG). A pivotal part of GIZ’s approach is to establish so called network support
organizations for village funds. So far it has assisted with the creation of five, three of which are
already registered with Bank of Lao and licensed as limited companies with the Department of
Industry and Commerce at provincial level.19 The remaining two have submitted their applications
to BoL in December 2010. The network support organizations are designed to become sustainable
by providing cost covering financial intermediation services and technical support against service
fees to their member village funds. AFP also supports the BoL on the policy level, in particular with
improving the regulation and supervision of microfinance activities.
ILO has supported the establishment of a total of 139 village banks in 5 provinces (Bolikhamsay,
Champassak, Savannakhet, Khammouane, and Sayaboury) in close collaboration with the Lao
Community Sustainable Development Promotion Association (LCSDPA20) and the provincial
departments of labor and social welfare, and of industry and commerce. ILO’s intervention
initiated in 2003 and was part of two technical cooperation projects to reduce the incidence of
human trafficking (2003-08) and to promote women entrepreneurship and gender equality (2009-
11). The ILO developed a village banking methodology that is savings -based, inclusive, client-
focused and geared towards financial sustainability. The established village banks serve over
27,000 members. LCSDPA is providing technical, monitoring and auditing support. The detailed
methodology, adapted to the Lao context, is presented in materials titled “Village Banking in Lao
PDR” published in 2008 in English and Lao language. The materials consist of a Handbook for
Village Bank Management Committees and Support Organizations, and a Ledger Guide21. They aim
18
GIZ was formed on 1 January 2011, completing a merger process of three German technical assistances agencies. It
brings together the long-standing expertise of Deutscher Entwicklungsdienst (DED) GmbH (German Development
Service), Deutsche Gesellschaft für Technische Zusammenarbeit (GTZ) GmbH (German technical cooperation) and
Inwent – Capacity Building International, Germany. 19
Two organizations are registered under the name Community Credit and Savings Associations (CCSAs) and one as
Village Development Fund Association (VDFA). 20
LCSDPA has also received direct funding from the Family Stone Foundation. 21
http://www.ilo.org/asia/whatwedo/publications/lang--en/docName--WCMS_100502/index.htm

10
to help village bank management committees to improve the operations and sustainability of their
village bank, and to assist village bank support organizations and associations in providing
technical assistance. Since the issuance of the BoL’s microfinance regulation, the ILO has been
exploring ways to best support the established village banks to comply with the regulation. Due to
limited resources, no concrete intervention has started yet.
UNDP/UNCDF. In the mid-1990s UNDP/CDF initiated a microfinance roundtable, acting as a
coordinator of communication among international donors. In 1996 UNDP/CDF carried out the
first microfinance survey among rural households, reporting on 1,640 village funds (most of them
rice banks) and 28 projects. Concluding that the dominant revolving fund approach posed serious
problems of sustainability, a project was prepared with BoL in 1997 to build capacity and
disseminate good practices. Field interventions in three provinces led to the establishment of
three MFIs: Sayaboury Microfinance Office, Sihom Project Savings and Credit Scheme and
Oudomxay Development NDTMFI. One of the lasting results has been the establishment of the
Microfinance Center (MFC), a leading training and consultancy provider. In June 2010 UNCDF and
UNDP entered into a joint programme entitled “Making Access to Finance more Inclusive for Poor
People”, nationally implemented by the Bank of Lao on behalf of the Government of the Lao PDR.
The 4 ½ yr programme, with an approximate budget of USD 7.0 million will adopt a sector based
approach to deliver change at the macro, meso and micro levels by providing capacity building
assistance to regulators, those who meet the needs of financial service providers and direct
interventions with them. This will include, inter alia, providing and mobilizing strategic capital and
technical assistance to increase access to financial services by low-income households and
microentrepreneurs on a sustainable basis, with an ultimate goal of increasing client numbers in
the microfinance sector from 30,000 in 2010 to over 140,000 by the conclusion of the project in
2014. The project has a UNCDF Chief Technical Advisor on site and is overseen by the Bank of Lao
PDR.
The World Bank provides financial and implementation support to the development of village
funds through its Community Driven Development (CDD) projects. The Khammouane
Development Project (KDP), 2008-2013, aims at provincial capacity building and local development
through grants to 27 villages in 3 districts to support their agricultural livelihood activities. Its local
implementing partner is the provincial government through the Planning and Investment Office.
The Sustainable Forestry and Rural Development Project (SUFORD), 2004-2008 and 2009-2011,
provides revolving funds to 723 rural villages in nine provinces to support their livelihood
development for sustainable forest management. The project is co-financed with the government
of Finland and implemented by the Department of Forestry, MAF. The Lao Social and
Environmental Project (LSAE) Additional Financing, 2010-2013, provides grants for livelihood
development for sustainable watershed management to 12 villages in two dis tricts of
Borikhamxay. The Livelihood Pilot Project, as part of the Poverty Reduction Fund-II (PRFII) under
the National Committee for Rural Development and Poverty Eradication, 2011-2014, focuses on
the four poorest districts of Houaphan and Savannakhet. The pilot project will provide grants to
http://www.ilo.org/wcmsp5/groups/public/---asia/---ro-bangkok/documents/publication/wcms_100503.pdf
11
self-help groups of 10-20 families in some 200 villages, with the objective of improved nutrition in
the community. In Khammouane and Savannakhet Village Income Restoration Funds are
established as part of a downstream livelihood strategy, compensating villages for the loss of
livelihood caused by Nam Theun 2, a large hydropower project. 22 The World Bank provides
implementation support through its technical and management teams in cooperation with LWU;
financial support is provided by the Nam Theun 2 Power Company (NTPC) and the government.
2.2.2. Non-governmental agencies
ACCU. The Association of Asian Confederation of Credit Unions, with its head office in Bangkok,
has supported the development of SCUs in Laos since 1992. This also included capacity building of
village funds (as pre-SCUs) and their upgrading to SCUs. ACCU’s main partners have been the Bank
of Lao PDR, the provincial Department of Planning and Investment (DPI) in Luang Prabang,
Sayaboury, Oudomxay and Luang Namtha and two Dutch NGOs, Agriterra and Rabobank
Foundation. Its activities included contributions to the preparation of a regulatory framework for
SCUs (promulgated by BoL in 2008) and of bylaws; the promotion and organization of 19 VFs
(initially referred to as village savings and credit groups, VSCGs) during 1995-2000; technical
support to 6 SCUs and 44 VFs in 2002-2008; and organizational strengthening of 22 VFs in 2009-
2010, together with capacity building for participating organizations. Most VFs in Laos mobilize
savings but do not collect share capital; in contrast, the promotion of VFs as pre-SCUs by ACCU has
focused on the formation of share capital as a requirement of their transformation into licensed
institutions. As of December 2009 the 22 VFs had a share capital of 4.03 billion Kip and savings of
1.10 billion Kip; by 2010 savings had grown to 2.94 billion Kip, compared with a share capital of
4.22 billion Kip. With Rabobank Foundation support starting in 2011, ACCU is now assisting with
the transformation of VFs into SCUs and the establishment of an association of SCUs (ASCU) in the
northern region of Laos. ACCU’s overall objective in Laos, under the project name “Savings and
Credit Unions Development in Lao PDR” (SACUDIL), is to contribute to the development of a
sustainable market-oriented rural financial system and to poverty reduction.
DGRV. In the framework of a system of delegated supervision, the German Cooperative and
Raiffeisen Confederation acts as a national auditing confederation for some 5,400 cooperatives
with 17.8 million members in all sectors of the economy, including 1,138 cooperative banks. In
2007 DGRV started to support Naxaythong Rural Development Cooperative in Vientiane Capital,
which grew from 1,800 shareholder members in 2008 to 2,800 in 2010. Total assets grew from
2.61 billion Kip to 6.28 billion Kip, loans outstanding from 2.01 billion Kip to 5.60 billion Kip, share
capital from 0.30 billion Kip to 1.28 billion Kip and savings from 1.93 billion Kip to 4.30 billion Kip. It
is now the largest SCU in Laos. Following capacity building for VFs and their promoting agencies
(including LWU) in four provinces, DGRV helped establishing a Village Bank Service Center (VBSC)
as a cooperatively owned network support organization in Champhone District, Savannakhet
Province, in 2010. Within one year, as of April 2011, the VBSC reached 32 VFs with 1,889 members,
22
A Prime Minister’s decree stipulates that, if the loss of livelihood from dislocation due to hydropower or mining projects, which are numerous in the Lao PDR, is more than 20%, financial compensation packages shall be provided to establish village funds for „improved or better access to micro-finance and affordable micro-credit facilities.“
12
savings of 1.24 billion Kip and a loan portfolio of 1.07 billion Kip. The VBSC is expected to evolve
into a licensed SCU acting as a self-supporting financial intermediary and service provider for its
member VFs.
FIAM and CODI. The development and implementation of a savings-led approach toward the end
of the 1990s was spearheaded by two Thai organizations, both in cooperation with LWU. One was
the Foundation for Integrated Agriculture Management (FIAM) with its Women in Development
Project (WIDP) and Small Rural Development Project for Women (SRDPW), which took the lead in
1997 with an exposure program for LWU staff in Thailand. This was followed by the Women and
Community Empowering Project (WCEP) by the Community Organizational Development Institute
(CODI). In 1998 FIAM helped establishing the first savings-based village savings and credit groups
(VSCG, or VFs) in Saithany District and expanded in 2002 to Saysettha District. In 2002 this was
followed by CODI in the remaining seven districts of Vientiane Capital, and subsequently also in 15
districts in four other provinces23. As a sustainability strategy, the staff and functions of the FIAM
project were transmitted to LCSDPA as a domestic organization. The VFs are fully self-financed
through savings as a source of loanable funds and profits to compensate savers and committee
members; there are no donor capital grants or credit lines. By September 2009 FIAM and CODI in
cooperation with LWU had established 453 village banks/VFs in the nine districts of Vientiane
Capital, covering 91% of the villages and 48% of the families in the municipality. Out of 104,000
member-savers, 30,000 are borrowers and 25,000 life insurance participants. Total assets
amounted to 153 billion Kip ($18 million), total savings to 127 billion Kip. Average membership per
VF was 229, with 338 million Kip in average total assets, 280 million Kip in average savings and an
average of 299 million Kip in loans outstanding. Dividends received by savers amounted to 10.7%
of total savings. 193 out of the 453 VFs had accumulated savings of more than 200 million Kip. The
approach has become a model for LWU and other organizations with their partners throughout
Laos. A growing savings component is now widespread in most schemes which may have started
out as revolving funds. Together with LWU, FIAM and CODI have initiated self-sustaining networks
of village funds in all districts of Vientiane Capital.
SBFIC. In the framework of a regional program in Cambodia, Laos and Vietnam, the German
Savings Banks Foundation for International Cooperation has supported the development of
microfinance in Laos since 2008. With funding from the German Federal Ministry for Economic
Cooperation and Development (BMZ), SBFIC’s program comprises four components: the
establishment of a Women and Family Development Fund (WFDF) in partnership with LWU;
technical support to the DTMFI EMI and the training program of the Microfinance Centre (MFC) in
cooperation with CARD24 as a technical service provider; and support to the Microfinance Working
Group (MFWG). WFDF was established in 2009 as a savings-based financial intermediary.
Modifying the original Grameen banking approach, it operates on the principle of savings first.
With a ratio of 80% voluntary to 20% mandatory savings, total savings to date finance 70% of the
23
Four districts in Luang Prabang, three districts in Champassak, three districts in Bokeo and five districts in Phongsaly.
The total number of VFs promoted by CODI in Vientiane Capital and in four provinces is 471, among them 122 with more than 200 million Kip in savings. (Khanthone 2010, in Seibel 2010) 24
CARD MRI Rural Bank & NGO (Philippines), www.cardbankph.com/.

13
loan portfolio; the balance comes from a credit fund. WFDF is designed as a centralized institution
operating through groups of 4-6 women, centers of 8-10 groups and branches with 20-25 centers,
serving some 1,000-1,500 members per branch. WFDF is registered with BoL as a NDTMFI. Credit
disbursement started in January 2010, offering business loans and agricultural loans in rural and
semi-urban areas. Repayments are weekly during center meetings. After 16 months of operation,
WFDF has reached 2,600 clients through branches in three provinces (Borikhamxay, Vientiane
Province and Vientiane Capital), with an on-time repayment rate of 100%.

14
Chapter 3: Microfinance Data at the National Level
Country profile 2009
Capital: Vientiane
Population: 6,127,910
Population (15-64 yrs): 3,573,374
Area: 236,800 km2
Density: 26 persons/km2
Number of Households: 1,031,277
Number of Villages: 8,704
Number of Districts: 143
Number of Provinces: 16 + 1
Source: Statistical Year book 2009 (Lao Department of Statistics, MPI)
3.1. Background, Objectives and Methodology
The survey aims at presenting an overall picture of the microfinance sector to all stakeholders, including policymakers, government agencies, donors, microfinance practitioners and investors.
We hoped that the data collected will provide a basis for the planning and improvement of programs and interventions, contributing to the expansion and performance of the microfinance
sector in its various segments. The database may also be useful to academics, researchers and students who are interested in the analysis and development of the microfinance sector. NERIs data collection method has evolved over time. In 2003 and 2004 questionnaires were sent
by mail to government organizations and project offices at provincial and district levels. In an
effort to improve data quality, NERI sent its own survey teams to the field, contacting relevant
organizations directly, in 2005, 2006 and 2009.
In preparation of the present survey the team revised the questionnaire used in previous surveys.
Questionnaires were sent to coordinating partners identified by the provincial DPI and forwarded
to microfinance institutions and promoters in preparation of the actual field visit and data
collection. For practical reasons consolidated information covering several districts or provinces
was attributed to the district or province where the reporting organization had its head office, and
counted as a single entity (usually a VFP25). This may have had a distorting effect on the reported
provincial data.
The field survey team comprised of NERI professional staff, collected data from all 16 provinces
and Vientiane Capital, covering 143 districts and the development zone of Nam Nhou area in
Bokeo province. The team interviewed all entities at provincial and district levels with quantitative
information on microfinance activities. This included promoting agencies with consolidated
information on a number of microfinance entities, such as government agencies, mass
organizations, the Lao National Front for Construction and projects as well as microfinance
institutions and a small number of individual village funds. The total number of entities providing
25
See definition above in Chapter 1.2

15
data was 218, comprising 5 deposit-taking and 8 non-deposit-taking MFIs, 13 SCUs, and 192
entities providing information on village funds. The latter figure is comprised of 171 village fund
promoting agencies with consolidated data on several village funds and 21 single reporting village
funds. In most of the tables in this report the information provided by the 192 entities is lumped
together under village fund promoters (VFPs). The total number of village funds identified by the
survey is 4,113. This is an approximation, as the team might have missed some funds which could
not be contacted, particularly in remote areas, while others may have been double-counted due to
multiple reporting. In contrast to previous reports, this survey does not include data on the
Agricultural Promotion Bank and Nayobai Bank, which do not report on microcredit as defined by
BoL. However, the survey does include data on the postal savings institution.
3.2. The Regulated Microfinance Sector
3.2.1. Number of MFIs by Region
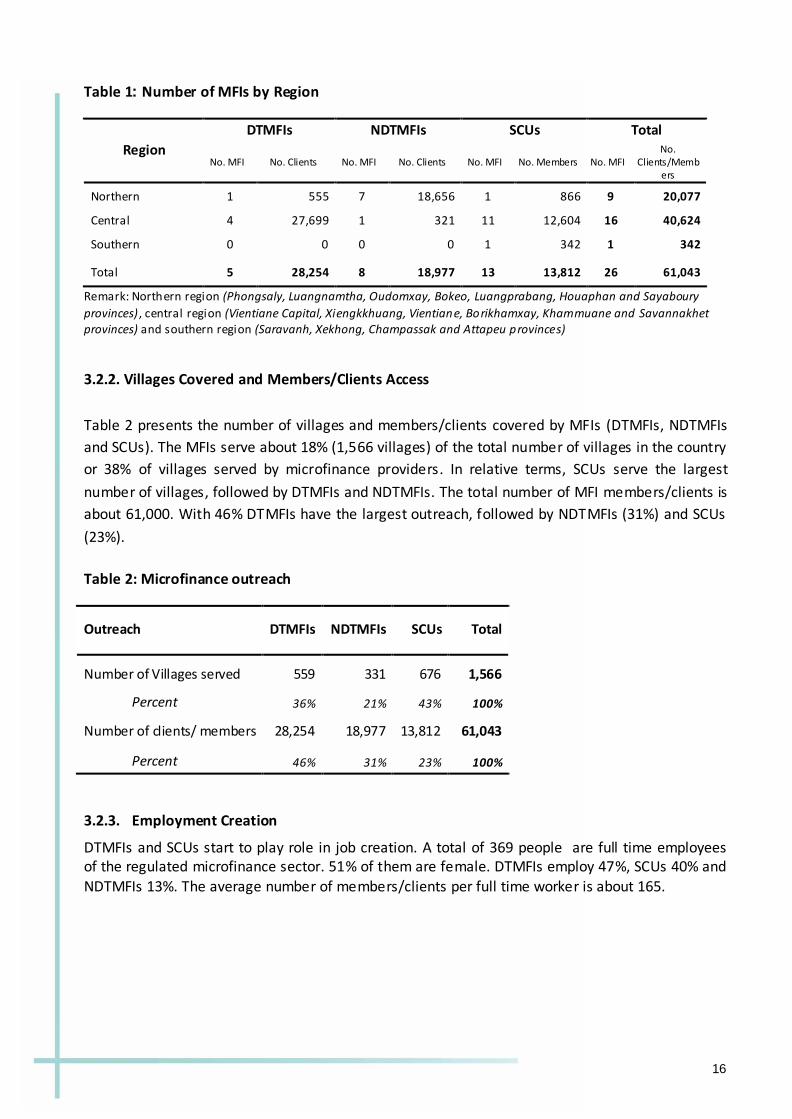
Table 1 presents the total number of regulated microfinance institutions (MFIs) by region as of
2009. There were 26 regulated MFIs, comprising 5 deposit-taking MFIs (DTMFIs), 8 non-deposit-
taking MFIs (NDTMFIs) and 13 Saving and Credit Unions (SCUs). DTMFIs mostly operate in the
central region: Newton MFI, Lao Post Microfinance Institution, Ekphatthana Microfinance
Institution (EMI) and Saynhai Samphanh MFI. There is only 1 DTMFI in the northern region, namely
DTMFI Champa Lao. In contrast, most NDTMFIs are located in the northern region of Laos. No MFIs
are found in the southern region. Most SCUs are located in the central region of Laos; there is only
1 SCU each in the northern and southern region. The southern region is clearly underrepresented
in terms of coverage by formal MFIs.
The number of regulated MFIs and their outreach has been increasing in recent years. To a
considerable extent this is due to government policy, mainly the introduction of a separate
regulatory window for MFIs, and the successful collaboration between government and donor
agencies, joined in the effort to increase outreach to the poor and reduce poverty as codified in
the Millennium Development Goals (MDG) and National Growth and Poverty Eradication Strategy
(NGPES).
16
Table 1: Number of MFIs by Region
Region
DTMFIs NDTMFIs SCUs Total
No. MFI No. Clients No. MFI No. Clients No. MFI No. Members No. MFI No.
Clients/Members
Northern 1 555 7 18,656 1 866 9 20,077
Central 4 27,699 1 321 11 12,604 16 40,624
Southern 0 0 0 0 1 342 1 342
Total 5 28,254 8 18,977 13 13,812 26 61,043
Remark: Northern region (Phongsaly, Luangnamtha, Oudomxay, Bokeo, Luangprabang, Houaphan and Sayaboury
provinces) , central region (Vientiane Capital, Xiengkkhuang, Vientiane, Borikhamxay, Khammuane and Savannakhet provinces) and southern region (Saravanh, Xekhong, Champassak and Attapeu provinces)
3.2.2. Villages Covered and Members/Clients Access
Table 2 presents the number of villages and members/clients covered by MFIs (DTMFIs, NDTMFIs
and SCUs). The MFIs serve about 18% (1,566 villages) of the total number of villages in the country
or 38% of villages served by microfinance providers. In relative terms, SCUs serve the largest
number of villages, followed by DTMFIs and NDTMFIs. The total number of MFI members/clients is
about 61,000. With 46% DTMFIs have the largest outreach, followed by NDTMFIs (31%) and SCUs
(23%).
Table 2: Microfinance outreach
Outreach DTMFIs NDTMFIs SCUs Total
Number of Villages served 559 331 676 1,566
Percent 36% 21% 43% 100%
Number of clients/ members 28,254 18,977 13,812 61,043
Percent 46% 31% 23% 100%
3.2.3. Employment Creation
DTMFIs and SCUs start to play role in job creation. A total of 369 people are full time employees of the regulated microfinance sector. 51% of them are female. DTMFIs employ 47%, SCUs 40% and
NDTMFIs 13%. The average number of members/clients per full time worker is about 165.

17
Table 3: Employment (absolute number of full time staff)
Sex DTMFIs NDTMFIs SCUs Total
Female 93 22 73 188
Male 80 28 73 181
Total 173 50 146 369
3.2.4. Loan Information
The total number of borrowers in 2009 was 25,808, averaging 993 per MFI. DTMFIs accounted for
43%, NDTMFIs for 35% and SCUs for 22% of active borrowers. Loans outstanding amounted to
39.4 billion Kip, averaging 1.5 billion Kip per MFI. SCUs accounted for 44% of loans outstanding,
DTMFIs and NDTMFIs for 28% each, respectively. The average size of loans outstanding per
borrower is 4.3 million Kip. The biggest average one is of DTMFIs (6.2 million Kip), followed by
4.7 million Kip for SCUs and 1.6 million Kip for NDTMFIs.
Table 4: Information on loans outstanding
Loan information DTMFIs NDTMFIs SCUs Total
No. of borrowers in 2009 11,028 9,194 5,586 25,808
Percent 43% 35% 22% 100%
Average no. of borrowers per MFI 2,206 1,149 430 993
Total amount of loans outstanding (kip) 10,886,284,000 11,181,425,000 17,344,857,000 39,412,566,000
Percent 28% 28% 44% 100%
Average loan outstanding per MFI (kip) 2,177,257.000 1,397,678,000 1,334,220,000 1,515,868,000
Average loan size per borower (kip)* 6,253,000 1,635,000 4,663,000 4,264,000
* Average loan size per borower equal total loan use from table 8 divided by number of borrowes
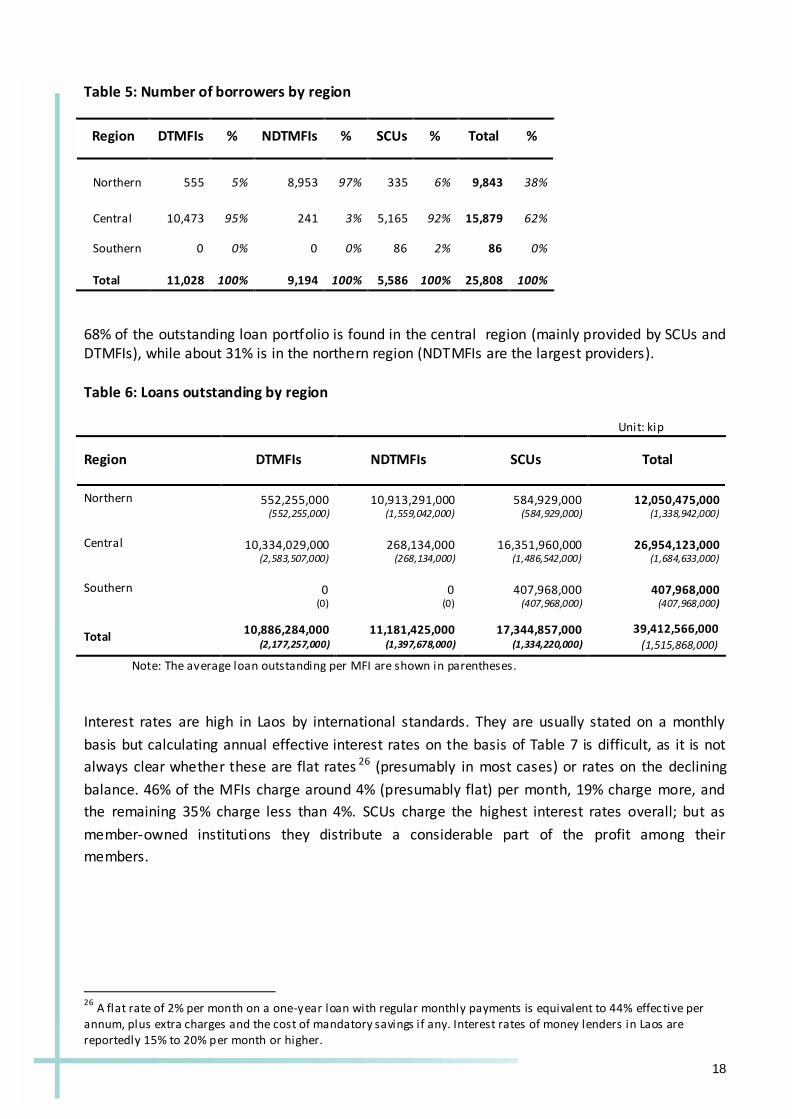
A striking result of the breakdown by region is the virtual absence of borrowers of regulated MFIs in the southern region: 86 borrowers served by a single SCU. 62% of borrowers are found in the central region (mostly served by DTMFIs and SCUs) and 38% in the northern region (mostly served by NDTMFIs).
18
Table 5: Number of borrowers by region
Region DTMFIs % NDTMFIs % SCUs % Total %
Northern 555 5% 8,953 97% 335 6% 9,843 38%
Central 10,473 95% 241 3% 5,165 92% 15,879 62%
Southern 0 0% 0 0% 86 2% 86 0%
Total 11,028 100% 9,194 100% 5,586 100% 25,808 100%
68% of the outstanding loan portfolio is found in the central region (mainly provided by SCUs and DTMFIs), while about 31% is in the northern region (NDTMFIs are the largest providers). Table 6: Loans outstanding by region
Unit: kip
Region DTMFIs NDTMFIs SCUs Total
Northern
552,255,000
(552,255,000) 10,913,291,000
(1,559,042,000) 584,929,000
(584,929,000) 12,050,475,000
(1,338,942,000)
Central
10,334,029,000
(2,583,507,000) 268,134,000
(268,134,000) 16,351,960,000
(1,486,542,000) 26,954,123,000
(1,684,633,000)
Southern
0
(0) 0
(0) 407,968,000
(407,968,000) 407,968,000
(407,968,000)
Total 10,886,284,000
(2,177,257,000) 11,181,425,000
(1,397,678,000) 17,344,857,000
(1,334,220,000) 39,412,566,000
(1,515,868,000)
Note: The average loan outstanding per MFI are shown in parentheses.
Interest rates are high in Laos by international standards. They are usually stated on a monthly
basis but calculating annual effective interest rates on the basis of Table 7 is difficult, as it is not
always clear whether these are flat rates 26 (presumably in most cases) or rates on the declining
balance. 46% of the MFIs charge around 4% (presumably flat) per month, 19% charge more, and
the remaining 35% charge less than 4%. SCUs charge the highest interest rates overall; but as
member-owned institutions they distribute a considerable part of the profit among their
members.
26
A flat rate of 2% per month on a one-year loan with regular monthly payments is equivalent to 44% effec tive per annum, plus extra charges and the cost of mandatory savings if any. Interest rates of money lenders in Laos are reportedly 15% to 20% per month or higher.

19
Table 7: Interest rate of loans per month
Unit: number of entity
Interest rate per month DTMFIs NDTMFIs SCUs Total
0 – 0.50 % 0 0 0 0
1% = 0.51– 1.50 % 1 1 0 2
2% = 1.51 – 2.50 % 0 2 1 3
3% = 2.50 – 3.50 % 1 1 2 4
4% = 3.51 – 4.50 % 3 4 5 12
5% = ≥4.51 0 0 5 5
3.2.5. Loan Use
21% of the loan portfolio is reportedly invested in agriculture, 30% in trade and services, 9% in
handicrafts and 38% in unspecified activities . The latter is largely due to the practice of the Lao’s
Post Office of not stating its loan purposes. Only 2% are made available for emergencies. DTMFIs
lend predominantly for trade or services and handicrafts, NDTMFIs for agriculture and trade or
services, SCUs for trade or services and agriculture.
Table 8: Loan purpose of all loans given during 2009 (full principle)
Unit: (kip)
Loan purpose DTMFIs NDTMFIs SCUs
Total
Agricultures and livestock 6,371,229,000 7,251,913,000 9,975,990,000 23,599,132,000
Trade and services 13,553,245,000 4,966,864,000 14,348,852,000 32,868,961,000
Handicraft 7,874,776,000 1,326,277,000 158,560,000 9,359,613,000
Emergency 141,052,000 407,519,000 1,428,447,000 1,977,018,000
Other purposes* 41,019,641,000 1,082,133,000 136,548,000 42,238,322,000
Total loan use 68,959,943,000 15,034,706,000 26,048,397,000 110,043,046,000
Remark: * DTMFIs show a high figure under “other purposes”. This due to the fact that Lao’s Post Office does not collect
information on loan purposes .
3.2.6. Savings Information
All 26 MFIs provide savings deposit services. There are 54,719 savings accounts with a total
balance of 63.6 billion Kip, averaging 2.4 billion Kip per MFI and 1.2 million per account. With 48%
of the total DTMFIs attract the largest number of savers and an even larger share of total savings
deposits, namely 82%, averaging 1.99 million Kip per account. NDTMFIs account for 33% of savers
in this segment, but only 4% of savings deposits, averaging 147,000 Kip per account. SCUs account
for 19% of savers and 14% of savings deposits, averaging 820,000 Kip per account. On average
DTMFIs pay 0.66% interest per month on savings deposits, NDTMFIs pay 0.69% and SCUs, which

20
are owned by their members, pay the highest rate, namely 0.97%. 6 out of 13 SCUs (46%) and 2
out of 8 NDTMFIs (25%) pay dividends to their members/clients; none of the DTMFIs do.
Table 9: Savings information
Savings information DTMFIs NDTMFIs SCUs Total
Number of providers with savings products 5 8 13 26
Number of savers 26,361 17,875 10,483 54,719
percent 48% 33% 19% 100%
Average no. of savers per MFI 5,272 2,234 806 2,104
Total amount of savings (kip) 52,394, 295,000 2,635,779,000 8,592,830,000 63,622,904,000
Percent 82% 4% 14% 100%
Average savings per MFI (kip) 10,478,859,000 329,472,000 660,987,000 2,447,035,000
Average savings size per person (kip) 1,988,000 147,000 820,000 1,163,000
Average savings interest rate per month (%) 0.66
0.69 a
0.97b
0
Number of providers that provide dividend to shareholders and/or members
0 2 6 8
a Calculated from 6 NDTMFIs; theother 2pay dividends to their members. b Calculatee from 12 out of 13 SCUs
66% of the savers in regulated MFIs live in the central region, 34% in the northern region and less
than 1% in the southern region. The bulk of savers in the central region is attracted by DTMFIs
followed by SCUs and by NDTMFIs in the northern region.
Table 10: Number of savers by region
Regions of the
country DTMFIs NDTMFIs SCUs Total
Northern
50 (50)
17,768 (2,538)
515 (515)
18,333 (2,037)
Central
26,311 (6,578)
107 (107)
9,928 (903)
36,346 (2,272)
Southern
0 (0)
0 (0)
40 (40)
40 (40)
Total
26,361 (5,272)
17,875 (2,234)
10,483 (806)
54,719 (2,105)
Remark: Average number of savers per MFI given in parentheses.
The central region accounts for 95% of total savings mobilized by regulated MFIs, while the
northern and southern region covers the remaining 5%. DTMFIs’ savings account for 82%. SCUs
make up 14% most of which are mobilized in the central region. It is interesting to note that the
remaining 4% of savings come from NDTMFI which mobilize 98% of the savings in the northern
region.

21
Table 11: Absolute amount of savings by region Remark: Average amount of savings per MFIgiven in parentheses.
3.2.7. Income Statement
To ensure the survival and growth of MFIs they must at least cover their costs and preferably
make a profit. In 2009 the total amount of net profit before dividends (without grants) was 2.51
billion Kip. 66% of this amount was made by DTMFIs, 33% by NDTMFIs and 1% by SCUs. The
operational self-sufficiency (OSS27) ratio (income without grants/expenditure) of MFIs is a modest
106%. The OSS of DTMFIs is 112% and. At 98% NDTMFIs and SCUs are barely able to cover their
operational expenses. ROA of DTMFIs is 2.1%, NDTMFI show a negative ROA of -0.5% and of SCUs -
0.4%. These figures include provisions for loan losses.
Table 12.1: Income statement 2009
On average net operating income of MFIs is 8% of total income 28. DTMFIs show the best ratio with
14%, SCUs break even with about 1% and NDTMFIs already show a loss (-2%). DTMFIs and SCUs
use % of total income for loan loss reserves, NDTMFIs dedicate less than 1% as reserve.
27
Which includes LLP/Reserves 28
Sum of interest income and other income (excluding subsidies)
Region DTMFIs NDTMFIs SCUs Total
Northern 47,988,000
(47,988,000) 2,593,950,000
(370,564,000) 318,358,000
(318,358,000) 2,960,296,000
(328,922,000)
Central 52,346,307,000 (13,086,577,000)
41,829,000 (41,829,000)
8,092,212,000 (735,656,000)
60,480,348,000 (3,780,022,000)
Southern 0 (0)
0 (0)
182,260,000 (182,260,000)
182,260,000 (182,260,000)
Total 52,394,295,000 (10,478,859,000)
2,635,779,000 (329,472,000)
8,592,830,000 (660,987,000)
63,622,904,000 (2,447,035,000)
Unit: kip DTMFIs NDTMFIs SCUs Total
Interest Income 11,888,848,000 2,797,925,000 4,837,242,000 19,524,015,000
Other Income (e.g. fees, service charges) 2,054,705,000 383,898,000 410,413,000 2,849,016,000
Operating Expenses 12,061,070,000 3,176,336,000 4,928,495,000 20,165,901,000
Expenses for Village Development 0 11,321,000 8,122,000 19,443,000
Expenses for Social Welfare 0 5,561,000 23,278,000 28,839,000
Other Expenses (e.g. consultants, studies) 0 52,760,000 228,337,000 281,097,000
Total Operating Expenses 12,061,070,000 3,245,978,000 5,188,232,000 20,495,280,000
Net Operating Income/Loss 1,882,483,000 -64,155,000 59,423,000 1,877,751,000
Loan Loss Provision/Reserves 356,489,000 13,500,000 157,682,000 527,671,000
Extraordinay Income (e.g. grants) 116,306,000 914,653,000 124,754,000 1,155,713,000
Net profit for the period 1,642,300,000 836,998,000 26,495,000 2,505,793,000

22
NDTMFIs still largely depend on subsidies. Their extraordinary income – mostly grants by
international donors- makes up 29% of total income. In comparison extraordinary income of
DTMFIs is 5% of total income. The percentage for SCUs is only 1%. Including extraordinary income
the average DTMFI made 328 million Kip net profit in 2009, which is more than 3 times the
average net profit of all MFIs (96 Mio Kip). With 105 million Kip NDTMFIs are slightly above the
average, even though this was still entirely due to donor grants. The average SCU only made 2
million Kip in 2009, which is a mere 2% of the average net profit of all MFIs.
Table 12.2: Average income statement 2009 per type of MFI
3.2.8. Balance Sheet
A look at the balance sheet provides interesting insight about the different types of MFIs. Even
though DTMFIs make up the smallest group of MFIs in terms on numbers they show the biggest
cumulated balance sheet. Also they are the most profitable institutions. Since they haven’t paid
dividends to their shareholders they could retain more earnings for the institutions. The balance
sheet shows that NDTMFIs not only depend on subsidies when it comes to their running costs (see
in 2.7. above). They also receive capital grants, which are provided mostly by donors. It is
interesting to see that they have paid dividens even though their own capital is not very strong. As
opposed to NDTMFIs SCUs depend on donors to a much lesser extent. They mostly finance
themselves trough savings and loans. They are the only institution type that makes significant use
of debt financing. It is remarkable that regulated MFIs are very liquid with cash making up more
than 50% of total assets. However it is important to note that this high figure is distorted due to
the inclusion of the Lao Post DTMFI, which has over 14,000 savers and over 40 billion Kip in
savings. Savings almost make up the entire liabilities for DTMFIs (94%). With only 3% of total
liabilities debt funding was close to irrelevant for DTMFIs in 2009.
Unit: kip DTMFIs NDTMFIs SCUs Total
Interest Income 2,377,770,000 349,741,000 372,096,000 750,924,000
Other Income (e.g. fees, service charges) 410,941,000 47,987,000 31,570,000 109,578,000
Operating Expenses 2,412,214,000 397,042,000 379,115,000 775,612,000
Expenses for Village Development 0 1,415,000 625,000 748,000
Expenses for Social Welfare 0 695,000 1,791,000 1,109,000
Other Expenses (e.g. consultants, studies) 0 6,595,000 17,564,000 10,811,000
Total Operating Expenses 2,412,214,000 405,747,000 399,095,000 788,280,000
Net Operating Income/Loss 376,497,000 -8,019,000 4,571,000 72,222,000
Loan Loss Provision/Reserves 71,298,000 1,688,000 12,129,000 20,295,000
Extraordinay Income (e.g. grants) 23,261,000 114,332,000 9,596,000 44,451,000
Net profit for the period 328,460,000 104,625,000 2,038,000 96,378,000

23
Table 13.1: Balance Sheet
Unit: kip DTMFIs NDTMFIs SCUs Total
Cash 58,729,315,000 3,756,966,000 2,010,484,000 64,496,765,000
Gross loan outstanding 10,886,284,000 11,181,425,000 17,344,857,000 39,412,566,000
Fixed and other assets 3,899,643,000 639,291,000 6,862,148,000 11,401,082,000
Total Asset 73,515,242,000 15,577,682,000 26,217,489,000 115,310,413,000
Saving deposits 52,394,295,000 2,635,779,000 8,592,830,000 63,622,904,000
Loan received 1,945,686,000 195,000,000 5,583,300,000 7,723,986,000
Other (unpaid interests) 1,542,096,000 129,509,000 551,842,000 2,223,447,000
Total Liability 55,882,077,000 2,960,288,000 14,727,972,000 73,570,337,000
Shares 3,833,068,000 1,454,801,000 7,035,996,000 12,323,865,000
Reserve 2,702,577,000 1,677,748,000 232,505,000 4,612,830,000
Donations and grants 331,255,000 6,037,799,000 843,084,000 7,212,138,000
Retain Earnings prior period, others* 9,123,965,000 3,240,026,000 4,019,254,000 16,383,245,000
Dividend Payment 0 -629,978,000 -667,817,000 -1,297,795,000
Profit/Loss of current year 1,642,300,000 836,998,000 26,495,000 2,505,793,000
Total Equity 17,633,165,000 12,617,394,000 11,489,517,000 41,740,076,000
Total liability and Equity 73,515,242,000 15,577,682,000 26,217,489,000 115,310,413,000
Note: * Aditional capital, dividend declared
With 81% NDTMFIs show the highest proportion of equity to capital followed by SCUs with 44%
and 24% for DTMFIs. The average balance sheet confirms that DTMFIs have the highest equity,
which is explained by a combination of share capital, reserves and the retaining of earnings.
Table 13.2: Average balance sheet per type of MFI
Unit: kip DTMFIs NDTMFIs SCUs Total
Cash 11,745,863,000 469,621,000 154,653,000 2,480,645,000
Gross loan outstanding 2,177,257,000 1,397,678,000 1,334,220,000 1,515,868,000
Fixed and other assets 779,929,000 79,911,000 527,858,000 438,503,000
Total Asset 14,703,049,000 1,947,210,000 2,016,731,000 4,435,016,000
Saving deposits 10,478,859,000 329,472,000 660,987,000 2,447,035,000
Loan recieved 389,137,000 24,375,000 429,485,000 297,076,000
Other (unpaid interests) 308,419,000 16,189,000 42,449,000 85,517,000
Total Liability 11,176,415,000 370,036,000 1,132,921,000 2,829,628,000
Shares 766,614,000 181,850,000 541,230,000 473,995,000
Reserve 540,515,000 209,719,000 17,885,000 177,417,000
Donations and grants 66,251,000 754,725,000 64,853,000 277,390,000
Retain Earnings prior period, others* 1,824,794,000 405,002,000 309,175,000 630,127,000
Dividend Payment 0 -78,747,000 -51,371,000 -49,915,000
Profit/Loss of current year 328,460,000 104,625,000 2,038,000 96,377,000
Total Equity 3,526,634,000 1,577,174,000 883,810,000 1,605,391,000
Total liability and Equity 14,703,049,000 1,947,210,000 2,016,731,000 4,435,019,000
Note: * Aditional capital, dividend declared, profit for current year

24
3.3. The Unregulated Microfinance Sector: Village Funds
3.3.1. Outreach of VFs by region and type of VF (with and without savings)
The microfinance survey 2009 covers 4,113 village funds (VFs) with a total of 365,608 members, or
87 members per VF on average. This information has been provided by 192 village fund promoters
(VFPs). The majority of them presented consolidated data on several VFs, and a few on a single VF
each. The number of total reported VF members is six times the number of members/clients of
MFIs (61,043). The majority of VFs (45%) is located in the central region, 30% are in the northern
region and 25% in the southern region. 60% of VF members are located in the central region
where VF have an average size of 117 members. 22% are in the south with an average
membership of 76. region. VFs are smallest in the northern region, with 53 members per VF and a
total share of 18%. The comparatively low outreach of VF in the southern region is particularly
notable in light of the outreach though formal MFIs: only a single MFI is located in the southern
region with 86 borrowers out of a total of almost 26,000.
There are two types of VFs: 3,114 deposit-taking VFs (81%), which provide savings and credit
services, and 799 non-deposit-taking VFs (19%), which provide credit only. The latter solely rely on
external sources of capital. The two types differ widely in terms of size: deposit-taking VFs have 99
members on average, non-deposit-taking VFs only have 39 members. Total membership is
328,642 and 30,966 respectively, or 91% and 9%. The client outreach of deposit-taking VFs is
significantly higher (91% of all members) than non-deposit-taking VFs (9% of all members). DTVFs
are strongest in the central region (58% of all members), in the southern region they account for
19% of all members and in the northern region for 14%.
Table 14: Outreach of VFs by region and type of VF
Northern Central Southern Total
VFPs 65 105 22 192
Deposit-taking VFs:
No. of VFs 914 1,603 797 3,314
No. of members 51,219 208,901 68,522 328,642
Non-deposit-taking VFs:
No. of VFs 326 248 225 799
No. of members 14,704 7,292 8,970 30,966
Total:
No. of VFs 1,240 1,851 1,022 4,113
Percent 30% 45% 25% 100%
No. of members 65,923 216,193 77,492 359,608
Percent 18% 60% 22% 100% *
Due to imperfections in the data collection method the number of villages covered and the number of members might include some double-
counting.

25
3.3.2. Loan Information
VFs have a total of 172,612 borrowers, which make up 48% of their total membership. The central region accounts for the largest number of borrowers being about twice the amount of the northern and four times of the southern region. The average number of borrowers per VF is 42, with 54 persons in the central, 38 persons in the northern and 25 persons in the southern region. The total loan portfolio of VFs is 245 billion Kip. The average outstanding loan per VF is 106 million Kip for the center, about 22 million Kip for the northern and 21 million Kip for the southern regions. Table 15: Information on loans outstanding by region and type of VF
Northern Central Southern Total
Deposit-taking VFs 914 1,603 797 3,314
No. of borrowers 33,562 92,322 18,850 144,734
Average no. of borrower per VF 37 58 24 44
Amount of loans outstanding 16,929,066,000 186,437,316,000 11,498,240,000 214,864,622,000
Average loan outstanding per VF 18,522,000 116,305,000 14,427,000 64,835,000
Average loan size per borrower* 1,273,000 2,412,000 2,232,000 2,125,000
Non-deposit-taking VFs 326 248 225 799
No. of borrowers 14,010 7,240 6,628 27,878
Average no. of borrowers per VF 43 29 29 35
Amount of loans outstanding 10,312,287,000 10,580,746,000 9,971,604,000 30,864,637,000
Average loan outstanding per VF 31,633,000 42,664,000 44,318,000 38,629,000
Average loan size per borrower* 765,000 1,617,000 2,377,000 1,370,000
Total 1,240 1,851 1,022 4,113
No. of borrowers 47,572 99,562 25,478 172,612
Average no. of borrowers per VF 38 54 25 42
Amount of loans outstanding 27,241,353,000 197,018,062,000 21,469,844,000 245,729,259,000
Average loan outstanding per VF 21,969,000 106,439,000 21,008,000 59,745,000
Average loan size per borrower* 1,123,000 2,355,000 2,270,000 2,003,000
* Average loan size per borrower equal to total loan use from table 17 divided by number of borrowers
Information on loan interest rates is only available at the level of VFPs, but not VFs. As shown in
Table 16 below, non-deposit-taking VFs, which are externally subsidized, charge lower interest rates than deposit-taking VFs. The unweighted average monthly (supposedly flat) interest rate
charged by the VFs is approximately 2.1%; among non-deposit-taking VFs it is 1.4%, among deposit-taking VFs it is 2.3%.
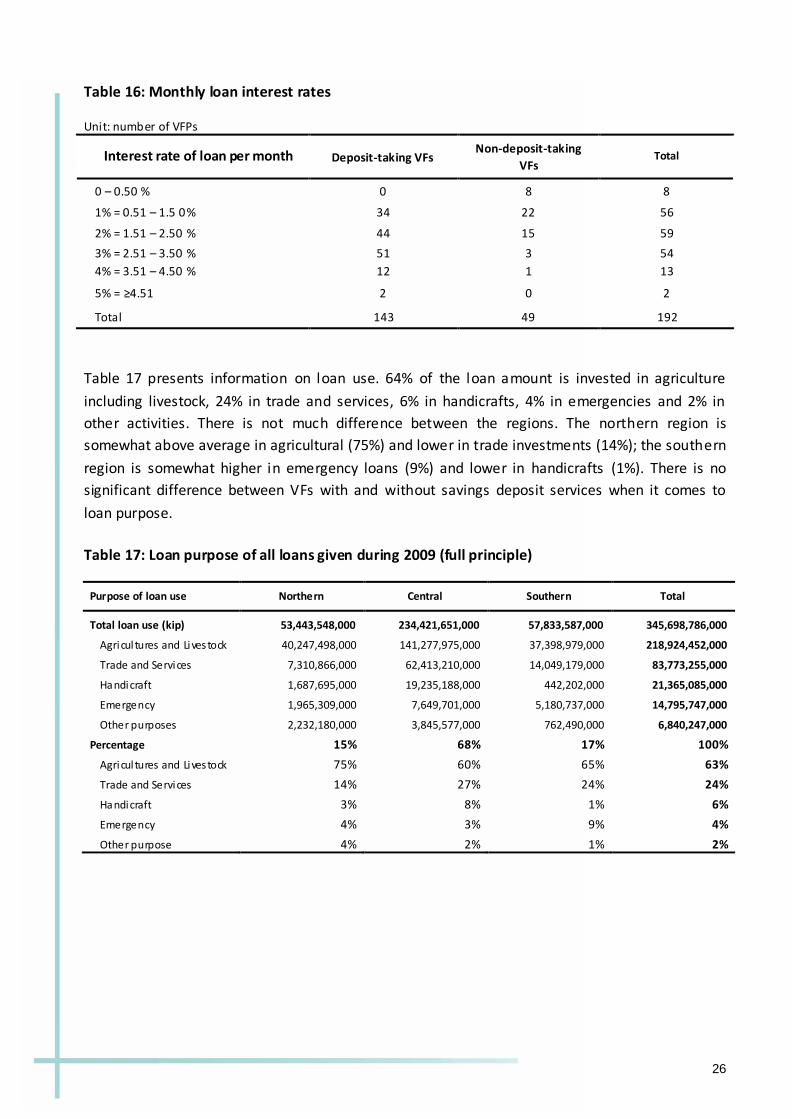
26
Table 16: Monthly loan interest rates
Unit: number of VFPs
Interest rate of loan per month Deposit-taking VFs Non-deposit-taking
VFs Total
0 – 0.50 % 0 8 8
1% = 0.51 – 1.5 0% 34 22 56
2% = 1.51 – 2.50 % 44 15 59
3% = 2.51 – 3.50 % 51 3 54
4% = 3.51 – 4.50 % 12 1 13
5% = ≥4.51 2 0 2
Total 143 49 192
Table 17 presents information on loan use. 64% of the loan amount is invested in agriculture
including livestock, 24% in trade and services, 6% in handicrafts, 4% in emergencies and 2% in
other activities. There is not much difference between the regions. The northern region is
somewhat above average in agricultural (75%) and lower in trade investments (14%); the southern
region is somewhat higher in emergency loans (9%) and lower in handicrafts (1%). There is no
significant difference between VFs with and without savings deposit services when it comes to
loan purpose.
Table 17: Loan purpose of all loans given during 2009 (full principle)
Purpose of loan use Northern Central Southern Total
Total loan use (kip) 53,443,548,000 234,421,651,000 57,833,587,000 345,698,786,000
Agricul tures and Livestock 40,247,498,000 141,277,975,000 37,398,979,000 218,924,452,000
Trade and Services 7,310,866,000 62,413,210,000 14,049,179,000 83,773,255,000
Handicraft 1,687,695,000 19,235,188,000 442,202,000 21,365,085,000
Emergency 1,965,309,000 7,649,701,000 5,180,737,000 14,795,747,000
Other purposes 2,232,180,000 3,845,577,000 762,490,000 6,840,247,000
Percentage 15% 68% 17% 100%
Agricul tures and Livestock 75% 60% 65% 63%
Trade and Services 14% 27% 24% 24%
Handicraft 3% 8% 1% 6%
Emergency 4% 3% 9% 4%
Other purpose 4% 2% 1% 2%

27
3.3.3 Savings Information
3,314 VFs provide savings services to a total number of 328,085 savers. In 2009 this was almost six
times the number of savers (54,719) of regulated MFIs. The largest part of total VF savers (62%) is
in the central region, followed by the southern (21%) and the northern region (17%). The total
deposit balance is 270 billion Kip, which is an average 81.5 million Kip per deposit-taking VF and
average 820,000 Kip per saver. 77% of the savings deposits are in the central region, 14% in the
southern region and 9% in the northern region.
Table 18: Savings information by region
Northern Central Southern Total
Deposit-taking VFs: 914 1,603 797 3,314
No. of savers 56,547 203,804 67,734 328,085
Percent of savers 17% 62% 21% 100%
Average no. of savers per VF 62 127 85 99
Amount of savings (kip) 22,887,664,000 208,429,524,000 38,838,341,000 270,155,529,000
Percent of savings 9% 77% 14% 100%
Average amout of savings per VF (kip) 25,041,000 130,025,000 48,731,000 81,519,000
Average savings per member 405,000 1,023,000 573,000 823,000
3.3.4. Income Statement
Table 19.1 shows profit or loss of VFs in the year 2009. The total profits of VFs including grants are
about 48 billion Kip. Grants seem to be much less important for VFs than for MFIs, since they only
make up 2% of the net income. DTVFs are responsible for a net profit of over 47 billion Kip, which
is 97% of the total profit of VFs. It is clear that they are more profitable than NDTVFs. Net profit of
DTVFs is some 22% of the loans outstanding, while for NDTVFs its only 4%.
Table 19.1: Income statement 2009
Unit: kip Deposit-taking VFs Non-deposit-taking VFs Total
Interest Income 58,350,073,000 2,091,595,000 60,441,668,000
Other Income (e.g. fees, service charges) 1,726,205,000 275,773,000 2,001,978,000
Operating Expenses 3,177,471,000 137,124,000 3,314,595,000
Expenses for Village Development 2,447,199,000 219,901,000 2,667,100,000
Expenses for Social Welfare 2,650,921,000 109,800,000 2,760,721,000
Other Expenses (e.g. consultants, studies) 3,074,188,000 409,760,000 3,483,948,000
Total Operating Expenses 11,349,779,000 876,585,000 12,226,364,000
Net Operating Income/Loss 48,726,499,000 1,490,783,000 50,217,282,000
Loan Loss Provision/Reserves 2,356,444,000 185,987,000 2,542,431,000
Extraordinay Income (e.g. grants) 904,040,000 58,000,000 962,040,000
Net profit for the period 47,274,095,000 1,362,796,000 48,636,891,000

28
The average net profit for all VFs is almost 12 million kip. With 19% DTVFs have a lower ratio of
income to operational expenses than NTDVFs with 37%. For DTVFs loan loss provisions make up
4% of income while it is 8% of income for NDTMFIs. It is most likely that these loan loss provisions
are too low to cover the actual loan losses. On average DTVFs are 8 times more profitable than
NDTVFs.
Table 19.2: Income statement 2009, average per VF
Unit: kip Deposit-taking VFs Non-deposit-taking VFs Total
Interest Income 17,607,000 2,618,000 14,695,000
Other Income (e.g. fees, service charges) 521,000 345,000 487,000
Operating Expenses 959,000 172,000 806,000
Expenses for Village Development 738,000 275,000 648,000
Expenses for Social Welfare 800,000 137,000 671,000
Other Expenses (e.g. consultants, studies) 928,000 513,000 847,000
Total Operating Expenses 3,425,000 1,097,000 2,972,000
Net Operating Income/Loss 14,703,000 1,866,000 12,210,000
Loan Loss Provision/Reserves 711,000 233,000 618,000
Extraordinay Income (e.g. grants) 273,000 73,000 234,000
Net profit for the period 14,265,000 1,706,000 11,826,000
3.3.5. VF’s Balance Sheet
Table 20.1. shows that DTVFs make up 90% of the total aggregate balance sheet. DTVFs finance 75% of their
business through savings deposits and grants only make 13% of their total balance sheet. 70% of the total
balance sheet of NDTVFs are made up by the loan portfolio. NDTVFs almost exclusively finance themselves
through equity. 77% of equity is made up by grants. The remaining 13% are retained earnings and reserves.
Both DTVFs and NDTVFs make regular dividend payments to their members. Anecdotal evidence shows that
such dividends are very popular amongst VF members. However, they go against the longer term goal of
building equity through retained earnings.

29
Table 20.1: VFs’ Balance sheet for 2009 29
Unit: kip Deposit-taking VFs Non-deposit-taking VFs Total
Cash 111,632,518,000 7,917,513,000 119,550,031,000
Gross loan outstanding 214,864,622,000 30,864,637,000 245,729,259,000
Fixed and other assets 32,193,034,000 1,548,145,000 33,741,179,000
Total Asset 358,690,174,000 40,330,295,000 399,020,469,000
Saving deposits 270,155,529,000 0 270,155,529,000
Loan Recieved 2,433,934,000 217,923,000 2,651,857,000
Others (Unpaid dividend) 1,135,766,000 267,805,000 1,403,571,000
Total Liability 273,725,229,000 485,728,000 274,210,957,000
Shares 1,272,060,000 0 1,272,060,000
Reserve 7,051,089,000 244,384,000 7,295,473,000
Donation and grant 48,104,157,000 31,114,294,000 79,218,451,000
Retained earning prior period, others* 26,426,903,000 7,794,611,000 34,221,514,000
Dividend Payment -45,163,359,000 -671,518,000 -45,834,877,000
Profit/Loss of current year 47,274,095,000 1,362,796,000 48,636,891,000
Total Equity 84,964,945,000 39,844,567,000 124,809,512,000
Total Liability and Equity 358,690,174,000 40,330,295,000 399,020,469,000
* Aditional capital, dividend declared
Table 20.2 shows the average balance sheet for VFs. The average DTVF is twice as big in terms of
assets as the average NDTVF. It is interesting to see that dividend payments of the average DTVF
to its members is over 16 times the average dividend payout of NDTVFs.
29 In reality, very few VFs or VFP have their own balance sheet. Their accounting and bookkeeping system is very simple, the balance sheets for VFs were constructed after the data collection by the authors of this report.

30
Table 20.2: Average balance sheet per VF
Unit: kip Deposit-taking VFs Non-deposit-taking VFs Total
Cash 33,685,000 9,909,000 29,066,000
Gross loan outstanding 64,835,000 38,629,000 59,745,000
Fixed and other assets 9,714,000 1,938,000 8,204,000
Total Asset 108,234,000 50,476,000 97,015,000
Saving deposits 81,519,000 0 65,683,000
Loan Recieved 734,000 273,000 645,000
Others (Unpaid dividend) 343,000 335,000 341,000
Total Liability 82,596,000 608,000 66,669,000
Shares 384,000 0 309,000
Reserve 2,128,000 306,000 1,774,000
Donation and grant 14,515,000 38,942,000 19,261,000
Retained earning prior period, others* 7,974,000 9,754,000 8,320,000
Dividend Payment -13,628,000 -840,000 -11,144,000
Profit/Loss of current year 14,265,000 1,706,000 11,825,000
Total Equity 25,638,000 49,868,000 30,345,000
Total Liability and Equity 108,234,000 50,476,000 97,014,000
* Aditional capital, dividend declared
3.3.6. Return on Assets – Comparing regulated MFIs and unregulated VFs
Table 21 compares return on assets ratios (ROA) at year-end30 of the various types of microfinance
provider. The calculation excludes grants from income in order to get a more meaningful sense of the institutions performance. Note should be taken that the unregulated VFs do not pay taxes and generally don’t provision for loan losses and write off bad debts . If they did the ratios presented in Table 21 would be substantially lower. In 2009 regulated MFIs were providing for loan losses, however they had not written off bad debt and paid taxes yet. Furthermore, MFIs and VFs cannot be directly compared because of fundamental differences in their accounting practices. In contrast to MFIs, VFs do not pay salaries, have very low administrative expenses and pay no interest on savings. Instead their committee members and depositors are compensated with dividends, which are only calculated at the end of the year. Their accounting profit margins are therefore
substantially higher than those of the MFIs.
There are two notable results of the comparison: First, as already mentioned DTMFIs are the best performing amongst the regulated MFIs, with a ROA of 2.1%. Second, at a ROA of 12.9% DTVFs
outperform NDTVFs with a ROA of 3.2%, by a wide margin.
30
ROA is normally calculated as an average over the full year. This is not possible here because total assets are only available for the end of the year, not for the beginning of the year or for each month.

31
Table 21: Adjusted Return on Assets (in percent)
Regulated MFI and VFs ROA 31
Regulated MFIs 1.2%
DTMFIs 2.1% NDTMFIs ‐0.5% SCUs ‐0.4% VFs 32 11.9% Deposit‐taking VFs 12.9% Non‐deposit‐taking VFs 3.2%
3.4. Summary and conclusions
A comparison of the NERI study of 2006 with this present one shows that the microfinance sector has expanded significantly in this timeframe33. In 2006 the regulated microfinance sector was just emerging. Therefore the survey report did not present separate data for regulated MFIs and unregulated village funds back then. Now that a regulated microfinance sector has emerged, this present report analyzed data separately for the two subsectors and for the different types of institutions within them. This report also contains annexes with detailed information on the 26 regulated MFIs (separating DTMFIs, NDTMFIs and SCUs) and on 192 VFPs (separating VFPs for deposit‐taking and non‐deposit‐taking VFs). Since 2006 the number of toal members/clients doubled from 206,456 to 420,651. Total assets tripled from 169.6 billion Kip in 2006 to 514.3 billion Kip in 2009. Loans outstanding almost doubled from 169.5 billion Kip to 285 billion Kip in 2009 and savings deposits surged from 66.6 billion in 2006 to 333.8 billion Kip in 2009, that is five times the amount of 2006. Total net profit (excluding grants) in 2009 was 51.1 billion Kip. To be fair the bright picture painted by these figures has to be taken with a grain of salt. Data quality ‐ especially for VFs ‐ remains sub‐optimal. This is partly due to challenges with data collection and partly due to the fact that many VFs are simply not able to report their own financial performance accurately. However, the fact that financial service provision has increased significantly since 2006 remains beyond doubt. The regulated microfinance sector comprises 26 MFIs: 5 DTMFIs, 8 NDTMFIs and 13 SCUs. It is strongest in the central part of the country and the south is virtually unserved. DTMFIs seem to hold the largest potential. They account for 46% of the clients of the subsector, 29% of loans outstanding and 82% of savings deposits. The NDTMFIs account for 31% of the members/clients, 26% of the loans outstanding and 4.5% of savings deposits. SCUs account for 23% of members/clients, 45% of loans outstanding and 13.5% of savings deposits. DTMFIs are thus strongest in savings mobilization, and SCUs in lending. Profitability of the subsector is still low (and
31 Note: ROA is calculated as net profit (adjusted by excluding grants from income) divided by total assets at year‐end. 32 VFs generally do not write off of bad debt or make provisions for loan losses. Accordingly the ROA figures are don’t necessarily an accurate indicator for VFs performance. 33 As opposed to the NERI report of 2006 Nayoby Bank and APB bank are not included in this present study.

32
would be lower if international accounting practices were applied): With a ROA of 2.1% DTMFIs
are more profitable than SCUs and NDTMFIs which show negative ROA of -0.4% and -0.5%
respectively. NDTMFIs are heavily dependent on subsidies and grants. The challenge for the donor
community will be to wean them from subsidies and eventually convert them into DTMFIs.
Unregulated VFs account by far for the largest portion of the microfinance sector. They are
strongest in the central region, but cover all three regions, including the south, which is generally
underserved. The most striking result of this survey is the vast difference found between DTVFs
and NDTVFs. There are 3,314 deposit-taking VFs (76% of the total number) and 799 NDTVFs (24%
of the total). Yet, DTVFs account for 90% of total assets of the subsector, 87% of loans outstanding
and of course 100% of deposits mobilized. At a ROA of 12.9% they outperform the NDTVFs, with a
ROA of 3.2%, by a wide margin.
Despite its solid growth in recent years, the regulated microfinance sector was still but a fraction
of the total microfinance sector in 2009. The 26 MFIs had 61,043 members/clients, 25,808
borrowers and 54,719 savers – compared to 4,113 VFs with 365.587 members, 172,612 borrowers
and 328,085 savers. VFs thus account for around 86% of total members/clients of the sector. In
2009 the regulated MFIs hold total assets of 115.3 billion Kip, loans outstanding of 39.4 billion Kip
and savings deposits of 63.6 billion Kip. VF had total assets of 399.0 billion Kip, 245.7 billion Kip in
loans outstanding and 270.2 billion Kip in savings deposits. The VFs thus hold 78% of total assets,
86% of loans outstanding and 81% of savings deposits. MFIs have generated 2.5 billion Kip in net
profits and VFs 48.6 billion or 95% of total net profit in the microfinance sector 34.
There are a number of challenges for the VF subsector, facing the Government and the donor
community:
Transforming non-deposit-taking VFs into deposit-taking VFs, with technical assistance and
capacity building;
Expanding outreach to the remaining 4,600 villages, which are not covered;
Building and strengthening service networks among VFs at district level, following the
examples set by GIZ and networks in the districts of Vientiane Capital and in several other
provinces (see chapter 1.3);
Strengthening governance, management, financial and social performance of the VFs:
through their service networks and through direct technical assistance and capacity
building;
Exploring the potential of collaboration between banks, MFIs and VFs and strengthening
linkages as seen fit;
Developing an appropriate framework of regulation and supervision in partnership
between the VF service networks/federations, BOL and other relevant stakeholders.35
34
However, this comparison also mus t be seen in light of footnote 32. 35 This is one of the long term goals of the GIZ project Microfinance in Rural Areas - Access to Finance for the Poor
(AFP)

33
We are confident that the excellent cooperation between government organizations and BOL with
the donor community will continue to contribute to the progress of the microfinance sector,
leading to sustainable poverty alleviation and prosperity for all in the Lao PDR.

34
Chapter 4: Microfinance Statistics at the Provincial Level
1. Phongsaly Province
JANUARY- DECEMBER 2009
Capital: Phongsaly
Population: 174,246 people
Area: 16,270 Km2
Density: 11 people/Km2
Number of Villages: 542 Villages
Number of Households: 29,641 Households
Districts: Phongsaly, May, Khua, Samphanh, Boon neua , Nhot ou and Boontai.
Source: Statistical Year book 2009 (Lao Department of Statistics, MPI)
Phongsary province is located in the remotest northern region of Lao PDR, dominated by rugged,
mountaineous terrain and an abundance of thick forest and fast-flowing rivers. Microfinance has
made inroads into this difficult terrain, but only to a limited extent. There is only one NDTMFI in
this area, namely Phongsaly Microfinance Institution for Development (IFDP), providing its service
since 2006. In addition there are 143 VFs, providing their service in 143 villages. As of 2009 there
are a total of 4,645 members or clients (about 2.7% of the total population of the province) with
access to microfinance services. This includes 4,109 borrowers with a total amount of loans
outstanding of 5.29 billion kip. The promoting organizations who play a key role for microfinance
services in this province are the Lao Women Union and the Poverty Eradication and Rural
Development Offices at district level. International promoters include Ausaid, EU, GAA and the
Danish Red Cross.
Table 1: Financial Support
Regulated MFIs
VFs
DTMFIs NDTMFIs SCUs total
Saving and Credit Credit only total
Total amount of financial supports 0 141,951,000 0 141,951,000 1,802,966,000 1,346,792,000 3,149,758,000
Loans 0 0 0 0 0 0 0
Grants 0 141,951,000 0 141,951,000 1,802,966,000 1,346,792,000 3,149,758,000
Table 2: Coverage of Villages and Members/Clients
Regulated MFIs
VFs
DTMFIs NDTMFIs SCUs total
Saving and Credit Credit only total
No. of institutions 0 1 0 1 0 0 0
No. of village coverage 0 35 0 35 0 0 0
No. of VFs 0 0 0 0 75 68 143
Percent 0% 100% 0% 100% 52% 48% 100%
members/clients 0 919 0 919 1,871 1,855 3,726
Percent 0% 100% 0% 100% 50% 50% 100%
Average no. of members per entities 0 919 0 919 25 27 26

35
Table 3: Credit Information
Regulated MFIs
VFs
DTMFIs NDTMFIs SCUs total
Saving and Credit Credit only total
No. of Borrowers in the year 0 888 0 888 1,673 1,548 3,221
Percent 0% 100% 0% 100% 52% 48% 100%
Average no. of Borrower per entity 0 888 0 888
22 23 23
Total Amount of Laon Outstanding 0 2,319,292,000 0 2,319,292,000
1,995,959,000 978,547,000 2,974,506,000
Percent 0% 100% 0% 100% 67% 33% 100%
Average loan outstanding per entity 0 2,319,292,000 0 2,319,292,000
26,613,000 14,390,000 20,801,000
Average loan size per borrower 0 4,436,000 0 4,436,000 1,264,000 868,000 1,074,000
Table 4: Loan Usage
Regulated MFIs
VFs with
DTMFIs NDTMFIs SCUs total
Saving and Credit Credit only total
Agricultures and Livestock 0 1,443,943,000 0 1,443,943,000 1,803,385,000 1,004,657,000 2,808,042,000
Trade and Services 0 1,757,694,000 0 1,757,694,000 304,431,000 22,702,000 327,133,000
Handicraft 0 414,603,000 0 414,603,000 3,600,000 312,098,000 315,698,000
Emergency 0 323,350,000 0 323,350,000 3,600,000 3,500,000 7,100,000
Other Purpose 0 0 0 0 0 0 0
Table 5: Saving Information
Regulated MFIs
VFs
DTMFIs NDTMFIs SCUs total
Saving and Credit Credit only total
Number of savers 0 31 0 31 1,871 N/A N/A
Average no. of savers per entity 0 31 0 31 25 N/A N/A
Total amount of savings 0 288,000,000 0 288,000,000 100,020,000 N/A N/A
Average saving per entity 0 288,000,000 0 288,000,000 1,334,000 N/A N/A
Average savings size per member 0 9,290,000 0 9,290,000 53,000 N/A N/A

36
Table 6: Income Statement
Regulated MFIs VFs
Unit: kip DTMFIs NDTMFIs SCUs total Saving and Credit Credit only total
Interest Income 0 753,503,000 0 753,503,000 319,832,000 98,316,000 418,148,000
Other Income (e.g. fees, service charges) 0 99,260,000 0 99,260,000 0 0 0
Operating Expenses 0 820,281,000 0 820,281,000 0 0 0
Expenses for Village Development 0 0 0 0 27,856,000 13,467,000 41,323,000
Expenses for Social Welfare 0 0 0 0 10,921,000 7,067,000 17,988,000
Other Expenses (e.g. consultants, studies) 0 0 0 118,230,000 20,536,000 138,766,000
Total Operating Expenses 0 820,281,000 0 820,281,000 157,007,000 41,070,000 198,077,000
Net Operating Income/Loss 0 32,482,000 0 32,482,000 162,825,000 57,246,000 220,071,000
Loan Loss Provision/Reserves 0 0 0 0 12,297,000 7,067,000 19,364,000
Extraordinay Income (e.g. grants) 0 0 0 0 0 0 0
Net profit for the period 0 32,482,000 0 32,482,000 150,528,000 50,179,000 200,707,000
Table 7: Balance Sheet
Regulated MFIs VFs with
Unit: kip DTMFIs NDTMFIs SCUs total
Saving and
Credit Credit only total
Cash 0 1,620,190,000 0 1,620,190,000 232,104,000 373,076,000 605,180,000
Gross loan outstanding 0 2,319,292,000 0 2,319,292,000 1,995,959,000 978,547,000 2,974,506,000
Fixed and other assets 0 108,000 0 108,000 40,888,000 38,281,000 79,169,000
Total Asset 0 3,939,590,000 0 3,939,590,000 2,268,951,000 1,389,904,000 3,658,855,000
Saving deposits 0 288,000,000 0 288,000,000 100,020,000 0 100,020,000
Loan Recieved 0 0 0 0 0 0 0
Others (Unpaid dividend) 0 0 0 0 78,484,000 0 78,484,000
Total Liability 0 288,000,000 0 288,000,000 178,504,000 0 178,504,000
Shares 0 209,640,000 0 209,640,000 0 0 0
Reserve 0 118,847,000 0 118,847,000 0 0 0
Donation and grant 0 141,951,000 0 141,951,000 1,802,966,000 1,346,792,000 3,149,758,000
Retained earning prior period,
others* 0 3,148,670,000 0 3,148,670,000 208,271,000 0 208,271,000
Dividend Payment 0 0 0 0 -71,318,000 -7,067,000 -78,385,000
Profit/Loss of current year 0 32,482,000 0 32,482,000 150,528,000 50,179,000 200,707,000
Total Equity 0 3,651,590,000 0 3,651,590,000 2,090,447,000 1,389,904,000 3,480,351,000
Total Liability and Equity 0 3,939,590,000 0 3,939,590,000 2,268,951,000 1,389,904,000 3,658,855,000
Note: * Additional capital, dividend declared
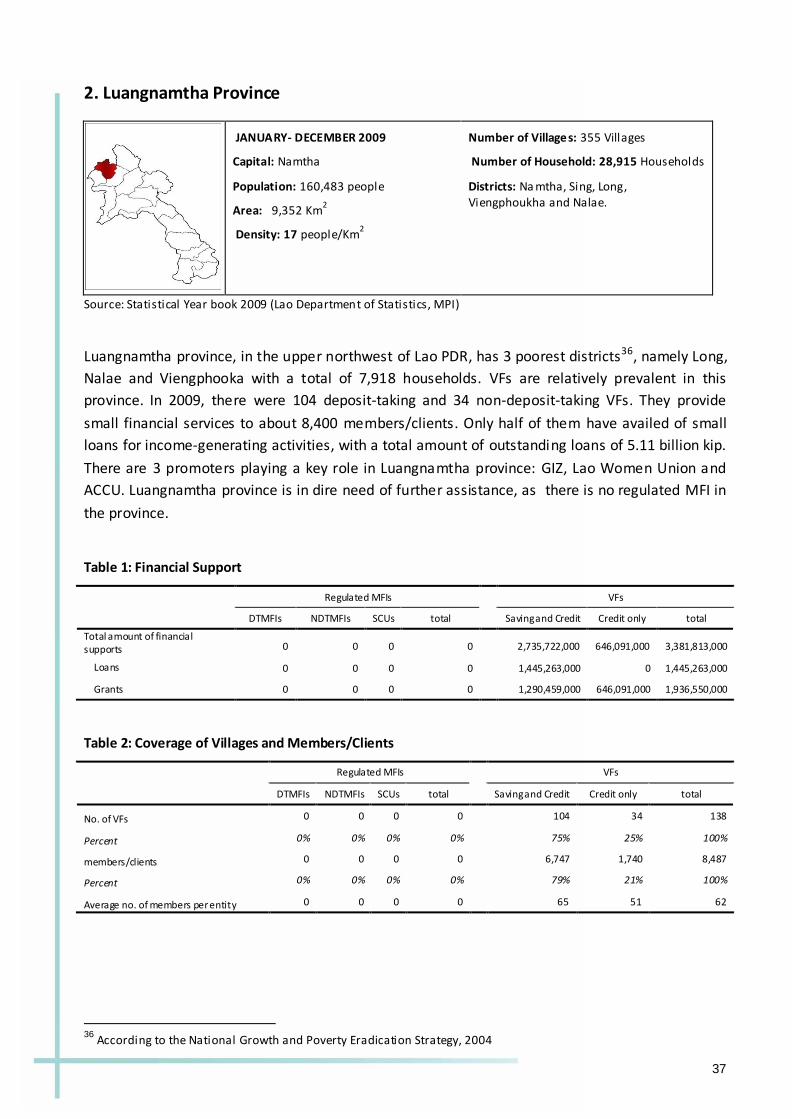
37
2. Luangnamtha Province
JANUARY- DECEMBER 2009
Capital: Namtha
Population: 160,483 people
Area: 9,352 Km2
Density: 17 people/Km2
Number of Villages: 355 Villages
Number of Household: 28,915 Households
Districts: Na mtha, Sing, Long, Viengphoukha and Nalae.
Source: Statistical Year book 2009 (Lao Department of Statistics, MPI)
Luangnamtha province, in the upper northwest of Lao PDR, has 3 poorest districts36, namely Long,
Nalae and Viengphooka with a total of 7,918 households. VFs are relatively prevalent in this
province. In 2009, there were 104 deposit-taking and 34 non-deposit-taking VFs. They provide
small financial services to about 8,400 members/clients. Only half of them have availed of small
loans for income-generating activities, with a total amount of outstanding loans of 5.11 billion kip.
There are 3 promoters playing a key role in Luangnamtha province: GIZ, Lao Women Union and
ACCU. Luangnamtha province is in dire need of further assistance, as there is no regulated MFI in
the province.
Table 1: Financial Support
Regulated MFIs
VFs
DTMFIs NDTMFIs SCUs total
Saving and Credit Credit only total
Total amount of financial supports 0 0 0 0 2,735,722,000 646,091,000 3,381,813,000
Loans 0 0 0 0 1,445,263,000 0 1,445,263,000
Grants 0 0 0 0 1,290,459,000 646,091,000 1,936,550,000
Table 2: Coverage of Villages and Members/Clients
Regulated MFIs
VFs
DTMFIs NDTMFIs SCUs total
Saving and Credit Credit only total
No. of VFs 0 0 0 0 104 34 138
Percent 0% 0% 0% 0% 75% 25% 100%
members/clients 0 0 0 0 6,747 1,740 8,487
Percent 0% 0% 0% 0% 79% 21% 100%
Average no. of members per entity 0 0 0 0 65 51 62
36
According to the National Growth and Poverty Eradication Strategy, 2004
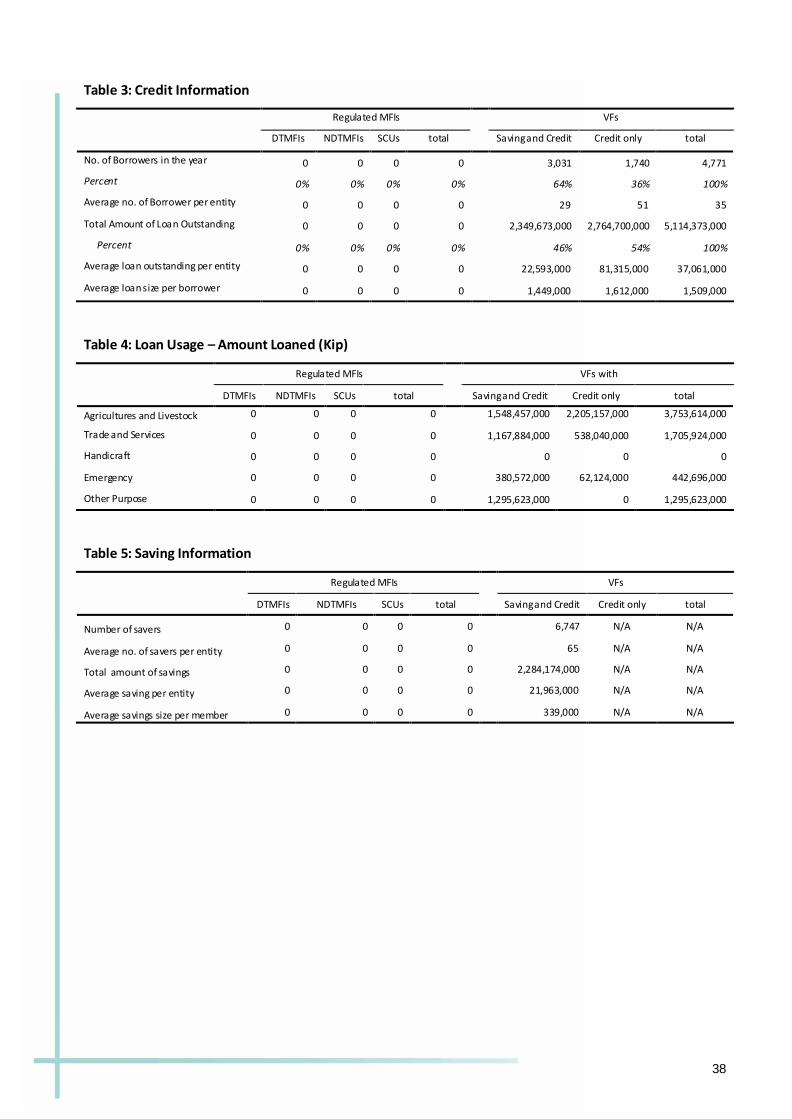
38
Table 3: Credit Information
Regulated MFIs
VFs
DTMFIs NDTMFIs SCUs total
Saving and Credit Credit only total
No. of Borrowers in the year 0 0 0 0 3,031 1,740 4,771
Percent 0% 0% 0% 0% 64% 36% 100%
Average no. of Borrower per entity 0 0 0 0
29 51 35
Total Amount of Loan Outstanding 0 0 0 0
2,349,673,000 2,764,700,000 5,114,373,000
Percent 0% 0% 0% 0% 46% 54% 100%
Average loan outstanding per entity 0 0 0 0
22,593,000 81,315,000 37,061,000
Average loan size per borrower 0 0 0 0 1,449,000 1,612,000 1,509,000
Table 4: Loan Usage – Amount Loaned (Kip)
Regulated MFIs
VFs with
DTMFIs NDTMFIs SCUs total
Saving and Credit Credit only total
Agricultures and Livestock 0 0 0 0 1,548,457,000 2,205,157,000 3,753,614,000
Trade and Services 0 0 0 0 1,167,884,000 538,040,000 1,705,924,000
Handicraft 0 0 0 0 0 0 0
Emergency 0 0 0 0 380,572,000 62,124,000 442,696,000
Other Purpose 0 0 0 0 1,295,623,000 0 1,295,623,000
Table 5: Saving Information
Regulated MFIs
VFs
DTMFIs NDTMFIs SCUs total
Saving and Credit Credit only total
Number of savers 0 0 0 0 6,747 N/A N/A
Average no. of savers per entity 0 0 0 0 65 N/A N/A
Total amount of savings 0 0 0 0 2,284,174,000 N/A N/A
Average saving per entity 0 0 0 0 21,963,000 N/A N/A
Average savings size per member 0 0 0 0 339,000 N/A N/A

39
Table 6: Income Statement
Regulated MFIs VFs
Unit: kip DTMFIs NDTMFIs SCUs total Saving and Credit Credit only total
Interest Income 0 0 0 0 424,342,000 169,791,000 594,133,000
Other Income (e.g. fees, service charges) 0 0 0 0 0 0 0
Operating Expenses 0 0 0 0 0 0 0
Expenses for Village Development 0 0 0 0 9,643,000 9,229,000 18,872,000
Expenses for Social Welfare 0 0 0 0 9,569,000 885,000 10,454,000
Other Expenses (e.g. consultants, studies) 0 0 0 0 18,096,000 40,831,000 58,927,000
Total Operating Expenses 0 0 0 0 37,308,000 50,945,000 88,253,000
Net Operating Income/Loss 0 0 0 0 387,034,000 118,846,000 505,880,000
Loan Loss Provision/Reserves 0 0 0 0 39,926,000 1,169,000 41,095,000
Extraordinay Income (e.g. grants) 0 0 0 0 0 0 0
Net profit for the period 0 0 0 0 347,108,000 117,677,000 464,785,000
Table 7: Balance Sheet
Regulated MFIs VFs with
Unit: kip DTMFIs NDTMFIs SCUs total
Saving and
Credit Credit only total
Cash 0 0 0 0 2,370,563,000 45,621,000 2,416,184,000
Gross loan outstanding 0 0 0 0 2,349,673,000 2,764,700,000 5,114,373,000
Fixed and other assets 0 0 0 0 581,675,000 18,469,000 600,144,000
Total Asset 0 0 0 0 5,301,911,000 2,828,790,000 8,130,701,000
Saving deposits 0 0 0 0 2,284,174,000 0 2,284,174,000
Loan Recieved 0 0 0 0 1,445,623,000 0 1,445,623,000
Others (Unpaid dividend) 0 0 0 0 0 0 0
Total Liability 0 0 0 0 3,729,797,000 0 3,729,797,000
Shares 0 0 0 0 0 0 0
Reserve 0 0 0 0 9,643,000 0 9,643,000
Donation and grant 0 0 0 0 1,290,459,000 646,090,000 1,936,549,000
Retained earning prior period,
others* 0 0 0 0 268,859,000 2,142,460,000 2,411,319,000
Dividend Payment 0 0 0 0 -343,955,000 -77,437,000 -421,392,000
Profit/Loss of current year 0 0 0 0 347,108,000 117,677,000 464,785,000
Total Equity 0 0 0 0 1,572,114,000 2,828,790,000 4,400,904,000
Total Liability and Equity 0 0 0 0 5,301,911,000 2,828,790,000 8,130,701,000
Note: * Additional capital, dividend declared

40
3. Bokeo Province
JANUARY‐ DECEMBER 2009
Capital: Huoisai
Population: 161,530 people
Area: 6,196 Km2
Density: 26 people/ Km2
Number of Villages: 291 Villages
Number of Household: 27,606 Households
Districts: Huoisai, Tonpheung,
Meung, Phaoudom and Paktha
Source: Statistical Year book 2009 (Lao Department of Statistics, MPI)
Bokeo province, in the northern region of Lao PDR, has 4 poor districts with 5,942 poor households as listed in the NGPES. Microfinance has been promoted since 2000 by GIZ through the Village Community Development Fund of Bokeo, in order to reduce poverty and to assist people in rural areas to access financial services for income‐generating activities. As of 2009, there is one NDTMFI (NDTMFI Village Community Development Fund of Bokeo)37. In addition there are 31 VFs. They comprise 10,673 members/clients and about 5,000 borrowers with total loans outstanding around 5 billion kip. NCA, VICO and GIZ are the key promoters.
Table 1: Financial Support
Regulated MFIs VFs
DTMFIs NDTMFIs SCUs total Saving and Credit Credit only total
Total amount of financial supports 0 4,584,200,000 0 4,584,200,000 198,529,000 286,449,000 484,978,000
Loans 0 0 0 0 31,930,000 0 31,930,000
Grants 0 4,584,200,000 0 4,584,200,000 166,599,000 286,449,000 453,048,000
Table 2: Coverage of Villages and Members/Clients
Regulated MFIs VFs
DTMFIs NDTMFIs SCUs total Saving and Credit Credit only total
No. of Entity 0 1 0 1 0 0 0
No. of village coverage 0 138 0 138 0 0 0
No. of VFs 0 0 0 0 21 10 31
Percent 0% 100% 0% 100% 68% 32% 100%
members/clients 0 9,028 0 9,028 966 679 1,645
Percent 0% 100% 0% 100% 59% 41% 100%
Average no. of members per entities 0 9,028 0 9,028 46 68 53
37 In 2009 the NDTMFI acted as network support organization for some 138 VFs. Due to flaws in data collection and processing these VF are not mentioned in the VF sections but under the information for the NDTMFI.

41
Table 3: Credit Information
Regulated MFIs
VFs
DTMFIs NDTMFIs SCUs total
Saving and Credit Credit only total
No. of Borrowers in the year 0 3,863 0 3,863 612 292 904
Percent 0% 100% 0% 100% 68% 32% 100%
Average no. of Borrower per entity 0 3,863 0 3,863
29 29 29
Total Amount of Laon Outstanding 0 4,308,549,000 0 4,308,549,000
448,532,000 288,879,000 737,411,000
Percent 0% 100% 0% 100% 61% 39% 100%
Average loan outstanding per entity 0 4,308,549,000 0 4,308,549,000
21,359,000 28,888,000 23,787,000
Average loan size per borrower 0 1,212,000 0 1,212,000 730,000 989,000 814,000
Table 4: Loan Usage – Amount Loaned (Kip)
Regulated MFIs
VFs with
DTMFIs NDTMFIs SCUs total
Saving and Credit Credit only total
Agricultures and Livestock 0 4,401,241,000 0 4,401,241,000 267,939,000 279,279,000 547,218,000
Trade and Services 0 93,644,000 0 93,644,000 51,602,000 9,600,000 61,202,000
Handicraft 0 140,466,000 0 140,466,000 14,908,000 0 14,908,000
Emergency 0 46,863,000 0 46,863,000 58,458,000 0 58,458,000
Other Purpose 0 0 0 0 53,625,000 0 53,625,000
Table 5: Saving Information
Regulated MFIs
VFs with
DTMFIs NDTMFIs SCUs total
Saving and Credit Credit only total
Number of savers 0 9,028 0 9,028 966 N/A N/A
Average no. of savers per entity 0 9,028 0 9,028 46 N/A N/A
Total amount of savings 0 256,950,000 0 256,950,000 254,195,000 N/A N/A
Average saving per entity 0 256,950,000 0 256,950,000 12,105,000 N/A N/A
Average savings size per member 0 28,000 0 28,000 263,000 N/A N/A

42
Table 6: Income Statement
Regulated MFIs VFs
Unit: kip DTMFIs NDTMFIs SCUs total Saving and Credit Credit only total
Interest Income 0 408,826,000 0 408,826,000 39,628,000 12,570,000 52,198,000
Other Income (e.g. fees, service charges) 0 137,891,000 0 137,891,000 1,108,000 0 1,108,000
Operating Expenses 0 511,535,000 0 511,535,000 0 0 0
Expenses for Village Development 0 0 0 0 867,000 0 867,000
Expenses for Social Welfare 0 0 0 0 0 0 0
Other Expenses (e.g. consultants, studies) 0 0 0 0 0 0
Total Operating Expenses 0 511,535,000 0 511,535,000 867,000 0 867,000
Net Operating Income/Loss 0 35,182,000 0 35,182,000 39,869,000 12,570,000 52,439,000
Loan Loss Provision/Reserves 0 0 0 0 0 0 0
Extraordinay Income (e.g. grants) 0 36,159,000 0 36,159,000 0 0 0
Net profit for the period 0 71,341,000 0 71,341,000 39,869,000 12,570,000 52,439,000
Table 7: Balance Sheet
Regulated MFIs VFs with
Unit: kip DTMFIs NDTMFIs SCUs total
Saving and
Credit Credit only total
Cash 0 373,158,000 0 373,158,000 40,662,000 9,763,000 50,425,000
Gross loan outstanding 0 4,308,549,000 0 4,308,549,000 448,532,000 288,879,000 737,411,000
Fixed and other assets 0 159,443,000 0 159,443,000 0 0 0
Total Asset 0 4,841,150,000 0 4,841,150,000 489,194,000 298,642,000 787,836,000
Saving deposits 0 256,950,000 0 256,950,000 254,195,000 0 254,195,000
Loan Recieved 0 0 0 0 31,930,000 0 31,930,000
Others (Unpaid dividend) 0 0 0 0 0 0 0
Total Liability 0 256,950,000 0 256,950,000 286,125,000 0 286,125,000
Shares 0 0 0 0 0 0 0
Reserve 0 0 0 0 0 0 0
Donation and grant 0 4,584,200,000 0 4,584,200,000 166,599,000 286,449,000 453,048,000
Retained earning prior period,
others* 0 -71,341,000 0 -71,341,000 12,218,000 2,410,000 14,628,000
Dividend Payment 0 0 0 0 -15,617,000 -2,787,000 -18,404,000
Profit/Loss of current year 0 71,341,000 0 71,341,000 39,869,000 12,570,000 52,439,000
Total Equity 0 4,584,200,000 0 4,584,200,000 203,069,000 298,642,000 501,711,000
Total Liability and Equity 0 4,841,150,000 0 4,841,150,000 489,194,000 298,642,000 787,836,000
Note: * Additional capital, dividend declared

43
4. Oudomxay Province
JANUARY- DECEMBER 2009
Capital: Xay
Population: 292,869 people
Area: 15,370 Km2
Density: 19 people/Km2
Number of Villages: 427 Villages
Number of Household: 46,275 Households
Districts: Xay, La, Namor, Nga, Beng, Hoon and Parkbeng
Source: Statistical Year book 2009 (Lao Department of Statistics, MPI)
Microfinance was initially introduced in Oudomxay in 1999 by Oudomxay Microfinance Office. It is
now renamed to Oudomxay Development Non-Deposit-Taking Microfinance Institution. As of 2009
there is 1 NDTMFI and 245 village funds in Oudomxay province with a total of 15,534
members/clients, including over 8,000 borrowers and a loan portfolio of 6.6 billion kip. The main
organization who plays a key role in this province are the district Lao Women Unions and Povery
Eradication and Rural Development Offices.
Table 1: Financial Support
Regulated MFIs
VFs
DTMFIs NDTMFIs SCUs total
Saving and Credit Credit only total
Total amount of financial supports 0 0 0 0 8,993,239,000 416,740,000 9,409,979,000
Loans 0 0 0 0 0 0 0
Grants 0 0 0 0 8,993,239,000 416,740,000 9,409,979,000
Table 2: Coverage of Villages and Members/Clients
Regulated MFIs
VFs
DTMFIs NDTMFIs SCUs total
Saving and Credit Credit only total
No. of institutions 0 1 0 1 0 0 0
No. of village coverage 0 30 0 30 0 0 0
No. of VFs 0 0 0 0 232 13 245
Percent 0% 100% 0% 100% 95% 5% 100%
Members/clients 0 1,221 0 1,221 14,152 161 14,313
Percent 0% 100% 0% 100% 99% 1% 100%
Average no. of members per entities 0 1,221 0 1,221 61 12 58
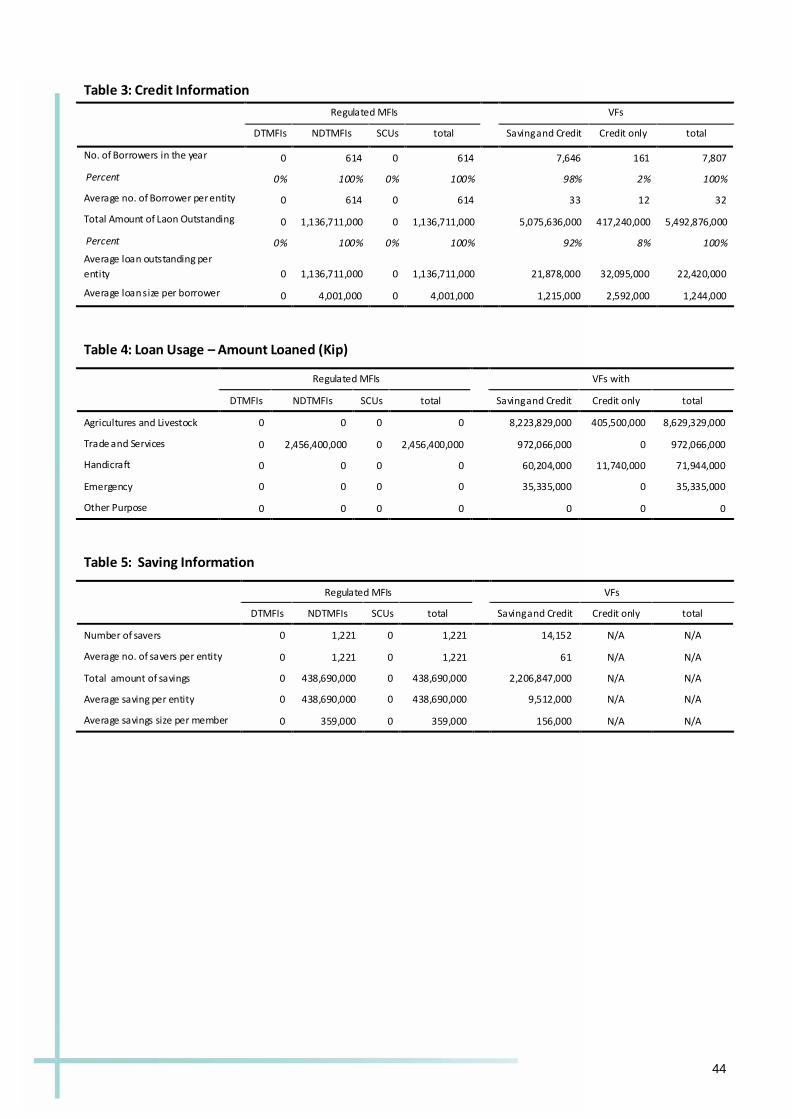
44
Table 3: Credit Information
Regulated MFIs
VFs
DTMFIs NDTMFIs SCUs total
Saving and Credit Credit only total
No. of Borrowers in the year 0 614 0 614 7,646 161 7,807
Percent 0% 100% 0% 100% 98% 2% 100%
Average no. of Borrower per entity 0 614 0 614
33 12 32
Total Amount of Laon Outstanding 0 1,136,711,000 0 1,136,711,000
5,075,636,000 417,240,000 5,492,876,000
Percent 0% 100% 0% 100% 92% 8% 100%
Average loan outstanding per
entity 0 1,136,711,000 0 1,136,711,000
21,878,000 32,095,000 22,420,000
Average loan size per borrower 0 4,001,000 0 4,001,000 1,215,000 2,592,000 1,244,000
Table 4: Loan Usage – Amount Loaned (Kip)
Regulated MFIs
VFs with
DTMFIs NDTMFIs SCUs total
Saving and Credit Credit only total
Agricultures and Livestock 0 0 0 0 8,223,829,000 405,500,000 8,629,329,000
Trade and Services 0 2,456,400,000 0 2,456,400,000 972,066,000 0 972,066,000
Handicraft 0 0 0 0 60,204,000 11,740,000 71,944,000
Emergency 0 0 0 0 35,335,000 0 35,335,000
Other Purpose 0 0 0 0 0 0 0
Table 5: Saving Information
Regulated MFIs
VFs
DTMFIs NDTMFIs SCUs total
Saving and Credit Credit only total
Number of savers 0 1,221 0 1,221 14,152 N/A N/A
Average no. of savers per entity 0 1,221 0 1,221 61 N/A N/A
Total amount of savings 0 438,690,000 0 438,690,000 2,206,847,000 N/A N/A
Average saving per entity 0 438,690,000 0 438,690,000 9,512,000 N/A N/A
Average savings size per member 0 359,000 0 359,000 156,000 N/A N/A

45
Table 6: Income Statement
Regulated MFIs VFs
Unit: kip DTMFIs NDTMFIs SCUs total Saving and Credit Credit only total
Interest Income 0 653,891,000 0 653,891,000 1,586,644,000 55,747,000 1,642,391,000
Other Income (e.g. fees, service charges) 0 3,002,000 0 3,002,000 102,370,000 0 102,370,000
Operating Expenses 0 619,838,000 0 619,838,000 952,982,000 38,463,000 991,445,000
Expenses for Village Development 0 0 0 0 26,221,000 0 26,221,000
Expenses for Social Welfare 0 0 0 0 0 0 0
Other Expenses (e.g. consultants, studies) 0 0 0 0 60,033,000 0 60,033,000
Total Operating Expenses 0 619,838,000 0 619,838,000 1,039,236,000 38,463,000 1,077,699,000
Net Operating Income/Loss 0 37,055,000 0 37,055,000 649,778,000 17,284,000 667,062,000
Loan Loss Provision/Reserves 0 0 0 0 118,371,000 0 118,371,000
Extraordinay Income (e.g. grants) 0 81,476,000 0 81,476,000 254,593,000 0 254,593,000
Net profit for the period 0 118,531,000 0 118,531,000 786,000,000 17,284,000 803,284,000
Table 7: Balance Sheet
Regulated MFIs VFs with
Unit: kip DTMFIs NDTMFIs SCUs total
Saving and
Credit Credit only total
Cash 0 342,851,000 0 342,851,000 3,069,177,000 3,659,000 3,072,836,000
Gross loan outstanding 0 1,136,711,000 0 1,136,711,000 5,075,636,000 417,240,000 5,492,876,000
Fixed and other assets 0 194,346,000 0 194,346,000 4,052,479,000 13,624,000 4,066,103,000
Total Asset 0 1,673,908,000 0 1,673,908,000 12,197,292,000 434,523,000 12,631,815,000
Saving deposits 0 438,690,000 0 438,690,000 2,206,847,000 0 2,206,847,000
Loan Recieved 0 157,000,000 0 157,000,000 0 0 0
Others (Unpaid dividend) 0 2,196,000 0 2,196,000 170,862,000 0 170,862,000
Total Liability 0 597,886,000 0 597,886,000 2,377,709,000 0 2,377,709,000
Shares 0 955,161,000 0 955,161,000 0 0 0
Reserve 0 0 0 0 146,834,000 0 146,834,000
Donation and grant 0 115,319,000 0 115,319,000 8,993,239,000 417,240,000 9,410,479,000
Retained earning prior period,
others* 0 -112,989,000 0 -112,989,000 461,444,000 -1,000 461,443,000
Dividend Payment 0 0 0 0 -567,934,000 0 -567,934,000
Profit/Loss of current year 0 118,531,000 0 118,531,000 786,000,000 17,284,000 803,284,000
Total Equity 0 1,076,022,000 0 1,076,022,000 9,819,583,000 434,523,000 10,254,106,000
Total Liability and Equity 0 1,673,908,000 0 1,673,908,000 12,197,292,000 434,523,000 12,631,815,000
Note: * Additional capital, dividend declared

46
5. Luangprabang Province
JANUARY- DECEMBER 2009
Capital: Luangprabang
Population: 439,504 people
Area: 16,875 Km2
Density: 26 people/Km2
Number of Villages: 794 Villages
Number of Household: 71,597
Households
Districts: Luangrabang, Xieng ngeun, Nan,
Park ou, Nambark, Ngoi, Park xeng, Phonxay, Chomhet, Viengkham, Phoukhoune and Phonthong.
Source: Statistical Year book 2009 (Lao Department of Statistics, MPI)
Microfinance has been actively promoted in Luangprabang since 2004, when the provincial
government introduced VFs in 4 poor districts (Phonesay, Pakseng, Viengkham and Phookhoun).
Later in the same year, the Luangprabang Savings and Credit Union38 was established. Since then
microfinance has been growing to comprise 1 DTMFI, 1 SCU and 240 village funds in 2009. There is
a total of 16,242 members/clients. About 80% of the members have obtained small loans for their
income-generating activities, with a portfolio of loans outstanding of 8.41 billion kip. The main
promoters are the district Lao Women Unions, the Poverty Eradication and Rural Development
offices, World Vision and ACCU.
Table 1: Financial Support
Regulated MFIs
VFs
DTMFIs NDTMFIs SCUs total
Saving and Credit Credit only total
Total amount of financial supports
0 0 56,000,000 56,000,000
150,000,000 938,434,000 1,088,434,000
Loans 0 0 0 0
150,000,000 0 150,000,000
Grants 0 0 56,000,000 56,000,000
0 938,434,000 938,434,000
Table 2: Coverage of Villages and Members/Clients
Regulated MFIs
VFs
DTMFIs NDTMFIs SCUs total
Saving and Credit Credit only total
No. of Entity 1 0 1 2 0 0 0
No. of village coverage 138 0 80 218 0 0 0
No. of VFs 0 0 0 0 61 179 240
Percent 63% 0% 37% 100% 25% 75% 100%
members/clients 555 0 866 1,421 4,748 10,073 14,821
Percent 39% 0% 61% 100% 32% 68% 100%
Average no. of members per entities 555 0 866 711 78 56 62
38
One of 3 pilot projects supported by ADB

47
Table 3: Credit Information
Regulated MFIs
VFs
DTMFIs NDTMFIs SCUs total
Saving and Credit Credit only total
No. of Borrowers in the
year 555 0 335 890 2,305 10,073 12,378
Percent 62% 0% 38% 100% 19% 81% 100%
Average no. of Borrower
per entity 555 0 335 445
38 56 52
Total Amount of Laon
Outstanding 552,255,000 0 584,929,000 1,137,184,000
2,347,721,000 4,933,257,000 7,280,978,000
Percent 49% 0% 51% 100% 32% 68% 100%
Average loan outstanding
per entity 552,255,000 0 584,929,000 568,592,000
38,487,000 27,560,000 30,337,000
Average loan size per
borrower 5,475,000 0 3,908,000 4,885,000 1,019,000 490,000 588,000
Table 4: Loan Usage – Amount Loaned (Kip)
Regulated MFIs
VFs with
DTMFIs NDTMFIs SCUs total
Saving and Credit Credit only total
Agricultures and Livestock 151,899,000 0 1,047,280,000 1,199,179,000 1,749,566,000 4,120,785,000 5,870,351,000
Trade and Services 987,349,000 0 98,564,000 1,085,913,000 287,854,000 431,880,000 719,734,000
Handicraft 303,800,000 0 0 303,800,000 0 0 0
Emergency 75,952,000 0 30,708,000 106,660,000 310,302,000 380,591,000 690,893,000
Other Purpose 1,519,400,000 0 132,548,000 1,651,948,000 0 0 0
Table 5: Saving Information
Regulated MFIs
VFs
DTMFIs NDTMFIs SCUs total
Saving and Credit Credit only total
Number of savers 50 0 515 565 4,097 N/A N/A
Average no. of savers per entity 50 0 515 283 67 N/A N/A
Total amount of savings 47,988,000 0 318,358,000 366,346,000 2,411,115,000 N/A N/A
Average saving per entity 47,988,000 0 318,358,000 183,173,000 39,526,000 N/A N/A
Average savings size per member 960,000 0 618,000 648,000 589,000 N/A N/A

48
Table 6: Income Statement
Regulated MFIs VFs
Unit: kip DTMFIs NDTMFIs SCUs total Saving and Credit Credit only total
Interest Income 183,024,000 0 289,231,000 472,255,000 397,266,000 532,145,000 929,411,000
Other Income (e.g. fees, service charges) 0 0 0 0 0 0 0
Operating Expenses 377,202,000 262,384,000 639,586,000 88,302,000 60,606,000 148,908,000
Expenses for Village Development 0 0 0 0 13,309,000 9,091,000 22,400,000
Expenses for Social Welfare 0 0 0 0 6,652,000 0 6,652,000
Other Expenses (e.g. consultants, studies) 0 0 0 0 16,631,000 63,637,000 80,268,000
Total Operating Expenses 377,202,000 0 262,384,000 639,586,000 124,894,000 133,334,000 258,228,000
Net Operating Income/Loss -194,178,000 0 26,847,000 -167,331,000 272,372,000 398,811,000 671,183,000
Loan Loss Provision/Reserves 0 0 8,619,000 8,619,000 13,309,000 54,545,000 67,854,000
Extraordinay Income (e.g. grants) 0 0 0 0 0 0 0
Net profit for the period -194,178,000 0 18,228,000 -175,950,000 259,063,000 344,266,000 603,329,000
Table 7: Balance Sheet
Regulated MFIs VFs with
Unit: kip DTMFIs NDTMFIs SCUs total
Saving and
Credit Credit only total
Cash 48,825,000 0 0 48,825,000 148,368,000 0 148,368,000
Gross loan outstanding 552,255,000 0 584,929,000 1,137,184,000 2,347,721,000 4,933,257,000 7,280,978,000
Fixed and other assets 337,729,000 0 56,000,000 393,729,000 606,939,000 0 606,939,000
Total Asset 938,809,000 0 640,929,000 1,579,738,000 3,103,028,000 4,933,257,000 8,036,285,000
Saving deposits 47,988,000 0 318,358,000 366,346,000 2,411,115,000 0 2,411,115,000
Loan Recieved 0 0 0 0 150,000,000 0 150,000,000
Others (Unpaid dividend) 0 0 0 0 0 0 0
Total Liability 47,988,000 0 318,358,000 366,346,000 2,561,115,000 0 2,561,115,000
Shares 753,068,000 0 266,571,000 1,019,639,000 443,630,000 0 443,630,000
Reserve 0 0 0 0 13,309,000 45,455,000 58,764,000
Donation and grant 0 0 56,000,000 56,000,000 0 938,434,000 938,434,000
Retained earning prior
period, others* 331,931,000 0 9,537,000 341,468,000 -49,558,000 3,905,910,000 3,856,352,000
Dividend Payment 0 0 -27,765,000 -27,765,000 -124,531,000 -300,808,000 -425,339,000
Profit/Loss of current year -194,178,000 0 18,228,000 -175,950,000 259,063,000 344,266,000 603,329,000
Total Equity 890,821,000 0 322,571,000 1,213,392,000 541,913,000 4,933,257,000 5,475,170,000
Total Liability and Equity 938,809,000 0 640,929,000 1,579,738,000 3,103,028,000 4,933,257,000 8,036,285,000
Note: * Additional capital, dividend declared
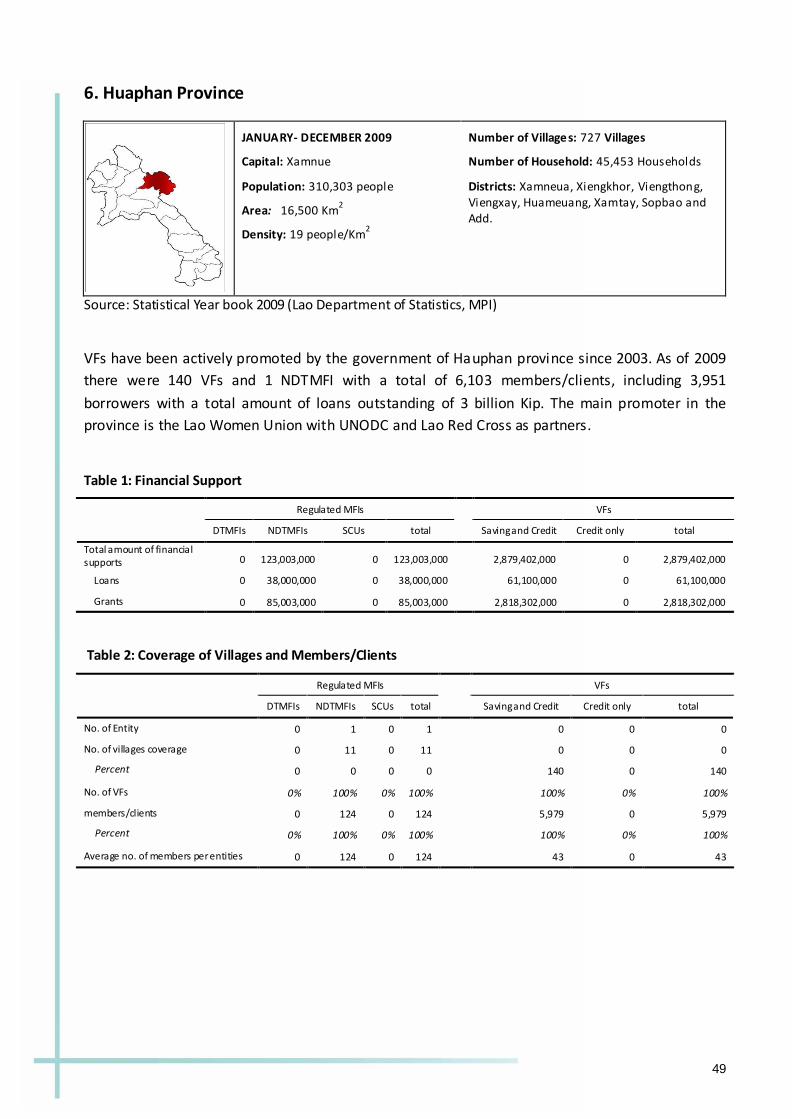
49
6. Huaphan Province
JANUARY- DECEMBER 2009
Capital: Xamnue
Population: 310,303 people
Area: 16,500 Km2
Density: 19 people/Km2
Number of Villages: 727 Villages
Number of Household: 45,453 Households
Districts: Xamneua, Xiengkhor, Viengthong, Viengxay, Huameuang, Xamtay, Sopbao and Add.
Source: Statistical Year book 2009 (Lao Department of Statistics, MPI)
VFs have been actively promoted by the government of Hauphan province since 2003. As of 2009
there were 140 VFs and 1 NDTMFI with a total of 6,103 members/clients, including 3,951
borrowers with a total amount of loans outstanding of 3 billion Kip. The main promoter in the
province is the Lao Women Union with UNODC and Lao Red Cross as partners.
Table 1: Financial Support
Regulated MFIs
VFs
DTMFIs NDTMFIs SCUs total
Saving and Credit Credit only total
Total amount of financial supports 0 123,003,000 0 123,003,000 2,879,402,000 0 2,879,402,000
Loans 0 38,000,000 0 38,000,000 61,100,000 0 61,100,000
Grants 0 85,003,000 0 85,003,000 2,818,302,000 0 2,818,302,000
Table 2: Coverage of Villages and Members/Clients
Regulated MFIs
VFs
DTMFIs NDTMFIs SCUs total
Saving and Credit Credit only total
No. of Entity 0 1 0 1 0 0 0
No. of villages coverage 0 11 0 11 0 0 0
Percent 0 0 0 0 140 0 140
No. of VFs 0% 100% 0% 100% 100% 0% 100%
members/clients 0 124 0 124 5,979 0 5,979
Percent 0% 100% 0% 100% 100% 0% 100%
Average no. of members per entities 0 124 0 124 43 0 43
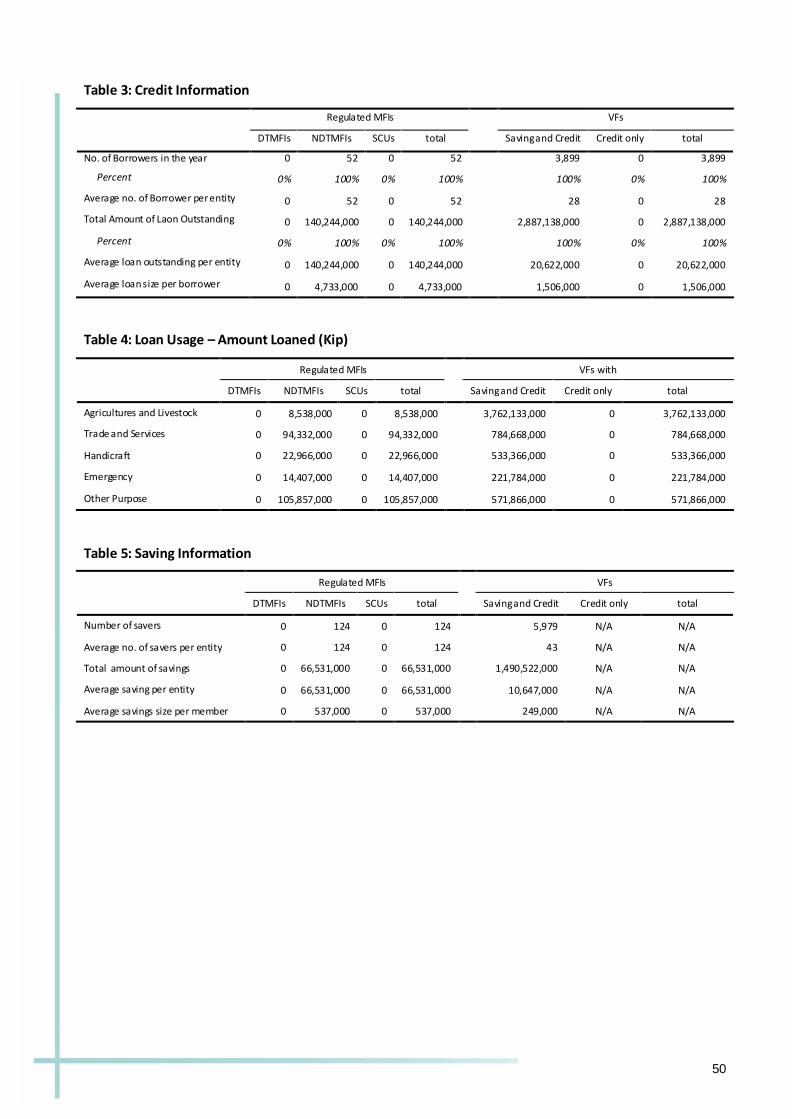
50
Table 3: Credit Information
Regulated MFIs
VFs
DTMFIs NDTMFIs SCUs total
Saving and Credit Credit only total
No. of Borrowers in the year 0 52 0 52 3,899 0 3,899
Percent 0% 100% 0% 100% 100% 0% 100%
Average no. of Borrower per entity 0 52 0 52
28 0 28
Total Amount of Laon Outstanding 0 140,244,000 0 140,244,000
2,887,138,000 0 2,887,138,000
Percent 0% 100% 0% 100% 100% 0% 100%
Average loan outstanding per entity 0 140,244,000 0 140,244,000
20,622,000 0 20,622,000
Average loan size per borrower 0 4,733,000 0 4,733,000 1,506,000 0 1,506,000
Table 4: Loan Usage – Amount Loaned (Kip)
Regulated MFIs
VFs with
DTMFIs NDTMFIs SCUs total
Saving and Credit Credit only total
Agricultures and Livestock 0 8,538,000 0 8,538,000 3,762,133,000 0 3,762,133,000
Trade and Services 0 94,332,000 0 94,332,000 784,668,000 0 784,668,000
Handicraft 0 22,966,000 0 22,966,000 533,366,000 0 533,366,000
Emergency 0 14,407,000 0 14,407,000 221,784,000 0 221,784,000
Other Purpose 0 105,857,000 0 105,857,000 571,866,000 0 571,866,000
Table 5: Saving Information
Regulated MFIs
VFs
DTMFIs NDTMFIs SCUs total
Saving and Credit Credit only total
Number of savers 0 124 0 124 5,979 N/A N/A
Average no. of savers per entity 0 124 0 124 43 N/A N/A
Total amount of savings 0 66,531,000 0 66,531,000 1,490,522,000 N/A N/A
Average saving per entity 0 66,531,000 0 66,531,000 10,647,000 N/A N/A
Average savings size per member 0 537,000 0 537,000 249,000 N/A N/A
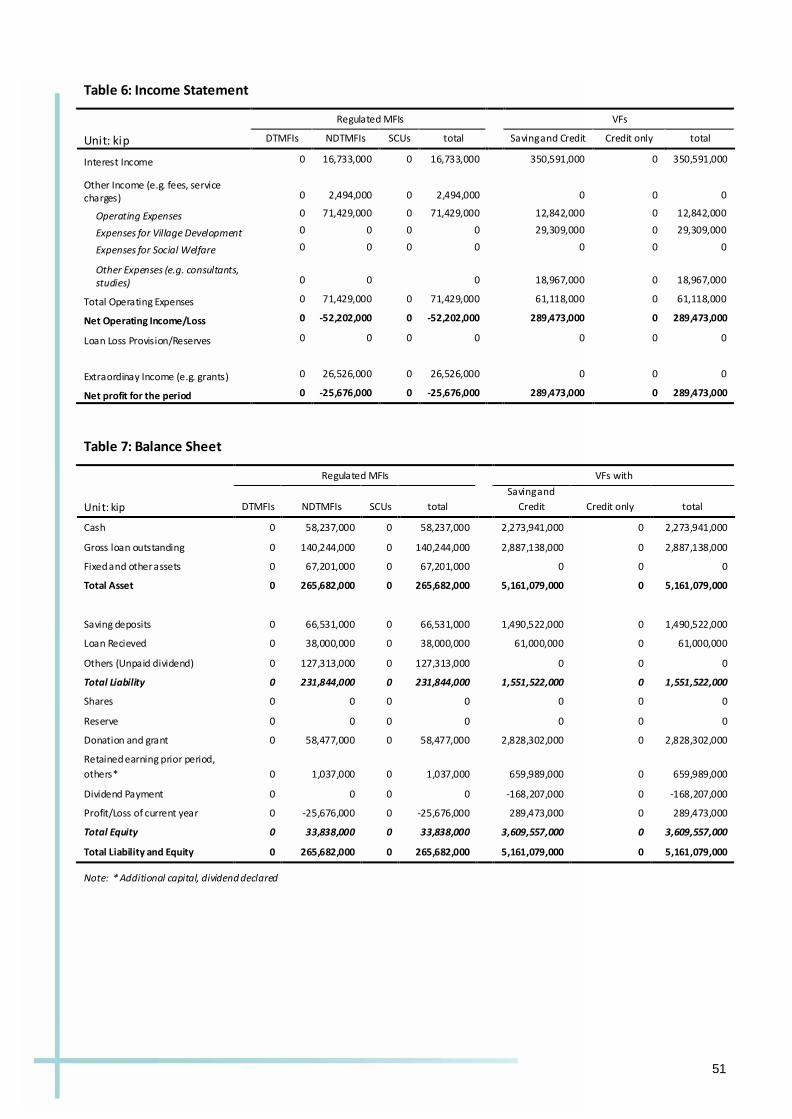
51
Table 6: Income Statement
Regulated MFIs VFs
Unit: kip DTMFIs NDTMFIs SCUs total Saving and Credit Credit only total
Interest Income 0 16,733,000 0 16,733,000 350,591,000 0 350,591,000
Other Income (e.g. fees, service charges) 0 2,494,000 0 2,494,000 0 0 0
Operating Expenses 0 71,429,000 0 71,429,000 12,842,000 0 12,842,000
Expenses for Village Development 0 0 0 0 29,309,000 0 29,309,000
Expenses for Social Welfare 0 0 0 0 0 0 0
Other Expenses (e.g. consultants, studies) 0 0 0 18,967,000 0 18,967,000
Total Operating Expenses 0 71,429,000 0 71,429,000 61,118,000 0 61,118,000
Net Operating Income/Loss 0 -52,202,000 0 -52,202,000 289,473,000 0 289,473,000
Loan Loss Provision/Reserves 0 0 0 0 0 0 0
Extraordinay Income (e.g. grants) 0 26,526,000 0 26,526,000 0 0 0
Net profit for the period 0 -25,676,000 0 -25,676,000 289,473,000 0 289,473,000
Table 7: Balance Sheet
Regulated MFIs VFs with
Unit: kip DTMFIs NDTMFIs SCUs total
Saving and
Credit Credit only total
Cash 0 58,237,000 0 58,237,000 2,273,941,000 0 2,273,941,000
Gross loan outstanding 0 140,244,000 0 140,244,000 2,887,138,000 0 2,887,138,000
Fixed and other assets 0 67,201,000 0 67,201,000 0 0 0
Total Asset 0 265,682,000 0 265,682,000 5,161,079,000 0 5,161,079,000
Saving deposits 0 66,531,000 0 66,531,000 1,490,522,000 0 1,490,522,000
Loan Recieved 0 38,000,000 0 38,000,000 61,000,000 0 61,000,000
Others (Unpaid dividend) 0 127,313,000 0 127,313,000 0 0 0
Total Liability 0 231,844,000 0 231,844,000 1,551,522,000 0 1,551,522,000
Shares 0 0 0 0 0 0 0
Reserve 0 0 0 0 0 0 0
Donation and grant 0 58,477,000 0 58,477,000 2,828,302,000 0 2,828,302,000
Retained earning prior period,
others* 0 1,037,000 0 1,037,000 659,989,000 0 659,989,000
Dividend Payment 0 0 0 0 -168,207,000 0 -168,207,000
Profit/Loss of current year 0 -25,676,000 0 -25,676,000 289,473,000 0 289,473,000
Total Equity 0 33,838,000 0 33,838,000 3,609,557,000 0 3,609,557,000
Total Liability and Equity 0 265,682,000 0 265,682,000 5,161,079,000 0 5,161,079,000
Note: * Additional capital, dividend declared

52
7. Xayabuly Province
JANUARY- DECEMBER 2009
Capital: Xayabuly
Population: 367,421 people
Area: 16,389 Km2
Density: 22 people/Km2
Number of Villages: 447 Villages
Number of Household: 67,003
Households
Districts: Xayabouly, Khop, Hongsa,
Ngeun, Xienghone, Phiang, Parklai, Kenethao, Botene, Thongmysay and Xaysathan.
Source: Statistical Year book 2009 (Lao Department of Statistics, MPI)
Microfinance in Sayaboury dates back to 1997 when it was introduced by the microfinance office
under the supervision of the Provincial Financial Department. As of 2009, there are 3 NDTMFIs,
namely Sayabouri Microfinance Office, Khop Community Credit and Savings Association and
Hongsa Community Credit and Savings Association, the latter two supported by GIZ 39. In addition,
there are 281 deposit-taking and 22 non-deposit-taking village funds, most of them under the
supervision of the Lao Women Unions and Poverty Eradication and Rural Development offices in
partnership with ACCU and IFAD. In all there are 30,295 microfinance members/clients, about half
of them active borrowers a with a total amount of outstanding loan of 4.1 billion kip.
Table 1: Financial Support
Regulated MFIs
VFs
DTMFIs NDTMFIs SCUs total
Saving and Credit Credit only total
Total amount of financial supports 0 798,466,000 0 798,466,000 3,875,495,000 90,000,000 3,965,495,000
Loans 0 0 0 0 165,900,000 0 165,900,000
Grants 0 798,466,000 0 798,466,000 3,709,595,000 90,000,000 3,799,595,000
Table 2: Coverage of Villages and Members/Clients
Regulated MFIs
VFs
DTMFIs NDTMFIs SCUs total
Saving and Credit Credit only total
No. of Entity 0 3 0 3 0 0 0
No. of village coverage 0 110 0 110 0 0 0
No. of VFs 0 0 0 0 281 22 303
Percent 0% 100% 0% 100% 93% 7% 100%
membrs/clients 0 7,364 0 7,364 22,735 196 22,931
Percent 0% 100% 0% 100% 99% 1% 100%
Average no. of members per entities 0 2,455 0 2,455 81 9 76
39
In 2009 the two NDTMFIs acted as network support organizations for some 80 VFs. Due to flaws in data collection and processing these VF are not mentioned in the VF sections but under the information for the NDTMFIs.

53
Table 3: Credit Information
Regulated MFIs
VFs
DTMFIs NDTMFIs SCU total
Saving and Credit Credit only total
No. of Borrowers in the year 0 3,536 0 3,536 14,396 196 14,592
Percent 0% 100% 0% 100% 99% 1% 100%
Average no. of Borrower per entity 0 1,179 0 1,179
51 9 48
Total Amount of Laon Outstanding 0 3,008,495,000 0 3,008,495,000
1,824,407,000 929,664,000 2,754,071,000
Percent 0% 100% 0% 100% 66% 34% 100%
Average loan outstanding per entity 0 1,002,832,000 0 1,002,832,000
6,493,000 42,257,000 9,089,000
Average loan size per borrower 0 960,000 0 960,000 1,268,000 4,743,000 1,315,000
Table 4: Loan Usage – Amount Loaned (Kip)
Regulated MFIs
VFs with
DTMFIs NDTMFIs SCU total
Saving and Credit Credit only total
Agricultures and Livestock 0 1,210,497,000 0 1,210,497,000 13,947,147,000 929,664,000 14,876,811,000
Trade and Services 0 484,354,000 0 484,354,000 2,740,139,000 0 2,740,139,000
Handicraft 0 700,370,000 0 700,370,000 751,779,000 0 751,779,000
Emergency 0 22,899,000 0 22,899,000 509,043,000 0 509,043,000
Other Purpose 0 976,276,000 0 976,276,000 311,066,000 0 311,066,000
Table 5: Saving Information
Regulated MFIs
VFs
DTMFIs NDTMFIs SCU total
Saving and Credit Credit only total
Number of savers 0 7,364 0 7,364 22,735 N/A N/A
Average no. of savers per entity 0 2,455 0 2,455 81 N/A N/A
Total amount of savings 0 1,543,779,000 0 1,543,779,000 14,140,791,000 N/A N/A
Average saving per entity 0 514,593,000 0 514,593,000 50,323,000 N/A N/A
Average savings size per member 0 210,000 0 210,000 622,000 N/A N/A

54
Table 6: Income Statement
Regulated MFIs VFs
Unit: kip DTMFIs NDTMFIs SCUs total Saving and Credit Credit only total
Interest Income 0 957,244,000 0 957,244,000 4,400,139,000 0 4,400,139,000
Other Income (e.g. fees, service charges) 0 141,251,000 0 141,251,000 41,932,000 0 41,932,000
Operating Expenses 0 992,106,000 0 992,106,000 205,616,000 0 205,616,000
Expenses for Village Development 0 11,321,000 0 11,321,000 238,770,000 0 238,770,000
Expenses for Social Welfare 0 5,561,000 0 5,561,000 595,492,000 0 595,492,000
Other Expenses (e.g. consultants, studies) 0 52,760,000 52,760,000 268,784,000 0 268,784,000
Total Operating Expenses 0 1,061,748,000 0 1,061,748,000 1,308,662,000 0 1,308,662,000
Net Operating Income/Loss 0 36,747,000 0 36,747,000 3,133,409,000 0 3,133,409,000
Loan Loss Provision/Reserves 0 13,500,000 0 13,500,000 111,742,000 0 111,742,000
Extraordinay Income (e.g. grants) 0 762,492,000 0 762,492,000 30,000,000 0 30,000,000
Net profit for the period 0 785,739,000 0 785,739,000 3,051,667,000 0 3,051,667,000
Table 7: Balance Sheet
Regulated MFIs VFs with
Unit: kip DTMFIs NDTMFIs SCUs total
Saving and
Credit Credit only total
Cash 0 1,191,465,000 0 1,191,465,000 16,134,070,000 0 16,134,070,000
Gross loan outstanding 0 3,008,495,000 0 3,008,495,000 1,824,407,000 929,664,000 2,754,071,000
Fixed and other assets 0 218,193,000 0 218,193,000 352,601,000 0 352,601,000
Total Asset 0 4,418,153,000 0 4,418,153,000 18,311,078,000 929,664,000 19,240,742,000
Saving deposits 0 1,543,779,000 0 1,543,779,000 14,140,791,000 0 14,140,791,000
Loan Recieved 0 0 0 0 301,165,000 0 301,165,000
Others (Unpaid dividend) 0 0 0 0 132,478,000 0 132,478,000
Total Liability 0 1,543,779,000 0 1,543,779,000 14,574,434,000 0 14,574,434,000
Shares 0 0 0 0 0 0 0
Reserve 0 1,558,901,000 0 1,558,901,000 49,975,000 0 49,975,000
Donation and grant 0 1,057,852,000 0 1,057,852,000 3,069,360,000 90,000,000 3,159,360,000
Retained earning prior period,
others* 0 101,859,000 0 101,859,000 547,020,000 839,664,000 1,386,684,000
Dividend Payment 0 -629,977,000 0 -629,977,000 -2,981,378,000 0 -2,981,378,000
Profit/Loss of current year 0 785,739,000 0 785,739,000 3,051,667,000 0 3,051,667,000
Total Equity 0 2,874,374,000 0 2,874,374,000 3,736,644,000 929,664,000 4,666,308,000
Total Liability and Equity 0 4,418,153,000 0 4,418,153,000 18,311,078,000 929,664,000 19,240,742,000
Note: * Additional capital, dividend declared

55
8. Vientiane Capital
JANUARY- DECEMBER 2009
Capital: Chanthabuly
Population: 754,384 people
Area: 3,920 km2
Density: 192 people/Km2
Number of Villages: 491 Villages
Number of Household: 130,470
Households
Districts: Chanthabuly,
Sikhottabong, Saysettha, Sisattanak, Nasiathong, Hadxaifong, Sangthong and
Parkgeum.
Source: Statistical Year book 2009 (Lao Department of Statistics, MPI)
Vientiane Capital is biggest center of microfinance activities in the Lao PDR, due to the high
population density as well as a high demand for financial services. There are 3 DTMFIs (Newton
MFI, Ekphatthana MFI and Lao Post MFI), 4 SCUs (Credit and Small Production Fund, Developme nt
Credit and Saving Cooperative, Mittaphap Credit and Saving Cooperative and Naxaithong Rural
Development Cooperative) and about 789 VFs. The main village fund promoters is the Lao Women
Union. In 2009 there are about 160,000 members or clients, a third of which are active borrowers,
with total outstanding loans of about 158 billion kip.
Table 1: Financial Support
Regulated MFIs
VFs
DTMFIs NDTMFIs SCUs total
Saving and Credit Credit only total
Total amount of financial supports 1,185,832,000 0 5,669,328,000 6,855,160,000 842,885,000 250,000,000 1,092,885,000
Loans 783,832,000 0 5,543,300,000 6,327,132,000 0 250,000,000 250,000,000
Grants 402,000,000 0 126,028,000 528,028,000 842,885,000 0 842,885,000
Table 2: Coverage of Villages and Members/Clients
Regulated MFIs
VFs
DTMFIs NDTMFIs SCUs total
Saving and Credit Credit only total
No. of Entity 3 0 4 7 0 0 0
No. of villages coverage 371 0 452 823 0 0 0
No. of VFs 0 0 0 0 750 39 789
Percent 45% 0% 55% 100% 95% 5% 100%
members/clients 24,739 0 6,177 30,916 128,839 140 128,979
Percent 80% 0% 20% 100% 100% 0% 100%
Average no. of members per entities 8,246 0 1,544 4,417 172 4 163
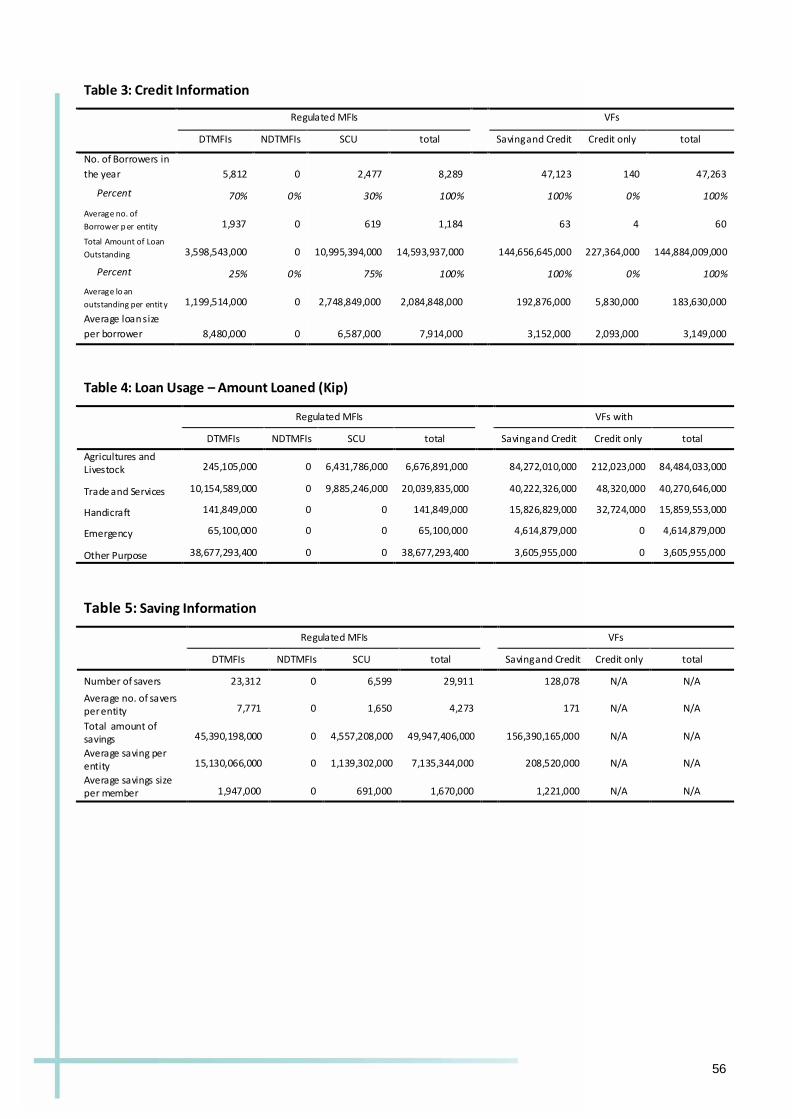
56
Table 3: Credit Information
Regulated MFIs
VFs
DTMFIs NDTMFIs SCU total
Saving and Credit Credit only total
No. of Borrowers in
the year 5,812 0 2,477 8,289 47,123 140 47,263
Percent 70% 0% 30% 100% 100% 0% 100%
Average no. of
Borrower p er entity 1,937 0 619 1,184
63 4 60
Total Amount of Loan
Outstanding 3,598,543,000 0 10,995,394,000 14,593,937,000
144,656,645,000 227,364,000 144,884,009,000
Percent 25% 0% 75% 100% 100% 0% 100%
Average lo an
outstanding per entity 1,199,514,000 0 2,748,849,000 2,084,848,000
192,876,000 5,830,000 183,630,000
Average loan size
per borrower 8,480,000 0 6,587,000 7,914,000 3,152,000 2,093,000 3,149,000
Table 4: Loan Usage – Amount Loaned (Kip)
Regulated MFIs
VFs with
DTMFIs NDTMFIs SCU total
Saving and Credit Credit only total
Agricultures and Livestock 245,105,000 0 6,431,786,000 6,676,891,000 84,272,010,000 212,023,000 84,484,033,000
Trade and Services 10,154,589,000 0 9,885,246,000 20,039,835,000 40,222,326,000 48,320,000 40,270,646,000
Handicraft 141,849,000 0 0 141,849,000 15,826,829,000 32,724,000 15,859,553,000
Emergency 65,100,000 0 0 65,100,000 4,614,879,000 0 4,614,879,000
Other Purpose 38,677,293,400 0 0 38,677,293,400 3,605,955,000 0 3,605,955,000
Table 5: Saving Information
Regulated MFIs
VFs
DTMFIs NDTMFIs SCU total
Saving and Credit Credit only total
Number of savers 23,312 0 6,599 29,911 128,078 N/A N/A
Average no. of savers per entity 7,771 0 1,650 4,273 171 N/A N/A
Total amount of savings 45,390,198,000 0 4,557,208,000 49,947,406,000 156,390,165,000 N/A N/A
Average saving per entity 15,130,066,000 0 1,139,302,000 7,135,344,000 208,520,000 N/A N/A
Average savings size per member 1,947,000 0 691,000 1,670,000 1,221,000 N/A N/A

57
Table 6: Income Statement
Regulated MFIs VFs
Unit: kip DTMFIs NDTMFIs SCUs total Saving and Credit Credit only total
Interest Income 5,488,792,000 0 2,527,667,000 8,016,459,000 33,523,264,000 26,844,000 33,550,108,000
Other Income (e.g. fees, service charges) 1,978,620,000 0 69,211,000 2,047,831,000 1,478,425,000 0 1,478,425,000
Operating Expenses 5,852,298,000 0 3,103,300,000 8,955,598,000 773,973,000 20,703,000 794,676,000
Expenses for Village Development 0 0 0 0 1,479,666,000 0 1,479,666,000
Expenses for Social Welfare 0 0 0 0 1,330,407,000 0 1,330,407,000
Other Expenses (e.g. consultants, studies) 0 0 30,000,000 30,000,000 1,315,297,000 3,841,000 1,319,138,000
Total Operating Expenses 5,852,298,000 0 3,133,300,000 8,985,598,000 4,899,343,000 24,544,000 4,923,887,000
Net Operating Income/Loss 1,615,114,000 0 -536,422,000 1,078,692,000 30,102,346,000 2,300,000 30,104,646,000
Loan Loss Provision/Reserves 0 0 0 0 1,392,874,000 0 1,392,874,000
Extraordinay Income (e.g. grants) 80,996,000 0 86,028,000 167,024,000 28,000,000 0 28,000,000
Net profit for the period 1,696,110,000 0 -450,394,000 1,245,716,000 28,737,472,000 2,300,000 28,739,772,000
Table 7: Balance Sheet
Regulated MFIs VFs with
Unit: kip DTMFIs NDTMFIs SCUs total
Saving and
Credit Credit only total
Cash 56,597,169,000 0 762,174,000 57,359,343,000 31,132,117,000 152,024,000 31,284,141,000
Gross loan
outstanding 3,598,543,000 0 10,995,394,000 14,593,937,000 144,656,645,000 227,364,000 144,884,009,000
Fixed and other
assets 2,627,259,000 0 4,820,183,000 7,447,442,000 3,332,786,000 16,766,000 3,349,552,000
Total Asset 62,822,971,000 0 16,577,751,000 79,400,722,000 179,121,548,000 396,154,000 179,517,702,000
Saving deposits 45,390,198,000 0 4,557,208,000 49,947,406,000 156,390,165,000 0 156,390,165,000
Loan Recieved 835,566,000 0 5,543,300,000 6,378,866,000 0 200,000,000 200,000,000
Others (Unpaid
dividend) 1,326,486,000 0 183,601,000 1,510,087,000 243,921,000 53,625,000 297,546,000
Total Liability 47,552,250,000 0 10,284,109,000 57,836,359,000 156,634,086,000 253,625,000 156,887,711,000
Shares 2,080,000,000 0 3,852,900,000 5,932,900,000 828,430,000 0 828,430,000
Reserve 2,702,577,000 0 94,681,000 2,797,258,000 3,826,337,000 0 3,826,337,000
Donation and
grant 0 0 126,028,000 126,028,000 842,885,000 0 842,885,000
Retained earning
prior period,
others* 8,792,034,000 0 2,891,427,000 11,683,461,000 16,299,046,000 140,729,000 16,439,775,000
Dividend Payment 0 0 -221,000,000 -221,000,000 -28,046,708,000 -500,000 -28,047,208,000
Profit/Loss of
current year 1,696,110,000 0 -450,394,000 1,245,716,000 28,737,472,000 2,300,000 28,739,772,000
Total Equity 15,270,721,000 0 6,293,642,000 21,564,363,000 22,487,462,000 142,529,000 22,629,991,000
Total Liability and
Equity 62,822,971,000 0 16,577,751,000 79,400,722,000 179,121,548,000 396,154,000 179,517,702,000
Note: * Additional capital, dividend declared

58
9. Xiengkhuang Province
JANUARY- DECEMBER 2009
Capital: Pek
Population: 236,697 people
Area: 16,358 Km2
Density: 16 people/Km2
Number of Villages: 509 Villages
Number of Household: 40,439 Households
Districts: Pek, Kham, Nonghed, Khoune,
Morkmai, Phookood, Phaxay and Thathom.
Source: Statistical Year book 2009 (Lao Department of Statistics, MPI)
There are only VFs and no regulated MFIs in Xiengkhuang province. Promotion of VFs in the
province was initiated by the Government in 2002. As of 2009, there are 157 village funds with a
total of 6,211 members/clients, or 70 members per village fund on average. There are 4,412
borrowers with 4.4 billion kip of outstanding loans. Key promoters are the Lao Women Union,
Poverty Eradication and Rural Development Offices, agriculture and foresty offices of Pek District
and Xiengkhoung Provincial Consolidation Front Organisation. In addition, VFs are promoted by
the Lao Red Cross and IFAD.
Table 1: Financial Support
Regulated MFIs
VFs
DTMFIs NDTMFIs SCU total
Saving andCredit Credit only total
Total amount of financial supports 0 0 0 0 3,925,076,000 571,000,000 4,496,076,000
Loans 0 0 0 0 0 0 0
Grants 0 0 0 0 3,925,076,000 571,000,000 4,496,076,000
Table 2: Coverage of Villages and Members/Clients
Regulated MFIs
VFs
DTMFIs NDTMFIs SCUs total
Saving and Credit Credit only total
No. of Entity 0 0 0 0 0 0 0
No. of villages coverage 0 0 0 0 0 0 0
No. of VFs 0 0 0 0 96 61 157
Percent 0% 0% 0% 0% 61% 39% 100%
members/clients 0 0 0 0 5,406 805 6,211
Percent 0% 0% 0% 0% 87% 13% 100%
Average no. of members per entities 0 0 0 0 56 13 40
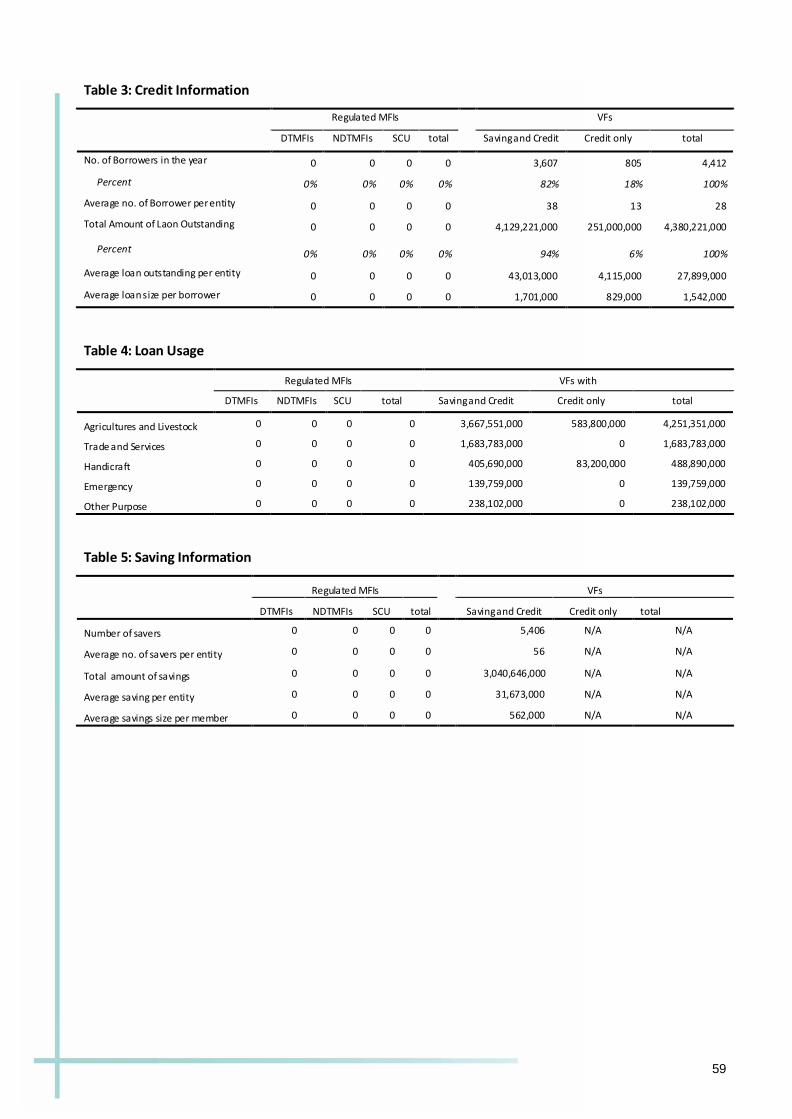
59
Table 3: Credit Information
Regulated MFIs
VFs
DTMFIs NDTMFIs SCU total
Saving and Credit Credit only total
No. of Borrowers in the year 0 0 0 0 3,607 805 4,412
Percent 0% 0% 0% 0% 82% 18% 100%
Average no. of Borrower per entity 0 0 0 0
38 13 28
Total Amount of Laon Outstanding 0 0 0 0
4,129,221,000 251,000,000 4,380,221,000
Percent 0% 0% 0% 0% 94% 6% 100%
Average loan outstanding per entity 0 0 0 0
43,013,000 4,115,000 27,899,000
Average loan size per borrower 0 0 0 0 1,701,000 829,000 1,542,000
Table 4: Loan Usage
Regulated MFIs VFs with
DTMFIs NDTMFIs SCU total Saving and Credit Credit only total
Agricultures and Livestock 0 0 0 0 3,667,551,000 583,800,000 4,251,351,000
Trade and Services 0 0 0 0 1,683,783,000 0 1,683,783,000
Handicraft 0 0 0 0 405,690,000 83,200,000 488,890,000
Emergency 0 0 0 0 139,759,000 0 139,759,000
Other Purpose 0 0 0 0 238,102,000 0 238,102,000
Table 5: Saving Information
Regulated MFIs
VFs
DTMFIs NDTMFIs SCU total
Saving and Credit Credit only total
Number of savers 0 0 0 0 5,406 N/A N/A
Average no. of savers per entity 0 0 0 0 56 N/A N/A
Total amount of savings 0 0 0 0 3,040,646,000 N/A N/A
Average saving per entity 0 0 0 0 31,673,000 N/A N/A
Average savings size per member 0 0 0 0 562,000 N/A N/A
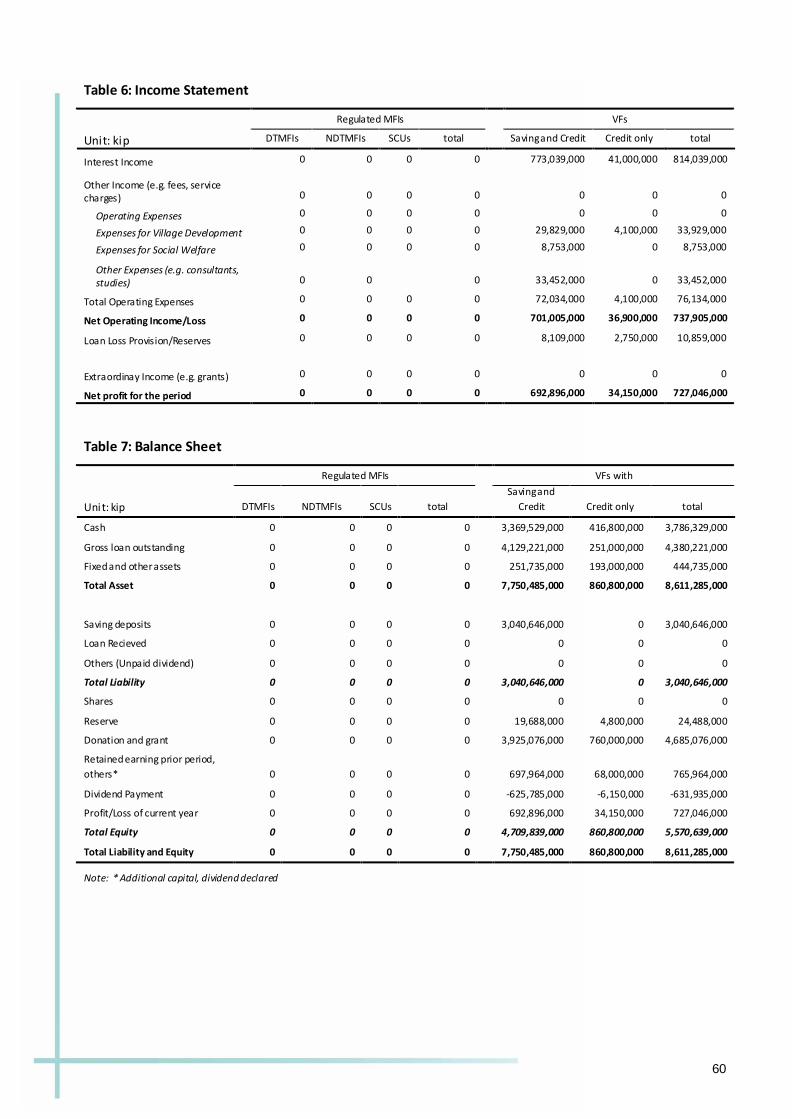
60
Table 6: Income Statement
Regulated MFIs VFs
Unit: kip DTMFIs NDTMFIs SCUs total Saving and Credit Credit only total
Interest Income 0 0 0 0 773,039,000 41,000,000 814,039,000
Other Income (e.g. fees, service charges) 0 0 0 0 0 0 0
Operating Expenses 0 0 0 0 0 0 0
Expenses for Village Development 0 0 0 0 29,829,000 4,100,000 33,929,000
Expenses for Social Welfare 0 0 0 0 8,753,000 0 8,753,000
Other Expenses (e.g. consultants, studies) 0 0 0 33,452,000 0 33,452,000
Total Operating Expenses 0 0 0 0 72,034,000 4,100,000 76,134,000
Net Operating Income/Loss 0 0 0 0 701,005,000 36,900,000 737,905,000
Loan Loss Provision/Reserves 0 0 0 0 8,109,000 2,750,000 10,859,000
Extraordinay Income (e.g. grants) 0 0 0 0 0 0 0
Net profit for the period 0 0 0 0 692,896,000 34,150,000 727,046,000
Table 7: Balance Sheet
Regulated MFIs VFs with
Unit: kip DTMFIs NDTMFIs SCUs total
Saving and
Credit Credit only total
Cash 0 0 0 0 3,369,529,000 416,800,000 3,786,329,000
Gross loan outstanding 0 0 0 0 4,129,221,000 251,000,000 4,380,221,000
Fixed and other assets 0 0 0 0 251,735,000 193,000,000 444,735,000
Total Asset 0 0 0 0 7,750,485,000 860,800,000 8,611,285,000
Saving deposits 0 0 0 0 3,040,646,000 0 3,040,646,000
Loan Recieved 0 0 0 0 0 0 0
Others (Unpaid dividend) 0 0 0 0 0 0 0
Total Liability 0 0 0 0 3,040,646,000 0 3,040,646,000
Shares 0 0 0 0 0 0 0
Reserve 0 0 0 0 19,688,000 4,800,000 24,488,000
Donation and grant 0 0 0 0 3,925,076,000 760,000,000 4,685,076,000
Retained earning prior period,
others* 0 0 0 0 697,964,000 68,000,000 765,964,000
Dividend Payment 0 0 0 0 -625,785,000 -6,150,000 -631,935,000
Profit/Loss of current year 0 0 0 0 692,896,000 34,150,000 727,046,000
Total Equity 0 0 0 0 4,709,839,000 860,800,000 5,570,639,000
Total Liability and Equity 0 0 0 0 7,750,485,000 860,800,000 8,611,285,000
Note: * Additional capital, dividend declared

61
10. Vientiane Province
JANUARY- DECEMBER 2009
Capital: Phonhong
Population: 467,452 people
Area: 22.554 Km2
Density: 21 people/Km2
Number of Villages: 518 Villages
Number of Household: 84,091 Households
Districts: Phonhong, Thoulakhom, Keo oudom, Kasy, Vangvieng, Feuang,
Xanakharm, Mad, Viengkham, Hinherb, Hom, Xaysomboon and Meun.
Source: Statistical Year book 2009 (Lao Department of Statistics, MPI)
Vientiane province is one of largest provinces in Lao PDR, including 149 poor villages and 7,149
households.40 The provincial government recognizes that microfinance is an important tool for
poverty reduction and has actively supported the growth of microfinance. As of 2009, there are 2
SCUs and 1 NDTMFI (Vientiane Credit and Saving Union, Thoulakhom Credit and Saving Union and
NDTMFI Hom District). In addition, there are 247 village funds. Together these institutions have
28,806 members, including 19,082 borrowers with a total loans outstanding of 7.4 billion Kip.
Total assets amount to almost 31 billion kip. The main promoter is the Lao Women Union in
partnership with FIAM and UNESCAP.
Table 1: Financial Support
Regulated MFIs
VFs
DTMFIs NDTMFIs SCU total
Saving and Credit Credit only total
Total amount of financial supports 0 80,000,000 208,474,000 288,474,000 2,821,686,000 126,000,000 2,947,686,000
Loans 0 0 0 0 0 0 0
Grants 0 80,000,000 208,474,000 288,474,000 2,821,686,000 126,000,000 2,947,686,000
Table 2: Coverage of Villages and Members/Clients
Regulated MFIs
VFs
DTMFIs NDTMFIs SCU total
Saving and Credit Credit only total
No. of Entity 0 1 2 3 0 0 0
No. of village coverage 0 7 27 34 0 0 0
No. of VFs 0 0 0 0 215 32 247
Percent 0% 21% 79% 100% 87% 13% 100%
members/clients 0 321 1,087 1,408 27,124 274 27,398
Percent 0% 23% 77% 100% 99% 1% 100%
Average no. of members per entities 0 321 544 469 126 9 111
40
Report on the Implementation of the poverty eradication plan for 2006-2007 and focus work plan for 2007-2008 of Vientiane Province (Vientiane Planning and Investment Department, 2007)

62
Table 3: Credit Information
Regulated MFIs
VFs
DTMFIs NDTMFIs SCU total
Saving and Credit Credit only total
No. of Borrowers in the year 0 241 162 403 18,405 274 18,679
Percent 0% 60% 40% 100% 99% 1% 100%
Average no. of Borrower per
entity 0 241 81 134
86 9 76
Total Amount of Laon
Outstanding 0 268,134,000 475,725,000 743,859,000
6,558,322,000 73,000,000 6,631,322,000
Percent 0% 36% 64% 100% 99% 1% 100%
Average loan outstanding per
entity 0 268,134,000 237,863,000 247,953,000
30,504,000 2,281,000 26,847,000
Average loan size per borrower 0 1,311,000 3,208,000 2,074,000 1,425,000 556,000 1,412,000
Table 4: Loan Usage
Regulated MFIs
VFs with
DTMFIs NDTMFIs SCU total
Saving and Credit Credit only total
Agricultures and Livestock 0 187,694,000 185,509,000 373,203,000 18,817,876,000 130,400,000 18,948,276,000
Trade and Services 0 80,440,000 302,554,000 382,994,000 4,955,423,000 9,960,000 4,965,383,000
Handicraft 0 47,872,000 31,658,000 79,530,000 2,101,853,000 12,000,000 2,113,853,000
Emergency 0 0 0 0 341,621,000 0 341,621,000
Other Purpose 0 0 0 0 1,520,000 0 1,520,000
Table 5: Saving Information
Regulated MFIs
VFs
DTMFIs NDTMFIs SCU total
Saving and Credit Credit only total
Number of savers 0 107 573 680 27,031 N/A N/A
Average no. of savers per entity 0 107 287 227 126 N/A N/A
Total amount of savings 0 41,829,000 428,459,000 470,288,000 21,429,814,000 N/A N/A
Average saving per entity 0 41,829,000 214,230,000 156,763,000 99,674,000 N/A N/A
Average savings size per member 0 391,000 748,000 692,000 793,000 N/A N/A

63
Table 6: Income Statement
Regulated MFIs VFs
Unit: kip DTMFIs NDTMFIs SCUs total Saving and Credit Credit only total
Interest Income 0 7,728,000 202,075,000 209,803,000 5,165,606,000 12,436,000 5,178,042,000
Other Income (e.g. fees, service charges) 0 0 51,768,000 51,768,000 42,529,000 0 42,529,000
Operating Expenses 0 161,147,000 322,891,000 484,038,000 302,208,000 7,000,000 309,208,000
Expenses for Village Development 0 0 0 0 309,341,000 3,891,000 313,232,000
Expenses for Social Welfare 0 0 0 0 263,484,000 0 263,484,000
Other Expenses (e.g. consultants, studies) 0 0 0 0 258,414,000 2,130,000 260,544,000
Total Operating Expenses 0 161,147,000 322,891,000 484,038,000 1,133,447,000 13,021,000 1,146,468,000
Net Operating Income/Loss 0 -153,419,000 -69,048,000 -222,467,000 4,074,688,000 -585,000 4,074,103,000
Loan Loss Provision/Reserves 0 0 9,976,000 9,976,000 302,144,000 0 302,144,000
Extraordinay Income (e.g. grants) 0 8,000,000 33,600,000 41,600,000 82,750,000 7,000,000 89,750,000
Net profit for the period 0 -145,419,000 -45,424,000 -190,843,000 3,855,294,000 6,415,000 3,861,709,000
Table 7: Balance Sheet
Regulated MFIs VFs with
Unit: kip DTMFIs NDTMFIs SCUs total
Saving and
Credit Credit only total
Cash 0 171,065,000 369,834,000 540,899,000 6,256,708,000 89,741,000 6,346,449,000
Gross loan outstanding 0 268,134,000 475,725,000 743,859,000 6,558,322,000 73,000,000 6,631,322,000
Fixed and other assets 0 0 419,045,000 419,045,000 16,099,471,000 2,030,000 16,101,501,000
Total Asset 0 439,199,000 1,264,604,000 1,703,803,000 28,914,501,000 164,771,000 29,079,272,000
Saving deposits 0 41,829,000 428,459,000 470,288,000 21,429,814,000 0 21,429,814,000
Loan Recieved 0 0 0 0 31,532,000 0 31,532,000
Others (Unpaid dividend) 0 0 120,882,000 120,882,000 379,363,000 0 379,363,000
Total Liability 0 41,829,000 549,341,000 591,170,000 21,840,709,000 0 21,840,709,000
Shares 0 290,000,000 438,532,000 728,532,000 0 0 0
Reserve 0 0 9,976,000 9,976,000 173,269,000 0 173,269,000
Donation and grant 0 80,000,000 210,721,000 290,721,000 3,786,474,000 147,000,000 3,933,474,000
Retained earning prior
period, others* 0 172,789,000 101,458,000 274,247,000 2,927,272,000 15,358,000 2,942,630,000
Dividend Payment 0 0 0 0 -3,668,517,000 -4,002,000 -3,672,519,000
Profit/Loss of current year 0 -145,419,000 -45,424,000 -190,843,000 3,855,294,000 6,415,000 3,861,709,000
Total Equity 0 397,370,000 715,263,000 1,112,633,000 7,073,792,000 164,771,000 7,238,563,000
Total Liability and Equity 0 439,199,000 1,264,604,000 1,703,803,000 28,914,501,000 164,771,000 29,079,272,000
Note: * Additional capital, dividend declared
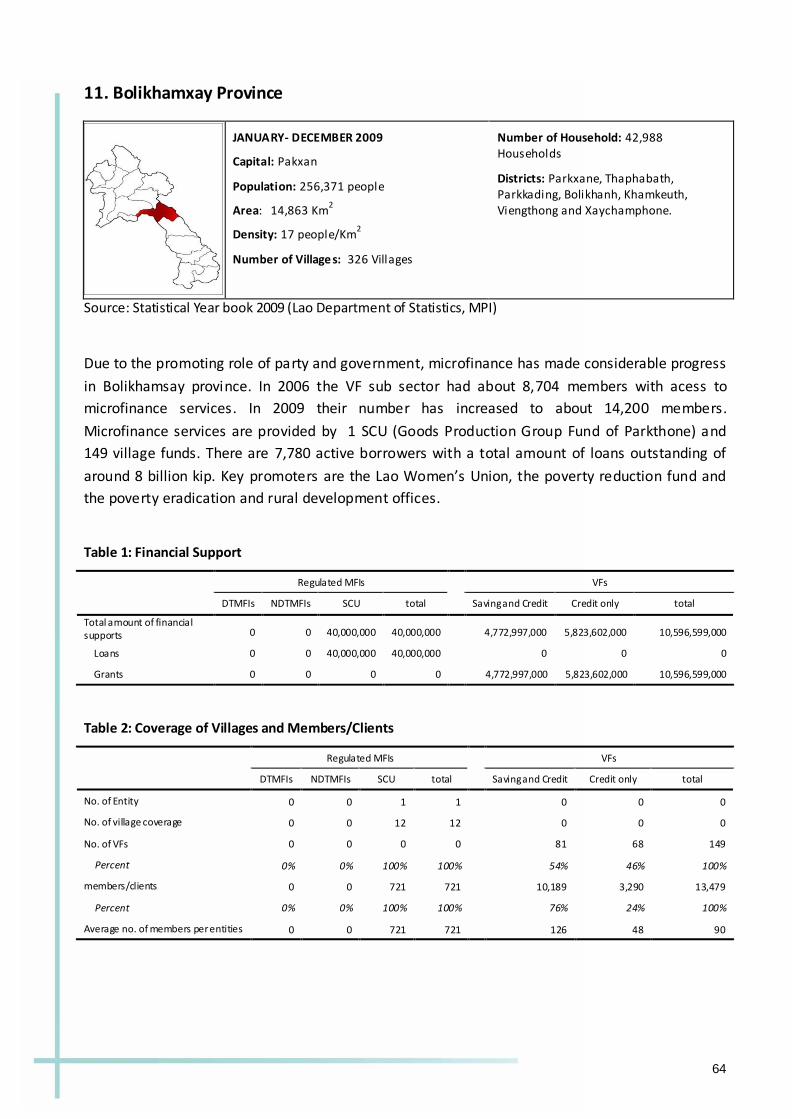
64
11. Bolikhamxay Province
JANUARY- DECEMBER 2009
Capital: Pakxan
Population: 256,371 people
Area: 14,863 Km2
Density: 17 people/Km2
Number of Villages: 326 Villages
Number of Household: 42,988 Households
Districts: Parkxane, Thaphabath, Parkkading, Bolikhanh, Khamkeuth, Viengthong and Xaychamphone.
Source: Statistical Year book 2009 (Lao Department of Statistics, MPI)
Due to the promoting role of party and government, microfinance has made considerable progress
in Bolikhamsay province. In 2006 the VF sub sector had about 8,704 members with acess to
microfinance services. In 2009 their number has increased to about 14,200 members.
Microfinance services are provided by 1 SCU (Goods Production Group Fund of Parkthone) and
149 village funds. There are 7,780 active borrowers with a total amount of loans outstanding of
around 8 billion kip. Key promoters are the Lao Women’s Union, the poverty reduction fund and
the poverty eradication and rural development offices.
Table 1: Financial Support
Regulated MFIs
VFs
DTMFIs NDTMFIs SCU total
Saving and Credit Credit only total
Total amount of financial supports 0 0 40,000,000 40,000,000 4,772,997,000 5,823,602,000 10,596,599,000
Loans 0 0 40,000,000 40,000,000 0 0 0
Grants 0 0 0 0 4,772,997,000 5,823,602,000 10,596,599,000
Table 2: Coverage of Villages and Members/Clients
Regulated MFIs
VFs
DTMFIs NDTMFIs SCU total
Saving and Credit Credit only total
No. of Entity 0 0 1 1 0 0 0
No. of village coverage 0 0 12 12 0 0 0
No. of VFs 0 0 0 0 81 68 149
Percent 0% 0% 100% 100% 54% 46% 100%
members/clients 0 0 721 721 10,189 3,290 13,479
Percent 0% 0% 100% 100% 76% 24% 100%
Average no. of members per entities 0 0 721 721 126 48 90
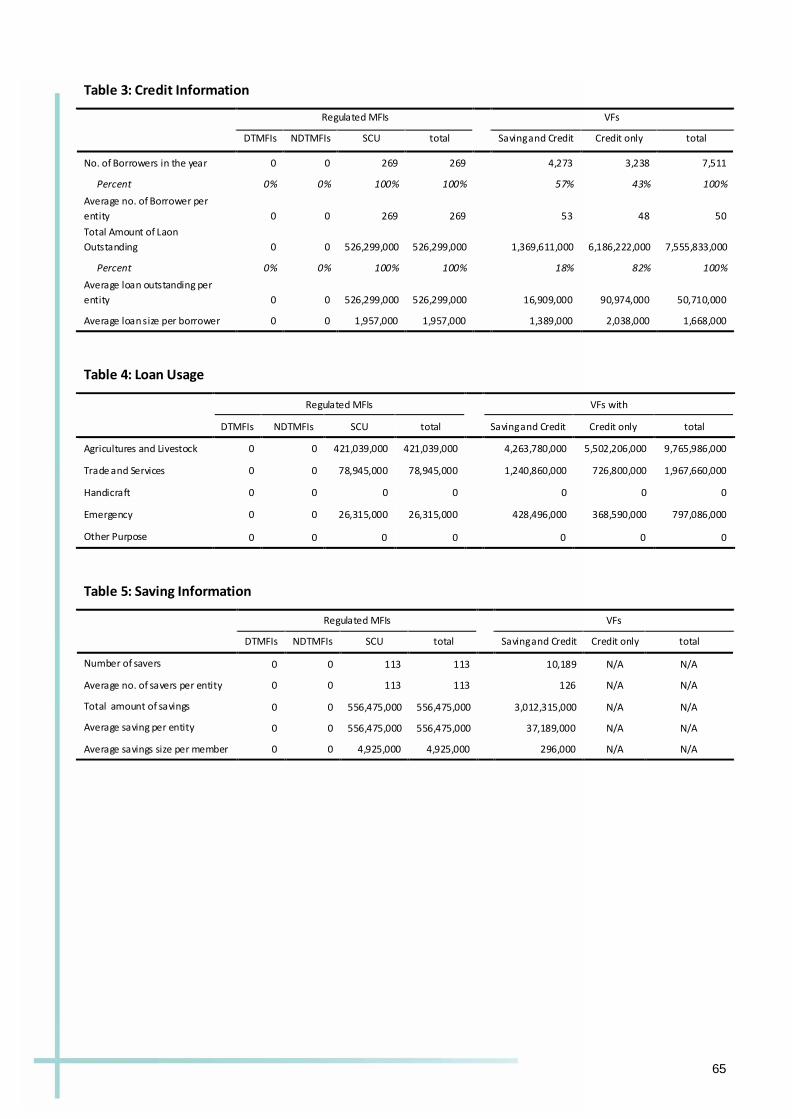
65
Table 3: Credit Information
Regulated MFIs
VFs
DTMFIs NDTMFIs SCU total
Saving and Credit Credit only total
No. of Borrowers in the year 0 0 269 269 4,273 3,238 7,511
Percent 0% 0% 100% 100% 57% 43% 100%
Average no. of Borrower per
entity 0 0 269 269
53 48 50
Total Amount of Laon
Outstanding 0 0 526,299,000 526,299,000
1,369,611,000 6,186,222,000 7,555,833,000
Percent 0% 0% 100% 100% 18% 82% 100%
Average loan outstanding per
entity 0 0 526,299,000 526,299,000
16,909,000 90,974,000 50,710,000
Average loan size per borrower 0 0 1,957,000 1,957,000 1,389,000 2,038,000 1,668,000
Table 4: Loan Usage
Regulated MFIs
VFs with
DTMFIs NDTMFIs SCU total
Saving and Credit Credit only total
Agricultures and Livestock 0 0 421,039,000 421,039,000 4,263,780,000 5,502,206,000 9,765,986,000
Trade and Services 0 0 78,945,000 78,945,000 1,240,860,000 726,800,000 1,967,660,000
Handicraft 0 0 0 0 0 0 0
Emergency 0 0 26,315,000 26,315,000 428,496,000 368,590,000 797,086,000
Other Purpose 0 0 0 0 0 0 0
Table 5: Saving Information
Regulated MFIs
VFs
DTMFIs NDTMFIs SCU total
Saving and Credit Credit only total
Number of savers 0 0 113 113 10,189 N/A N/A
Average no. of savers per entity 0 0 113 113 126 N/A N/A
Total amount of savings 0 0 556,475,000 556,475,000 3,012,315,000 N/A N/A
Average saving per entity 0 0 556,475,000 556,475,000 37,189,000 N/A N/A
Average savings size per member 0 0 4,925,000 4,925,000 296,000 N/A N/A

66
Table 6: Income Statement
Regulated MFIs VFs
Unit: kip DTMFIs NDTMFIs SCUs total Saving and Credit Credit only total
Interest Income 0 0 87,749,000 87,749,000 1,569,630,000 396,085,000 1,965,715,000
Other Income (e.g. fees, service charges) 0 0 0 0 0 2,175,000 2,175,000
Operating Expenses 0 0 47,595,000 47,595,000 24,572,000 0 24,572,000
Expenses for Village Development 0 0 0 0 24,481,000 8,829,000 33,310,000
Expenses for Social Welfare 0 0 0 0 177,594,000 27,494,000 205,088,000
Other Expenses (e.g. consultants, studies) 0 0 18,291,000 18,291,000 243,749,000 109,992,000 353,741,000
Total Operating Expenses 0 0 65,886,000 65,886,000 470,396,000 146,315,000 616,711,000
Net Operating Income/Loss 0 0 21,863,000 21,863,000 1,099,234,000 251,945,000 1,351,179,000
Loan Loss Provision/Reserves 0 0 0 0 29,377,000 117,297,000 146,674,000
Extraordinay Income (e.g. grants) 0 0 3,526,000 3,526,000 0 0 0
Net profit for the period 0 0 25,389,000 25,389,000 1,069,857,000 134,648,000 1,204,505,000
Table 7: Balance Sheet
Regulated MFIs VFs with
Unit: kip DTMFIs NDTMFIs SCUs total
Saving and
Credit Credit only total
Cash 0 0 243,676,000 243,676,000 6,569,999,000 512,741,000 7,082,740,000
Gross loan outstanding 0 0 526,299,000 526,299,000 1,369,611,000 6,186,222,000 7,555,833,000
Fixed and other assets 0 0 0 0 310,580,000 0 310,580,000
Total Asset 0 0 769,975,000 769,975,000 8,250,190,000 6,698,963,000 14,949,153,000
Saving deposits 0 0 556,475,000 556,475,000 3,012,315,000 0 3,012,315,000
Loan Recieved 0 0 40,000,000 40,000,000 0 0 0
Others (Unpaid dividend) 0 0 0 0 0 0 0
Total Liability 0 0 596,475,000 596,475,000 3,012,315,000 0 3,012,315,000
Shares 0 0 156,500,000 156,500,000 0 0 0
Reserve 0 0 0 0 29,377,000 117,297,000 146,674,000
Donation and grant 0 0 0 0 4,772,997,000 5,823,602,000 10,596,599,000
Retained earning prior period,
others* 0 0 17,000,000 17,000,000 306,678,000 672,798,000 979,476,000
Dividend Payment 0 0 -25,389,000 -25,389,000 -941,034,000 -49,382,000 -990,416,000
Profit/Loss of current year 0 0 25,389,000 25,389,000 1,069,857,000 134,648,000 1,204,505,000
Total Equity 0 0 173,500,000 173,500,000 5,237,875,000 6,698,963,000 11,936,838,000
Total Liability and Equity 0 0 769,975,000 769,975,000 8,250,190,000 6,698,963,000 14,949,153,000
Note: * Additional capital, dividend declared

67
12. Khammuane Province
JANUARY- DECEMBER 2009
Capital: Thakhek
Population: 367,904 people
Area: 16,315 Km2
Density: 23 people/Km2
Number of Villages: 590 Villages
Number of Household: 66,776 Households
Districts: Thakhek, Mahasay, Nongbok, Hinboon, Nhommalath, Bualapha, Nakai,
Xebangfay and Xaybuathong.
Source: Statistical Year book 2009 (Lao Department of Statistics, MPI)
The government of Khammoune province is actively involved in the development of microfinance.
There are 1 SCU (Thakhek Credit and Saving Cooperative) and 340 village funds. In 2009 there
were 15,603 borrowers with a loan portfolio of 20.85 billion kip. Promooters include Lao Front,
Labour and SocialWelfare, Construction and Rural Development Offices and Lao Women Union.
Table 1: Financial Support
Regulated MFIs
VFs
DTMFIs NDTMFIs SCU total
Saving and Credit Credit only total
Total amount of financial supports 0 0 122,352,000 122,352,000 6,463,377,000 6,171,034,000 12,634,411,000
Loans 0 0 0 0 0 17,923,000 17,923,000
Grants 0 0 122,352,000 122,352,000 6,463,377,000 6,153,111,000 12,616,488,000
Table 2: Coverage of Villages and Members/Clients
Regulated MFIs
VFs
DTMFIs NDTMFIs SCU total
Saving and Credit Credit only total
No. of Entity 0 0 1 1 0 0 0
No. of village coverage 0 0 33 33 0 0 0
No. of VFs 0 0 0 0 293 47 340
Percent 0% 0% 100% 100% 86% 14% 100%
members/clients 0 0 537 537 25,902 2,752 28,654
Percent 0% 0% 100% 100% 90% 10% 100%
Average no. of members per entities 0 0 537 537 88 59 84

68
Table 3: Credit Information
Regulated MFIs
VFs
DTMFIs NDTMFIs SCU total
Saving and Credit Credit only total
No. of Borrowers in the year 0 0 128 128 12,723 2,752 15,475
Percent 0% 0% 100% 100% 82% 18% 100%
Average no. of Borrower per
entity 0 0 128 128
43 59 46
Total Amount of Laon
Outstanding 0 0 405,220,000 405,220,000
16,819,122,000 3,719,160,000 20,538,282,000
Percent 0% 0% 100% 100% 82% 18% 100%
Average loan outstanding per
entity 0 0 405,220,000 405,220,000
57,403,000 79,131,000 60,407,000
Average loan size per borrower 0 0 3,850,000 3,850,000 1,515,000 1,406,000 1,496,000
Table 4: Loan Usage
Regulated MFIs
VFs with
DTMFIs NDTMFIs SCU total
Saving and Credit Credit only total
Agricultures and Livestock 0 0 147,840,000 147,840,000 8,409,188,000 3,168,550,000 11,577,738,000
Trade and Services 0 0 344,960,000 344,960,000 9,268,043,000 584,509,000 9,852,552,000
Handicraft 0 0 0 0 671,263,000 0 671,263,000
Emergency 0 0 0 0 929,179,000 116,902,000 1,046,081,000
Other Purpose 0 0 0 0 0 0 0
Table 5: Saving Information
Regulated MFIs
VFs
DTMFIs NDTMFIs SCU total
Saving and Credit Credit only total
Number of savers 0 0 262 262 22,868 N/A N/A
Average no. of savers per entity 0 0 262 262 78 N/A N/A
Total amount of savings 0 0 503,000,000 503,000,000 15,600,887,000 N/A N/A
Average saving per entity 0 0 503,000,000 503,000,000 53,245,000 N/A N/A
Average savings size per member 0 0 1,920,000 1,920,000 682,000 N/A N/A

69
Table 6: Income Statement
Regulated MFIs VFs
Unit: kip DTMFIs NDTMFIs SCUs total Saving and Credit Credit only total
Interest Income 0 0 148,824,000 148,824,000 4,425,007,000 269,320,000 4,694,327,000
Other Income (e.g. fees, service charges) 0 0 102,282,000 102,282,000 0 34,558,000 34,558,000
Operating Expenses 0 0 190,338,000 190,338,000 87,910,000 5,386,000 93,296,000
Expenses for Village Development 0 0 0 0 109,891,000 71,966,000 181,857,000
Expenses for Social Welfare 0 0 0 0 139,076,000 64,665,000 203,741,000
Other Expenses (e.g. consultants, studies) 0 0 0 0 289,346,000 68,783,000 358,129,000
Total Operating Expenses 0 0 190,338,000 190,338,000 626,223,000 210,800,000 837,023,000
Net Operating Income/Loss 0 0 60,768,000 60,768,000 3,798,784,000 93,078,000 3,891,862,000
Loan Loss Provision/Reserves 0 0 0 0 96,163,000 0 96,163,000
Extraordinay Income (e.g. grants) 0 0 879,000 879,000 0 0 0
Net profit for the period 0 0 61,647,000 61,647,000 3,702,621,000 93,078,000 3,795,699,000
Table 7: Balance Sheet
Regulated MFIs VFs with
Unit: kip DTMFIs NDTMFIs SCUs total
Saving and
Credit Credit only total
Cash 0 0 166,007,000 166,007,000 3,653,292,000 2,755,039,000 6,408,331,000
Gross loan outstanding 0 0 405,220,000 405,220,000 16,819,122,000 3,719,160,000 20,538,282,000
Fixed and other assets 0 0 247,252,000 247,252,000 4,571,066,000 76,000,000 4,647,066,000
Total Asset 0 0 818,479,000 818,479,000 25,043,480,000 6,550,199,000 31,593,679,000
Saving deposits 0 0 503,000,000 503,000,000 15,600,887,000 0 15,600,887,000
Loan Recieved 0 0 0 0 0 17,923,000 17,923,000
Others (Unpaid dividend) 0 0 0 0 0 0 0
Total Liability 0 0 503,000,000 503,000,000 15,600,887,000 17,923,000 15,618,810,000
Shares 0 0 124,900,000 124,900,000 0 0 0
Reserve 0 0 68,227,000 68,227,000 2,534,630,000 0 2,534,630,000
Donation and grant 0 0 122,352,000 122,352,000 6,463,377,000 6,153,111,000 12,616,488,000
Retained earning prior period,
others* 0 0 0 0 333,428,000 364,085,000 697,513,000
Dividend Payment 0 0 -61,647,000 -61,647,000 -3,591,463,000 -77,998,000 -3,669,461,000
Profit/Loss of current year 0 0 61,647,000 61,647,000 3,702,621,000 93,078,000 3,795,699,000
Total Equity 0 0 315,479,000 315,479,000 9,442,593,000 6,532,276,000 15,974,869,000
Total Liability and Equity 0 0 818,479,000 818,479,000 25,043,480,000 6,550,199,000 31,593,679,000
Note: * Additional capital, dividend declared
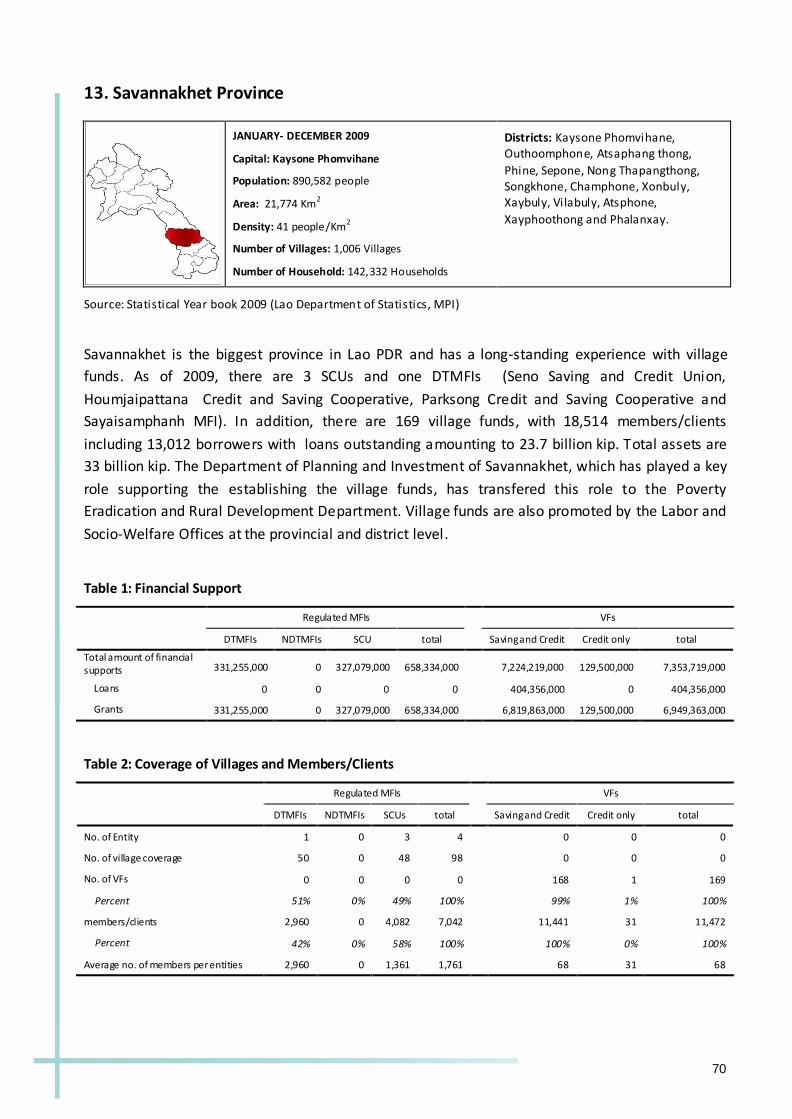
70
13. Savannakhet Province
JANUARY- DECEMBER 2009
Capital: Kaysone Phomvihane
Population: 890,582 people
Area: 21,774 Km2
Density: 41 people/Km2
Number of Villages: 1,006 Villages
Number of Household: 142,332 Households
Districts: Kaysone Phomvihane, Outhoomphone, Atsaphang thong,
Phine, Sepone, Nong Thapangthong, Songkhone, Champhone, Xonbuly, Xaybuly, Vilabuly, Atsphone,
Xayphoothong and Phalanxay.
Source: Statistical Year book 2009 (Lao Department of Statistics, MPI)
Savannakhet is the biggest province in Lao PDR and has a long-standing experience with village
funds. As of 2009, there are 3 SCUs and one DTMFIs (Seno Saving and Credit Union,
Houmjaipattana Credit and Saving Cooperative, Parksong Credit and Saving Cooperative and
Sayaisamphanh MFI). In addition, there are 169 village funds, with 18,514 members/clients
including 13,012 borrowers with loans outstanding amounting to 23.7 billion kip. Total assets are
33 billion kip. The Department of Planning and Investment of Savannakhet, which has played a key
role supporting the establishing the village funds, has transfered this role to the Poverty
Eradication and Rural Development Department. Village funds are also promoted by the Labor and
Socio-Welfare Offices at the provincial and district level.
Table 1: Financial Support
Regulated MFIs
VFs
DTMFIs NDTMFIs SCU total
Saving and Credit Credit only total
Total amount of financial supports 331,255,000 0 327,079,000 658,334,000 7,224,219,000 129,500,000 7,353,719,000
Loans 0 0 0 0 404,356,000 0 404,356,000
Grants 331,255,000 0 327,079,000 658,334,000 6,819,863,000 129,500,000 6,949,363,000
Table 2: Coverage of Villages and Members/Clients
Regulated MFIs
VFs
DTMFIs NDTMFIs SCUs total
Saving and Credit Credit only total
No. of Entity 1 0 3 4 0 0 0
No. of village coverage 50 0 48 98 0 0 0
No. of VFs 0 0 0 0 168 1 169
Percent 51% 0% 49% 100% 99% 1% 100%
members/clients 2,960 0 4,082 7,042 11,441 31 11,472
Percent 42% 0% 58% 100% 100% 0% 100%
Average no. of members per entities 2,960 0 1,361 1,761 68 31 68

71
Table 3: Credit Information
Regulated MFIs
VFs
DTMFIs NDTMFIs SCUs total
Saving and Credit Credit only total
No. of Borrowers in
the year 4,661 0 2,129 6,790 6,191 31 6,222
Percent 69% 0% 31% 100% 100% 0% 100%
Average no. of
Borrower per entity 4,661 0 710 1,698
37 31 37
Total Amount of Laon
Outstanding 6,735,486,000 0 3,949,322,000 10,684,808,000
12,904,395,000 124,000,000 13,028,395,000
Percent 63% 0% 37% 100% 99% 1% 100%
Average loan
outstanding per entity 6,735,486,000 0 1,316,441,000 2,671,202,000
76,812,000 124,000,000 77,091,000
Average loan size per
borrower 3,570,000 0 3,066,000 3,412,000 2,683,000 4,000,000 2,690,000
Table 4: Loan Usage
Regulated MFIs
VFs with
DTMFIs NDTMFIs SCUs total
Saving and Credit Credit only total
Agricultures and Livestock 5,974,225,000 0 1,699,536,000 7,673,761,000 12,172,091,000 78,500,000 12,250,591,000
Trade and Services 2,411,307,000 0 3,335,583,000 5,746,890,000 3,627,686,000 45,500,000 3,673,186,000
Handicraft 7,429,127,000 0 126,902,000 7,556,029,000 101,629,000 0 101,629,000
Emergency 0 0 1,366,424,000 1,366,424,000 710,275,000 0 710,275,000
Other Purpose 822,948,000 0 0 822,948,000 0 0 0
Table 5: Saving Information
Regulated MFIs
VFs
DTMFIs NDTMFIs SCUs total
Saving and Credit Credit only total
Number of savers 2,999 0 2,381 5,380 10,233 N/A N/A
Average no. of savers per entity 2,999 0 794 1,345 61 N/A N/A
Total amount of savings 6,956,109,000 0 2,047,070,000 9,003,179,000 8,955,697,000 N/A N/A
Average saving per entity 6,956,109,000 0 682,357,000 2,250,795,000 53,308,000 N/A N/A
Average savings size per member 2,319,000 0 860,000 1,673,000 875,000 N/A N/A

72
Table 6: Income Statement
Regulated MFIs VFs
Unit: kip DTMFIs NDTMFIs SCUs total Saving and Credit Credit only total
Interest Income 6,217,032,000 0 1,451,119,000 7,668,151,000 2,143,123,000 9,971,000 2,153,094,000
Other Income (e.g. fees, service charges) 76,085,000 0 185,939,000 262,024,000 40,581,000 0 40,581,000
Operating Expenses 5,831,570,000 0 886,445,000 6,718,015,000 111,650,000 0 111,650,000
Expenses for Village Development 0 0 8,122,000 8,122,000 62,751,000 498,000 63,249,000
Expenses for Social Welfare 0 0 8,122,000 8,122,000 34,505,000 0 34,505,000
Other Expenses (e.g. consultants, studies) 0 0 178,233,000 178,233,000 301,639,000 5,984,000 307,623,000
Total Operating Expenses 5,831,570,000 0 1,080,922,000 6,912,492,000 510,545,000 6,482,000 517,027,000
Net Operating Income/Loss 461,547,000 0 556,136,000 1,017,683,000 1,673,159,000 3,489,000 1,676,648,000
Loan Loss Provision/Reserves 356,489,000 0 139,087,000 495,576,000 105,385,000 0 105,385,000
Extraordinay Income (e.g. grants) 35,310,000 0 0 35,310,000 0 0 0
Net profit for the period 140,368,000 0 417,049,000 557,417,000 1,567,774,000 3,489,000 1,571,263,000
Table 7: Balance Sheet
Regulated MFIs VFs with
Unit: kip DTMFIs NDTMFIs SCUs total
Saving and
Credit Credit only total
Cash 2,083,321,000 0 420,374,000 2,503,695,000 4,203,759,000 0 4,203,759,000
Gross loan outstanding 6,735,486,000 0 3,949,322,000 10,684,808,000 12,904,395,000 124,000,000 13,028,395,000
Fixed and other assets 934,655,000 0 1,275,850,000 2,210,505,000 1,200,552,000 11,484,000 1,212,036,000
Total Asset 9,753,462,000 0 5,645,546,000 15,399,008,000 18,308,706,000 135,484,000 18,444,190,000
Saving deposits 6,956,109,000 0 2,047,070,000 9,003,179,000 8,955,697,000 0 8,955,697,000
Loan Recieved 1,110,120,000 0 0 1,110,120,000 404,356,000 0 404,356,000
Others (Unpaid
dividend) 215,610,000 0 197,892,000 413,502,000 121,191,000 0 121,191,000
Total Liability 8,281,839,000 0 2,244,962,000 10,526,801,000 9,481,244,000 0 9,481,244,000
Shares 1,000,000,000 0 1,945,100,000 2,945,100,000 0 0 0
Reserve 0 0 59,621,000 59,621,000 221,261,000 5,984,000 227,245,000
Donation and grant 331,255,000 0 327,983,000 659,238,000 7,269,862,000 129,500,000 7,399,362,000
Retained earning prior
period, others* 0 0 982,847,000 982,847,000 1,091,525,000 0 1,091,525,000
Dividend Payment 0 0 -332,016,000 -332,016,000 -1,322,960,000 -3,489,000 -1,326,449,000
Profit/Loss of current
year 140,368,000 0 417,049,000 557,417,000 1,567,774,000 3,489,000 1,571,263,000
Total Equity 1,471,623,000 0 3,400,584,000 4,872,207,000 8,827,462,000 135,484,000 8,962,946,000
Total Liability and
Equity 9,753,462,000 0 5,645,546,000 15,399,008,000 18,308,706,000 135,484,000 18,444,190,000
Note: * Additional capital, dividend declared

73
14. Saravanh Province
JANUARY- DECEMBER 2009
Capital: Saravane
Population: 890,582 people
Area: 358,041 Km2
Density: 33 people/Km2
Number of Villages: 612 Villages
Number of Household: 59,750 Households
Districts: Saravan, Ta oi Toomlarn,
Nakhonepheng, Vapy, Khongxedone, Lao ngarm and Samuoi
Source: Statistical Year book 2009 (Lao Department of Statistics, MPI)
There are no regulated MFIs in Saravanh province. Due to access and language problems there are
only 58 village funds with a total of 2,643 members, promoted by the Lao Women Union. About
half of them are active borrowers, with a total loan portfolio is 1.2 billion kip.
Table 1: Financial Support
Regulated MFIs
VFs
DTMFIs NDTMFIs SCUs total
Saving and Credit Credit only total
Total amount of financial supports 0 0 0 0 206,692,000 149,464,000 356,156,000
Loans 0 0 0 0 8,328,000 0 8,328,000
Grants 0 0 0 0 198,364,000 149,464,000 347,828,000
Table 2: Coverage of Villages and Members/Clients
Regulated MFIs
VFs
DTMFIs NDTMFIs SCUs total
Saving and Credit Credit only total
No. of institutions 0 0 0 0 0 0 0
No. of village coverage 0 0 0 0 0 0 0
No. of VFs 0 0 0 0 48 10 58
Percent 0% 0% 0% 0% 83% 17% 100%
Members/clients 0 0 0 0 2,560 83 2,643
Percent 0% 0% 0% 0% 97% 3% 100%
Average no. of members per entities 0 0 0 0 53 8 46

74
Table 3: Credit Information
Regulated MFIs
VFs
DTMFIs NDTMFIs SCUs total
Saving and Credit Credit only total
No. of Borrowers in the year 0 0 0 0 1,044 83 1,127
Percent 0% 0% 0% 0% 93% 7% 100%
Average no. of Borrower per entity 0 0 0 0
22 8 19
Total Amount of Laon Outstanding 0 0 0 0
1,088,474,000 78,183,000 1,166,657,000
Percent 0% 0% 0% 0% 93% 7% 100%
Average loan outstanding per entity 0 0 0 0
22,677,000 7,818,000 20,115,000
Average loan size per borrower 0 0 0 0 1,178,000 10,987,000 1,901,000
Table 4: Loan Usage
Regulated MFIs
VFs with
DTMFIs NDTMFIs SCUs total
Saving and Credit Credit only total
Agricultures and Livestock 0 0 0 0 643,256,000 39,925,000 683,181,000
Trade and Services 0 0 0 0 359,018,000 68,800,000 427,818,000
Handicraft 0 0 0 0 0 31,000,000 31,000,000
Emergency 0 0 0 0 227,766,000 9,739,000 237,505,000
Other Purpose 0 0 0 0 0 762,490,000 762,490,000
Table 5: Saving Information
Regulated MFIs
VFs
DTMFIs NDTMFIs SCUs total
Saving and Credit Credit only total
Number of savers 0 0 0 0 2,405 N/A N/A
Average no. of savers per entity 0 0 0 0 50 N/A N/A
Total amount of savings 0 0 0 0 164,010,000 N/A N/A
Average saving per entity 0 0 0 0 3,417,000 N/A N/A
Average savings size per member 0 0 0 0 68,000 N/A N/A

75
Table 6: Income Statement
Regulated MFIs VFs
Unit: kip DTMFIs NDTMFIs SCUs total Saving and Credit Credit only total
Interest Income 0 0 0 0 106,619,000 23,193,000 129,812,000
Other Income (e.g. fees, service charges) 0 0 0 0 9,728,000 0 9,728,000
Operating Expenses 0 0 0 0 88,000 0 88,000
Expenses for Village Development 0 0 0 0 5,104,000 324,000 5,428,000
Expenses for Social Welfare 0 0 0 0 950,000 162,000 1,112,000
Other Expenses (e.g. consultants, studies) 0 0 0 3,818,000 5,485,000 9,303,000
Total Operating Expenses 0 0 0 0 9,960,000 5,971,000 15,931,000
Net Operating Income/Loss 0 0 0 0 106,387,000 17,222,000 123,609,000
Loan Loss Provision/Reserves 0 0 0 0 5,493,000 930,000 6,423,000
Extraordinay Income (e.g. grants) 0 0 0 0 0 31,000,000 31,000,000
Net profit for the period 0 0 0 0 100,894,000 47,292,000 148,186,000
Table 7: Balance Sheet
Regulated MFIs VFs with
Unit: kip DTMFIs NDTMFIs SCUs total
Saving and
Credit Credit only total
Cash 0 0 0 0 149,556,000 6,800,000 156,356,000
Gross loan outstanding 0 0 0 0 1,088,474,000 78,183,000 1,166,657,000
Fixed and other assets 0 0 0 0 145,667,000 74,801,000 220,468,000
Total Asset 0 0 0 0 1,383,697,000 159,784,000 1,543,481,000
Saving deposits 0 0 0 0 164,010,000 0 164,010,000
Loan Recieved 0 0 0 0 8,328,000 0 8,328,000
Others (Unpaid dividend) 0 0 0 0 0 0 0
Total Liability 0 0 0 0 172,338,000 0 172,338,000
Shares 0 0 0 0 0 0 0
Reserve 0 0 0 0 5,493,000 0 5,493,000
Donation and grant 0 0 0 0 198,364,000 149,464,000 347,828,000
Retained earning prior period,
others* 0 0 0 0 990,542,000 0 990,542,000
Dividend Payment 0 0 0 0 -83,934,000 -36,972,000 -120,906,000
Profit/Loss of current year 0 0 0 0 100,894,000 47,292,000 148,186,000
Total Equity 0 0 0 0 1,211,359,000 159,784,000 1,371,143,000
Total Liability and Equity 0 0 0 0 1,383,697,000 159,784,000 1,543,481,000
Note: * Additional capital, dividend declared

76
15. Sekong Province
JANUARY- DECEMBER 2009
Capital: Lamam
Population: 95,243 people
Area: 7,665 Km2
Density: 12 people/Km2
Number of Villages: 235 Villages
Number of Household: 29,641 Households
Districts: La marm, Kaleum, Dakcheung and Thateng
Source: Statistical Year book 2009 (Lao Department of Statistics, MPI)
Sekong province has the smallest number of village funds of any province, and no regulated MFIs.
Population density is low, and interest in financial activities limited. However, 20 village funds have
been established upon the initiative of the Lao Women’s Union and the Poverty Eradication and
Rural Development Offices. Total membership is 853 members, all of them reportedly borrowers.
Loans outstanding amount to 1.75 billion kip and total assets are 2.61 billion kip.
Table 1: Financial Support
Regulated MFIs
VFs
DTMFIs NDTMFIs SCUs total
Saving and Credit Credit only total
Total amount of financial supports 0 0 0 0
1,683,980,000 20,000,000 1,703,980,000
Loans 0 0 0 0
0 0 0
Grants 0 0 0 0
1,683,980,000 20,000,000 1,703,980,000
Table 2: Coverage of Villages and Members/Clients
Regulated MFIs
VFs
DTMFIs NDTMFIs SCUs total
Saving and Credit Credit only total
No. of institutions 0 0 0 0 0 0 0
No. of village coverage 0 0 0 0 0 0 0
No. of VFs 0 0 0 0 18 2 20
Percent 0% 0% 0% 0% 90% 10% 100%
Members/clients 0 0 0 0 842 11 853
Percent 0% 0% 0% 0% 99% 1% 100%
Average no. of members per entities 0 0 0 0 47 6 43

77
Table 3: Credit Information
Regulated MFIs
VFs
DTMFIs NDTMFIs SCUs total
Saving and Credit Credit only total
No. of Borrowers in the year 0 0 0 0 842 11 853
Percent 0% 0% 0% 0% 99% 1% 100%
Average no. of Borrower per entity 0 0 0 0
47 6 43
Total Amount of Laon Outstanding 0 0 0 0
1,756,260,000 0 1,756,260,000
Percent 0% 0% 0% 0% 100% 0% 100%
Average loan outstanding per entity 0 0 0 0
97,570,000 0 87,813,000
Average loan size per borrower 0 0 0 0 2,142,000 2,909,000 2,151,000
Table 4: Loan Usage
Regulated MFIs
VFs with
DTMFIs NDTMFIs SCUs total
Saving and Credit Credit only total
Agricultures and Livestock 0 0 0 0 1,244,975,000 14,000,000 1,258,975,000
Trade and Services 0 0 0 0 476,860,000 4,500,000 481,360,000
Handicraft 0 0 0 0 0 12,000,000 12,000,000
Emergency 0 0 0 0 81,315,000 1,500,000 82,815,000
Other Purpose 0 0 0 0 0 0 0
Table 5: Saving Information
Regulated MFIs
VFs
DTMFIs NDTMFIs SCU total
Saving and Credit Credit only total
Number of savers 0 0 0 0 842 N/A N/A
Average no. of savers per entity 0 0 0 0 47 N/A N/A
Total amount of savings 0 0 0 0 828,536,000 N/A N/A
Average saving per entity 0 0 0 0 46,030,000 N/A N/A
Average savings size per member 0 0 0 0 984,000 N/A N/A

78
Table 6: Income Statement
Regulated MFIs VFs
Unit: kip DTMFIs NDTMFIs SCUs total Saving and Credit Credit only total
Interest Income 0 0 0 0 324,974,000 5,910,000 330,884,000
Other Income (e.g. fees, service charges) 0 0 0 0 0 0 0
Operating Expenses 0 0 0 0 61,290,000 0 61,290,000
Expenses for Village Development 0 0 0 0 16,036,000 0 16,036,000
Expenses for Social Welfare 0 0 0 0 0 0 0
Other Expenses (e.g. consultants, studies) 0 0 0 57,083,000 0 57,083,000
Total Operating Expenses 0 0 0 0 134,409,000 0 134,409,000
Net Operating Income/Loss 0 0 0 0 190,565,000 5,910,000 196,475,000
Loan Loss Provision/Reserves 0 0 0 0 39,868,000 0 39,868,000
Extraordinay Income (e.g. grants) 0 0 0 0 0 20,000,000 20,000,000
Net profit for the period 0 0 0 0 150,697,000 25,910,000 176,607,000
Table 7: Balance Sheet
Regulated MFIs VFs with
Unit: kip DTMFIs NDTMFIs SCUs total
Saving and
Credit Credit only total
Cash 0 0 0 0 440,319,000 25,910,000 466,229,000
Gross loan outstanding 0 0 0 0 1,756,260,000 0 1,756,260,000
Fixed and other assets 0 0 0 0 394,710,000 0 394,710,000
Total Asset 0 0 0 0 2,591,289,000 25,910,000 2,617,199,000
Saving deposits 0 0 0 0 828,536,000 0 828,536,000
Loan Recieved 0 0 0 0 0 0 0
Others (Unpaid dividend) 0 0 0 0 0 0 0
Total Liability 0 0 0 0 828,536,000 0 828,536,000
Shares 0 0 0 0 0 0 0
Reserve 0 0 0 0 12,905,000 0 12,905,000
Donation and grant 0 0 0 0 1,683,980,000 20,000,000 1,703,980,000
Retained earning prior period,
others* 0 0 0 0 65,868,000 -20,000,000 45,868,000
Dividend Payment 0 0 0 0 -150,697,000 0 -150,697,000
Profit/Loss of current year 0 0 0 0 150,697,000 25,910,000 176,607,000
Total Equity 0 0 0 0 1,762,753,000 25,910,000 1,788,663,000
Total Liability and Equity 0 0 0 0 2,591,289,000 25,910,000 2,617,199,000
Note: * Additional capital, dividend declared
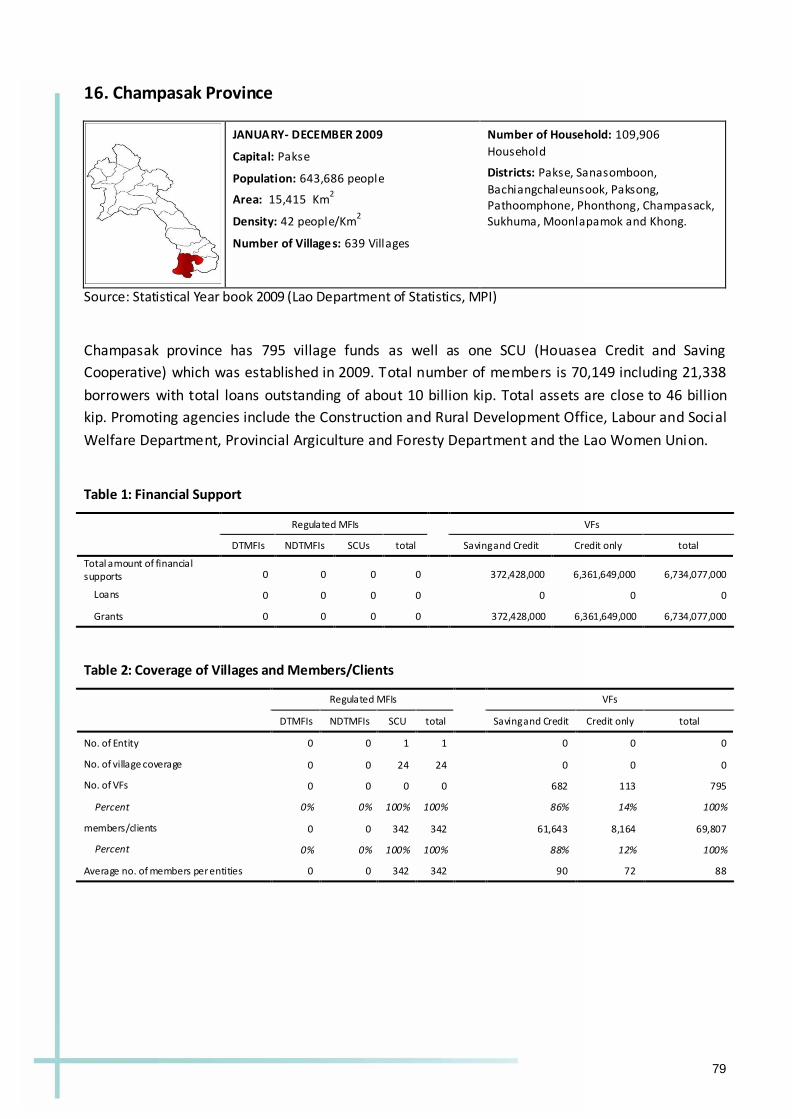
79
16. Champasak Province
JANUARY- DECEMBER 2009
Capital: Pakse
Population: 643,686 people
Area: 15,415 Km2
Density: 42 people/Km2
Number of Villages: 639 Villages
Number of Household: 109,906
Household
Districts: Pakse, Sanasomboon,
Bachiangchaleunsook, Paksong, Pathoomphone, Phonthong, Champasack, Sukhuma, Moonlapamok and Khong.
Source: Statistical Year book 2009 (Lao Department of Statistics, MPI)
Champasak province has 795 village funds as well as one SCU (Houasea Credit and Saving
Cooperative) which was established in 2009. Total number of members is 70,149 including 21,338
borrowers with total loans outstanding of about 10 billion kip. Total assets are close to 46 billion
kip. Promoting agencies include the Construction and Rural Development Office, Labour and Social
Welfare Department, Provincial Argiculture and Foresty Department and the Lao Women Union.
Table 1: Financial Support
Regulated MFIs
VFs
DTMFIs NDTMFIs SCUs total
Saving and Credit Credit only total
Total amount of financial supports 0 0 0 0 372,428,000 6,361,649,000 6,734,077,000
Loans 0 0 0 0 0 0 0
Grants 0 0 0 0 372,428,000 6,361,649,000 6,734,077,000
Table 2: Coverage of Villages and Members/Clients
Regulated MFIs
VFs
DTMFIs NDTMFIs SCU total
Saving and Credit Credit only total
No. of Entity 0 0 1 1 0 0 0
No. of village coverage 0 0 24 24 0 0 0
No. of VFs 0 0 0 0 682 113 795
Percent 0% 0% 100% 100% 86% 14% 100%
members/clients 0 0 342 342 61,643 8,164 69,807
Percent 0% 0% 100% 100% 88% 12% 100%
Average no. of members per entities 0 0 342 342 90 72 88

80
Table 3: Credit Information
Regulated MFIs
VFs
DTMFIs NDTMFIs SCU total
Saving and Credit Credit only total
No. of Borrowers in the year 0 0 86 86 15,430 5,822 21,252
Percent 0% 0% 100% 100% 73% 27% 100%
Average no. of Borrower per
entity 0 0 86 86
23 52 27
Total Amount of Laon
Outstanding 0 0 407,968,000 407,968,000
6,753,518,000 3,240,144,000 9,993,662,000
Percent 0% 0% 100% 100% 68% 32% 100%
Average loan outstanding per
entity 0 0 407,968,000 407,968,000
9,903,000 28,674,000 12,571,000
Average loan size per borrower 0 0 4,128,000 4,128,000 2,407,000 1,197,000 2,076,000
Table 4: Loan Usage
Regulated MFIs
VFs with
DTMFIs NDTMFIs SCU total
Saving and Credit Credit only total
Agricultures and Livestock 0 0 43,000,000 43,000,000 19,503,397,000 6,497,773,000 26,001,170,000
Trade and Services 0 0 303,000,000 303,000,000 12,704,868,000 249,000,000 12,953,868,000
Handicraft 0 0 0 0 84,451,000 221,196,000 305,647,000
Emergency 0 0 5,000,000 5,000,000 4,850,807,000 0 4,850,807,000
Other Purpose 0 0 4,000,000 4,000,000 0 0 0
Table 5: Saving Information
Regulated MFIs
VFs
DTMFIs NDTMFIs SCUs total
Saving and Credi Credit only total
Number of savers 0 0 40 40 61,010 N/A N/A
Average no. of savers per entity 0 0 40 40 89 N/A N/A
Total amount of savings 0 0 182,260,000 182,260,000 37,590,797,000 N/A N/A
Average saving per entity 0 0 182,260,000 182,260,000 55,118,000 N/A N/A
Average savings size per member 0 0 4,557,000 4,557,000 616,000 N/A N/A

81
Table 6: Income Statement
Regulated MFIs VFs
Unit: kip DTMFIs NDTMFIs SCUs total Saving and Credit Credit only total
Interest Income 0 0 130,577,000 130,577,000 2,720,678,000 217,860,000 2,938,538,000
Other Income (e.g. fees, service charges) 0 0 1,213,000 1,213,000 9,490,000 239,040,000 248,530,000
Operating Expenses 0 0 115,542,000 115,542,000 47,341,000 530,000 47,871,000
Expenses for Village Development 0 0 0 0 62,430,000 87,708,000 150,138,000
Expenses for Social Welfare 0 0 15,156,000 15,156,000 71,710,000 9,527,000 81,237,000
Other Expenses (e.g. consultants, studies) 0 0 1,813,000 1,813,000 28,395,000 34,547,000 62,942,000
Total Operating Expenses 0 0 132,511,000 132,511,000 209,876,000 132,312,000 342,188,000
Net Operating Income/Loss 0 0 -721,000 -721,000 2,520,292,000 324,588,000 2,844,880,000
Loan Loss Provision/Reserves 0 0 0 0 81,386,000 2,229,000 83,615,000
Extraordinay Income (e.g. grants) 0 0 721,000 721,000 0 0 0
Net profit for the period 0 0 0 0 2,438,906,000 322,359,000 2,761,265,000
Table 7: Balance Sheet
Regulated MFIs VFs with
Unit: kip DTMFIs NDTMFIs SCUs total
Saving and
Credit Credit only total
Cash 0 0 48,419,000 48,419,000 31,144,457,000 3,438,343,000 34,582,800,000
Gross loan outstanding 0 0 407,968,000 407,968,000 6,753,518,000 3,240,144,000 9,993,662,000
Fixed and other assets 0 0 43,818,000 43,818,000 65,250,000 0 65,250,000
Total Asset 0 0 500,205,000 500,205,000 37,963,225,000 6,678,487,000 44,641,712,000
Saving deposits 0 0 182,260,000 182,260,000 37,590,797,000 0 37,590,797,000
Loan Recieved 0 0 0 0 0 0 0
Others (Unpaid dividend) 0 0 49,467,000 49,467,000 0 214,180,000 214,180,000
Total Liability 0 0 231,727,000 231,727,000 37,590,797,000 214,180,000 37,804,977,000
Shares 0 0 251,493,000 251,493,000 0 0 0
Reserve 0 0 0 0 0 70,848,000 70,848,000
Donation and grant 0 0 0 0 372,428,000 6,361,649,000 6,734,077,000
Retained earning prior period,
others* 0 0 16,985,000 16,985,000 0 -250,414,000 -250,414,000
Dividend Payment 0 0 0 0 -2,438,906,000 -40,135,000 -2,479,041,000
Profit/Loss of current year 0 0 0 0 2,438,906,000 322,359,000 2,761,265,000
Total Equity 0 0 268,478,000 268,478,000 372,428,000 6,464,307,000 6,836,735,000
Total Liability and Equity 0 0 500,205,000 500,205,000 37,963,225,000 6,678,487,000 44,641,712,000
Note: * Additional capital, dividend declared
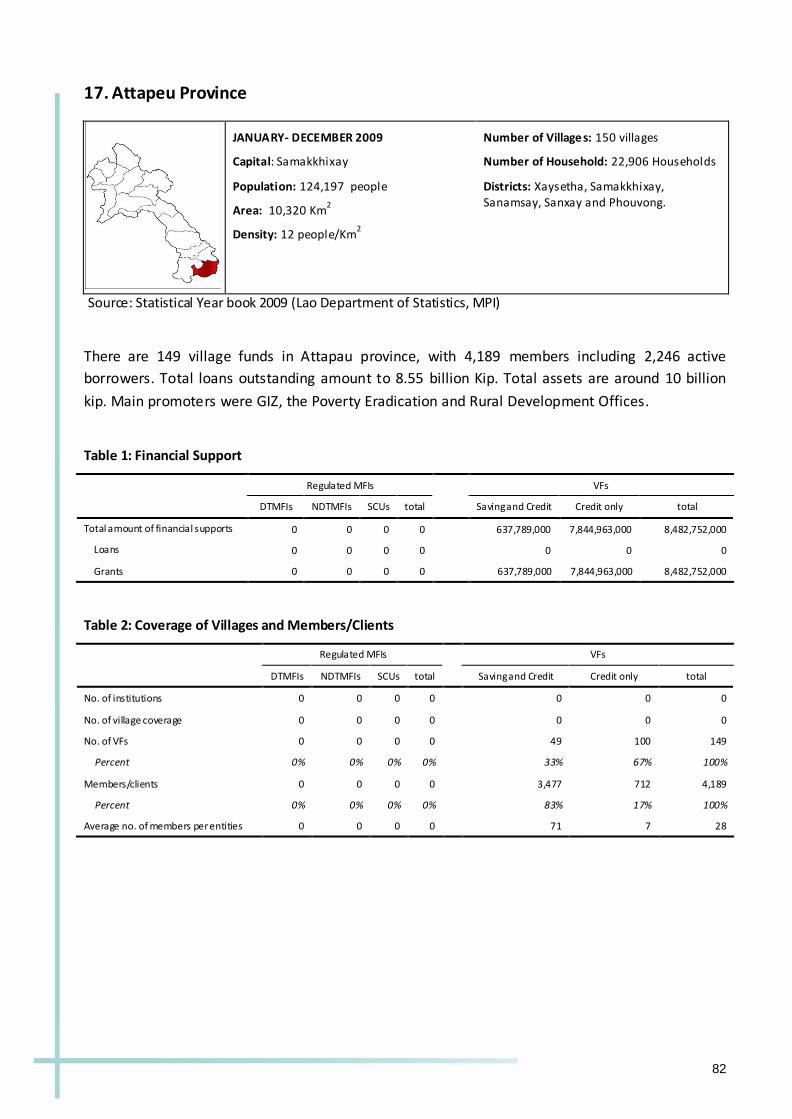
82
17. Attapeu Province
JANUARY- DECEMBER 2009
Capital: Samakkhixay
Population: 124,197 people
Area: 10,320 Km2
Density: 12 people/Km2
Number of Villages: 150 villages
Number of Household: 22,906 Households
Districts: Xaysetha, Samakkhixay, Sanamsay, Sanxay and Phouvong.
Source: Statistical Year book 2009 (Lao Department of Statistics, MPI)
There are 149 village funds in Attapau province, with 4,189 members including 2,246 active
borrowers. Total loans outstanding amount to 8.55 billion Kip. Total assets are around 10 billion
kip. Main promoters were GIZ, the Poverty Eradication and Rural Development Offices.
Table 1: Financial Support
Regulated MFIs
VFs
DTMFIs NDTMFIs SCUs total
Saving and Credit Credit only total
Total amount of financial supports 0 0 0 0 637,789,000 7,844,963,000 8,482,752,000
Loans 0 0 0 0 0 0 0
Grants 0 0 0 0 637,789,000 7,844,963,000 8,482,752,000
Table 2: Coverage of Villages and Members/Clients
Regulated MFIs
VFs
DTMFIs NDTMFIs SCUs total
Saving and Credit Credit only total
No. of institutions 0 0 0 0 0 0 0
No. of village coverage 0 0 0 0 0 0 0
No. of VFs 0 0 0 0 49 100 149
Percent 0% 0% 0% 0% 33% 67% 100%
Members/clients 0 0 0 0 3,477 712 4,189
Percent 0% 0% 0% 0% 83% 17% 100%
Average no. of members per entities 0 0 0 0 71 7 28
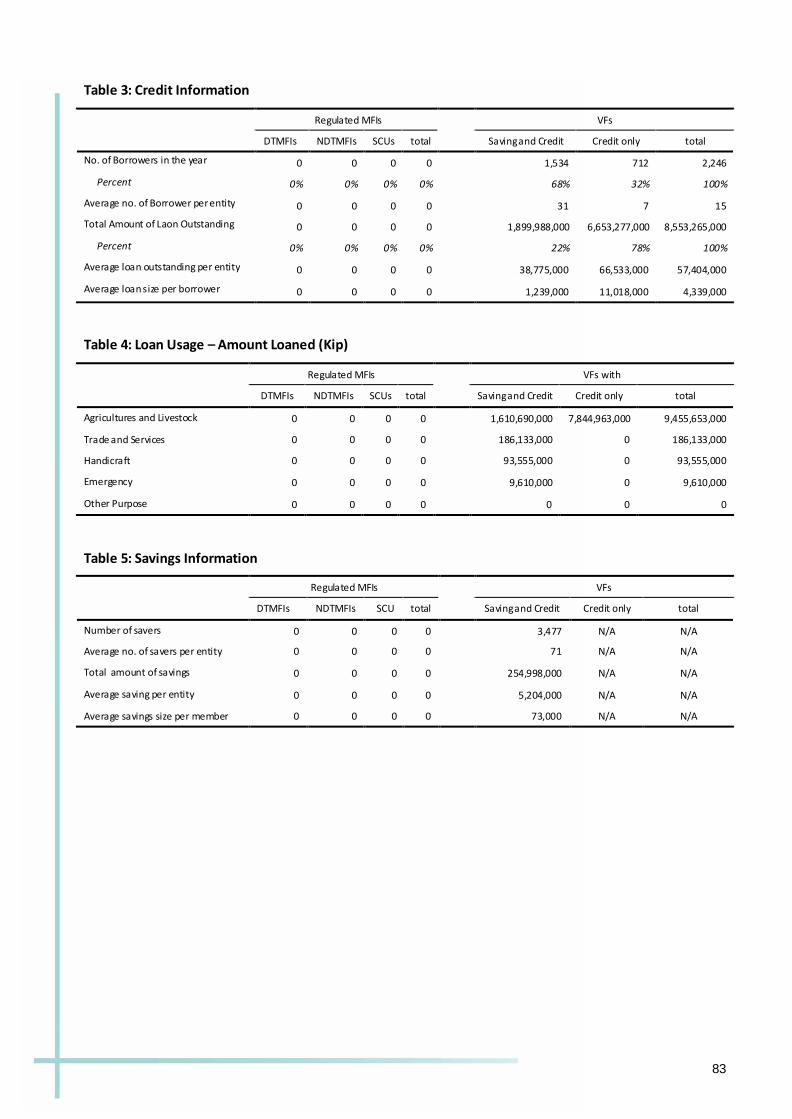
83
Table 3: Credit Information
Regulated MFIs
VFs
DTMFIs NDTMFIs SCUs total
Saving and Credit Credit only total
No. of Borrowers in the year 0 0 0 0 1,534 712 2,246
Percent 0% 0% 0% 0% 68% 32% 100%
Average no. of Borrower per entity 0 0 0 0
31 7 15
Total Amount of Laon Outstanding 0 0 0 0
1,899,988,000 6,653,277,000 8,553,265,000
Percent 0% 0% 0% 0% 22% 78% 100%
Average loan outstanding per entity 0 0 0 0
38,775,000 66,533,000 57,404,000
Average loan size per borrower 0 0 0 0 1,239,000 11,018,000 4,339,000
Table 4: Loan Usage – Amount Loaned (Kip)
Regulated MFIs
VFs with
DTMFIs NDTMFIs SCUs total
Saving and Credit Credit only total
Agricultures and Livestock 0 0 0 0 1,610,690,000 7,844,963,000 9,455,653,000
Trade and Services 0 0 0 0 186,133,000 0 186,133,000
Handicraft 0 0 0 0 93,555,000 0 93,555,000
Emergency 0 0 0 0 9,610,000 0 9,610,000
Other Purpose 0 0 0 0 0 0 0
Table 5: Savings Information
Regulated MFIs
VFs
DTMFIs NDTMFIs SCU total
Saving and Credit Credit only total
Number of savers 0 0 0 0 3,477 N/A N/A
Average no. of savers per entity 0 0 0 0 71 N/A N/A
Total amount of savings 0 0 0 0 254,998,000 N/A N/A
Average saving per entity 0 0 0 0 5,204,000 N/A N/A
Average savings size per member 0 0 0 0 73,000 N/A N/A

84
Table 6: Income Statement
Regulated MFIs VFs
Unit: kip DTMFIs NDTMFIs SCUs total Saving and Credit Credit only total
Interest Income 0 0 0 0 79,691,000 220,407,000 300,098,000
Other Income (e.g. fees, service charges) 0 0 0 0 42,000 0 42,000
Operating Expenses 0 0 0 0 508,697,000 4,436,000 513,133,000
Expenses for Village Development 0 0 0 0 1,695,000 10,798,000 12,493,000
Expenses for Social Welfare 0 0 0 0 1,808,000 0 1,808,000
Other Expenses (e.g. consultants, studies) 0 0 0 42,254,000 53,994,000 96,248,000
Total Operating Expenses 0 0 0 0 554,454,000 69,228,000 623,682,000
Net Operating Income/Loss 0 0 0 0 -474,721,000 151,179,000 -323,542,000
Loan Loss Provision/Reserves 0 0 0 0 0 0 0
Extraordinay Income (e.g. grants) 0 0 0 0 508,697,000 0 508,697,000
Net profit for the period 0 0 0 0 33,976,000 151,179,000 185,155,000
Table 7: Balance Sheet
Regulated MFIs VFs with
Unit: kip DTMFIs NDTMFIs SCUs total
Saving and
Credit Credit only total
Cash 0 0 0 0 443,897,000 87,996,000 531,893,000
Gross loan outstanding 0 0 0 0 1,899,988,000 6,653,277,000 8,553,265,000
Fixed and other assets 0 0 0 0 186,635,000 1,103,690,000 1,290,325,000
Total Asset 0 0 0 0 2,530,520,000 7,844,963,000 10,375,483,000
Saving deposits 0 0 0 0 254,998,000 0 254,998,000
Loan Recieved 0 0 0 0 0 0 0
Others (Unpaid dividend) 0 0 0 0 9,467,000 0 9,467,000
Total Liability 0 0 0 0 264,465,000 0 264,465,000
Shares 0 0 0 0 0 0 0
Reserve 0 0 0 0 8,368,000 0 8,368,000
Donation and grant 0 0 0 0 637,789,000 7,844,963,000 8,482,752,000
Retained earning prior period,
others* 0 0 0 0 1,606,337,000 -86,388,000 1,519,949,000
Dividend Payment 0 0 0 0 -20,415,000 -64,791,000 -85,206,000
Profit/Loss of current year 0 0 0 0 33,976,000 151,179,000 185,155,000
Total Equity 0 0 0 0 2,266,055,000 7,844,963,000 10,111,018,000
Total Liability and Equity 0 0 0 0 2,530,520,000 7,844,963,000 10,375,483,000
Note: * Additional capital, dividend declared

85
References
BoL & ADB (2011). Microfinance Briefing Paper: Institutional Development of Lao MFIs during 2008-
2010 (by Shane Nichols). Vientiane
BoL, APRACA & GTZ (1997). National Consultation-Workshop on the Promotion of Rural and
Microfinance in the Lao PDR. Vientiane and Bangkok
BWPN (2010). Microfinance Industry Report Lao PDR (by Timo Hogenhout). Foundation for Development Cooperation, South Brisbane
CGAP (2008). Appraisal Guide for Microfinance Institutions: A Technical Guide , by Jennifer Isern and
Julie Abrams with Matthew Brown. Washington DC
Coleman, B., and J. Wynne-Williams (2006). Rural Finance in the Lao PDR: Demand, Supply, and Sustainability. ADB, Manila. www.adb.org/Documents/Books/Rural-Finance-LAO/Rural-Finance-LAO.pdf
Government of the Lao PDR (2003). National Growth and Poverty Eradication Strategy 2003. Vientiane
Hogenhout, T., and D. Taras (2008). Village Banking in the Lao PDR. GIZ, Vientiane and Eschborn
Kunkel C. R. and H. D. Seibel (1997). Microfinance in Laos. APRACA, Bangkok, and GTZ, Eschborn
Lao Department of Statistics (2010). Statistical Year Book 2009. Vientiane
National Statistical Centre (2004). Lao Expenditure and Consumption Survey 2002/03 (LECS III), Vientiane MPI (2010). The 6th Five-Year National Socio-Economic Development Plan (2011-2015). Vientiane
NERI (2007). Rural and Microfinance Statistics in Lao PDR, 2006. Vientiane
Lao PDR (2004). National Growth and Poverty Eradication Strategy (NGPES). Vientiane
Nguyen, B.T., & R. Vogel (2011). Rural and Microfinance in the Lower Mekong Region: Policies, Institutions, and Market Outcomes. Manila, ADB. www.microfinancegateway.org/gm/document-
1.9.51104/2011_adb_finance-lower-mekong.pdf
Seibel, H. D. (2010). Village Banks (“Village Savings and Credit Groups”) in Vientiane Capital, Laos – Roadmap Scenarios for a Sustainable Future. SBFIC, Bonn.
www.sparkassenstiftung.de/uploads/media/Laos_Village-Banks_Study.pdf
UNCDF/UNDP (1997). Microfinance in Rural Lao PDR: a National profile. UNDP/UNCDF, New York and Vientiane
(2010). Making Access to Finance more Inclusive for Poor People: Program document. New York
and Vientiane
Leading Committee for Rural Development and Poverty Eradication (LCRDPE) (2007). The Annual Report on Village Development Fund Performance (2008-2 009). Vientiane

86
Annexes
Annex 1: List of 5 DTMFIs and 8 NDTMFIs
1. 5 Deposit-taking MFIs
No. Name Location (of head office) Number of customers Savings
(Kip)
Loans outstanding
(Kip) Province District Savers Borrowers
1 DTMFI Champa Lao Luangprabang Luangprabang 50 555 47,988,000 552,255,000
2 DTMFI Newton MFI Vientiane Capital Sikhodtabong 2,730 251 804,816,000 676,780,000
3 DTMFI Ekphatthana MF Insti tution (EMI) Vientiane Capital Chanthabouli 5,333 1,427 3,890,905,000 2,916,704,000
4 DTMFI Lao Post Microfinance Insti tution Vientiane Capital Chanthabouli 14,249 4,134 40,694,477,000 128,531,000
5 DTMFI Saynhai Samphanh Savannakhet Kaysone Phomvihane 2,999 4,661 6,956,109,000 6,735,486,000
2. 8 Non-deposit-taking MFIs
No. Name Location (of head office) Number of customers Savings
(Kip) Loans outstanding
(Kip) Province District Savers Borrowers
1 NDTMFI IFDP (Phongsaly Microfinance Insti tution for Development)
Phongsaly Phongsaly 888 31 288,000,000 2,319,292,000
2 NDTMFI Village Community Development Fund of Bokeo province
Borkeo Huoixai 3,863 9,028 256,950,000 4,308,549,000
3 NDTMFI Oudomxay Development Non Deposit Taking Microfinance Insti tution
Oudomxay Xay 614 1,221 691,431,000 1,178,273,000
4 NDTMFI Souaykan Phatthana Huaphan Xamneua 52 124 66,531,000 140,244,000
5 NDTMFI Hongsa CCSA (GIZ) Sayaboury Hongsa 1,866 4,364 953,119,000 1,784,229,000
6 NDTMFI Khop CCSA (GIZ) Sayaboury Khop 806 1,979 260,660,000 -
7 NDTMFI Microfinance office Sayaboury Sayaboury 864 1,021 330,000,000 123,523,000
8 NDTMFI Hom district Vientiane Hom 241 107 41,829,000 268,134,000

87
Annex 2: List of 13 Saving and Credit Unions (SCUs)
No. Name Location (of head office) Number of customers Savings
(Kip)
Loans outstanding (Kip) Province District Savers Borrowers
1 Luangprabang saving and credit
cooperative Luangprabang Luangprabang 515 335 318,358,000 584,929,000
2 Vientiane credit and saving Union Vientaine Phonhong 493 100 111,119,000 223,097,000 3 Thoulakhom saving and credit Union Vientaine Thoulakhom 80 62 317,340,000 252,628,000
4 Goods Production Group Fund ( 4 Parkthone)
Borikhamxay Pakkading 113 269 556,475,000 526,299,000
5 Credit and small Production Fund (CCSP) Vientiane Capital Chanthaboury 3,369 1,304 829,474,000 5,543,300,000
6 Development Credit and Saving Cooperation
Vientiane Capital Sikhodtabong 815 435 81,670,000 5,188,390,000
7 Mittaphap Credit and Saving cooperation Vientiane Capital Xaythany 0 212 0 303,319,000
8 Naxaithong Rural Development Cooperative
Vientiane Capital Naxaithong 2,415 526 3,646,064,000 3,685,000,000
9 Thakhek credit and saving Cooperative khammuane Thakhek 262 128 503,000,000 405,220,000
10 Huamjaipattana credit and saving cooperative
Savannakhet Kaysone Phomvihane 196 404 129,727,000 260,462,000
11 Seno saving and credit union Savannakhet Outhoomphone 1,825 1,012 1,690,000,000 2,298,000,000
12 Parksong credit and saving Cooperative Savannakhet Songkhone 360 713 227,343,000 1,390,860,000 13 Houasea credit and saving cooperative Champasak Bachiengchleunsook 40 86 1,822,500,000 60,350,000
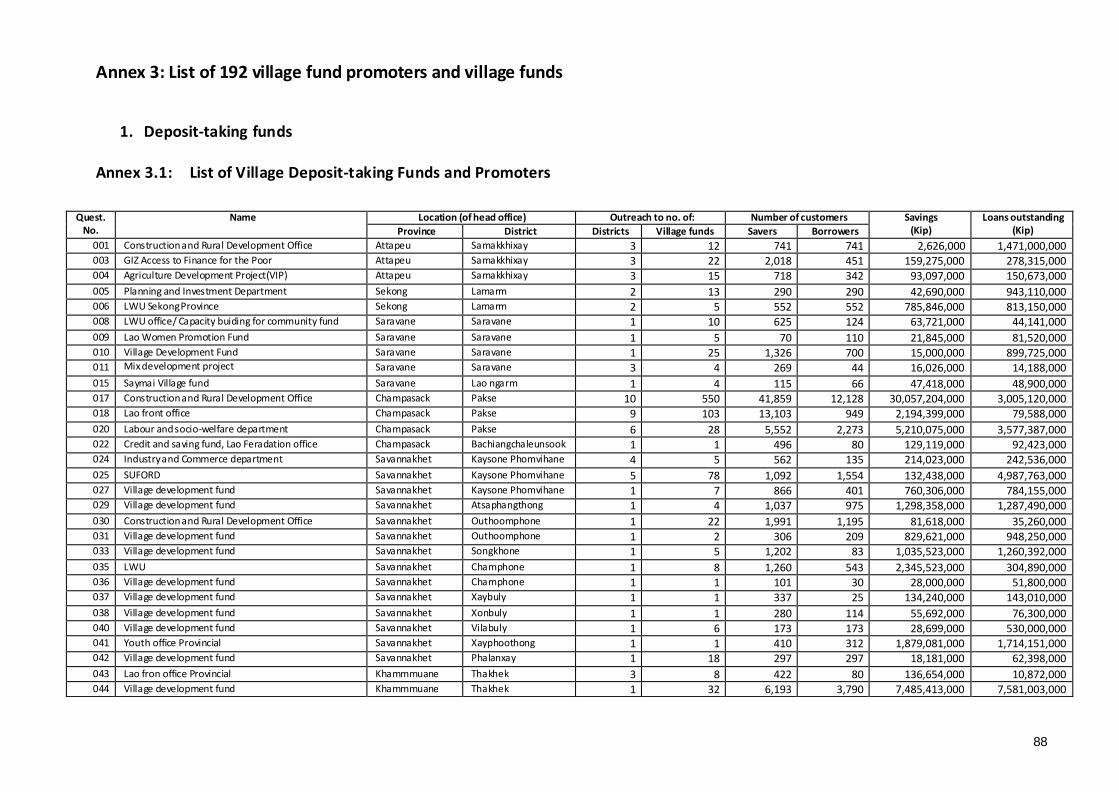
88
Annex 3: List of 192 village fund promoters and village funds
1. Deposit-taking funds
Annex 3.1: List of Village Deposit-taking Funds and Promoters
Quest.
No. Name Location (of head office) Outreach to no. of: Number of customers Savings
(Kip) Loans outstanding
(Kip) Province District Districts Village funds Savers Borrowers
001 Construction and Rural Development Office Attapeu Samakkhixay 3 12 741 741 2,626,000 1,471,000,000 003 GIZ Access to Finance for the Poor Attapeu Samakkhixay 3 22 2,018 451 159,275,000 278,315,000 004 Agriculture Development Project(VIP) Attapeu Samakkhixay 3 15 718 342 93,097,000 150,673,000 005 Planning and Investment Department Sekong Lamarm 2 13 290 290 42,690,000 943,110,000 006 LWU Sekong Province Sekong Lamarm 2 5 552 552 785,846,000 813,150,000 008 LWU office/ Capacity buiding for community fund Saravane Saravane 1 10 625 124 63,721,000 44,141,000
009 Lao Women Promotion Fund Saravane Saravane 1 5 70 110 21,845,000 81,520,000 010 Village Development Fund Saravane Saravane 1 25 1,326 700 15,000,000 899,725,000 011 Mix development project Saravane Saravane 3 4 269 44 16,026,000 14,188,000
015 Saymai Village fund Saravane Lao ngarm 1 4 115 66 47,418,000 48,900,000 017 Construction and Rural Development Office Champasack Pakse 10 550 41,859 12,128 30,057,204,000 3,005,120,000 018 Lao front office Champasack Pakse 9 103 13,103 949 2,194,399,000 79,588,000 020 Labour and socio-welfare department Champasack Pakse 6 28 5,552 2,273 5,210,075,000 3,577,387,000 022 Credit and saving fund, Lao Feradation office Champasack Bachiangchaleunsook 1 1 496 80 129,119,000 92,423,000 024 Industry and Commerce department Savannakhet Kaysone Phomvihane 4 5 562 135 214,023,000 242,536,000 025 SUFORD Savannakhet Kaysone Phomvihane 5 78 1,092 1,554 132,438,000 4,987,763,000 027 Village development fund Savannakhet Kaysone Phomvihane 1 7 866 401 760,306,000 784,155,000 029 Village development fund Savannakhet Atsaphangthong 1 4 1,037 975 1,298,358,000 1,287,490,000
030 Construction and Rural Development Office Savannakhet Outhoomphone 1 22 1,991 1,195 81,618,000 35,260,000 031 Village development fund Savannakhet Outhoomphone 1 2 306 209 829,621,000 948,250,000 033 Village development fund Savannakhet Songkhone 1 5 1,202 83 1,035,523,000 1,260,392,000
035 LWU Savannakhet Champhone 1 8 1,260 543 2,345,523,000 304,890,000 036 Village development fund Savannakhet Champhone 1 1 101 30 28,000,000 51,800,000 037 Village development fund Savannakhet Xaybuly 1 1 337 25 134,240,000 143,010,000 038 Village development fund Savannakhet Xonbuly 1 1 280 114 55,692,000 76,300,000 040 Village development fund Savannakhet Vilabuly 1 6 173 173 28,699,000 530,000,000 041 Youth office Provincial Savannakhet Xayphoothong 1 1 410 312 1,879,081,000 1,714,151,000 042 Village development fund Savannakhet Phalanxay 1 18 297 297 18,181,000 62,398,000
043 Lao fron office Provincial Khammmuane Thakhek 3 8 422 80 136,654,000 10,872,000 044 Village development fund Khammmuane Thakhek 1 32 6,193 3,790 7,485,413,000 7,581,003,000

89
045 Lao fron office Thakhek district Khammmuane Thakhek 1 31 1,771 828 903,314,000 384,821,000 046 SOUFORD Khammmuane Thakhek 4 95 2,602 2,602 14,034,000 2,752,097,000
047 Labour and socio-welfare department(ILO) Khammmuane Thakhek 4 13 3,508 1,256 5,075,265,000 2,373,993,000 048 Labour and socio-welfare department(Stone family) Khammmuane Thakhek 4 11 1,919 413 705,288,000 442,050,000 051 Lao fron office Hinboun district Khammmuane Hinboon 1 4 296 68 178,502,000 85,187,000
052 LWU Hinboun district Khammmuane Hinboon 1 46 60 3,094 113,248,000 2,491,419,000 054 Lao fron office Boualapha district Khammmuane Bualapha 1 17 706 38 50,499,000 23,920,000 056 Lao fron office Nakai district Khammmuane Hinboon 1 1 62 4 70,740,000 0 058 Lao fron office Xaybouathong district Khammmuane Xaybuathong 1 30 4,768 212 424,344,000 214,950,000 059 LWU Yommalath district Khammmuane Nhommalath 1 3 271 122 167,384,000 269,200,000 060 Lao fron office Nongbok district Khammmuane Nongbok 1 1 192 192 123,262,000 98,610,000 061 Lao front office, Mahaxay district Khammmuane Mahaxay 1 1 98 24 153,000,000 0 063 Bolikhamxay Province Village Development Fund Borikhamxay Parkxane 2 25 5,358 913 2,565,211,000 1,369,661,000 064 Bolikhamxay Province Poverty allevadication Fund Borikhamxay Parkxane 4 41 2,750 1,279 136,524,000 0 067 Village Credit Cash Fund Borikhamxay Parkkading 1 15 2,081 2,081 310,580,000 0
127 Village development fund Savannakhet Nong 1 5 124 124 15,469,000 386,000,000 128 Village development fund Savannakhet Nong 1 4 195 21 98,925,000 90,000,000 129 Saving group Vientiane Phonhong 1 19 2,193 1,054 1,571,806,000 57,000,000 131 Nam Ngume Reservoir fund Vientiane Phonhong 1 3 175 72 73,192,000 39,500,000 132 Village development fund Vientiane Phonhong 1 2 258 146 126,570,000 0 133 Saving Group(LWU) Vientiane Thoulakhom 1 28 7,861 7,074 10,295,882,000 840,000,000
135 Nam Ngume Reservoir fund (LWU) Vientiane Thoulakhom 1 5 410 194 402,718,000 0 136 Revolving fund for retired officers Vientiane Feuang 1 1 120 120 235,847,000 0 137 Village development fund Vientiane Feuang 1 20 2,769 1,716 2,455,038,000 30,700,000
138 Village development fund Vientiane Viengkham 2 18 612 612 173,639,000 634,602,000 139 Nam Ngume Reservoir fund (LWU) Vientiane Viengkham 1 5 218 218 25,225,000 0 140 Retry staff Fund of village level Vientiane Viengkham 1 1 220 165 151,483,000 189,280,000
142 Nam Ngume Reservoir fund (LWU) Vientiane Kasy 1 16 2,964 1,365 222,624,000 657,499,000 143 Nam Ngume Reservoir fund (LWU) Vientiane Vangvieng 1 15 1,477 402 542,780,000 138,079,000 147 Village development fund Vientiane Kasy 1 7 1,882 980 2,714,392,000 6,820,000,000 149 Nam Ngume Reservoir fund (LWU) Vientiane Hinherb 1 12 756 720 164,716,000 956,200,000 150 Village development fund Vientiane Phonhong 1 7 241 126 238,557,000 157,140,000 151 Saving Group(LWU) Vientiane Viengkham 1 14 3,283 2,498 1,680,435,000 1,535,228,000 153 Village development fund Vientiane Xanakharm 1 2 47 107 27,000,000 4,000,000
154 Nam Ngume Reservoir fund (LWU) Vientiane Feuang 1 10 440 331 158,035,000 0 157 Saving Fund Nayao Village Vientiane Meun 1 1 36 12 36,000,000 0 159 Nam Ngume Reservoir fund (LWU) Vientiane Hom 1 15 559 190 111,575,000 434,194,000 175 Nam Ngume Reservoir Development project of Pek
district Xiengkhuang Pek 1 26 924 550 512,639,000 195,517,000
176 Xiengkhoung Provincial Consolidation Front Organisation
Xiengkhuang Pek 1 3 698 698 1,397,595,000 0
177 Village development fund Xiengkhuang Pek 2 6 284 223 62,490,000 0

90
179 Proverty Reduction Fund Xiengkhuang Pek 3 23 1,147 908 242,188,000 2,357,936,000 180 Village development Fund Xiengkhuang Kham 1 5 323 185 52,760,000 0
182 Village development Fund Xiengkhuang Khoune 1 5 282 141 64,230,000 0 183 Village development Fund Xiengkhuang Phookood 1 2 91 62 28,050,000 0 184 Nam Ngume Reservoir Development project of
Phoodood district Xiengkhuang Phookood 1 17 254 231 449,244,000 48,173,000
185 Village development fund, Construction and Rural Development Office
Xiengkhuang Phaxay 1 9 1,402 609 231,000,000 130,000,000
186 Thongkhankham Credit and Saving Unit Vientiane Capital Chanthabuly 1 31 1,356 255 1,334,759,000 2,191,231,000 190 Village development fund(LWU) Vientiane Capital Sikhottabong 1 54 8,509 3,411 8,557,266,000 8,717,045,000 191 CODI Vientiane Capital Sikhottabong 15 188 19,062 7,014 11,685,021,000 11,491,796,000 193 Saving Group(LWU) Vientiane Capital Xaythany 1 102 35,030 9,811 53,800,873,000 62,443,147,000 196 Former Soilder development fund (sharing Fund) Vientiane Capital Naxaithong 1 53 529 50 86,652,000 41,900,000 197 Village development fund(LWU) Vientiane Capital Naxaithong 1 55 20,087 9,108 23,655,011,000 27,244,559,000 199 Saving Group(LWU) Vientiane Capital Parkngeum 1 53 11,919 5,229 20,778,296,000 19,756,000,000 202 Village development fund Vientiane Capital Chanthabuly 1 33 5,678 894 7,945,607,000 0
204 Saving Group (LWU) Nongneing Vientiane Capital Xaysetha 1 1 768 295 2,331,269,000 2,492,260,000 205 Village development fund, Saysettha district Vientiane Capital Xaysetha 1 44 8,883 5,203 10,609,235,000 855,660,000
207 Saving group Vientiane Capital Sisattanak 1 37 2,758 256 5,326,048,000 0 208 Saving group Vientiane Capital Hadsaifong 1 33 3,692 1,262 2,268,584,000 589,053,000 209 Bor Oh Village Credit and Saving Fund Vientiane Capital Hadsaifong 1 11 2,691 140 856,065,000 24,994,000 211 Village development fund Vientiane Capital Sangthong 1 37 5,367 2,896 6,282,244,000 3,954,136,000 212 Village development fund Vientiane Capital Sangthong 1 18 1,749 1,299 873,235,000 0 217 Namngeum Reservior Development Project Vientiane Hom 1 14 510 303 22,300,000 203,000,000 070 Provincial Lao front office Oudomxay Xay 1 5 12 12 5,475,000 2,720,000 072 Village development fund (GAA) Oudomxay Xay 1 10 620 400 26,580,000 106,388,000
073 Village development fund Oudomxay Xay 1 1 38 38 1,060,000 3,737,000 075 Village development fund Oudomxay Xay 1 2 112 38 117,878,000 98,900,000 076 Village development fund Oudomxay Xay 2 20 1,070 1,036 148,052,000 67,819,000 077 Village development fund Oudomxay Xay 1 1 142 71 340,681,000 191,300,000 078 Village development fund Oudomxay La 1 7 345 102 133,875,000 12,200,000 079 Village development fund Oudomxay Namor 1 4 149 38 45,714,000 45,714,000 080 Village development fund, Construction and Rural
Development Office Oudomxay Namor 1 9 480 468 36,283,000 840,673,000
081 Village development fund Oudomxay Nga 1 14 827 64 23,851,000 38,500,000
082 Village development fund, Construction and Rural Development Office
Oudomxay Nga 1 12 653 577 24,834,000 827,725,000
083 Village development fund Oudomxay Beng 1 2 203 49 50,901,000 50,901,000 084 Village development fund, Construction and Rural
Development Office Oudomxay Beng 1 7 765 549 41,807,000 870,159,000
085 Village development fund, Construction and Rural Development Office
Oudomxay Hoon 1 6 587 555 69,628,000 868,307,000
086 Village development fund Oudomxay Hoon 1 5 367 214 203,501,000 9,841,000

91
087 Village development fund Oudomxay Parkbeng 1 4 375 81 49,385,000 49,385,000 088 Village development fund, Construction and Rural
Development Office Oudomxay Parkbeng 1 8 510 473 14,223,000 806,589,000
089 Development community of NCA Bokeo Pha oudom 1 7 287 122 11,871,000 95,164,000 090 Development community of NCA Bokeo Huoixai 1 13 582 458 44,495,000 150,368,000
094 Pak Hao Village Fund Bokeo Huoixai 1 1 97 32 197,829,000 203,000,000 095 Livestock livelihood supporting project in Northern
province Luangnamtha Namtha 4 10 933 428 327,700,000 1,259,623,000
097 Village Development Fund Luangnamtha Namtha 1 7 303 250 383,425,000 30,000,000 098 GIZ Access to Finance for the Poor Luangnamtha Namtha 2 83 4,858 1,700 841,256,000 315,234,000 101 ACCU Luangnamtha Namtha 2 4 653 653 731,793,000 708,816,000
104 ACCU Luangprabang Luangprabang 11 18 657 1,308 1,061,607,000 1,061,607,000 107 LWU Luangprabang Luangprabang 3 43 3,440 997 1,349,508,000 1,286,114,000 108 Village development fund, Construction and Rural
Development Office Phongsaly Phongsaly 2 17 506 506 12,695,000 1,123,420,000
110 Woman union office Phongsaly Nhot ou 1 2 6 6 8,000,000 5,000,000 113 LWU/EU Phongsaly Boontai 1 20 321 321 52,536,000 586,334,000 115 GAA Phongsaly May 1 21 663 465 23,274,000 6,500,000 117 Village Development Fund Phongsaly Khua 1 15 375 375 3,515,000 274,705,000 118 Phapat area credit and saving Fund Huaphanh Xamneua 1 9 347 208 61,569,000 124,789,000
119 Ham-Van area credit and saving Fund Huaphanh Xamneua 1 56 2,242 1,739 319,326,000 929,345,000 121 Village development fund of Xiengkhor district Huaphanh Xiengkhor 1 11 810 116 101,642,000 233,380,000 122 Saving group Viengsay district Huaphanh Viengxay 1 8 274 167 164,000,000 217,482,000
123 Village development fund Huaphanh Huameuang 1 25 769 569 9,618,000 0 124 Credit and Saving Xamtai district UNODC Huaphanh Xamtay 1 18 746 658 116,998,000 506,985,000 125 Consolidate Saving Group (PRF) Huaphanh Xamtay 1 6 472 334 412,493,000 501,994,000 126 Saving group Sopboa district Huaphanh Sopbao 1 7 319 108 304,876,000 373,163,000
162 Labour and Social Welfare Department of Xayabouly
Province
Xayabury Xayaboury 3 9 946 295 483,591,000 571,110,000
163 Village development fund Xayabury Xayaboury 2 71 6,000 4,439 5,721,870,000 207,187,000
167 Village development fund Xayabury Hongsa 1 30 2,969 1,199 709,305,000 111,873,000 168 Village development fund Xayabury Ngeun 1 21 2,014 1,608 629,087,000 0 169 Village development fund Xayabury Xienghone 1 33 4,004 2,800 1,149,321,000 0
170 Village development fund Xayabury Phiang 1 8 1,385 881 2,122,402,000 0 171 Village development fund, Construction and Rural
Development Office Xayabury Parklai 1 15 1,849 1,390 1,778,190,000 311,060,000
172 Village development fund Xayabury Kenethao 1 28 1,774 930 577,855,000 0 173 Village development fund, Construction and Rural
Development Office Xayabury Botene 1 16 1,184 733 571,575,000 0
174 Village development fund Xayabury Thongmyxay 1 50 610 121 397,595,000 63,039,000 214 Village development fund Oudomxay Xay 7 63 4,631 2,862 817,395,000 148,302,000 216 Youth Fund Oudomxay Xay 1 52 2,266 19 55,724,000 36,476,000
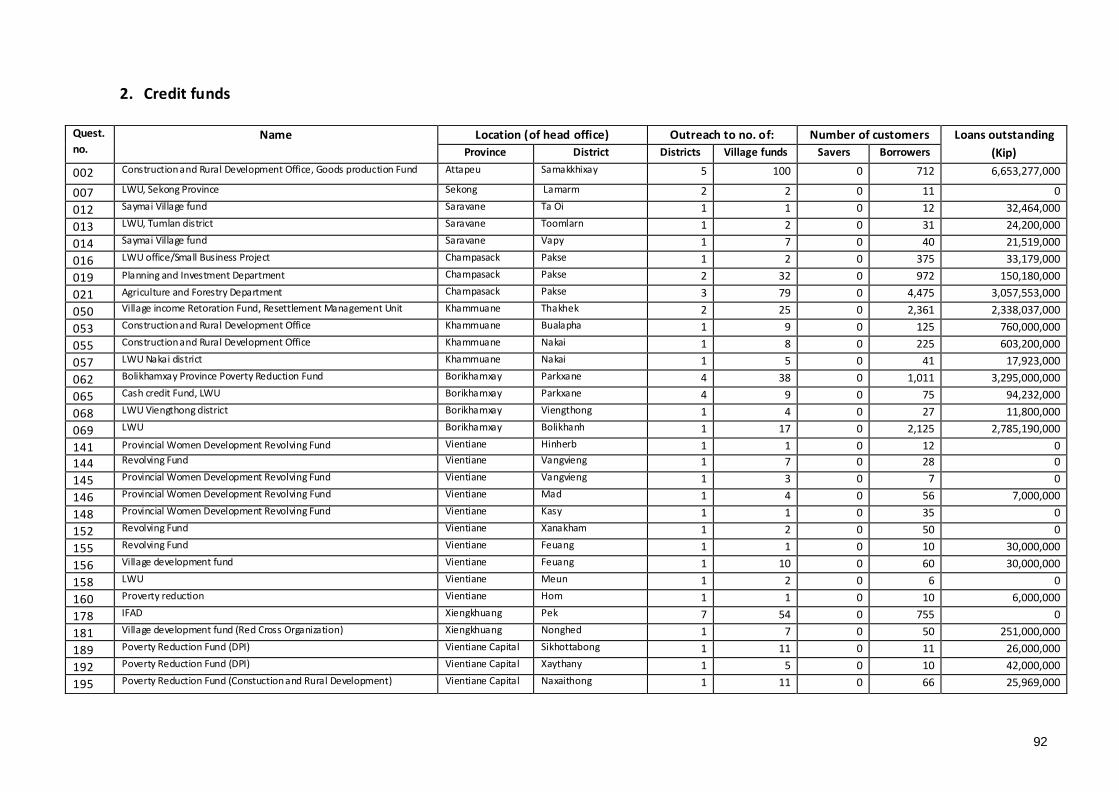
92
2. Credit funds
Quest.
no. Name Location (of head office) Outreach to no. of: Number of customers Loans outstanding
(Kip) Province District Districts Village funds Savers Borrowers
002 Construction and Rural Development Office, Goods production Fund Attapeu Samakkhixay 5 100 0 712 6,653,277,000
007 LWU, Sekong Province Sekong Lamarm 2 2 0 11 0
012 Saymai Village fund Saravane Ta Oi 1 1 0 12 32,464,000
013 LWU, Tumlan district Saravane Toomlarn 1 2 0 31 24,200,000
014 Saymai Village fund Saravane Vapy 1 7 0 40 21,519,000
016 LWU office/Small Business Project Champasack Pakse 1 2 0 375 33,179,000
019 Planning and Investment Department Champasack Pakse 2 32 0 972 150,180,000
021 Agriculture and Forestry Department Champasack Pakse 3 79 0 4,475 3,057,553,000
050 Village income Retoration Fund, Resettlement Management Unit Khammuane Thakhek 2 25 0 2,361 2,338,037,000
053 Construction and Rural Development Office Khammuane Bualapha 1 9 0 125 760,000,000
055 Construction and Rural Development Office Khammuane Nakai 1 8 0 225 603,200,000
057 LWU Nakai district Khammuane Nakai 1 5 0 41 17,923,000
062 Bolikhamxay Province Poverty Reduction Fund Borikhamxay Parkxane 4 38 0 1,011 3,295,000,000
065 Cash credit Fund, LWU Borikhamxay Parkxane 4 9 0 75 94,232,000
068 LWU Viengthong district Borikhamxay Viengthong 1 4 0 27 11,800,000
069 LWU Borikhamxay Bolikhanh 1 17 0 2,125 2,785,190,000
141 Provincial Women Development Revolving Fund Vientiane Hinherb 1 1 0 12 0
144 Revolving Fund Vientiane Vangvieng 1 7 0 28 0
145 Provincial Women Development Revolving Fund Vientiane Vangvieng 1 3 0 7 0
146 Provincial Women Development Revolving Fund Vientiane Mad 1 4 0 56 7,000,000
148 Provincial Women Development Revolving Fund Vientiane Kasy 1 1 0 35 0
152 Revolving Fund Vientiane Xanakham 1 2 0 50 0
155 Revolving Fund Vientiane Feuang 1 1 0 10 30,000,000
156 Village development fund Vientiane Feuang 1 10 0 60 30,000,000
158 LWU Vientiane Meun 1 2 0 6 0
160 Proverty reduction Vientiane Hom 1 1 0 10 6,000,000
178 IFAD Xiengkhuang Pek 7 54 0 755 0
181 Village development fund (Red Cross Organization) Xiengkhuang Nonghed 1 7 0 50 251,000,000
189 Poverty Reduction Fund (DPI) Vientiane Capital Sikhottabong 1 11 0 11 26,000,000
192 Poverty Reduction Fund (DPI) Vientiane Capital Xaythany 1 5 0 10 42,000,000
195 Poverty Reduction Fund (Constuction and Rural Development) Vientiane Capital Naxaithong 1 11 0 66 25,969,000

93
200 Poverty Reduction Fund, Construction and Rural Development Office Vientiane Capital 1 6 0 21 38,200,000
206 Poverty Reduction Fund Vientiane Capital Xaysetha 1 2 0 16 20,440,000
210 Poverty Reduction Fund Vientiane Capital Hadxaifong 1 4 0 16 74,755,000
039 Village development fund Savannakhet Vilabuly 1 1 0 31 124,000,000
091 Houyxai's youth developement fund Bokeo Huoixai 1 3 0 45 48,000,000
092 Pak Ngeum Development Fund ( VICO ) Bokeo Huoixai 1 7 0 247 240,879,000
071 Village development fund Oudomxay Xay 7 7 0 136 405,500,000
074 Grand Fund Oudomxay Xay 1 6 0 25 11,740,000
096 Rural Development office Luangnamtha Namtha 3 27 0 1,604 2,682,700,000
099 Gender Enterprise credit fund Luangnamtha Viengphoukha 1 3 0 69 0
100 Women Development Fund of village level Luangnamtha Namtha 2 4 0 67 82,000,000
103 Village Development Fund Luangprabang Luangprabang 5 58 0 3,923 3,030,300,000
106 World vision Luangprabang Luangprabang 6 121 0 6,150 1,902,957,000
111 LWU/Ausaid Phongsaly Boon neua 1 17 0 85 27,800,000
112 Woman Union office of Boun Neur district Phongsaly Boon neua 0 20 0 520 40,000,000
114 LWU/Ausaid Phongsaly Boontai 1 3 0 15 16,963,000
116 Rural development Phongsaly Khua 2 28 0 928 893,784,000
164 Proverty Reduction Fund Xayabury Xayabury 3 22 0 196 929,664,000

94
Annex 4: Questionnaire
Lao People’s Democratic Republic
Peace Indepdence Democracy Unity Prosperity
Ministry of Planning and Investment National Economic Research Institute
Questionnaire
Microfinance (in cash) Statistical Survey
January to December 2009
Section 1: General Information
1.1. Questionnaire code
1.2. Province: ……………………………………………
1.3. District:……………………………………………
1.4. Village: ……………………………………………...
1.5. Name of Office/Project: ……………………………………………
1.6. Type of microfinance 1. MFI 2. SCU
3. Village Fund Promoter (VFP)
1.7. Location of office: Urban Rural
1.8. Starting year of operation: ………………………………………
1.9. Name of respondent: ……………………………………………
1.10. Position: ……………………………………………
1.11. Mobile: ……………………………………………
1.12. Office phone No./Fax:……………………………………………
Quality Control Record
Date Month Year Respondent’s Name Phone Number
1.13. Data Collection
1.14. Checking
1.15. Data Entry

95
Section 2: Information on Operations
2.1. Main organization that takes responsibility......................................................
2.2. At present, does your office cooperate with other organization in operating/managing/monitoring of
credit and savings? Single answer ( )
1. Self-operation
2. Co-operation
2.3. If co-operation, which organization (partner) are you co-operating with? Multiple answers ( )
1. Planning Office (Office = district or provincial office)
2. Lao Women Union Office
3. Labour and Social Welfare Office
4. Forestry and Agriculture Office
5. Youth Union Office
6. Public Health Office
7. Trade Union Office
8. Financial Office
9. Lao Front Construction Office
10. Rural Development Office
11. Poverty Reduction Fund
12. Bank of the Lao PDR
13. World Bank
14. Asian Development Bank
15. International Labour Organization (ILO)
16. European Union
17. Lux-Development
18. German Technical Cooperation (GTZ)
19. German Cooperative and Raiffeisen Confederation (DGRV)
20. Asian Confederation of Credit Unions (ACCU)
21. Stone Family Foundation
22. World Vision
23. German Agro Action
24. Nam Theun 2 Power Company
25. Theun Hinboun Power Company
26. Phu Bia Mining
27. Sepon Mining
28. Other (Specify) .....................
29. Other (Specify)...................
2.4. Are there any organizations providing financial support to your office?
1. Yes 2. No
2.4.1. Total amount of financial support..........................kip
Of which: 2.4.1.1 loan........................kip
2.4.1.2. Grant......................Kip
2.5. How many full-time officers are there in your office? ................................Persons,
2.5.1. Female.....................persons
2.5.2. Male.........................person
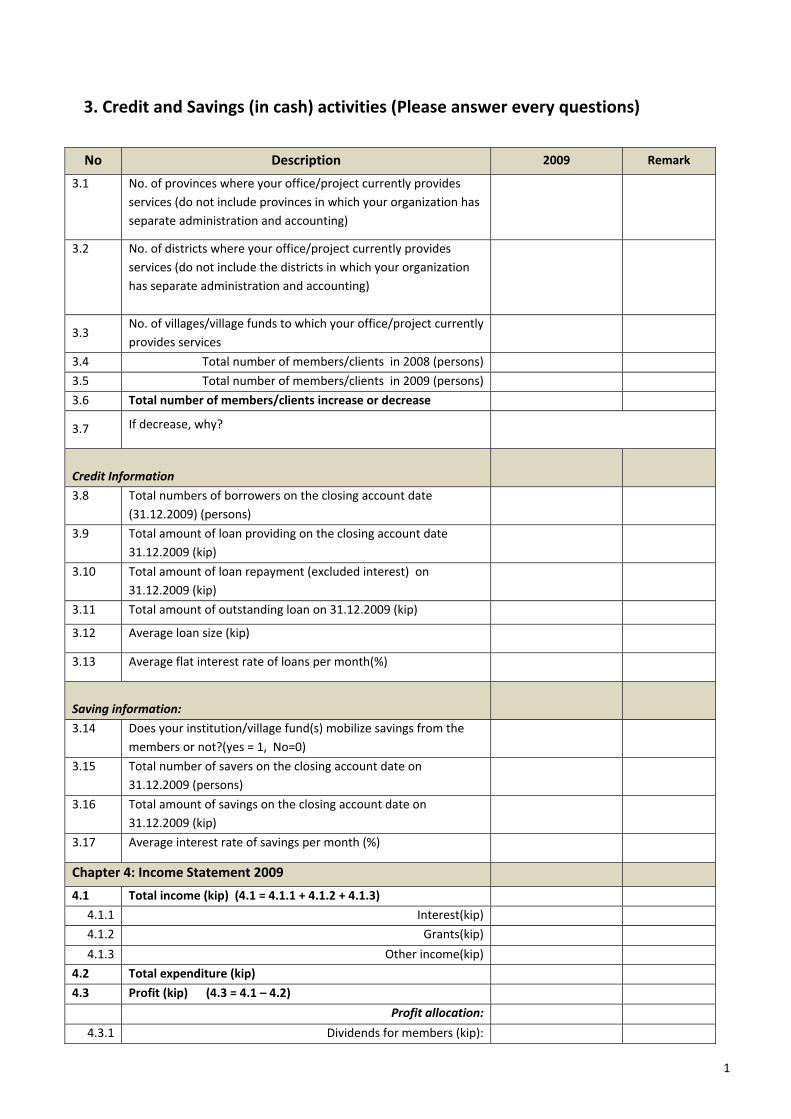
1
3. Credit and Savings (in cash) activities (Please answer every questions) No Description 2009 Remark
3.1 No. of provinces where your office/project currently provides services (do not include provinces in which your organization has separate administration and accounting)
3.2 No. of districts where your office/project currently provides services (do not include the districts in which your organization has separate administration and accounting)
3.3 No. of villages/village funds to which your office/project currently provides services
3.4 Total number of members/clients in 2008 (persons)
3.5 Total number of members/clients in 2009 (persons)
3.6 Total number of members/clients increase or decrease
3.7 If decrease, why?
Credit Information
3.8 Total numbers of borrowers on the closing account date (31.12.2009) (persons)
3.9 Total amount of loan providing on the closing account date 31.12.2009 (kip)
3.10 Total amount of loan repayment (excluded interest) on 31.12.2009 (kip)
3.11 Total amount of outstanding loan on 31.12.2009 (kip)
3.12 Average loan size (kip)
3.13 Average flat interest rate of loans per month(%)
Saving information:
3.14 Does your institution/village fund(s) mobilize savings from the members or not?(yes = 1, No=0)
3.15 Total number of savers on the closing account date on 31.12.2009 (persons)
3.16 Total amount of savings on the closing account date on 31.12.2009 (kip)
3.17 Average interest rate of savings per month (%)
Chapter 4: Income Statement 2009
4.1 Total income (kip) (4.1 = 4.1.1 + 4.1.2 + 4.1.3)
4.1.1 Interest(kip)
4.1.2 Grants(kip)
4.1.3 Other income(kip)
4.2 Total expenditure (kip)
4.3 Profit (kip) (4.3 = 4.1 – 4.2)
Profit allocation:
4.3.1 Dividends for members (kip):
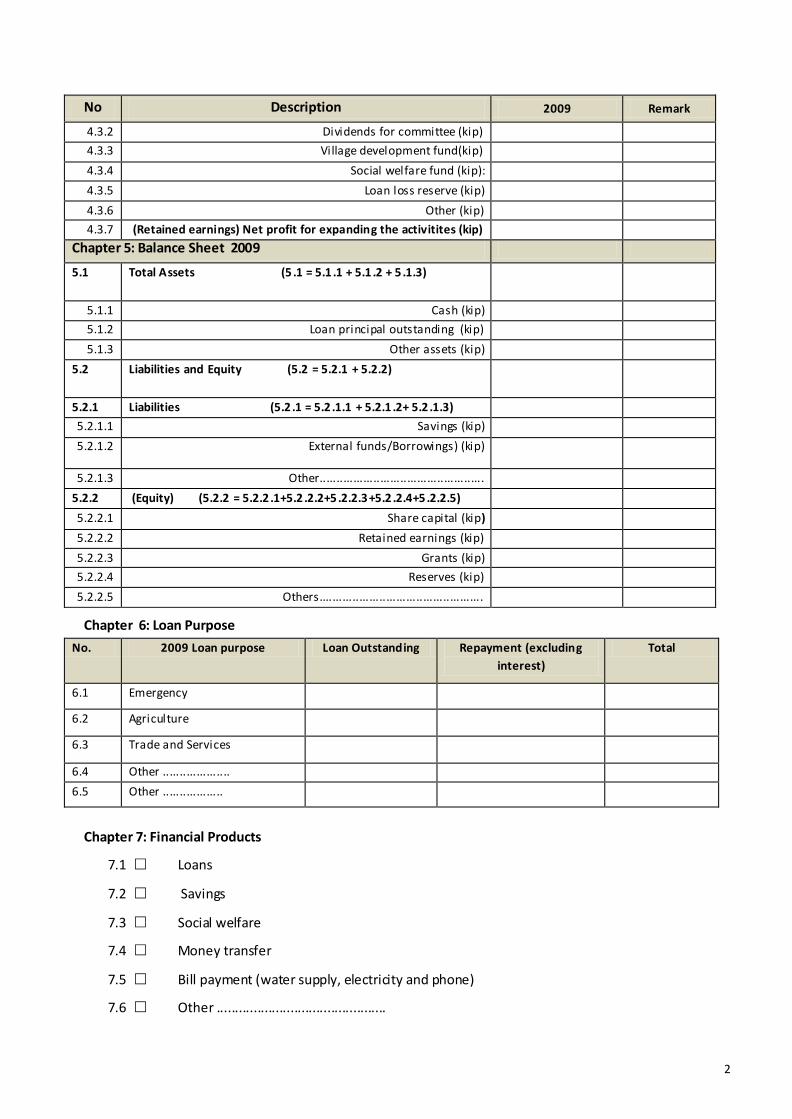
2
No Description 2009 Remark
4.3.2 Dividends for committee (kip)
4.3.3 Village development fund(kip)
4.3.4 Social welfare fund (kip):
4.3.5 Loan loss reserve (kip)
4.3.6 Other (kip)
4.3.7 (Retained earnings) Net profit for expanding the activitites (kip)
Chapter 5: Balance Sheet 2009
5.1 Total Assets (5 .1 = 5.1 .1 + 5.1 .2 + 5 .1.3)
5.1.1 Cash (kip)
5.1.2 Loan principal outstanding (kip)
5.1.3 Other assets (kip)
5.2 Liabilities and Equity (5.2 = 5.2.1 + 5.2.2)
5.2.1 Liabilities (5.2 .1 = 5.2 .1.1 + 5.2.1 .2+ 5.2 .1.3)
5.2.1.1 Savings (kip)
5.2.1.2 External funds/Borrowings) (kip)
5.2.1.3 Other.................................................
5.2.2 (Equity) (5.2.2 = 5.2.2 .1+5.2 .2.2+5.2.2.3+5.2 .2.4+5.2.2.5)
5.2.2.1 Share capital (kip)
5.2.2.2 Retained earnings (kip)
5.2.2.3 Grants (kip)
5.2.2.4 Reserves (kip)
5.2.2.5 Others.................................................
Chapter 6: Loan Purpose
No. 2009 Loan purpose Loan Outstanding Repayment (excluding
interest)
Total
6.1 Emergency
6.2 Agriculture
6.3 Trade and Services
6.4 Other ....................
6.5 Other ..................
Chapter 7: Financial Products
7.1 Loans
7.2 Savings
7.3 Social welfare
7.4 Money transfer
7.5 Bill payment (water supply, electricity and phone)
7.6 Other ..............................................

Published by Deutsche Gesellschaft für Internationale Zusammenarbeit (GIZ) GmbH
Lao-German Development Cooperation
Watnak Nyai Road,Ban ThaphalanexayPO Bok 9233Vientiane, Lao PDR
T: +856 21 353605F: +856 21 312408E: [email protected]: www.giz.de/laos