Glycemic Index, Oxidized LDL, and CHD Risk · Glycemic Index, Oxidized LDL, and CHD Risk Arash...
87
Glycemic Index, Oxidized LDL, and CHD Risk By Arash Mirrahimi A thesis submitted in conformity with the requirements for the degree of Master of Science Graduate Department of Nutritional Sciences University of Toronto © Copyright by Arash Mirrahimi (2012)
Transcript of Glycemic Index, Oxidized LDL, and CHD Risk · Glycemic Index, Oxidized LDL, and CHD Risk Arash...
Glycemic Index, Oxidized LDL, and CHD Risk
By
Arash Mirrahimi
A thesis submitted in conformity with the requirements for the
degree of Master of Science
Graduate Department of Nutritional Sciences
University of Toronto
© Copyright by Arash Mirrahimi (2012)

ii
Glycemic Index, Oxidized LDL, and CHD Risk
Arash Mirrahimi
Master of Science
Department of Nutritional Sciences
University of Toronto
2012
Abstract
The aim was to determine whether the dietary glycemic index (GI) related to coronary
heart disease (CHD) risk and whether oxidized LDL could explain this relation. Nine
prospective cohorts of GI or glycemic load (GL) associations were pooled in a meta-
analysis and showed an increased risk of CHD for high GI (near significant at RR=1.13,
95%CI; 1.00-1.26) and GL diets (significant at RR=1.40, 95%CI; 1.17-1.68), both with
significant evidence of heterogeneity (P<0.07). Sera from 151 type 2 diabetics who
completed a 6-month trial of a low GI diet demonstrated no treatment difference in
measures of oxidative damage. However, when data from both treatments were pooled,
oxidized LDL as a marker of CHD risk inversely related to low GI carbohydrate intake. We
conclude that GI and GL relate to CHD and oxidative damage to LDL may explain part of
this association.
Abstract Word Count: 140

iii
ACKNOWLEDGEMENT
My life has been an unpredictable journey to say the least, but I can say with certainty that I have
had great fortune and I have been blessed with many great people in my life.
First and foremost, I thank my parents, Ali and Roohi, without whom not only would I not exist but
without their endless sacrifices I would not be where I am today. They have provided me and my brother with
all that they possess, including their heart and soul; indeed, giving us their life essence. My brother, also, has
done nothing less. He has been my guide, my shield and my confidant throughout my life. My gratitude
towards them is unfathomable and I cannot possibly express them in any words.
My friends have formed the paths I took and helped shape the person I am today, so I thank them
for being by my side and guiding me for the years that have come and gone. I hope to always have them in
my life. I thank them all, especially Augie (Augustine Marchie) who introduced me to our research group and
tremendously changed the course of my life.
I doubt my Master's program has been like anyone else's experience and it all began with my
mentor, and my friend, John Sievenpiper. I cannot possibly imagine how my life would have been without
John's support, guidance, and encouragement. He introduced me to nutrition, and showed me how to
become the best that I can be. He is the reason I have been blessed with so many opportunities; he is the
reason I was granted a graduate position. I am forever indebted to John and he will always have a special
place in my life and heart. I am honored to be his first official M.Sc. student; his current and future mentees
and students are and will be extremely fortunate and blessed.
My M.Sc. has allowed me to be involved in projects that I know will significantly change the world,
and this feeling of gratification is all owed to my supervisor and mentor Dr. David Jenkins. He has taught me
much about scientific methodology, research, and medicine, but most importantly I can say that he has
taught me as much about life as my parents have and helped me recognize the intricacies of the academic
life. I hope to make him proud in the future and wish to say that if I ever achieve anything of importance in
my life, it will be to a large extent because of him, what I learned from him and the opportunities he so
acceptingly granted me. I will always be indebted to him.
I would further like to thank my advisory committee, Drs. Bazinet, Beyene, and Hanley whose
guidance and wisdom formed the basis of this body of work and helped me through the rigors of this
research program.
Last, but certainly not least, I would like to thank our group and my colleagues whose support has
been invaluable and critical to my performance and livelihood. I would like to thank Dr. Russell de Souza, Dr.
Livia Augustin, Dr. Cyril Kendall, Dr. Dorthea Faulkner, Ms. Amanda Carleton, Mr. Amin Esfahani, Mr. Chris
Ireland, Ms. Sandra Mitchell, Ms. Darshna Patel, Ms. Sandhya Sahye-Pudaruth, and Ms. Kristie Srichaikul. I
would like to especially thank Ms. Laura Chiavaroli whose help and continuous support over the last year
made possible many of my achievements.

iv
TABLE OF CONTENTS
Chapter Title Page
Abstract............................................................................................................ii
Acknowledgement...........................................................................................iii
Table of Contents........................................................................................iv-vi
List of Abbreviations.................................................................................vii-viii
List of Figures.................................................................................................ix
List of Tables...................................................................................................x
1 Introduction................................................................................................1-3
2 Literature Review…..................................................................................4-20
2.1 Cardiovascular Disease.........................................................................5-6
2.2 Type 2 Diabetes...................................................................................6-10
2.2.1 Diabetes Development and Current Treatment..................................6-8
2.2.2 Diabetes, Hyperglycemia and Oxidative Stress................................8-10
2.3 Oxidative Stress.................................................................................10-15
2.3.1 Oxidative Stress and Cardiovascular Disease................................10-11
2.3.2 Measurements of Oxidative Stress and Anti-oxidant Capacity.......12-14
2.3.3 Supplemental use of Anti-oxidants and CVD..................................14-15
2.4 The Glycemic Index...........................................................................15-19
2.4.1 The Concept...................................................................................15-16
2.4.2 Glycemic Index and Cardiovascular Disease......................................17
2.4.3 Glycemic Index and Diabetes.........................................................17-18
2.4.4 Glycemic Index and Oxidative Stress.............................................18-19
2.5 Synthesis............................................................................................19-20
3 Hypothesis, Objectives & Rationale..........................................................21
3.1 Hypothesis..............................................................................................22
3.2 Objectives...............................................................................................22
3.3 Rationale.................................................................................................22
4 Associations of Glycemic Index, Load and their Dose with CHD events:
A Systematic Review and Meta-analysis of Prospective Cohorts.....23-40
4.1 Abstract...................................................................................................24
4.2 Introduction…..........................................................................................25

v
4.3 Methods.............................................................................................25-27
4.3.1 Data Sources and Study Selection.................................................25-26
4.3.2 Data Extraction.....................................................................................26
4.3.3 Data Synthesis................................................................................26-27
4.4 Results...............................................................................................27-30
4.4.1 Search Results.....................................................................................27
4.4.2 Cohort Characteristics..........................................................................28
4.4.3 Glycemic index and Coronary Hear Disease..................................28-29
4.4.4 Glycemic Load and Coronary Hear Disease........................................29
4.4.5 Publication Bias....................................................................................30
4.5 Discussion..........................................................................................30-31
4.5.1 Figures............................................................................................32-39
4.5.2 Tables...................................................................................................40
5 Effect of a Low Glycemic Index Diet on Markers of Oxidative Damage in Type
2 Diabetes..........................................................................................................41-57
5.1 Abstract...................................................................................................42
5.2 Introduction..............................................................................................43
5.3 Methods………………………….………………….…………………….43-45
5.3.1 Participants.....................................................................................43-44
5.3.2 Study Protocol......................................................................................44
5.3.3 Dietary Interventions............................................................................45
5.3.4 Analyses.........................................................................................45-46
5.3.5 Statistical Analysis..........................................................................46-47
5.4 Results...............................................................................................47-49
5.4.1 Participants, Biochemical measurements, Blood Pressure, and CHD
Risk...............................................................................................................47
5.4.2 Oxidized Products...........................................................................47-48
5.4.3 Modification of Associations by change in dietary ORAC and Body
weight............................................................................................................48
5.4.4 Effect of Glycemic Excursion................................................................48
5.4.4 Antioxidant Supplementation..........................................................48-49

vi
5.5 Discussion..........................................................................................49-51
5.5.1 Figures............................................................................................51-53
5.5.2 Tables.............................................................................................54-57
6 Overall Discussion, Limitations and Future Research.......................58-63
6.1 Overall Discussion.............................................................................59-60
6.2 Limitations and Future Directions.......................................................60-62
6.3 Future Research................................................................................62-63
7 Summary.................................................................................................64-65
7. Summary...................................................................................................65
8 References..............................................................................................66-77

vii
List of Acronyms
Abbreviation Definition
8-OHdG – 8-Hydroxyeoxyguanosine
ADA – American Diabetes Association
AUC – Area under the curve
BMI – Body Mass Index
CD – Conjugated Dienes
CHD – Coronary Heart Disease
CRP – C-reactive protein
CV – Coefficient of Variance
CVD – Cardiovascular Disease
DASH – Dietary Approaches to Stop Hypertension
DNA – Deoxyribonucleic Acid
DTNB – 5,5’-Dithio-bis 2-Nitrobenzoic Acid
FDA – Food and Drug Administration
GI – Glycemic index
GL – Glycemic load
HbA1c– Glycosylated Haemoglobin
HDL – High-Density Lipoprotein
HDL-C – High-Density Lipoprotein Cholesterol
iAUC – Incremental area under the curve
IMT – Intima-media Thickness
LDL-C – Low-Density Lipoprotein Cholesterol
MDA – Malondialdehyde
MUFA – Monounsaturated Fatty Acid
Ox-LDL – Oxidized Low-Density Lipoprotein
ORAC – Oxygen radical absorbance capacity
PAI-1 – Platelet-Activator Inhibitor-1
PON1 – Paraoxonase 1
PUFA – Polyunsaturated Fatty Acid
ROS – Reactive Oxygen Species
RR – Relative Risk

viii
S-S – Disulfide Bond
SEM – Standard Error Mean
SFA – Saturated Fatty Acid
-SH – Thiol Group
STATA – Statistical Analysis System
TBARS – Thiobarbituric Acid Reactive Substances
TEAC – Trolox equivalent antioxidant capacity
Total-C – Total Cholesterol
TG – Triglycerides
TNF-α – Tumor Necrosis Factor - Alpha
USDA – United States Department of Agriculture

ix
List of Figures
Chapter 2
Figure 1. Pathogenesis of atherosclerosis in Cardiovascular disease
Figure 2. Type 2 Diabetes onset and progression
Figure 3. Hyperglycemia, Oxidative Damage and Diabetic Complications
Figure 4. Oxidized LDL and the development of atherosclerosis.
Figure 5. Oxidative modification of cellular macromolecules.
Figure 6. Reaction of a thiol group from a sulphur-containing amino acid with DTNB.
Figure 7- Determination of the glycemic index of foods
Figure 8. Hypothetical effect of feeding diets with a low glycemic index
Chapter 4
Figure 1- Systematic Review literature search flow.
Figure 2- Pooled risk estimate of all prospective cohorts investigating the association of
highest GI exposure with CHD events (including death and Myocardial Infarctions).
Figure 3- A priori stratification of GI cohorts by duration and sex.
Figure 4- Dose-response of GI and CHD risk. Piecewise linear trend estimation analysis of
CHD association with dietary GI in female cohorts.
Figure 5- Pooled risk estimate of all prospective cohorts investigating the association of
highest GL exposure with CHD events
Figure 6- A priori stratification of GL cohorts by duration and sex.
Figure 7- Test for Publication bias in the overall pooled analysis of CHD risk estimates
associated with High GI diets.
Figure 8- Test for Publication bias in the overall pooled analysis of CHD risk estimates
associated with High GL diets.
Chapter 5
Figure 1: Randomized Trial Consort statement.
Figure 2: Quadrant analysis- identifying participants with evidence of reduced and
increased glycemic excursions.
Figure 3: Comparison of change in TBARS from baseline in participants with reduced
glycemic excursions versus those with increased glycemic excursions.
Figure 4: Comparison of change in HDL-C from baseline in participants with reduced
glycemic excursions versus those with increased glycemic excursions.

x
List of Tables
Chapter 2
Table 1. Factors affecting the Glycemic Index of foods.
Table 2. Examples of the Antioxidants of some low GI Foods.
Chapter 4
Table 1. Table of study characteristics.
Chapter 5
Table 1. Baseline characteristics of randomized study participants.
Table 2: Nutritional profile of high-cereal fiber and low glycemic index diets.
Table 3: Mean study measurements and significance of treatment differences.
Table 4: Association analysis of markers of oxidative damage with low glycemic index
carbohydrate intake, ORAC, and CHD risk.

1
1. Introduction

2
1. Introduction
Cardiovascular disease is the leading cause of death worldwide and, with diabetes
as one of its major risk factors 1, it is expected to remain as such2, 3. Both risk of
cardiovascular disease and diabetes have been shown to be reduced through dietary
means 4, 5.
One dietary approach to CVD and diabetes risk reduction has been the use of low
glycemic index diets 6-8. The STOP NIDDM trial using Acarbose, the α-glucosidase
inhibitor which effectively turns an individual’s diet into a low glycemic index diet (i.e. lower
postprandial glycemic excursions), showed significant reductions in both the incidence of
cardiovascular events (49%) and the development of hypertension (34%) in pre-diabetic
subjects9. A meta-analysis of clinical trials of Acarbose further showed that incidence of
myocardial infarctions in type 2 diabetes was reduced10. However, a specific mechanism
through which lowering the glycemic index of diet reduces CVD is not fully understood.
The increased systemic oxidative damage caused by hyperglycemia in diabetes
has been proposed as the mechanism which links diabetes to heart disease11.
Furthermore, postprandial rises in glycemia have recently been shown to strongly correlate
with markers of oxidative damage and proposed to exacerbate the extent of oxidative
stress, suggesting an underlying mechanism for the effects of hyperglycemia on increased
risk of vascular complications 12, 13. Botero et al. have further shown that a low glycemic
index diet can improve total antioxidant capacity of the plasma in overweight and obese
individuals after one week 14. Further investigations are therefore warranted to determine
whether long term reductions in oxidative damage can be seen that can potentially lead to
reduced risk of heart disease.
We have therefore conducted studies to determine the association between
glycemic index and coronary heart disease in prospective cohorts and, as a potential
explanatory mechanism, whether a 6-month low glycemic index trial15 in type 2 diabetes
can reduce oxidative damage.
The following thesis work will first demonstrate the results of a systematic review
and meta-analysis of prospective cohorts on the association of glycemic index with
coronary heart events in Chapter 4. Chapter 5 will then present the results of a 6-month

3
clinical trial in diabetes on the effects of a low glycemic index diet on oxidative stress as a
potential mechanism for linking glycemic index with cardiovascular disease.

4
2. Literature Review

5
2.1 Cardiovascular Disease
Cardiovascular disease (CVD) is the leading cause of death globally and, with the
increasing prevalence of its major risk factors, specifically obesity and diabetes2, 3, 16, it is
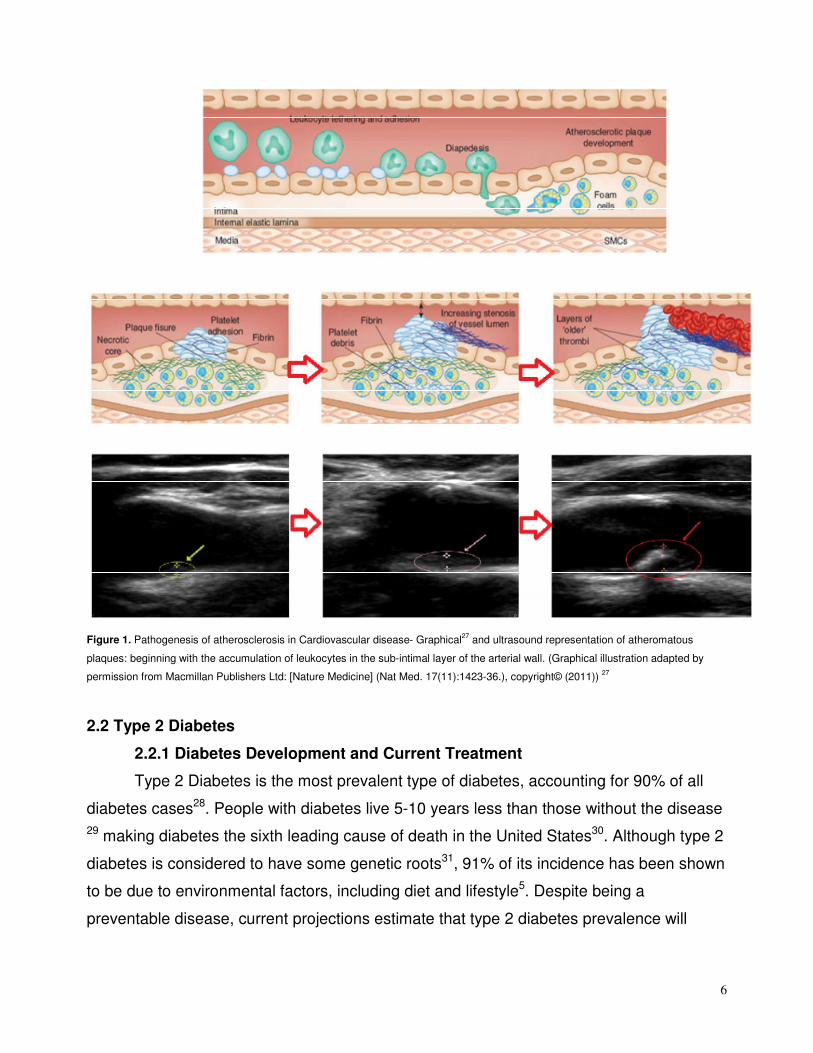
expected to maintain the greatest mortality burden for years to come. CVD pathogenesis is
characterized through the development and progression of atheromatous plaques in the
arterial wall (Figure 1). Although the development of atheroma has been proposed to
begin as early as adolescence 17, CVD is considered a preventable disease4. Unhealthy
dietary and lifestyle habits have been shown to account for more than 80% of coronary
heart events, which accounts for the majority of all CVD deaths4. Coronary heart disease
is caused by the narrowing or occlusion of small arteries that supply blood to the
myocardium with clinical events defined as fatal and non-fatal myocardial infarctions,
sudden cardiac death, and angina pectoris2, 3.
Habitual diet, aside from smoking and exercise, can be a major contributor to the
development of heart disease4. The common focus of current dietary guidelines for
reducing heart disease risk has been to reduce saturated and trans fat and possibly
cholesterol intake, with little emphasis on carbohydrate or protein consumption 18, 19.
However, with the recent re-assessment of the role saturated fatty acid in CVD20, 21,
carbohydrate quality has become of particular interest.
A number of epidemiological studies8, 22 on the relation between the rate of
digestion, i.e. glycemic index(GI), of carbohydrates and heart disease incidence have
shown that consumption of carbohydrate foods with slower absorption rates, i.e. low GI,
are associated with lower incidence of heart disease. Furthermore, although clinical trials
on the effect of low GI diets have been shown to improve heart disease risk factors 15, 23-26,
including blood pressure, HDL-C, clotting factors, and bodyweight, a direct mechanism
linking the quality of carbohydrates to heart disease remains to be defined.
6
Figure 1. Pathogenesis of atherosclerosis in Cardiovascular disease- Graphical
27 and ultrasound representation of atheromatous
plaques: beginning with the accumulation of leukocytes in the sub-intimal layer of the arterial wall. (Graphical illustration adapted by
permission from Macmillan Publishers Ltd: [Nature Medicine] (Nat Med. 17(11):1423-36.), copyright© (2011)) 27
2.2 Type 2 Diabetes
2.2.1 Diabetes Development and Current Treatment
Type 2 Diabetes is the most prevalent type of diabetes, accounting for 90% of all
diabetes cases28. People with diabetes live 5-10 years less than those without the disease
29 making diabetes the sixth leading cause of death in the United States30. Although type 2
diabetes is considered to have some genetic roots31, 91% of its incidence has been shown
to be due to environmental factors, including diet and lifestyle5. Despite being a
preventable disease, current projections estimate that type 2 diabetes prevalence will

7
more than double in the next two decades1. This is not surprising since global obesity, as a
precursor to diabetes32, is also rapidly rising33.
Diabetes onset corresponds to increased insulin resistance and a consequent
glucose intolerance which leads to an eventual constant state of hyperglycemia,
particularly postprandially. With poor control, as the disease progresses, this condition
worsens. Pancreatic beta cells become “exhausted” through excessive production of
insulin to compensate for a lack of response. Eventually, the body is no longer able to
produce enough insulin and glucose homeostasis breaks down. With a perpetual insulin
resistance and increased hepatic glucose output, blood glucose levels continue to rise
without intervention.(Figure 2)31.
Prediabetes
Diabetes
Insulin resistance ↑
β-cell dysfunction ↑
Constant hyperglycaemia
Chronic insulin resistance
β-cell failure
Postprandial
hyperglycemia
Increased insulin
resistance
Decreased insulin
secretion
Hyperinsulinaemia ↑ Glucose toxicity ↑
Genetic factors and
acquired factors (obesity, age,
sedentary lifestyle)
Figure 2. Type 2 Diabetes onset and progression adapted by permission from BioMed Central Publishers Ltd: [Cardiovascular
Diabetology] (Cardiovasc Diabetol. 2007;6:20.), copyright© (2007) 31
.
8
The pathology and progression of type 2 diabetes has been shown to be associated
with a plethora of chronic conditions including not only cardiovascular disease but also the
microvascular complications of blindness and renal failure and more recently a realization
that this disease state is also associated with an increased risk of cancer 34-38.
To control and slow the progression of type 2 diabetes a large armamentarium of
pharmaceutical agents have been developed and clinical guidelines have been created to
prevent diabetes complications through improved diabetes control. Clinical guidelines
have stressed treatment and tight control of serum glycated haemoglobin (HbA1c)39, the
long term marker of glycemic control in diabetes, since raised HbA1c levels have been
shown to be significantly associated with increased cardiovascular events and
microvascular complications40, 41. However, despite this evidence, multiple trials aimed at
reducing cardiovascular complications using intensive pharmaceutical treatment of type 2
diabetes, i.e. target HbA1c of ≤6.0%, have not met expectations in terms of reducing heart
disease42, except for the case of Acarbose and possibly metformin, the two drugs which,
unlike insulin Secretagogues such as Gliclazide, do not increase insulin secretion and
have not been associated with the increased weight gain9, 43.
A meta-analysis of clinical trials of Acarbose has shown that that incidence of
myocardial infarctions in type 2 diabetes was significantly reduced10 and in the prediabetic
STOP NIDDM trial, Acarbose showed a significant 49% reduction in the incidence of
cardiovascular events9. This finding is particularly interesting since, as mentioned already,
many of the common antihyperglycemic medications increase insulin output from the
pancreas while Acarbose, an α-glucosidase inhibitor, lowers postprandial glycemic
excursions and insulin need by slowing the digestion of starchy foods, thereby turning the
diet into a low glycemic index diet. This interesting contrast in the approach to the
treatment of diabetes begs further investigation into the differences in pathology between
the effects of steady state of hyperglycemia and those of postprandial glycemic
excursions, i.e. is a constant high level of blood glucose more or less damaging than large
swings in blood glucose for the same mean 24 hour blood glucose level.
2.2.2 Diabetes, Hyperglycemia and Oxidative Stress
It has been proposed that hyperglycemia, the main feature of diabetes, leads to
reactive oxygen species (ROS) production both directly and indirectly11. During the final

9
stage of glucose metabolism in the cell, the electron transport chain of the mitochondria
naturally generates ROS. Although ROS can be neutralized with available endogenous
antioxidant system (e.g. superoxide dismutase and glutathione peroxidase), as glucose
concentrations rise in the cell and its environment, the production of ROS becomes greater
and can lead to the depletion of endogenous antioxidants and a surplus of ROS. Indirectly,
hyperglycemia has been proposed to be responsible for a cascade of events activating
several pathways which eventually lead to further ROS generation, mostly via the
depleting endogenous antioxidants and impairing their regeneration. These pathways
include: the polyol pathway, and the protein kinase C pathway. In the polyol pathway,
Aldose reductase reduces aldehydes generated by ROS to inactive alcohols and turn
glucose into sorbitol. At high glucose concentrations this pathway becomes very active
and, at the expense of NADPH as a co-factor, it leads to the depletion of reduced
glutathione (GSH) to reconstitute the oxidized NADPH, hence augmenting oxidative stress.
The protein kinase C pathway is activated as the concentrations of diacylglycerol rise
under hyperglycemia, the activated protein kinase C pathway in turn activates a plethora
of downstream enzymes which lead to the further depletion of endogenous antioxidants. 11.
The higher concentrations of ROS lead to greater inflammation and dysfunction of various
molecules leading to cell damage, especially endothelial cells, in turn resulting in the often
observed micro- and macrovascular complications in diabetes (Figure 3)44.
Figure 3. Hyperglycemia, Oxidative Damage and Diabetic Complications (From Diabetes, Vol. 54, 2005; 1-7, Reprinted with permission
from the American Diabetes Association. Copyright© (2005)) 44
.

10
The effects of postprandial hyperglycemia on oxidative stress have become of
particular interest since vascular endothelial cells have been shown to be their primary
targets 45-47. Postprandial hyperglycemia has been consistently shown to be associated
with increased risk of cardiovascular disease48. This link may be further substantiated
since studies in healthy volunteers have documented significant postprandial reductions in
the plasma antioxidant capacity with consumption of carbohydrate-containing foods49, 50.
Moreover, studies in diabetes have also confirmed the association of oxidative stress with
meal consumption, including: higher postprandial markers of oxidative damage with
increased malondialdehyde (MDA) and decreased serum protein thiol groups. In line with
the extreme disease state of diabetes, in which larger postprandial glycemic excursions
occur, oxidative stress levels have been shown to be higher and antioxidant defences
lower compared to those without diabetes49-51,
Most recently, it is the large glycemic fluctuations estimated as MAGE (Mean
Amplitude of Glycemic Excursuions) that have been shown to induce oxidative stress to a
greater extent than the steady state of hyperglycemia both in vitro47 and in clinical trials
assessed by similar HbA1c for flatter postprandial glucose rises 13. These studies suggest
that a high dietary GI by virtue of greater glucose fluctuations may be a source of oxidative
stress and thus may deplete endogenous antioxidant defences and further highlight the
need for investigations on the role of low glycemic index diets in oxidative damage and
vascular disease.
2.3 Oxidative Stress
2.3.1 Oxidative Stress and Cardiovascular Disease
Oxidative stress defines a state of imbalance between the production of reactive
oxygen species or reactive nitrogen species (ROS and RNS), which occurs naturally
through oxidative metabolism, and the endogenous antioxidant defences in a biological
system52. ROS and RNS are unstable molecules (e.g. superoxide, hydroxyl and
hydroperoxyl radicals for ROS; and nitric oxide and nitrogen dioxide for RNS), that can act
as oxidants. They readily donate their unpaired electron or extract electrons from other
molecules which lead to structural and functional alterations to those molecules53. They
are utilized by the phagocytes in the immune system to kill pathogens, but can also elicit
cytotoxic effects 54. When the amount of ROS or RNS rises above the endogenous

11
antioxidant capacity of the system, the ROS and RNS surplus begin to cause damage by
oxidizing particles such as proteins and lipids, especially protein thiols in serum and
conjugated dienes and TBARS in the lipid fraction. This state of oxidative damage has
been associated with many chronic diseases including diabetes and atheromatous plaque
55.
The oxidation of LDL-C lipid particles is known to increase their atherogenicity 56, 57
(Figures 1 and 4). Oxidized LDL (ox-LDL) is taken up by the arterial walls more rapidly
than unoxidized LDL and becomes trapped 56, 58. The deposited ox-LDL then induces an
increase in the expression of monocyte adhesive membrane proteins in the luminal
endothelial cells thereby drawing leukocytes into the subendothelial space (intimal layer)59.
The monocytes' scavenger receptors recognize and take up the ox-LDL56 which induces
the expression and release of various pro-inflammatory cytokines from the monocyte and
promotes their transformation into foam cells60. The pro-inflammatory cytokines then lead
to attraction of more monocytes into the subendothelial space, thereby creating a pro-
atherogenic cycle.
Figure 4. Oxidized LDL and the development of atherosclerosis. Reprinted, with permission, from the Annual Review of Nutrition,
Volume 25 © 2005 by Annual Reviews www.annualreviews.org. 60
. Abbreviations: LDL, Low-density lipoprotein; MM-LDL, minimally
modified low-density lipoprotein; ox-LDL, oxidized-low-density lipoprotein; ROS, reactive oxygen species; SR-A, scavenger receptor A,
ROS; reactive oxygen species, RNS; reactive nitrogen species, M-CSF; macrophage colony stimulating factor.

12
2.3. 2 Measurements of Oxidative Stress and Anti-oxidant Capacity
Measuring the extent of oxidative stress to infer potential physiological change and
anatomical damage is important because of the key role of ROS and RNS in the
development and progression of disease states such as diabetes and CVD. However,
since both ROS and RNS cannot be directly measured, due to their very short half-lives,
the use of indirect measurements have been devised to determine their effect on biological
molecules in the body (Figure 5), including DNA, proteins and lipids 61-65.
Figure 5. Oxidative modification of cellular macromolecules. Reprinted from Free Radic Biol Med, Vol. 26 Ed.1-2, de Zwart LL. et al.,
Biomarkers of free radical damage applications in experimental animals and in humans, pg. 202-226, Copyright © (1999), with
permission from Elsevier. 64
.

13
Protein oxidation is measured by the oxidation of side chains. The DTNB [5’, 5’-
dithio-bis(2-nitrobenzoic acid)] assay is commonly used to measure the oxidation of
sulphur containing amino acid side chains (cysteine and methionine) because the DTNB
molecule reacts with the thiol groups (-SH) (Figure 6). When more proteins are oxidized,
fewer thiol groups will be detected since disulfide bonds will have already been formed (S-
S). The thiol groups are considered one of the first lines of defence against oxidative
damage and their destruction is therefore a sensitive marker of overall antioxidant status .
However, they are rapidly degenerated which limits their value as long term markers of
oxidative stress.
Figure 6. A thiol group from a sulphur-containing amino acid reacting with DTNB as a measurement of the amount of unoxidized
proteins65
.
In the lipid fraction, the oxidation of LDL is of particular importance due to its
proposed implications in the development of atherosclerosis. There are multiple ways of
measuring oxidized LDL, two of the most commonly used include the measure of
conjugated dienes (CD) and thiobarbituric acid reactive substances (TBARS) in the LDL
extracts precipitated from serum. In the former, the amount of CD is measured directly by
spectrophotometry in the extracted LDL lipids66. In the latter, the lipid peroxidation product
malondialdehyde (MDA) is measured through its reaction with thiobarbituric acid, which is
added to the serum, and then spectrophotometrically quantified67.
In addition to the importance of endogenous antioxidants (e.g. Superoxide
dismutase and glutathione peroxidase), dietary components have been shown to modify
DNA damage and gene expression caused by oxidative stress68, 69. Methods have
therefore been developed to measure different foods' capacity of reducing oxidative
damage. Total Antioxidant Capacity (TAC) is the ability of molecules in total plasma to
quench ROS and RNS 70. Several assays with differing mechanisms exist to measure TAC,
including: the ferric reducing antioxidant power (FRAP), the Trolox equivalent antioxidant

14
capacity (TEAC), and the oxygen radical absorbance capacity (ORAC). These assays are
based on discrete underlying mechanisms that use different radical or oxidant sources and
thus generate distinct values which cannot be compared directly. Because of its biological
relevance to in vivo antioxidant efficacy, the ORAC assay is considered by some to be a
preferable method71. The ORAC assay measures the degree of inhibition of peroxy-
radical-induced oxidation by the compounds of interest in a chemical milieu. It measures
the value as Trolox equivalents per 100g of compound (µmolTE/100 g) and includes both
inhibition time and the extent of inhibition of oxidation by both hydrophilic (H-ORAC) and
lipophilic ORAC (L-ORAC) antioxidant compounds present in serum or food72.
2.3.3 Supplemental use of Anti-oxidants and CVD
Current literature on the supplemental use of antioxidants at best offers conflicting
results. Although benefits in reducing oxidative damage have been shown in some studies
with antioxidant supplementation (e.g. reduction in oxidized LDL with high doses of vitamin
E supplementation)73-75, large trials in heart disease have not found beneficial effects on
hard endpoints (e.g. the Medical Research Council and British Heart Foundation
(MRC/BHF) Heart Protection Study with long term supplementation of vitamin E, C and
beta-carotene daily in subjects at high risk of CHD)76. Some trials have even demonstrated
harmful effects, such as the increased risk of lung cancer and cardiovascular disease in
smokers supplemented with beta-carotene77, or the HOPE (Heart Outcomes Prevention
Evaluation) Study in high risk subjects which showed an increased rate of heart failure with
400IU/day of vitamin E supplementation78.
Antioxidants can become pro-oxidants in oxidative environments79 (i.e. cause more
harm), it is therefore important to determine specific therapeutic targets instead of giving
single high dose vitamin supplements to individuals under high oxidative stress conditions
at high risk. The preventing an oxidative environment itself as a whole may be a more
important and it may be more effective to target. This may be accomplished by
consumption of foods that may lowering the oxidative damage in the system through
metabolic modifications. Some support for this idea includes the results of a recent study
which tested a low glycemic index diet in overweight and obese individuals and
demonstrated significant improvements in the free radical quenching of plasma in one
week 14. Similar results have also been shown with the DASH diet, which also reduces the

15
glycemic index of the diet 80. Thus, greater benefits may be conferred as a result of both
reducing the likelihood of oxidative environments in vivo by slowly digested carbohydrates
and naturally occurring antioxidants of foods that do not pose a threat as pro-oxidants, but
further investigations are required. Indeed, studies of fruits and vegetables
2.4 The Glycemic Index
2.4.1 The Concept
In the past, carbohydrate foods have often been classified as "simple" or "complex"
based on their degree of polymerization, however, their impact on health may be better
described on the basis of their rate of digestion and the ensuing physiological effects. The
concept of the glycemic index (GI) helps identify carbohydrate-containing foods based on
their postprandial blood glucose responses81(Figure 7). Measured by comparing the area
under the blood glucose curve after consuming a standard amount of available
carbohydrate from a test food to the same amount of available carbohydrate from a
reference food (either glucose or white bread), the GI represents the incremental area
under the glucose curve (iAUC) of the test food as a percentage of that from the reference
food (Figure 7). Therefore, the dietary GI allows for the ranking of foods from those which
give rise to the highest blood glucose (high GI foods>100 GI units) (bread scale) to those
associated with the lowest blood glucose (low GI foods<70 units)82. Low GI foods include
vegetables, fruit, legumes, wholegrain breads while high GI foods include most refined
grain products such as white bread, potatoes and rice.
Figure 7. Determination of the glycemic index of foods.
Factors affecting the rate of glucose absorption and therefore the GI value include
the intrinsic characteristics of the food and the type and extent of food processing (Table

16
1). They include the ratio of amylose to amylopectin present in the raw food 83 and the type
of monosaccharide components, the amount and type of various dietary fiber84, 85, the
presence of large amounts of fat or protein (including the effect of addition of nuts and
peanuts to a meal)86-91, antinutrients such as phytic acid, lectins and tannins53, 92, 93,
nutrient-starch interactions as in wheat products 94, and the use of herbs and supplements
(e.g. ginseng) 95, 96. Food processing methods (e.g. extrusion, flaking, grinding, canning,
storing and cooking which can affect the particle size and the integrity of the starch
granules97 and plant cell walls98 can make the carbohydrate component more accessible
to digestive enzymes thereby increasing the GI 99, 100.
Increase GI Decrease GI
Nature of monosaccharide Glucose Fructose, galactose
Nature of starch Low amylase:amylopectin ratio High amylase:amylopectin ratio
Dietary fibre Low viscous fiber High viscous fiber (guar, β-glucans)
Ripeness Ripe fruit (e.g. yellow banana) Less ripe fruit (e.g. green banana)
Amylase inhibitors Lack of lectins, phytates Lectins, phytates
Nutrient-starch interaction Lack of protein and/or fat Protein and/or fat
Cooking method Flaking, popping Parboiling
Particle size Small particles (grinding) Large particles
Food storage Lack of cooling Cooling (e.g. cooled cooked potato)
Additional ingredients Lack of vinegar and/or alcohol Vinegar and/or alcohol
Factor
Nature
Processing
Table 1. Factors affecting the Glycemic Index of foods.
Reducing the rate of carbohydrate absorption by means of a low GI diet can result
in several health benefits, including: reduced insulin demand, improved blood glucose
control, and reduced blood lipid levels. All of the aforementioned factors may play
important roles in the prevention or management of both diabetes and cardiovascular
disease. To date, the GI of more than 700 foods have been tested and summarized in GI
tables101 which are used by health and food agencies for health claims and disease
guidelines and by scientists and health professionals in the assessment and construction
of low glycemic index diets.
17
2.4. 2 Glycemic Index and Cardiovascular Disease
Although 2 meta-analyses on clinical trials which assessed the effects of low GI
diets on major risk factors for CVD showed no treatment effect for low GI diets, most of the
included trials were, to the authors admission, too poor in quality and too short in duration
102, 103. Low-GI diets have, however, been shown to be associated with lower levels of risk
factors for coronary heart disease risk in large observational studies such as: higher high-
density lipoprotein cholesterol (HDL-C), lower triglycerides and C-reactive protein
(CRP)104-109.
At the beginning of the millenium 3 observational studies on the consumption of
high GI diets and their relation to coronary heart disease were published. Two of these8, 110
showed that high GI diets were associated with an increased risk of developing coronary
heart disease while one showed no significant relation between GI and CHD in men111.
There have since been 4 additional reports112-115 on men and 4 on women22, 112, 115, 116 with
similar mixed results. We have therefore pooled all these reports using meta-analyses to
re-assess the association between GI and CHD and presented in Chapter 4 of this thesis.
2.4.3 Glycemic Index and Diabetes
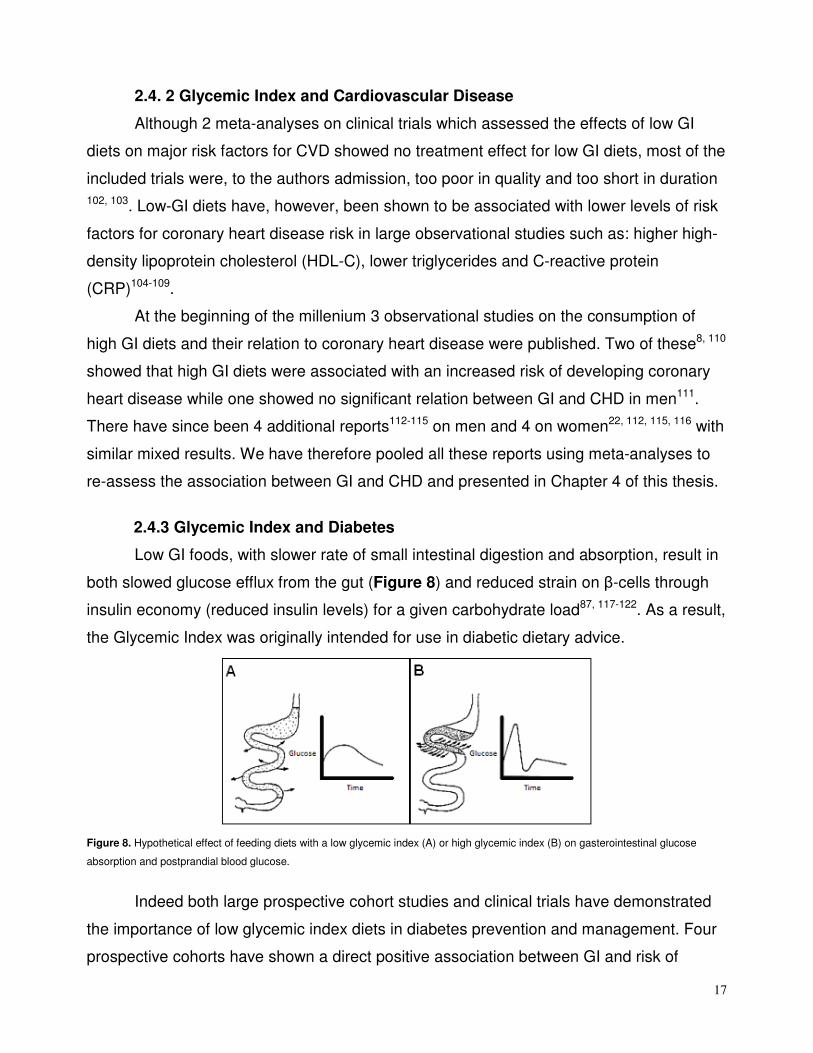
Low GI foods, with slower rate of small intestinal digestion and absorption, result in
both slowed glucose efflux from the gut (Figure 8) and reduced strain on β-cells through
insulin economy (reduced insulin levels) for a given carbohydrate load87, 117-122. As a result,
the Glycemic Index was originally intended for use in diabetic dietary advice.
Figure 8. Hypothetical effect of feeding diets with a low glycemic index (A) or high glycemic index (B) on gasterointestinal glucose
absorption and postprandial blood glucose.
Indeed both large prospective cohort studies and clinical trials have demonstrated
the importance of low glycemic index diets in diabetes prevention and management. Four
prospective cohorts have shown a direct positive association between GI and risk of

18
developing diabetes6, 7, 123, 124. Moreover, recent data from randomized controlled trials in
type 2 diabetes have shown that low-GI diets result in improved glycemic control, reduced
diabetic medication, or sustained reductions in postprandial glucose15, 109, 125, 126. Multiple
meta-analyses of clinical trials have conferred the beneficial effects of low GI versus high
GI interventions on glycemic control in type 2 diabetes103, 126-128.
Diabetes guideline organizations and health agencies worldwide have also offered
their consensus on the importance of the use of the glycemic index and glycemic load in
diabetes management including the American Diabetes Association129, the FAO/WHO
Scientific Update on carbohydrates in human nutrition130, the International Diabetes
Federation 131, the Diabetes and Nutrition Study Group of the European Association for the
study of Diabetes132, the Canadian Diabetes Association133, Diabetes UK134, Diabetes
Australia135, and Dietitians Association of Australia136.
2.4.4 Glycemic Index and Oxidative Stress
As mentioned earlier, postprandial glycemia has been shown to be strongly
associated with oxidative stress and lowered antioxidant defences13, 49, 50, 137-140. Since low
glycemic index diets have been shown to have a reduced rate of glucose absorption and
lower the postprandial glycemia it was of interest to investigate their effect on oxidative
stress.
There have only been 2 interventional studies on the effects of lowering the
glycemic index of a diet on measures of oxidative stress. The first was a three month trial
of acarbose141 in patients with impaired glucose tolerance which showed significant
improvements in measures of oxidized LDL. The second was a recent study by Botero et
al. 14 which showed significant improvements in total antioxidant capacity of the plasma in
overweight and obese subjects after one week on a low glycemic index diet. These results
and the demonstrated underlying physiological effects of low glycemic index diets (i.e.
lower postprandial glycemia) implicate the glycemic index with a potential causative link to
cardiovascular disease development. However, it should be noted that both studies were
short in duration and only one, with limited number of participants, actually utilized a
dietary approach. It is therefore important to determine the effects of low glycemic index
diets on oxidative stress in larger and longer randomized controlled trials.

19
It is, however, also important to consider that low glycemic index diets contain foods
with often high antioxidant content (e.g. fruit, nuts, and non-leafy legumes) (Table 2).
Therefore, consideration of the antioxidant capacity of low GI foods is important as part of
the assessment of the effects of a low glycemic index diet in type 2 diabetes.
Since type 2 diabetic participants often experience greater fluctuations in their
postprandial glycemia, the assessment of the effects of a low glycemic index diet on
markers of oxidative damage in a diabetic population is likely to be particularly relevant in
this situation. We therefore undertook the investigation of the effects of a low glycemic
index diet on markers of oxidative damage in 151 type two diabetic participants15 and also
attempted to adjust for the potential effect of antioxidants of low GI foods using the USDA
ORAC database on various foods.
GIORAC(µmol
TE/100 g)
Blueberries 72 4669
Strawberries 57 4302
Raspberries 48 5065
Blackberries 34 5905
Apples 48 3049
Oranges 57 2103
Almonds 21 4454
Peanuts 21 3166
Walnuts 20 13541
Kidney Beans 41 8606
Black Beans 47 8494
Lentils 41 7282
Food
Fruits
Nuts
Non-leafy Legumes
Table 2. Examples of the Antioxidant capacity of some low GI Foods. GI= Glycemic Index on the bread scale, ORAC= Oxygen Radical
Absorbance Capacity measure as µmol of Trolox Equivalence per 100 gram of food101, 142
. Significant correlation existed between 28
foods with various GI and ORAC values: r=0.47, p=0.012.
2.5 Synthesis
Taken together, although the current literature suggests that low glycemic index
diets may be important dietary tools for improving cardiovascular disease risk factors, a

20
direct association for GI with heart disease outcome prevention continues to show mixed
results in the large cohort studies, with some studies showing positive association while
some demonstrate no association. To Address this question we have carried out a meta-
analysis of the available prospective cohort reports to synthesize an aggregate analysis
and determine whether a direct association exists. This thesis will be then further assess
the effects of a low glycemic index diet on markers of oxidative damage in a long term
randomized clinical trial in type 2 diabetes as a potential mechanism to explain a directly
link between GI and heart disease.
21
3.Hypothesis, Objectives, and Rationale

22
3.1 Hypothesis
Consuming low glycemic index (GI) diets will lead to lower incidence of coronary
heart disease through a reduction in reactive oxygen species resulting from lower
postprandial glycemic excursions.
3.2 Objectives
Overall Objective: To determine whether low glycemic index (GI) diets will lead to lower
incidence of coronary heart disease and whether low GI diets are
associated with reduce oxidative stress.
1. To determine the pooled association of GI with CHD events and
explore potential association trends in a meta-analysis of prospective
cohorts of healthy individuals.
2. To determine whether a 6-month controlled low glycemic index
dietary intervention trial in type 2 diabetes has an effect on oxidative
damage to serum lipids and proteins, as assessed by CD and TBARS
in the LDL fraction and protein thiols in the serum, respectively.
3.3 Rationale
Although some studies have shown a benefit of low GI diets in diabetes and
cardiovascular disease there still remains a lack of consensus in the current literature on
the association of GI with heart disease. One mechanism through which CHD risk has
been proposed to be modified by GI is by lowering postprandial glycemic excursions. Low
postprandial excursions in turn may reduce production of reactive oxygen species (ROS).
ROS cause oxidative damage to serum proteins and lipids. These oxidized lipid particles
then are thought to be deposited in the arterial wall leading to the development of
arthrosclerosis and heart disease. We have therefore assessed the role of glycemic index
on CHD risk modification in a meta-analysis of prospective cohorts of healthy individuals
as well as LDL oxidation in type 2 diabetic participants.

23
4. Associations of Glycemic Index, Load and their
Dose with CHD events: A Systematic Review and
Meta-analysis of Prospective Cohorts

24
Associations of Glycemic Index, Load and their Dose with CHD events: A
Systematic Review and Meta-analysis of Prospective Cohorts
4.1 ABSTRACT
Background: Glycemic index (GI) and glycemic load (GL) have been associated with
Coronary Heart Disease (CHD) risk in some, but not all, cohort studies.
Aims: To assess the association GI and GL with CHD risk in cohort studies.
Methods: We searched MEDLINE, EMBASE, and CINAHL (through Oct 18, 2011) for all
prospective cohorts which assessed the associations of GI and GL with incidence of CHD.
Meta-analysis Of Observational Studies in Epidemiology (MOOSE) methodologies were
used. Measures of risk were pooled using random-effects models, expressed as relative
risk (RR) with heterogeneity assessed by χ2 and quantified by I2. Subgroups included sex
and duration of follow-up. Dose-responses were estimated for both GI and GL.
Results: Nine studies (n=296,849) were eligible. Pooled analyses showed a significant
increase in CHD risk for high GI (near significant at RR=1.13, 95%CI; 1.00-1.26) and GL
diets (significant at RR=1.40, 95%CI; 1.17-1.68), both with significant evidence of
heterogeneity (I2>43%, P<0.07). Subgroup analyses revealed only a significant
modification by sex, with the female cohorts showing significance for GI RR= 1.26 [95%CI;
1.17-1.68] and for GL RR=1.73 [95%CI; 1.39-2.16]. Only in female cohorts was a
significant linear regression seen between GI versus CHD risk (gradient, 0.15% [95%CI;
0.01-0.28]). Above a GI of 78 the gradient increased significantly (P=0.026) to 3.82%
[95%CI; 0.62-7.02].
Conclusion: High GI and GL diets were significantly associated with CHD events in
women but not in men. Linear piecewise trend estimation models suggested a threshold
effect for GI dose association with CHD in women.

25
4.2 INTRODUCTION
High risk lifestyle and dietary patterns have been proposed to account for more than
80% of all coronary events in western nations4. The predominant concern in heart disease
prevention has been saturated fatty acid (SFA) reduction, which has led to the widespread
therapeutic adoption of low- total fat, high carbohydrate diets as the standard dietary
approach to the management of Coronary Heart Disease (CHD) risk143, 144. However, in
recent meta-analyses of prospective cohorts, SFA intake was not significantly associated
with CHD and replacing SFA with carbohydrates further increased CHD risk20, 21. This
finding has further intensified the focus on carbohydrates, since diet rich in highly
processed carbohydrates can lead to raised triglycerides (TG)105, reductions in high-
density lipoprotein cholesterol (HDL-C)145, and increasing CHD risk146.
Carbohydrates with different physical form, particle size, chemical structure, and
fiber content alter the rate of starch digestion and their physiological response. The
glycemic index (GI) has been developed to characterize the rate of digestion of
carbohydrate foods following a carbohydrate food compared with a reference food81. Over
the last 3 decades, many dietary clinical trials have demonstrated that reducing the GI or
glycemic load (GL), the product of GI and the available carbohydrate content of a food147,
may improve CHD risk factors including: BMI, blood pressure, and serum cholesterol15, 23-
25, 109, 148-153. Cohort studies have also shown an association between high GI diets6, 7 and
development of hyperglycemia and diabetes further implicating GI in the progression to
CHD.
Despite the proposed physiological mechanisms154, published cohort studies in the
last decade have produced mixed results for the associations of GI and GL with CHD8, 22,
111, 113. We therefore undertook a systematic review and meta-analysis of prospective
cohort studies with healthy populations at baseline to determine whether associations exist
between GI and GL with CHD and whether there is a dose-response relationship between
GI and GL with CHD.
4.3 METHODS
4.3.1 Data Sources and Study selection
We conducted separate searches for all prospective cohort studies that assessed potential
associations between glycemic index or load and primary incidence of CHD (including

26
Myocardial Infarction or death due to CHD) in adults. We followed the Meta-Analysis of
Observational Studies in Epidemiology (MOOSE) guidelines for this report155. Electronic
databases (MEDLINE 1948-October Week1 2011, EMBASE 1980- 2011 Week 41,
CINAHL 1982-October 17 2011) were searched by two individuals independently;
searches were supplemented by manual searches through the reference lists of original
publications and review articles. The following search terms were used: “((Glycaemic or
Glycemic Index) or (Glycaemic or Glycemic Load)) and (Coronary Heart Disease or CHD
or Cardiovascular Disease or CVD or Myocardial Infarctions or MI) and (Prospective OR
Cohort)”. Titles and abstracts were initially reviewed to identify relevant reports by two
independent reviewers (AM, LC; both investigators); reviewers conducted a subsequent
full-text assessment for all studies where there was uncertainty to assess relevance.
Disagreements regarding eligibility were resolved through discussion with a third
adjudicator (DJAJ/RJD).
4.3.2 Data extraction
Two reviewers (AM, LC) independently reviewed and extracted relevant data
employing a standardized pro forma sheet with the first author and year of publication
used as study identifiers. Data extracted from each cohort included information about
sample size, population characteristics (age and sex), country of origin, follow-up duration,
method of collecting dietary information, outcome measures, exposure quantification, and
analytical methods, including adjustment parameters used for confounding factors. The
most complete multivariate adjusted risk estimates of GI and GL associations with CHD
events and their corresponding Confidence Intervals (CIs) were extracted as the main
endpoints. All authors of eligible reports were contacted to acquire data for each exposure
level for trend estimation regression analyses including number of events, person-years,
mean or median dose of GI and GL (All values were converted to bread scale if not
already reported as such, with bread scale= glucose scale÷0.70), and risk estimates with
corresponding CIs.
4.3.3 Data Synthesis
Data were analyzed using Review Manager (RevMan) 5.1.4 (Cochrane Library software,
Oxford, UK) and STATA version 11.0 (StataCorp, College Station, TX). The natural log-

27
transformed relative risks of CHD events (including MI) with corresponding standard errors
comparing the highest exposure level to the reference group from each cohort were
pooled in separate analyses for GI and GL using the generic inverse variance method with
random effects models in RevMan to allow for heterogeneity assessment. Inter-study
heterogeneity was tested by Cochrane’s Q (χ2) and quantified by the I2statistic, where
I2≥50 % is evidence of substantial heterogeneity. Regardless of P-value sensitivity
analyses were performed to identify sources of heterogeneity156 whenever I2≥50 %.
Potential publication bias was assessed visually by inspecting funnel plots of effect size
against the standard error and formally tested using Begg's and Egger's test in STATA 157,
158. Our a priori stratified analyses included sex and duration of follow-up, and whether
studies were more or less than 10 years, consistent with the 10-year Framingham Risk
Score159 approach and analysed using meta-regression in STATA. Studies which provided
adequate data for analysis of dose-response were used first in a random-effects
generalized least squares (GLST) linear regression model160, followed by a further
combined linear spline piecewise regression model using the MKSPLINE in STATA161, 162.
To determine the model with the best fit using MKSPLINE, a knot was introduced to create
2 segments (Linear Splines) within the GLST linear regression model. The knot was
progressively moved through the GI and GL exposure ranges by 0.5 and 5 unit increments,
respectively, to investigate the existence of a potential inflection point which would signify
a change in gradient in a piecewise trend model with statistical significance. Model χ2 and
Goodness-of-fit χ2 tests were performed to assess the validity of the regression models.
Statistical significance was defined as P<0.05 for all comparisons, except for Cochrane’s
Q (χ2), where significance was set at <0.10.
4.4 RESULTS
4.4.1 Search results
Figure 1 shows the flow of the literature applying the systematic search and
selection strategies. 440 eligible studies were identified by the search. A total of 9 studies
with 10 GI reports8, 22, 111-116 and 11 GL reports8, 22, 111-116, 163 were selected for analyses.
Seven 8, 22, 111, 113, 115, 116, 163 of the nine studies responded to our additional data requests
for dose-response analyses.

28
4.4.2 Cohort characteristics
The trial characteristics are shown in Table 1. The 9 studies contained 10 GI and
11 GL reports with CHD risk estimation with a total cohort of 214,0478, 22, 111-116 and
296,8498, 22, 111-116, 163 subjects, respectively. During 6-25 years of follow-up, there were a
total of 6820 coronary events. All studies used Cox proportional hazard models for CHD
risk estimation analyses, except for one study 112 which used restricted cubic spline
models. The most common confounders adjusted for included age, BMI, and cigarette
smoking, with full multivariate analyses outlined in Table 1. All cohorts excluded those with
documented CHD or major CHD risk factor at time of enrolment, with the exception of one
which included a 5% diabetic population114 but adjusted for diabetes at each level of
exposure. All analyses were stratified by sex. The majority of the studies (6 out of 9) used
either a semi-quantitative or quantitative Food Frequency Questionnaire (SFFQ or FFQ)8,
22, 113, 115, 116, 163, but three used diet records and/or diet history interviews111, 112, 114. All
studies used the International tables of glycemic index for assessing GI of different foods;
38, 111, 163 used the 1995 iteration164, 522, 112, 113, 115, 116 used the 2002 iteration165, and one114
used the 2008 iteration. One study 115 further supplemented the 2002 International GI
tables with GI values for 159 local food items which were tested at an academic institution
following the International GI table methodologies.
4.4.3 Glycemic index and Coronary Heart Disease
Figure 2a shows the overall pooled relative risk estimation of GI with CHD events. CHD
incidence rate was increased at the highest level of GI exposure compared to the lowest
(RR= 1.13 [95%CI: 1.00-1.28]) and approached significance (P=0.05) but with significant
evidence of heterogeneity (I2=44%, P=0.06). Sensitivity analyses identified the Grau et al.
112 report on men as the largest contributor to heterogeneity (Figure 2b). The removal of
this study did not much change the estimate of the association of GI with CHD (RR=1.16
[95%CI: 1.05-1.29], P=0.004), but it did improve the precision of the estimate and
eliminate much of the heterogeneity (I2=19%, P=0.27). A priori stratification revealed no
significant modification of association for the duration of follow-up analysis with cohorts of
≥10 years versus those <10 years as subsets (β=1.00 [95%CI: 0.72-1.38], P=0.99; Figure
3a); both subsets demonstrated similar direction, magnitude, and evidence of
heterogeneity (RR=1.13, I2>45% for both). Sex, however, was a significant modifier of the

29
association of GI with CHD (β= 0.78 [95%CI: 0.62-0.97], P=0.032; Figure 3b). The pooled
female cohorts8, 22, 112, 115, 116 showed a larger, statistically significant association (RR=1.26
[95%CI: 1.12-1.43]) while the male population111-115 showed no association (RR=0.99
[95%CI: 0.84-1.16]) with no significant evidence of heterogeneity in either subset. In the
overall trend estimation analyses, the linear trend analyses revealed no significant
goodness of fit model and the piecewise analyses with splines identified no suitable
inflection point in the 7 available GI reports8, 22, 111, 113, 115, 116, suggesting that the
association between GI and CHD risk was non-linear. In the A priori subgroup analyses,
no significant linear trends were identified for men or women but the linear splines test
revealed a piecewise model with significant goodness-of-fit with a point of inflection at 78
GI units on the bread scale for the female cohorts only8, 22, 115, 116 (Figure 4). The rate of
increased CHD risk per unit GI in this subset was 0.15%[95%CI; 0.008-0.284] in the 68-78
GI unit range, while the 78-83 range demonstrated a significantly higher rate of
3.82%[95%CI; 0.621-7.021] per unit GI (P=0.026).
4.4.4 Glycemic Load and Coronary Heart Disease
Figure 5 shows the overall pooled relative risk estimation of GL with CHD events. The
pooled risk estimation showed a significant (P=0.0003) increase in CHD risk, with
significant heterogeneity, for the highest GL exposure level compared to the lowest (RR=
1.40 [95%CI: 1.17-1.68], I2=56%, P=0.01). Sensitivity analyses revealed no single
influential study. Similar to the GI analyses, meta-regression revealed no modification of
the association by the duration of follow-up analysis (β= 1.16 [95%CI: 0.77-1.76], P=0.42;
Figure 6a). Congruent with the GI analysis, sex was a significant modifier of the
association of GL with CHD (β= 0.65 [95%CI: 0.49-0.86], P=0.007; Figure 6b). The female
cohorts8, 22, 112, 115, 116, 163 showed a larger, statistically significant association (RR=1.73
[95%CI: 1.39-2.16]) while in the male cohorts111-115, the association was not significant
(RR=1.08 [95%CI: 0.92-1.27]). There was no significant evidence of heterogeneity within
either subset. In the overall and the subgroup analyses, the GLST linear trend estimation
did not reveale any significant goodness of fit models and the piecewise analyses with
splines identified no suitable inflection points in the 8 available GL reports8, 22, 111, 113, 115, 116,
163.
30
4.4.5 Publication bias
Funnel plots for each of the analyses were inspected for the presence of publication
bias (Figures 7 & 8). Although neither Begg’s nor Egger’s tests revealed any significant
evidence of publication bias in the overall analyses of GI and GL (P>0.18 for all), in the
visual inspection of the GI funnel plot the Grau et al.112 report on men appears to be an
outlier (outside the pseudo 95% confidence limits).
4.5 DISCUSSION
We believe that this meta-analysis is the first to examine the dose-response
relationship between GI and GL and CHD risk. We demonstrated an overall increased
relative risk of CHD of 13% in the comparison of the highest versus lowest quantile of GI
and a 40% increased relative risk of CHD for the highest versus the lowest quantile of GL.
The effect was seen only in women and was most pronounced when the dietary GI was
greater than 78 GI units (bread = 100 GI units).
GI values below 70 have been considered low while over 100 have been
considered high GI101. The dietary GI at which the CHD risk appears to increase most in
women, at 78 GI units, is therefore in the intermediate range25 but below the 81-84 GI
units of commonly consumed diets82.
The sex difference in the CHD response to glycemic index was unexpected and
may be the result of the larger total number of subjects in the female cohorts (n=242,655,
CHD events=4721) than in the male cohorts (n=54,194, CHD events= 2,099) and our
inability to include two studies, one from Denmark166 and one from the U.S.167, which
demonstrated adverse effects of high GI foods or diets on CHD outcomes in men.
Furthermore, the one study112 of men in the present analysis which showed a near
significant deleterious effect of low GI diets was also responsible for the heterogeneity in
the analysis. This study differed from the other studies of men in several respects. The
proportion of smokers was almost twice that (54%) of the other studies and BMI was
somewhat lower (25.3 kg/m2 versus 26.1 kg/m2); males with lower BMI have been shown
to be less susceptible to the effects of GI on CHD risk8.
Despite these reservations there are reasons why women may be potentially more
vulnerable to high glycemic index diets. Part of the protection which women have from
CHD may be related to their high HDL-C levels168, 169. Higher glycemic index diets tend to

31
reduce circulation HDL-C concentrations and thus disproportionately increase CHD risk in
women, especially when postmenopausal170. At the same time high GI diets may raise TG
levels116 which may also carry more risk for CHD in women than in men171, 172.
Other factors which in general may contribute to the increased CHD risk with high
GI diets are blood pressure and CRP both of which may be raised by high GI diets109, 173.
Conversely, acarbose, the α-glucosidase inhibitor which converts the dietary carbohydrate
to a low glycemic index form has been shown to prevent hypertension and CHD events in
the STOP NIDDM trial9.
The current studies do not suggest a possible latency effect of GI or GL on CHD
risk. Since no studies have a time frame shorter than 6 years it is not possible to determine
whether the effect is early, possibly due to alterations in clotting factor alterations26, or later
due to reduction in rate of atheroma formation due to oxidative damage174.
An earlier meta-analysis which assessed the effect of dietary GI on a number of
health outcomes including diabetes, CHD and cancer also concluded that low GI diets
were protective for diabetes, CHD, and colon and breast cancers175. However, only two
studies8, 111 were available to assess CHD outcome at the time of that analysis
In general, the glycemic index and glycemic load data were in agreement although
the magnitude of the CHD risk was greater based on the difference between the extreme
quantiles of glycemic load.
The weaknesses of the present analysis include the limited number of studies, the
inability to include potentially relevant studies166, 167 due to lack of necessary data and the
heterogeneity in the overall analyses. Another inherent limitation of observational analyses
is the potential problem for residual confounding as well as the possibility of over-
adjusting, which remains an area of debate in epidemiology176.
The strength of the studies included the use of random-effects models to allow
assessment of heterogeneity and guide the sensitivity analysis. Furthermore, the dose-
response of intermediate quantiles in addition to the extremes allowed assessment of the
GI dose-response relationship to CHD to be undertaken.
We conclude that a reduction in glycemic index and glycemic load may favorably
affect CHD outcomes in women. Further studies are required to determine the effect of
glycemic index and load on CHD risk in men. It may also be useful to assess future
cohorts for the threshold effect we demonstrated in the association trend of GI with CHD.

32
4.5.1 Figures
440 Studies identified
228 EMBASE (1980- October 2011)
140 MEDLINE (1950- October 2011)
72 CINHAL (1992- October 2011)
416 Studies excluded based on title or abstract
163 Duplicate reports
102 Reviews/book chapters
33 Randomized Clinical Trials
8 Letters/editorials/commentaries
3 Not Cohorts
16 Cross sectional studies
1 Case control study
4 Meta-analysis studies
3 Retrospective trial
5 Diabetes Incidence Cohorts
14 Prospective Diabetes Cohorts
65 Non-CHD or Non-GI Cohorts
23 Full-studies reviewed
14 Studies excluded
12 Non-CHD or Non-GI Cohorts
1 Prospective Diabetes Cohort
1 Data Unavailable*
9 Studies (21 reports) included in meta-analyses
10 Glycemic Index Association Reports (n=214,047)
11 Glycemic Load Association Reports (n=296,849)
Figure 1- Literature search and review flow. *Note: The study167
for which data were unavailable only reported a rate of change in risk of
CHD per 5 units of GI and 30 units of GL.

33
a) Pooled Risk Estimate of GI for CHD
b) Sensitivity Analysis of the Pooled Risk Estimate of GI for CHD
Study or SubgroupLog
[Risk Estimate] SE Weight
Relative Risk
IV, Random, 95%
CI
Relative Risk
IV, Random, 95% CI
Study or SubgroupLog
[Risk Estimate] SE Weight
Relative Risk
IV, Random, 95% CIRelative Risk
IV, Random, 95% CI
Relative Risk
Relative Risk
Study or SubgroupLog
[Risk Estimate] SE Weight
Relative Risk
IV, Random, 95%
CI
Relative Risk
IV, Random, 95% CI
Study or SubgroupLog
[Risk Estimate] SE Weight
Relative Risk
IV, Random, 95% CIRelative Risk
IV, Random, 95% CI
Study or SubgroupLog
[Risk Estimate] SE Weight
Relative Risk
IV, Random, 95%
CI
Relative Risk
IV, Random, 95% CIStudy or SubgroupLog
[Risk Estimate] SE Weight
Relative Risk
IV, Random, 95%
CI
Relative Risk
IV, Random, 95% CIStudy or SubgroupLog
[Risk Estimate] SE Weight
Relative Risk
IV, Random, 95%
CI
Relative Risk
IV, Random, 95% CI
Study or SubgroupLog
[Risk Estimate] SE Weight
Relative Risk
IV, Random, 95% CIRelative Risk
IV, Random, 95% CIStudy or SubgroupLog
[Risk Estimate] SE Weight
Relative Risk
IV, Random, 95% CIRelative Risk
IV, Random, 95% CIStudy or SubgroupLog
[Risk Estimate] SE Weight
Relative Risk
IV, Random, 95% CIRelative Risk
IV, Random, 95% CI
Relative Risk
Relative Risk
Figure 2- a) Pooled risk estimate of all prospective cohorts investigating the association of highest GI exposure with CHD events
(including death and Myocardial Infarctions). b) Sensitivity analyses identified Grau et al.112
report on men as the study causing
significant heterogeneity. P values for association of high GI diets with CHD are based on Generic Inverse Variance random-effects
models. Inter-study heterogeneity was tested by Cochrane’s Q (χ2) at a significance level of P<0.10 and quantified by I
2.156

34
0 0.5 1 1.5 2
a)
b)
Relative Risk
Se
x
Females: 1.26 [1.12,1.43] 0.002 0% 0.58
Males: 0.99 [0.84,1.16] 0.90 29% 0.23
P=0.032
Stratification RR [95% CI] P┼ I2 PƗ Du
ratio
n
≥ 10 Years: 1.13 [0.89,1.43] 0.31 54% 0.07
< 10 Years: 1.13 [0.97,1.31] 0.12 45% 0.12
P=0.98
Figure 3-a) A priori stratification of GI cohorts by duration (<1022, 113, 115, 116
vs. ≥10 years8, 111, 112, 114
). b) A priori stratification of GI
cohorts by sex (Male111-115
vs. Female8, 22, 112, 115, 116
Cohorts). P┼ values for pooled Relative Risk (RR) of CHD in association with high GI
diets are based on Generic Inverse Variance random effects models. Inter-study heterogeneity was tested by Cochrane’s Q (χχχχ2) at a
significance level of PƗ <0.10 and quantified by I
2 156. P for modification trend in associations is assessed by meta-regression analyses
with significance at P<0.05.

35
0.6
0.8
1
1.2
1.4
1.6
1.8
2
2.2
2.4
2.6
67 69 71 73 75 77 79 81 83
Re
lati
ve
Ris
k E
stim
ate
s fo
r C
HD
Glycemic Index
---- A rate of 0.15% increase
in CHD Risk/Unit GI
A rate of 3.82% increase
in CHD Risk/Unit GI
*
Figure 4- Dose-response of GI and CHD risk. Piecewise linear trend estimation analysis of CHD association with dietary GI in 4 female
cohorts8, 22, 115, 116
. Vertical axis is Relative Risk (RR), individual points are shown with 95% CI and reflect the risk estimates (RR) for
various levels of GI exposure in the 4 female cohorts. The dashed lined represents the first piece for the 68-78 GI range and the solid
line represents the second piece of the model for the 78-83 range. Both segments had a significant positive association trend for CHD
risk with GI (0.15%, P=0.038 for the first segment and 3.84%, P=0.019 for the second) and were significantly different (*P=0.026). The
overall trend estimation model was tested for goodness-of-fit with χ2=8.8 (P=0.64), suggesting the data do not deviate from linearity
within the model. The Model χ2=14.16 (P=0.0008) demonstrated significance suggesting that the dose-response association model is
viable161, 162
.

36
Study or SubgroupLog
[Risk Estimate] SE Weight
Relative Risk
IV, Random, 95% CIRelative Risk
IV, Random, 95% CI
Relative Risk
Study or SubgroupLog
[Risk Estimate] SE Weight
Relative Risk
IV, Random, 95% CIRelative Risk
IV, Random, 95% CIStudy or SubgroupLog
[Risk Estimate] SE Weight
Relative Risk
IV, Random, 95% CIRelative Risk
IV, Random, 95% CIStudy or SubgroupLog
[Risk Estimate] SE Weight
Relative Risk
IV, Random, 95% CIRelative Risk
IV, Random, 95% CI
Relative Risk
Figure 5- Pooled risk estimate of all prospective cohorts investigating the association of highest GL exposure with CHD events
(including death and Myocardial Infarctions). P values for association of high GL diets with CHD are based on Generic Inverse Variance
random effects models. Inter-study heterogeneity was tested by Cochrane’s Q (χ2) at a significance level of P<0.10 and quantified by
I2.156

37
0 0.5 1 1.5 2
a)
b)
Relative Risk
Se
x
P=0.007
Stratification RR [95% CI] P┼ I2 PƗ Du
ratio
n
P=0.42
Females: 1.73 [1.39,2.16] <0.00001 42% 0.12
Males: 1.08 [0.92,1.27] 0.34 0% 1.00
≥ 10 Years: 1.50 [1.14,1.96] 0.004 59% 0.03
< 10 Years: 1.29 [1.02,1.63] 0.03 49% 0.10
Figure 6- a) A priori stratification of GL cohorts by duration (<10
22, 113, 115, 116 vs. ≥10 years
8, 111, 112, 114, 163). b) A priori stratification of GL
cohorts by sex (Male111-115
vs. Female8, 22, 112, 115, 116, 163
Cohorts). P┼ values for pooled Relative Risk (RR) of CHD in association with high
GL diets are based on Generic Inverse Variance random effects models. Inter-study heterogeneity was tested by Cochrane’s Q (χχχχ2) at a
significance level of PƗ <0.10 and quantified by I
2 156. P for modification trend in associations is assessed by meta-regression analyses
with significance at P<0.05.
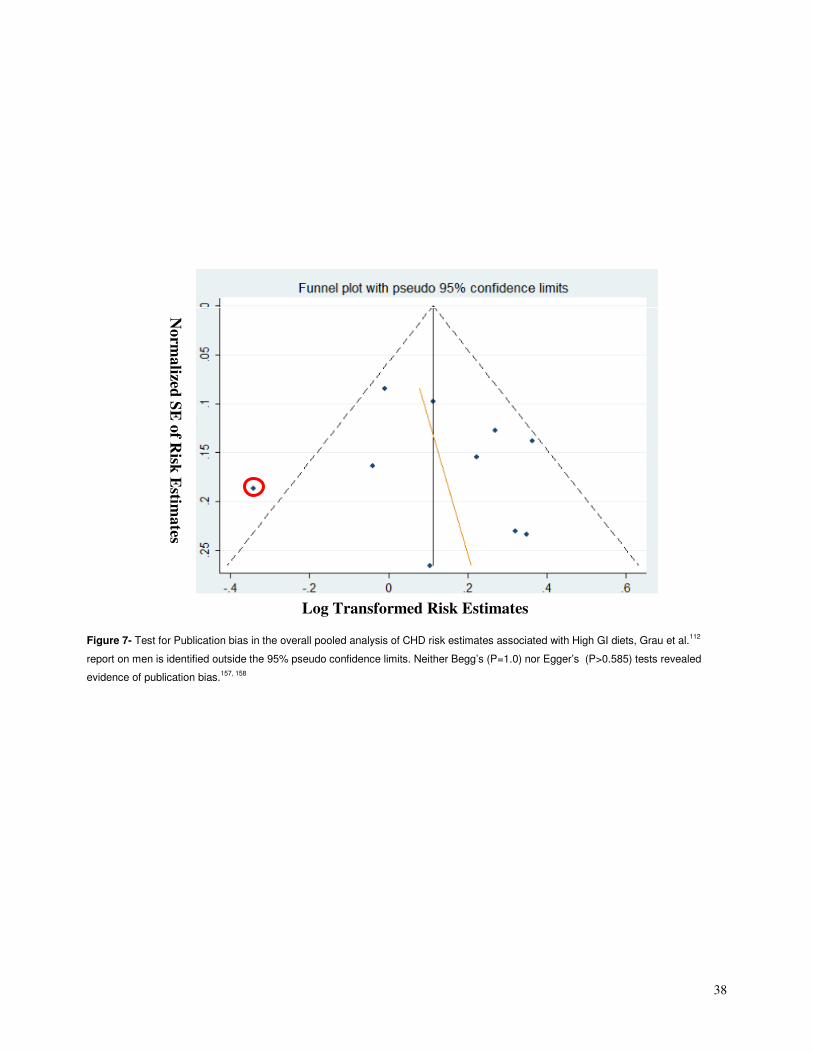
38
Figure 7- Test for Publication bias in the overall pooled analysis of CHD risk estimates associated with High GI diets, Grau et al.
112
report on men is identified outside the 95% pseudo confidence limits. Neither Begg’s (P=1.0) nor Egger’s (P>0.585) tests revealed
evidence of publication bias.157, 158
Log Transformed Risk Estimates
No
rma
lized S
E o
f Risk
Estim
ates

39
Figure 8- Test for Publication bias in the overall pooled analysis of CHD risk estimates associated with High GL diets. Neither Begg’s
(P>0.213) nor Egger’s (P>0.186) tests revealed evidence of publication bias.157, 158
Log Transformed Risk Estimates
No
rma
lized S
E o
f Risk
Estim
ates

40
4.5.2 Table
Study NAge
RangeCountry Years Range
Mean
Duration f f f f of F/U Admin
Total # of
IncidenceDivision
Mean/Median GI
Exposure Range
Method for
Reporting EventsAdjustments����
Liu S. at al. Am J Clin
Nutr. 2000 [8] 75, 521 (F) 38-63 United States 1984-1994 10 years 3 (SFFQ) 761 CHD Quintiles 68.1 - 82.7
Death Certificates,
Medical/Autopsy
Records
Hypertension; Hypercholesterolemia; parental
history of MI; Menopause; use of Multi Vits, Vit E,
and ASA; dietary intake of folate, Vit E, trans fat, PUFA, total protein
van Dam R.M. et al. Eu. J
Clin Nutr. 2000 [111] 646 (M) 64-84 Netherlands 1985-1995 10 years 1 (Interview+FR) 94 CHD Tertiles 77.0 - 85.0
Death and Hospital Discharge
Registeries
Ŧ Perscribed diet (Yes/No); dietary intake (grams/day) of PUFA and CH2O
Halton T.L. et al. NEJM.
2006 [163] 82, 802 (F) 30-55 United States 1984-2000 20 years 1 (FFQ) 1994 CHD Deciles 83 - 256 (GL)
Death Certificates,
Medical/Autopsy
Records
Hypertension; Hypercholesterolemia; parental
history of MI; Menopause; use of Multi Vits, Vit E,
and ASA; dietary intake of trans fat,PUFA,
MUFA, total protein
Levitan E.B. at al. Am J
Clin Nutr. 2007 [113] 36,246 (M) 45-79 Sweden 1998-2003 6 years 1 (FFQ) 1,324 MI Quartiles 73.0 - 82.9
Death and Hospital Discharge
Registeries
Hypertension; Hypercholesterolemia; parental
history of MI; living alone; use of ASA; dietary intake of PUFA, total protein, CH2O
Beulens J.W.J. J Am Col
Cardio. 2007 [22] 15,714 (F) 49-70 Netherlands 1993-2005 9 years 1 (FFQ) 556 CHD Quartiles 68.6 - 81.4
Death and Hospital
Discharge
Registeries
Hypertension; SBP; Menopause; Education; Use
of Vit E; dietary intake of PUFA, MUFA, total
protein
Levitan E.B. at al. Brit J
Nutr. 2010 [116] 36,234 (F) 48-83 Sweden 1998-2006 9 years 1 (SFFQ) 1,138 MI Quartiles 73.3 - 79.9
Death and Hospital Discharge
Registeries
Hypertension; Hypercholesterolemia; parental
history of MI; Menopause; Education; marital status; Use of Multi Vit, Vit E, and ASA; dietary
intake of trans fat, PUFA, MUFA, total protein
Sieri S. et al. Arch Intern
Med. 2010 [115] 30,495 (F) 35-74 Italy 1993-2004 7.9 years 1 (SFFQ) 158 CHD Quartiles 71.9 - 80.9
Death Certificates,
Hospital Discharge
Registries and
Clinical record
Hypertension; Education
Sieri S. et al. Arch Intern
Med. 2010 [115] 13,637 (M) 35-64 Italy 1993-2004 7.9 years 1 (SFFQ) 305 CHD Quartiles 71.9 - 80.7
Death Certificates,
Hospital Discharge Registries and
Clinical record
Hypertension; Education
Grau K. Public Health
Nutrition. 2010 [112] 1,684 (M) 30-70 Denmark 1974-1999 6-25 years 1 (Interview/FR) NR Quintiles 75.0 - 91.0
Hospital Discharge
Registeries
Education; Energy adjusted intake of fat, total
protein, and CH2O
Grau K. Public Health
Nutrition. 2010 [112] 1,889 (F) 30-70 Denmark 1974-1999 6-25 years 1 (Interview/FR 114 CHD Quintiles 72.0 - 89.0
Hospital Discharge Registeries
Education; Energy adjusted intake of fat, total
protein, and CH2O
Mursu. Nutr, Metab &
CVD. 2011 [114] 1,981 (M) 42-60 Finland 1984-2005 16.1 years 1 (FR) 376 MI Quartiles 70.4 - 89.0
Hospital Discharge
Registeries
Diabetes; SBP; Hypertension Meds;
Hypercholesterolemia; TAG; Family History of
CVD; Education; dietray intake of folate, Vit C,
and PUFA
Table 1- Study Characteristics*
* f of F/U denotes number of follow-ups administered for throughout the study, M: Males, F: Females, SFFQ: Semiquantitative Food Frequency Questionnaire (validated), FFQ: Food Frequency Questionnaire (validated), Interview:
Diet History Interview, FR: Food Record, GI: Glycemic Index, GL: Glycemic Load, BMI: Body Mass Index, CHD: Coronary Heart Disease, MI: Myocardial Infarction, CVD: Cardiovascular Disease, HDL: High Density Lipoprotein, TAG:
Triacyglyceride, SBP: Systolic Blood Pressure, ASA: Asprin, Vit: Vitamin, PUFA: Polyunsaturated Fatty Acids, MUFA: Monounsaturated Fatty Acids, CH2O: Carbohydrate.
� All studies adjusted for: Age, BMI, Physical Activity, Alcohol Intake, Total Energy, Sarurated fat intake. Fietary Fibre intake was adjusted for in all but one study [111]Ŧ,
All studies used Cox Proportional hazard models in their CHD risk estimation association analyses with GI and GL, except for Grau et al. [112]All studies had a healthy starting population at the beginning of follow-up except for Mursu et al. [114] which had a 5% diabetic population at the start. Table 1- Table of study characteristics.

41
5. Effect of a Low Glycemic Index Diet on Markers
of Oxidative Damage in Type 2 Diabetes

42
Effect of a Low Glycemic Index Diet on Markers of Oxidative Damage in Type 2
Diabetes
5.1 ABSTRACT
Background: Increased glycemic excursions have been linked to free radical generation
and oxidative damage. Oxidative damage to low density lipoproteins (LDL) has in turn
been linked to coronary heart disease (CHD).
Aims: To assess the effect of a low glycemic index diet, which reduces postprandial
glycemic excursions, on oxidative damage to LDL in type 2 diabetes.
Methods: This secondary analysis involved 151 type 2 diabetic participants who
completed either 6 months of low glycemic index or high cereal fiber dietary advice in a
randomized parallel design. Measurements were made of both thiobarbituric acid reactive
substances (TBARS) and conjugated dienes (CDs) in the LDL fraction and protein thiols in
serum as markers of LDL and serum protein oxidation respectively.
Results: The low GI diet reduced HbA1c but did not significantly change markers of
oxidative damage. However, when the data from the two treatments were pooled, changes
in oxidized LDL measured both as TBARS and conjugated dienes (CDs) related to low
glycemic index carbohydrate intake (TBARS r= -0.17, N=150, P=0.042 and CDs r=-0.22,
n=151, P=0.008, respectively). In addition if those with a reduction in glycemic excursions
over the day (i.e. individuals with a reduction in HbA1c but no reduction in fasting blood
glucose) were assessed, the reduction in oxidized LDL in this group was significantly
greater than the group in the opposite quadrant, with a predicted higher rise in glycemic
excursions (P=0.040).
Conclusion: Low GI diets may reduce CHD risk by reducing oxidized LDL associated with
free radical generation from high post prandial glycemic excursions.

43
5.2 INTRODUCTION
Oxidative damage to LDL increases scavenger receptor (SREC-1) uptake of LDL by
endothelial cells of the arterial wall56. As a result, mast cells in the subendothelial space
take up the oxidized cholesterol, become foam cells and die, resulting in cholesterol
accumulation. This process leads to cholesterol-rich plaques in the subintimal layer of
coronary arteries, and forms the basis of the hypothesis linking oxidative damage with
coronary heart disease 56. Although the concept of oxidative damage has received
experimental support from laboratory animal and cell culture studies 58, attempts to
intervene clinically in this process to prevent coronary heart disease (CHD) by increased
dietary antioxidants have met with little success. Notably, supplementation with large
doses of vitamin E and B-carotene have failed to prevent CHD 77, 78.
It is possible that quenching free radicals produced by metabolic processes by
exogenous antioxidant administration is relatively inefficient and it is perhaps more
important to reduce endogenous free radical generation 12, 177. High postprandial
excursions in blood glucose, as seen in diabetes, have been shown to generate increased
amounts of free radicals 12, 177. Low glycemic index diets have been shown to increase
plasma Oxygen Radical Absorbance Capacity (ORAC) values, a marker of free radical
quenching potential14. Drugs such as acarbose which limit postprandial glucose
excursions by reducing the rate of carbohydrate digestion and uptake have been shown to
reduce the incidence of CHD in pre-diabetic and diabetic participants 9, 10. Furthermore,
randomized controlled trials of low glycemic load diets have been shown to reduce CHD
risk factors154, 178, and cohort studies have demonstrated that low glycemic index diets are
associated with lower rates of CHD incidence. Taken together, these studies support a
potential link between postprandial glycemia, possible free radical generation and CHD8.
We have therefore assessed the effects of low glycemic index food consumption on
markers of LDL oxidation in a secondary analysis of a study investigating the effects of a
low glycemic index diet in type 2 diabetes15.
5.3 METHODS
5.3.1 Participants
Details of the study including the effect of a low glycemic index diet on glycemic
control, blood lipids, CRP, blood pressure and body weight have been reported

44
previously15. In brief, 210 participants were found eligible and randomized (Figure 1).
Eligible participants were men or postmenopausal women with type 2 diabetes who were
taking oral agents to control their diabetes, with medications stable for the previous three
months and who had HbA1c values at screening between 6.5% and 8.0%. None had
clinically significant cardiovascular, renal, or liver disease (ALT > 3 times the upper limit of
normal) and none were undergoing treatment for cancer. Participants were accepted after
surgery or myocardial infarction providing an event-free 6 month period had elapsed prior
to the study. This study focuses on the 151 participants who completed the study, and had
serum samples available for analysis of markers of oxidative damage.
The study was approved by the research ethics board of St. Michael’s Hospital and
the University of Toronto, and written consent was obtained from all participants. Clinical
Trial Registration number: NCT00438698.
5.3.2 Study Protocol
The study was a randomized parallel study with two treatments, a low glycemic
index diet and a high cereal fiber diet, each of 6 months duration. Participants were seen
at the Clinical Nutrition and Risk Factor Modification Center of St. Michael's Hospital, a
University of Toronto Teaching Hospital, at baseline, weeks 2 and 4, and thereafter at
monthly intervals until the end of the 6 month period. During the first month, participants
received instruction on the diet to which they were allocated. At all center visits,
participants were weighed in indoor clothing without shoes and a fasting blood sample was
taken. Blood pressure was measured seated on 3 occasions at 1 minute intervals using
an Omron automatic sphygmomanometer (OMRON Healthcare Inc., Burlington, Ontario,
Canada) and the mean of the three measurements was taken. In addition, participants
brought with them their 7-day food records covering the week prior to the visit which were
discussed with registered dietitians.
During the study, participants were asked to maintain their exercise pattern and to
keep antihyperglycemic agents constant throughout the study unless a reduction was
clinically indicated.

45
5.3.3 Dietary Interventions
General dietary advice conformed to the National Cholesterol Education Program
Adult Treatment Panel III (NCEP ATP III)19 and the American Diabetes Association (ADA)
guidelines179 to reduce saturated fat and cholesterol intakes 19. The majority of the
participants were overweight (85%, 128/151, BMI ≥ 25 kg/m2) or obese (51%, 77/151, BMI
≥ 30 kg/m2) and wished to lose weight. They were informed that this was not a weight loss
study but appropriate advice was given on portion size and fat intake to help them meet
their body weight objectives. Participants were also provided with a checklist with either
low glycemic index or high cereal fiber food options from different categories (breakfast
cereals, breads, vegetables, fruit) as approximately 15 g carbohydrate servings15. The
number of carbohydrate servings prescribed covered 42-43% of total dietary calories15.
Adherence was assessed from the 7-day diet records collected at each visit. The overall
aim was to achieve a 10-20% reduction in glycemic index on the low glycemic index diet
while keeping dietary fiber similar between treatments.
5.3.4 Analyses
Measurements were made in batches at the end of the study on serum from fasting
blood samples stored at -70°C. Oxidized LDL was measured as thiobarbituric acid reactive
substances (TBARS, CV=7.2%) and conjugated dienes (CV=3.6%) in the LDL fraction by
the methods of Jentzsch et al. 67 and Ahotupa et al.66, respectively.
Protein thiols were also measured on stored serum as markers of oxidized plasma
proteins by the method of Hu ML (CV=2.3%) 65.
HbA1c was analyzed in the hospital routine biochemistry laboratory within 2 days of
collection on whole blood collected in EDTA Vacutainer tubes by a designated HPLC
method (Tosoh G7 Automated HPLC Analyzer, Grove City, OH, USA) (CV=1.7%).
Serum was analyzed for glucose, total cholesterol (total-C), triglycerides (TG), and
high-density lipoprotein cholesterol (HDL-C), using a Random Access Analyzer and
reagents (SYNCHRON LX Systems, Beckman Coulter, Brea, CA) (CV=1.5-2.4%). Low-
density lipoprotein-cholesterol (LDL-C) was calculated by the method of Friedewald et al.
(LDL-C = total-C – (TG/2 + HDL-C))180. Diets were assessed for macronutrients, fatty
acids, cholesterol, fiber and glycemic index using a computer program based on USDA
data 181 and international glycemic index tables 165 with white bread as the standard

46
(GI=100). Additional measurements were made on local foods, especially specialty
breads used as part of the low glycemic index diet. Glycemic load was calculated as the
product of the mean daily available carbohydrate and glycemic index ÷ 100. Oxygen
Radical Absorption Capacity (ORAC) values were also added to the database to allow an
estimation of the exogenous antioxidant activity of the total diet. The ORAC values were
obtained from 2010 USDA Tables and where no values were available additional values
were imputed from similar foods or classes of foods142.
5.3.5 Statistical Analyses
Baseline data are expressed as means +/- SD. The results are expressed as
absolute mean changes from baseline with 95% CI. The primary outcome of the original
study15 was HbA1c, with glucose, HDL-C, triglycerides, CRP, blood pressure, body weight,
and estimated coronary heart disease (CHD) risk according to the Framingham
equation182 as secondary measures. The present analysis focuses on oxidized products in
the serum of participants who completed the study, provided diet records at the start and
end of the study and had sufficient serum at both time points (n=151).
All analyses were carried out using STATA software, version 11.2 183. The
treatment differences in markers of oxidative stress and other biochemical measures were
assessed using least square means with change as the response variable, treatment, sex,
and sex by treatment as the main effects and baseline as a covariate.
Pearson correlations, partial correlations, and Spearman correlations were
undertaken on pooled data from both treatments to determine the relation of change in
oxidized products to measures of glycemic control and CHD risk and dietary variables
including ORAC estimations and low glycemic index carbohydrate foods (e.g. local low
glycemic index breads, low glycemic index breakfast cereals, barley, bulgar, parboiled rice,
pasta beans, peas, and lentils, temperate climate fruit including apples, oranges,
tangerines, strawberries, blueberries, and raspberries.)15, 25.
To assess the impact of alterations in post prandial glycemia on oxidative damage
to LDL, those participants who showed a treatment reduction in HbA1c but no change, or
an increase, in fasting blood glucose, signifying a likely reduction in postprandial glycemic
excursions, were compared with the rest of the group by two sample t-test (2 tailed) as

47
well as to those in the opposite quadrant, who likely had the greatest rise in glycemic
excursions (i.e. showed a rise in HbA1c but a reduction in fasting blood glucose).
5.4 RESULTS
5.4.1 Participants, Biochemical measurements, Blood Pressure, and CHD Risk
Of the 210 paticipants randomized, 154 participants completed the study. Dietary
records and blood samples were available on 151 participants (Figure 1). Baseline
characteristics were not significantly different between the two intervention arms (Table 1).
The relative glycemic index reduction on the low glycemic index diet was 13.9 GI units
(p<0.001) on the bread scale with an increase on the high fiber diet of 2.7 GI unit (Table
2). Both dietary ORAC and low GI carbohydrate were significantly increased on the low GI
diet compared to the high fiber (difference in the means= 5811 µmol TE/day, p<0.00001
and 83.8g/day, p<0.00001, respectively) (Table 2). Significant between treatment
differences were seen with greater reductions on the low GI diet in HbA1c, 0.44%
(p=0.0002), glucose, 0.49mmol/L (p=0.042), body weight, 1.2kg (p=0.037), and CHD risk,
1.2% (p=0.035), and an increase in HDL-C, 0.07mmol/L (p=0.012) (Table 3). No
differences were related to sex and adjusting for change in body weight did not alter the
significance of the findings except for glucose (p=0.194) and CHD risk (p=0.075).
5.4.2 Oxidized Products
No treatment differences were seen in oxidized LDL as TBARs or conjugated
dienes in the LDL fraction or in protein thiols as markers of oxidized serum proteins (Table
3). However, when the data from both treatments were pooled for pearson correlations, a
negative relation was demonstrated between the change in both conjugated dienes and
TBARS in the LDL fraction as markers of oxidized LDL and the change in the low glycemic
index foods (conjugated dienes, r=-0.22, n=151, p=0.008; TBARs, r=-0.17, n=150,
p=0.042). No relation was seen with protein thiols (r =0.06, n=151, p=0.437). Conjugated
dienes further showed a significant positive correlation with CHD risk (r=0.20, n=150,
p=0.013) but TBARS and thiols did not. None of the oxidative damage markers were
significantly related to change in body weight, HbA1c, fasting blood glucose or blood
pressure, with the exception of a significant negative correlation between conjugated
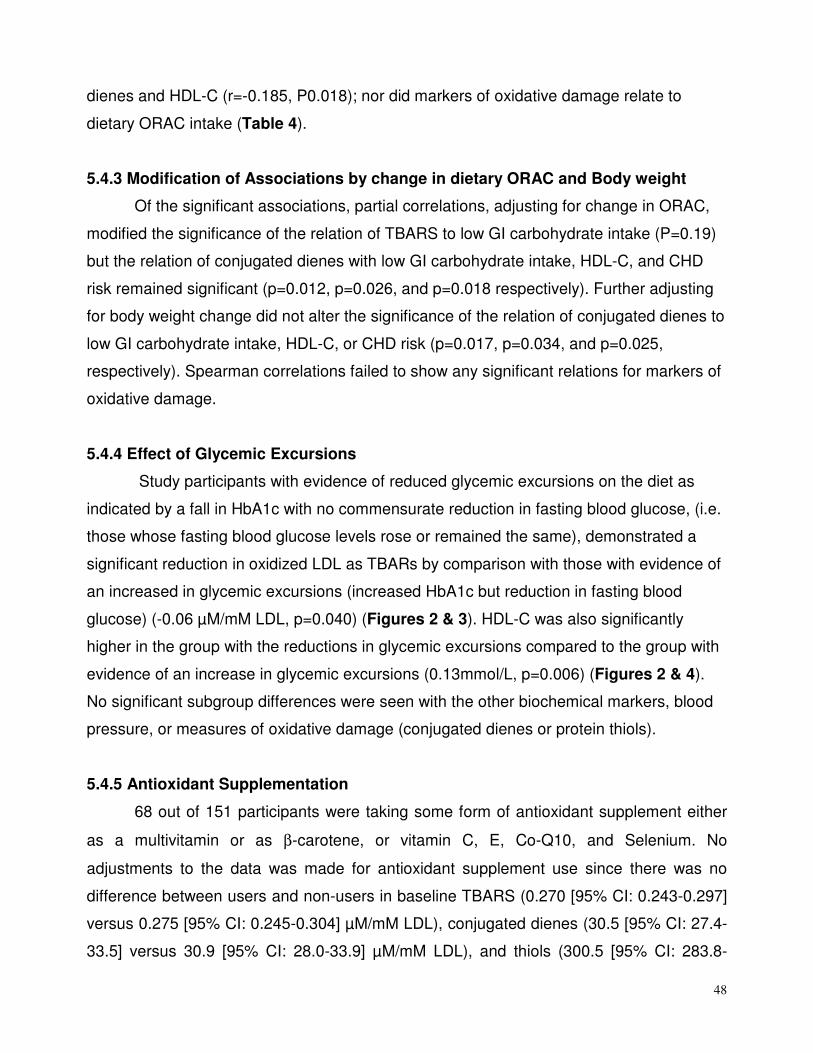
48
dienes and HDL-C (r=-0.185, P0.018); nor did markers of oxidative damage relate to
dietary ORAC intake (Table 4).
5.4.3 Modification of Associations by change in dietary ORAC and Body weight
Of the significant associations, partial correlations, adjusting for change in ORAC,
modified the significance of the relation of TBARS to low GI carbohydrate intake (P=0.19)
but the relation of conjugated dienes with low GI carbohydrate intake, HDL-C, and CHD
risk remained significant (p=0.012, p=0.026, and p=0.018 respectively). Further adjusting
for body weight change did not alter the significance of the relation of conjugated dienes to
low GI carbohydrate intake, HDL-C, or CHD risk (p=0.017, p=0.034, and p=0.025,
respectively). Spearman correlations failed to show any significant relations for markers of
oxidative damage.
5.4.4 Effect of Glycemic Excursions
Study participants with evidence of reduced glycemic excursions on the diet as
indicated by a fall in HbA1c with no commensurate reduction in fasting blood glucose, (i.e.
those whose fasting blood glucose levels rose or remained the same), demonstrated a
significant reduction in oxidized LDL as TBARs by comparison with those with evidence of
an increased in glycemic excursions (increased HbA1c but reduction in fasting blood
glucose) (-0.06 µM/mM LDL, p=0.040) (Figures 2 & 3). HDL-C was also significantly
higher in the group with the reductions in glycemic excursions compared to the group with
evidence of an increase in glycemic excursions (0.13mmol/L, p=0.006) (Figures 2 & 4).
No significant subgroup differences were seen with the other biochemical markers, blood
pressure, or measures of oxidative damage (conjugated dienes or protein thiols).
5.4.5 Antioxidant Supplementation
68 out of 151 participants were taking some form of antioxidant supplement either
as a multivitamin or as β-carotene, or vitamin C, E, Co-Q10, and Selenium. No
adjustments to the data was made for antioxidant supplement use since there was no
difference between users and non-users in baseline TBARS (0.270 [95% CI: 0.243-0.297]
versus 0.275 [95% CI: 0.245-0.304] µM/mM LDL), conjugated dienes (30.5 [95% CI: 27.4-
33.5] versus 30.9 [95% CI: 28.0-33.9] µM/mM LDL), and thiols (300.5 [95% CI: 283.8-
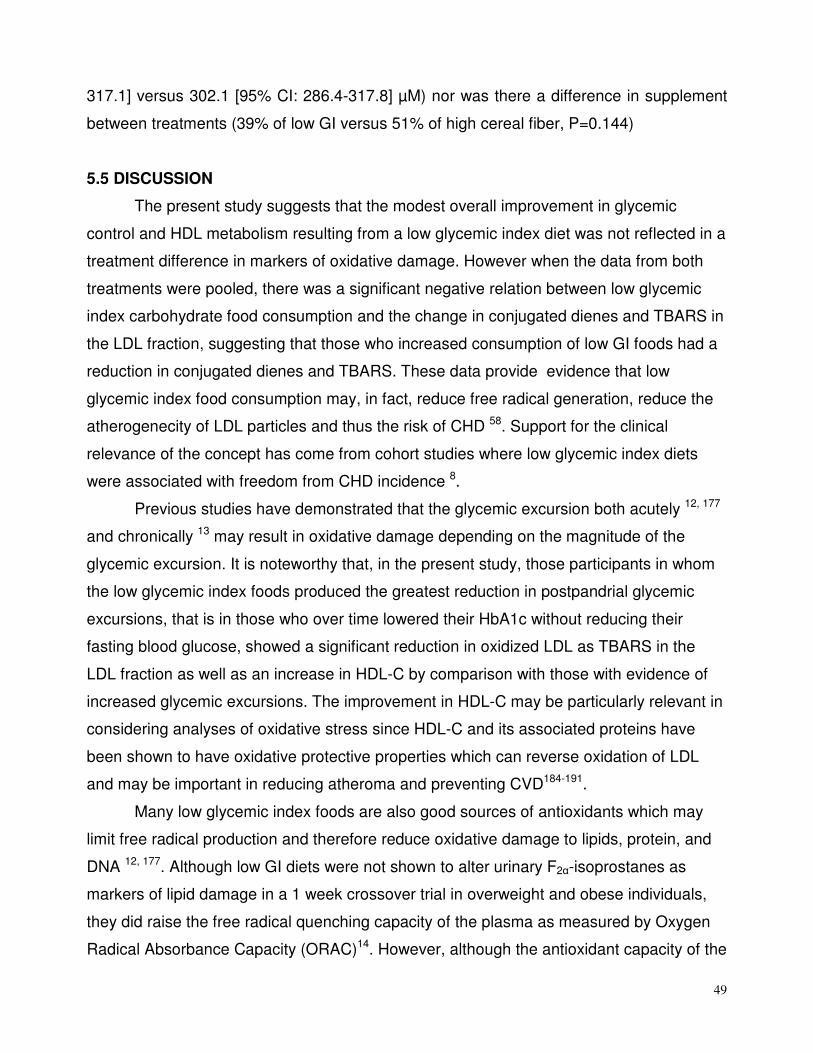
49
317.1] versus 302.1 [95% CI: 286.4-317.8] µM) nor was there a difference in supplement
between treatments (39% of low GI versus 51% of high cereal fiber, P=0.144)
5.5 DISCUSSION
The present study suggests that the modest overall improvement in glycemic
control and HDL metabolism resulting from a low glycemic index diet was not reflected in a
treatment difference in markers of oxidative damage. However when the data from both
treatments were pooled, there was a significant negative relation between low glycemic
index carbohydrate food consumption and the change in conjugated dienes and TBARS in
the LDL fraction, suggesting that those who increased consumption of low GI foods had a
reduction in conjugated dienes and TBARS. These data provide evidence that low
glycemic index food consumption may, in fact, reduce free radical generation, reduce the
atherogenecity of LDL particles and thus the risk of CHD 58. Support for the clinical
relevance of the concept has come from cohort studies where low glycemic index diets
were associated with freedom from CHD incidence 8.
Previous studies have demonstrated that the glycemic excursion both acutely 12, 177
and chronically 13 may result in oxidative damage depending on the magnitude of the
glycemic excursion. It is noteworthy that, in the present study, those participants in whom
the low glycemic index foods produced the greatest reduction in postpandrial glycemic
excursions, that is in those who over time lowered their HbA1c without reducing their
fasting blood glucose, showed a significant reduction in oxidized LDL as TBARS in the
LDL fraction as well as an increase in HDL-C by comparison with those with evidence of
increased glycemic excursions. The improvement in HDL-C may be particularly relevant in
considering analyses of oxidative stress since HDL-C and its associated proteins have
been shown to have oxidative protective properties which can reverse oxidation of LDL
and may be important in reducing atheroma and preventing CVD184-191.
Many low glycemic index foods are also good sources of antioxidants which may
limit free radical production and therefore reduce oxidative damage to lipids, protein, and
DNA 12, 177. Although low GI diets were not shown to alter urinary F2α-isoprostanes as
markers of lipid damage in a 1 week crossover trial in overweight and obese individuals,
they did raise the free radical quenching capacity of the plasma as measured by Oxygen
Radical Absorbance Capacity (ORAC)14. However, although the antioxidant capacity of the

50
diet assessed using the ORAC value of the foods did not significantly relate to any serum
measures of oxidative stress, it did reduce the association between TBARS with low GI
carbohydrate intake to non-significance when included in a partial correlation analysis
model. In regards to this observation, it is important first to also acknowledge that there is
a level of co-linearity between change in daily average ORAC and change in low GI
carbohydrate intake (r=0.56, p<0.0001), as expected, since the ORAC values were
derived from diet records in an intervention with a focus on modifying the nature of
carbohydrates consumed. However, it is also important to consider the possibility of
synergistic improvement from both metabolic modification and increases in dietary sources
of antioxidants, the former improving the oxidative environment thereby preventing the
latter from becoming pro-oxidants. This potential interaction may require further
investigation in well powered studies with more direct measurements of dietary ORAC.
We did not adjust our analyses for antioxidant supplement use since the
equivalency of the different antioxidants supplements is not clear, nor was there a
treatment difference in antioxidant use or a baseline difference in markers of oxidative
damage between users and non users. This lack of difference might also be a reflection of
supplement use in clinical trials where antioxidant supplementation appeared to have had
no effect on CHD or related outcomes 78.
A study weakness related to the number of participants which, despite providing
good power for measures such as HbA1c, may not have had sufficient power to detect
significant treatment differences in all the oxidative damage measures. Based on our effect
size and standard deviation, using 80% power (β=0.8, α=0.05), we would require 590
participants randomized to detect significant treatment differences for all oxidative damage
markers. The other major weakness common to all secondary analyses was the fact that
an assessment of GI on antioxidant status was not the a priori primary outcome of the
study. Conversely, the strengths of the study included the detailed dietary assessment
which allowed the nature of the foods consumed in the diets to be clearly identified, and
the amounts determined making the assessment of ORAC values for the diet possible.In
conclusion, the data suggest that reducing glycemic excursions by the use of low glycemic
index foods may reduce oxidative damage, especially to LDL particles. These data may
explain why low glycemic index diets in some studies have been associated with reduced
CHD risk 15 and further support the use of low glycemic index diets in type 2 diabetes

51
where the risk of heart disease is 2-fold higher that in non- diabetic men 192 and 4-fold
higher that in non-diabetic women 193.
5.5.1 Figures
Figure 1: Consort statement- Patient flow in the 6-month trial 15
.
210 Randomized
658 Screened
981 Attended
information sessions
2220 Contacted by Telephone
200 Unable to reach for
clarification
82 Booked for information
sessions twice but did not attend
7 Post-study closure calls375 Not interested
575 Excluded
63 Unable to reach203 Not interested
57 Excluded
6 Screened, but could not be
contacted after
186 with HbA1c below the cut-off
5 found acceptable at screening,
but requested commencement post study closure
137 with HbA1c above the cut-off
66 Other health issues
48 found acceptable at screening,
but lost interest after screening
104 High Fibre 106 Low GI
75 Completed 80 Completed
72 Completers with
Oxidative Damage Data
79 Completers with
Oxidative Damage Data
28 Dropped out5 Pre-study
23 During study1 Withdrawn
25 Dropped out6 Pre-study
19 During study
1 Withdrawn
104 High Fibre 106 Low GI
75 Completed 80 Completed
72 Completers with
Oxidative Damage Data
79 Completers with
Oxidative Damage Data
104 High Fibre 106 Low GI
75 Completed 80 Completed
72 Completers with
Oxidative Damage Data
79 Completers with
Oxidative Damage Data
28 Dropped out5 Pre-study
23 During study1 Withdrawn
25 Dropped out6 Pre-study
19 During study
1 Withdrawn

52
%HbA1c vs. FBG
r = 0.53
p<0.00001
-3
-2.5
-2
-1.5
-1
-0.5
0
0.5
1
1.5
2
-6 -4 -2 0 2 4 6
∆FBG (mmol/L)
∆%
HbA
1c
Figure 2: Quadrant analysis- identifying quadrant D (n=29) as participants with evidence of reduced glycemic excursions and quadrant A (n=13) as participants with evidence of increase
glycemic excursions. Association of ∆%HbA1c and ∆ blood glucose (FBG) (r=0.53, n=151, p<0.00001)
D
A B
C

53
Change in HDL from Baseline
(mmol/L)
-0.08
-0.04
0
0.04
0.08
0.12
*Group A
Group D
Change in TBARS from Baseline
(µmol/mmol LDL)
-0.06
-0.04
-0.02
0
0.02
0.04
Group A* Group D
Figure 3: Comparison of change in TBARS from baseline as a measure of oxidized LDL
in group A (n=13), high post prandial glycemia, versus group D (n=29), low post prandial
glycemia, from Figure 2, P=0.040.
Figure 4: Comparison of change in HDL-C from baseline in group A (n=13), high post
prandial glycemia, versus group D (n=29), low post prandial glycemia, from Figure 2,
P=0.006.
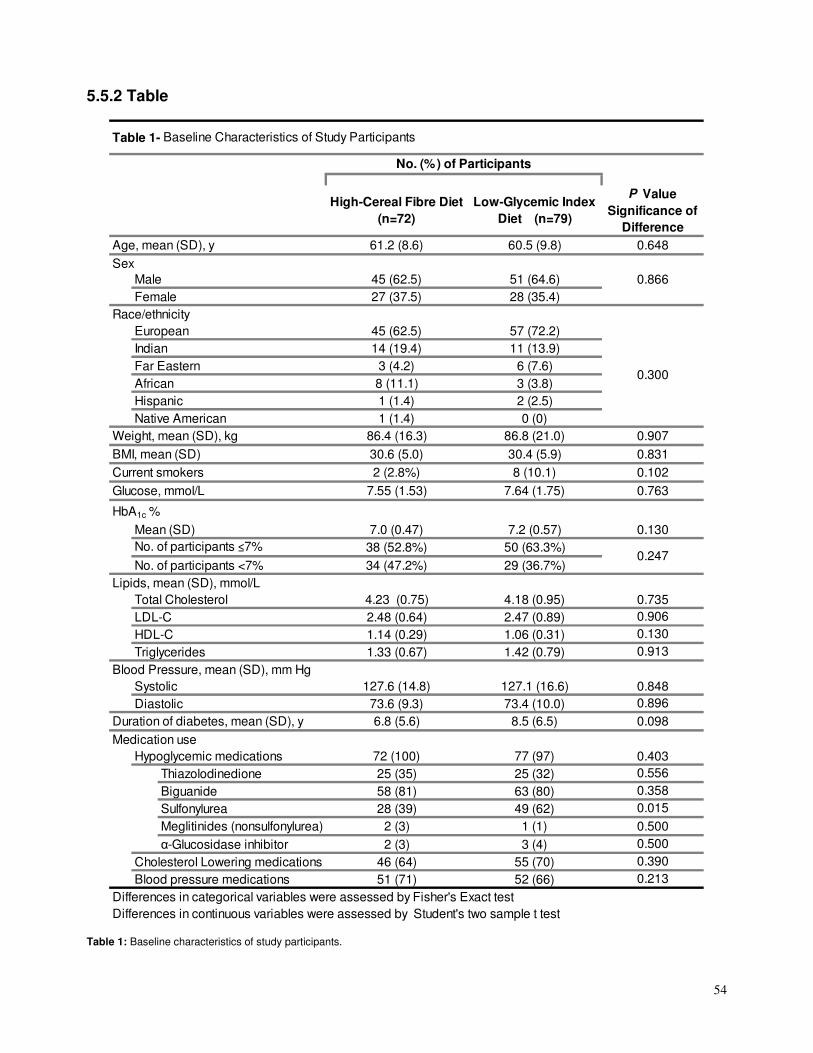
54
5.5.2 Table
61.2 (8.6) 60.5 (9.8)
Male 45 (62.5) 51 (64.6)
Female 27 (37.5) 28 (35.4)
European 45 (62.5) 57 (72.2)
Indian 14 (19.4) 11 (13.9)
Far Eastern 3 (4.2) 6 (7.6)
African 8 (11.1) 3 (3.8)
Hispanic 1 (1.4) 2 (2.5)
Native American 1 (1.4) 0 (0)
86.4 (16.3) 86.8 (21.0)
30.6 (5.0) 30.4 (5.9)
2 (2.8%) 8 (10.1)
7.55 (1.53) 7.64 (1.75)
Mean (SD) 7.0 (0.47) 7.2 (0.57)
No. of participants ≤7% 38 (52.8%) 50 (63.3%)
No. of participants <7% 34 (47.2%) 29 (36.7%)
Total Cholesterol 4.23 (0.75) 4.18 (0.95)
LDL-C 2.48 (0.64) 2.47 (0.89)
HDL-C 1.14 (0.29) 1.06 (0.31)
Triglycerides 1.33 (0.67) 1.42 (0.79)
Systolic 127.6 (14.8) 127.1 (16.6)
Diastolic 73.6 (9.3) 73.4 (10.0)
6.8 (5.6) 8.5 (6.5)
Hypoglycemic medications 72 (100) 77 (97)
Thiazolodinedione 25 (35) 25 (32)
Biguanide 58 (81) 63 (80)
Sulfonylurea 28 (39) 49 (62)
Meglitinides (nonsulfonylurea) 2 (3) 1 (1)
α-Glucosidase inhibitor 2 (3) 3 (4)
Cholesterol Lowering medications 46 (64) 55 (70)
Blood pressure medications 51 (71) 52 (66)
Differences in continuous variables were assessed by Student's two sample t test
Race/ethnicity
Age, mean (SD), y
Lipids, mean (SD), mmol/L
Blood Pressure, mean (SD), mm Hg
Medication use
HbA1c %
Sex
High-Cereal Fibre Diet
(n=72)
No. (%) of Participants
Low-Glycemic Index
Diet (n=79)
Table 1- Baseline Characteristics of Study Participants
P Value
Significance of
Difference
0.648
Duration of diabetes, mean (SD), y
Weight, mean (SD), kg
BMI, mean (SD)
Current smokers
Glucose, mmol/L
0.907
0.831
0.102
0.763
0.906
0.735
0.300
0.130
0.130
0.403
0.556
0.913
0.848
0.896
0.390
0.866
0.247
Differences in categorical variables were assessed by Fisher's Exact test
0.213
0.358
0.015
0.500
0.500
0.098
Table 1: Baseline characteristics of study participants.

55
P-Valueb
1824 (1699-1948) 1939 (1818-2062) 1637 (1538-1735) 1679 (1573-1786) 0.714
Total 32.6 (31.1-34.1) 36.2 (34.9-37.6) 29.3 (27.7-30.8) 32.8 (31.1-34.4) 0.093
Monounsaturated fatty acids 13.0 (12.2-13.8) 14.7 (13.9-15.5) 11.6 (10.9-12.4) 13.0 (12.0-13.9) 0.395
Polyunsaturated fatty acids 6.5 (6.2-6.9) 7.5 (6.9-8.0) 5.9 (5.4-6.4) 6.7 (6.0-7.3) 0.284
Sautrated fatty acids 10.2 (9.6-10.8) 11.1 (10.5-11.7) 8.9 (8.4-9.5) 9.1 (8.5-9.8) 0.768
152.6 (139.8-165.3) 157.1 (145.1-169.1) 143.1 (129.1-157.1) 139.2 (123.8-154.6) 0.524
Total 20.3 (19.5-21.2) 20.2 (19.5-21.0) 21.1 (20.3-21.9) 21.4 (20.6-22.1) 0.571
Plant 6.7 (6.3-7.2) 6.6 (6.2-7.0) 7.1 (6.7-7.5) 7.8 (7.4-8.2) 0.003
45.3 (43.6-47.0) 42.2 (40.9-43.5) 48.2 (46.5-49.9) 44.5 (42.7-46.2) 0.068
14.2 (13.1-15.3) 13.8 (12.6-15.0) 16.3 (15.2-17.2) 19.7 (18.4-21.1) <0.0001
1.8 (0.9-2.7) 1.4 (0.8-1.9) 1.4 (0.7-2.2) 1.4 (0.8-1.9) 0.335
81.7 (80.4-83) 80.7 (79.4-82.0) 84.4 (83.2-85.5) 66.8 (65.2-68.4) <0.0001
168.5 (154.3-182.7) 163.7 (152.8-174.6) 165.0 (154.3-175.7) 123.1 (114.6-131.7) <0.0001
27.6 (23.0-32.0) 30.4 (25.3-35.4) 12.5 (9.1-16.0) 99.0 (89.3-108.6) <0.0001
11,272 (10,015-12,529) 11,021 (9,989-12,053) 9,630 (8,734-10,526) 15,190 (13,932-16,448) <0.0001
aOne Subjects did not have complete dietary data,
bANOVA end difference adjusted for baseline with significance at P<0.05
Glycemic Load
Low Glycemic Index Carbohydrate
Intake (g/d)
Oxygen Radical Absorption
Capacity (µmol Trolox Equivalent)
Table 2- Nutritional profile of high-cereal fiber and low glycemic index diets. (n=150)a
Available carbohydrate, % of energy
Fiber, g/1000 kcal
Alcohol, % of energy
Glycemic Index
Dietary cholesterol, mg/1000kcal
Protein, % of energy
Energy, kcal
Fat, % of energy
Week 0 Week 24
High-Cereal Fiber Diet
(n=71)
Mean (95% Confidence Intervals)
Low-Glycemic Index
Diet (n=79)
High-Cereal Fiber
Diet (n=71)
Low-Glycemic Index
Diet (n=79)
Table 2: Nutritional profile of high-cereal fiber and low glycemic index diets.

56
86.4 86.7 84.3 83.5 0.037
7.0 7.2 6.8 6.5 0.0002
7.55 7.64 7.23 6.82 0.042
Total Cholesterol 4.23 4.18 4.24 4.12 0.233
LDL-C 2.48 2.47 2.5 2.39 0.182
HDL-C 1.14 1.06 1.13 1.12 0.012
Triglycerides 1.33 1.42 1.36 1.38 0.998
LDL-C:HDL-C ratio 2.29 2.42 2.29 2.24 0.074
0.700
Systolic 127.6 127.1 125.5 123.5 0.306
Diastolic 73.6 73.4 72.4 71.3 0.371
TBARS 0.269 0.274 0.268 0.255 0.297
CD 29.04 32.27 29.17 30.37 0.587
Protein Thiols 306.1 297.0 301.1 314.0 0.138
13.7 14.6 13.4 13.1 0.035
Mean Study Measurements and Significance of Treatment Differences (n=151)
Total Cholesterol: HDL-C
ratio
Lipids, mmol/L
3.89 3.88 0.096
P Value
Treatment
Difference
Fasting Glucose, mmol/L
HbA1c %
Body Weight, kg
Week 0 Week 24
High-Cereal
Fibre Diet
(n=72)
Mean
High-Cereal
Fibre Diet
(n=72)
Low-Glycemic
Index Diet
(n=79)
CHD Risk %
C-reactive protein, mg/L
Blood Pressure, mm Hg
Oxidative Damage in the Lipid
Fraction, µM/mmol LDL-C
Low-Glycemic
Index Diet
(n=79)
Oxidative Damage in Serum
Protein, µM
3.89 4.13
Table 3: Mean study measurements and significance of treatment differences.
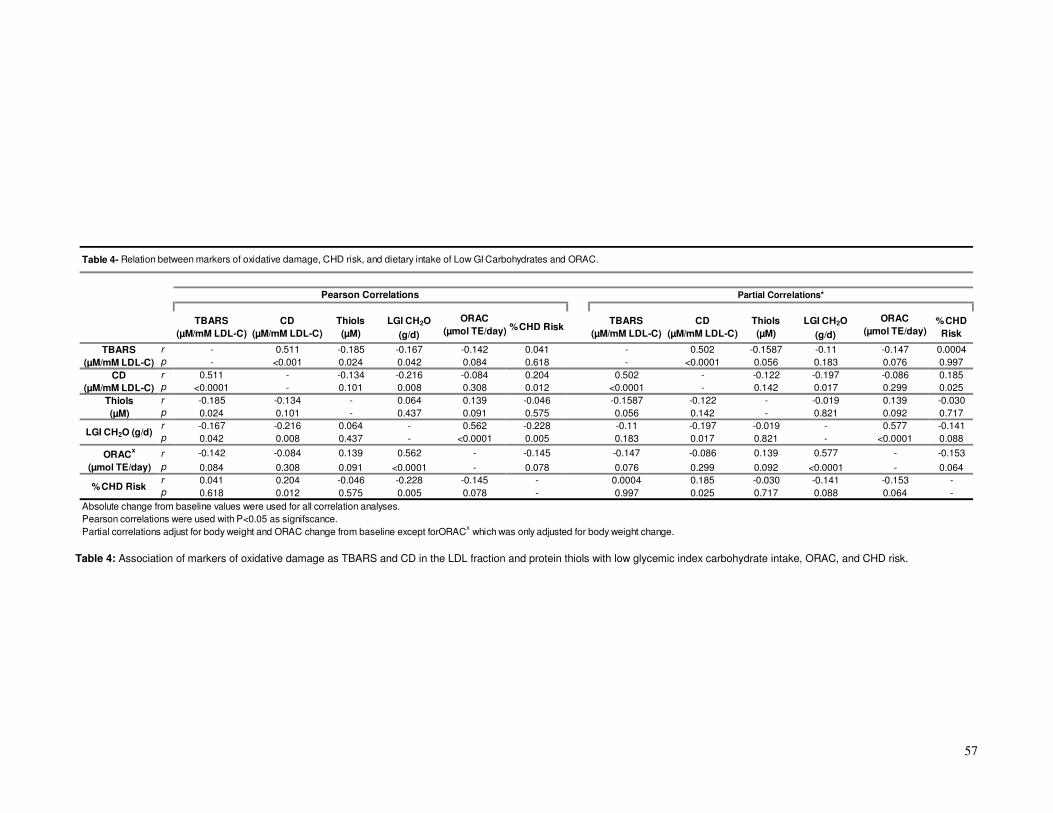
57
ORAC ORAC
(µmol TE/day) (µmol TE/day)
r - 0.511 -0.185 -0.167 -0.142 0.041 - 0.502 -0.1587 -0.11 -0.147 0.0004
p - <0.001 0.024 0.042 0.084 0.618 - <0.0001 0.056 0.183 0.076 0.997
r 0.511 - -0.134 -0.216 -0.084 0.204 0.502 - -0.122 -0.197 -0.086 0.185
p <0.0001 - 0.101 0.008 0.308 0.012 <0.0001 - 0.142 0.017 0.299 0.025
r -0.185 -0.134 - 0.064 0.139 -0.046 -0.1587 -0.122 - -0.019 0.139 -0.030
p 0.024 0.101 - 0.437 0.091 0.575 0.056 0.142 - 0.821 0.092 0.717
r -0.167 -0.216 0.064 - 0.562 -0.228 -0.11 -0.197 -0.019 - 0.577 -0.141
p 0.042 0.008 0.437 - <0.0001 0.005 0.183 0.017 0.821 - <0.0001 0.088
ORACx r -0.142 -0.084 0.139 0.562 - -0.145 -0.147 -0.086 0.139 0.577 - -0.153
(µmol TE/day) p 0.084 0.308 0.091 <0.0001 - 0.078 0.076 0.299 0.092 <0.0001 - 0.064
r 0.041 0.204 -0.046 -0.228 -0.145 - 0.0004 0.185 -0.030 -0.141 -0.153 -
p 0.618 0.012 0.575 0.005 0.078 - 0.997 0.025 0.717 0.088 0.064 -
Thiols
(µM)
%CHD Risk
Pearson correlations were used with P<0.05 as signifscance.
Partial correlations adjust for body weight and ORAC change from baseline except forORACx which was only adjusted for body weight change.
Table 4- Relation between markers of oxidative damage, CHD risk, and dietary intake of Low GI Carbohydrates and ORAC.
TBARS
(µM/mM LDL-C)
CD
(µM/mM LDL-C)
Absolute change from baseline values were used for all correlation analyses.
CD
(µM/mM LDL-C)
%CHD
Risk
Pearson Correlations Partial Correlations*
LGI CH2O
(g/d)
Thiols
(µM)
LGI CH2O (g/d)
TBARS
(µM/mM LDL-C)
CD
(µM/mM LDL-C)
LGI CH2O
(g/d)%CHD Risk
TBARS
(µM/mM LDL-C)
Thiols
(µM)
Table 4: Association of markers of oxidative damage as TBARS and CD in the LDL fraction and protein thiols with low glycemic index carbohydrate intake, ORAC, and CHD risk.

58
6. Overall Discussion and Limitations
59
6.1 Overall Discussion
The glycemic index has previously been shown to be inversely associated with risk of
diabetes and coronary heart disease in observational studies6-8, 123, 124. Low glycemic index
diets have also been shown to improve glycemic control in type 2 diabetes as well as
cardiovascular risk factors in clinical trials15, 109, 126-128. Recent investigations into the causative
factors underlying oxidative stress, as a potential mechanism for the development of
cardiovascular disease, have identified postprandial glycemic excursions as a major
contributor11, 12, 44, 49, 50, 137, 177. Thus, the association of coronary heart disease with low
glycemic index diets, as a means of lowering postprandial glycemic excursions, is of interest.
Furthermore, the potential protective effect of low glycemic index diets on markers of
oxidative damage could establish a causative link between glycemic index and cardiovascular
disease. This link is especially important since trials on antioxidant supplement use have not
been shown to affect heart disease outcomes76-78.
In our meta-analysis we showed that high GI diets were associated with CHD in
women but not in men. Moreover, a trend in the association of GI with CHD in women was
observed where GI levels less than 78 units showed a smaller gradient for CHD risk while
those above 78 demonstrated a large gradient, suggesting a potential threshold effect. It is of
interest to note that the GI of a western diet commonly ranges between 81-84 which would fall
within the higher risk section of the distribution82.
Although there are many limitations to the interpretation of the inconsistencies in our
data regarding the difference between men and women, there are some potential
physiological differences that could explain the observed difference in the association of GI
with CHD between men and women. It has been proposed that women experience greater
reductions in HDL and raises in triglycerides in response to high GI diets168, and that the
elevated triglyceride levels are more associated with CVD risk in women169-173. Furthermore, it
has been observed that women with diabetes have a four-fold increase in CHD risk while men
show a two-fold increased risk194. It may therefore be that impairment in carbohydrate
metabolism, accentuated by high glycemic index diets, may be more deleterious to women
than to men.
In our post hoc analysis on markers of oxidative damage in the 6-month diabetes
clinical trial15, we did not show a treatment difference between the low glycemic index diet and
the high fiber diet. Our analyses of relation between oxidized LDL and low GI carbohydrates
showed an inverse significant association and comparison of extreme postprandial excursion
60
changes demonstrated significant reductions in LDL oxidation for those with reduced
postprandial excursions. These results are modest, as stated below, but are in agreement
with the findings of Ceriello et al., Botero et al., and Inoue et al who demonstrated the
importance of postprandial glycemia on oxidative damage and the effects of lowering the
glycemic index of diets on reducing oxidative stress 12, 14, 44, 49, 141, 177.
Overall the possible mechanism by which low glycemic index diets may protect from
heart disease is still debatable in the face of the data that we have assessed. However, there
does seem to be some evidence that low glycemic index food consumption may be related to
reduced oxidative damage to LDL and that this reduction may be in part the result of reduced
postprandial excursions with low GI foods. Our data require confirmation in future studies.
6.2 Limitations and Future Directions
The weaknesses in our studies are many. First, our analysis on markers of oxidative
stress is a secondary Post hoc analysis which was not powered to assess antioxidant effects.
Furthermore, different antioxidant systems are not necessarily well correlated and even
measures of oxidized LDL have a relatively moderate relationship to one another (r=0.51).
Additionally, our assessment of postprandial effects was derived from fasting blood
glucose and HbA1c changes rather than direct measurements of postprandial events
throughout the day, for example with continuous glucose monitoring and measurement of
post prandial oxidation products as previously measured by some smaller studies13. Fasting
levels are likely to grossly under-represent the magnitude of postprandial changes.
In terms of our analysis of dietary ORAC and its relation to measures of oxidative
damage, like the content of any food component, antioxidant capacity values will vary due to
a wide array of factors, such as cultivar, growing conditions, harvesting, food processing and
preparation, sampling, and analytical procedures. We derived our numbers from USDA
database142 and applied values from similar foods where data were not available. Moreover,
although we did not observe significant relation between ORAC intake and oxidized LDL the
significance levels were close enough (e.g. P=0.084, 0.076) that an effect of exogenous
antioxidants may have been seen with greater numbers and confounded our endogenous
antioxidant effect.
A further weakness to our analysis of markers of oxidative damage was that over half
the patients were already taking various antioxidant supplements. Since we do not know the
equivalency of for example Selenium vs. Vitamin C or E we only assessed them as

61
dichotomous data of users versus nonusers. Nevertheless, there were no significant
differences at baseline in measures of oxidative stress between those who were taking
supplements and those who were not, nor was the distribution of supplement use different
between treatments. These observations in themselves raise the question of the effectiveness
of habitual antioxidant supplementation on markers of oxidative damage but agree with the
null effects of supplementation seen in studies of CHD outcomes76-78.
Similarly, in our meta-analysis, the number of studies with CHD endpoints and dietary
GI measurements were relatively few and the number of subjects in men (where no effect
was seen) was only one third that of the women (where an effect was seen). The difficulty of
coming to a conclusion in the case of the men is further highlighted by the fact that two
studies of low glycemic index foods by Jakobsen166 and Hardy167 demonstrated a protective
effect for CHD outcomes in Danish Men and Black men in the US compared to the null overall
effect seen in our limited meta-analysis. These studies did not have the data in a form that
could be included in the present analysis, either using a replacement model in which SFA was
replaced with high GI carbohydrates166 or using a trend model where data were presented as
incremental change in CHD risk per 5 unit increase in GI167.
Despite this, however, neither the analysis in men or women showed significant
heterogeneity to permit a further sensitivity analysis to define the effect more clearly. This
issue was of particular concern in relation to study of Grau112 in men where the results were
presented between extreme quantiles of the 50th percentile versus the 95th percentile without
providing the interquantile changes to permit incorporation into the dose-response analysis.
Half of the population data were therefore not presented (i.e. the 5th to the 50th percentile). To
that end our dose response analysis in men was limited to only 3 of the 5 studies where as in
the women we were able to acquire data for 4 out of the 5 studies (the missing being the Grau
analysis of women112.)
Overall no long term antioxidant data are available from these cohorts involving non-
diabetic participants which could be related to the data we have from the diabetes study.
Perhaps the two most telling features against our hypothesis are the lack of treatment
differences in oxidative stress measures in the diabetes study and the lack of effect of
exogenous antioxidants in randomized clinical trials. The glycemic index studies that
assessed cardiovascular risk were cohort studies and not randomized controlled trials 22, 104,
111-116.

62
The thesis strengths include the novelty of the approach, especially in relation to the
assessment of a potential dose-response in the meta-analysis, which may guide dietary
glycemic index goals for future intervention studies. The diabetes trial on the other hand
provided some data to support a role of antioxidants and we believe that our approach using
fasting glucose and HbA1c changes to indicate changes in postprandial events, if validated in
further studies, will prove useful in application to larger intervention studies where detailed
postprandial sampling may be difficult and where fasting samples are the rule as outcome
determinants.
6.3 Future Research
Further assessments of GI in cohort studies of men are urgently required. This
situation is unusual in that in the past there has been criticism that studies are not relevant to
women since most have been carried out in terms of cardiovascular disease and men. This
situation is not the case in relation to the glycemic index. There may be biological differences
for example higher HDL-C levels in women168 and apparently more adverse effects of
diabetes in women in terms of cardiovascular disease (4-fold)by comparison to men(2-
fold)194. This difference may require twice the number of men to be studied in this situation
than women. Perhaps also the time has come for intervention studies in high risk groups of
individuals (especially those with diabetes) to determine the effect on secondary prevention of
instruction on low glycemic index diets. In such studies it would also be useful to determine
markers of oxidative damage at time points during the study. We have no knowledge of
whether the antioxidant phenomenon which may be associated with low GI diets applies only
to patients with type 2 diabetes and may have no effect in normoglycemic individuals. Other
mechanisms may operate as shown in the study by Wolever et al where CRP was reduced by
a low GI diet109 and the study by Jarvi et al where PAI-1 was reduced26. These measures
should also be assessed in relation to oxidized products in glycemic index interventions.
In relation to the diabetes studies of low GI diets and measures of oxidative damage
we believe there is a need for postprandial measures by continuous glucose monitoring over
time of the same sort undertaken by Monnier et al. in 200613. There is a need to define more
clearly whether the MAGE (mean amplitude of glycemic excursion) 13 is related to oxidative
damage and is reduced by low GI diets. Such studies would also provide valuable information
on the relation between MAGE and our derived estimate of glycemic excursion estimated
from changes in fasting blood glucose and HbA1c. If these indices correlated well they could

63
be employed usefully as already mentioned in larger intervention studies where the numbers
and subsequent cost of detailed postprandial assessments would be prohibitive.
Studies could also be undertaken assessing the glycemic index and measures of
oxidative damage in randomized controlled trials where vascular damage in the arterial bed
could be measured by 3D US and MRI as surrogate markers for cardiovascular disease.

64
7. Summary

65
7. Summary
In carrying out this thesis the aim was to answer whether low glycemic index (GI) diets will
lead to lower incidence of coronary heart disease and whether low GI diets are associated
with reduce oxidative stress. We have demonstrated the following:
1. a) We determined in a meta-analysis that high GI diets were associated with increased
CHD risk in cohorts of women but similar associations were not observed in men.
b) A dose-response was demonstrated between GI and CHD with a threshold of 78 GI
units after which larger GI versus CHD gradients were seen, again only in women.
2. a) We did not discover a treatment effect for GI on markers of oxidative damage.
b) We did demonstrate a modest associations between changes in oxidized LDL and
changes in low GI carbohydrate intake

66
8. References
1. Wild S, Roglic G, Green A, Sicree R, King H. Global prevalence of diabetes: estimates for the
year 2000 and projections for 2030. Diabetes care. 2004;27(5):1047-1053.
2. World Health Organization, Preventing chronic disease: a vital investment. Geneva: WHO;2005.
3. World Health Organization, World Health Report 2002: reducing risks, promoting healthy life.
Geneva: WHO;2002.
4. Stampfer MJ, Hu FB, Manson JE, Rimm EB, Willett WC. Primary prevention of coronary heart
disease in women through diet and lifestyle. The New England journal of medicine.
2000;343(1):16-22.
5. Hu FB, Manson JE, Stampfer MJ, Colditz G, Liu S, Solomon CG, Willett WC. Diet, lifestyle,
and the risk of type 2 diabetes mellitus in women. The New England journal of medicine.
2001;345(11):790-797.
6. Salmeron J, Ascherio A, Rimm EB, Colditz GA, Spiegelman D, Jenkins DJ, Stampfer MJ, Wing
AL, Willett WC. Dietary fiber, glycemic load, and risk of NIDDM in men. Diabetes care.
1997;20(4):545-550.
7. Salmeron J, Manson JE, Stampfer MJ, Colditz GA, Wing AL, Willett WC. Dietary fiber,
glycemic load, and risk of non-insulin-dependent diabetes mellitus in women. JAMA : the journal
of the American Medical Association. 1997;277(6):472-477.
8. Liu S, Willett WC, Stampfer MJ, Hu FB, Franz M, Sampson L, Hennekens CH, Manson JE. A
prospective study of dietary glycemic load, carbohydrate intake, and risk of coronary heart
disease in US women. The American journal of clinical nutrition. 2000;71(6):1455-1461.
9. Chiasson JL, Josse RG, Gomis R, Hanefeld M, Karasik A, Laakso M, Group S-NTR. Acarbose
treatment and the risk of cardiovascular disease and hypertension in patients with impaired
glucose tolerance: the STOP-NIDDM trial. JAMA : the journal of the American Medical
Association. 2003;290(4):486-494.
10. Hanefeld M, Cagatay M, Petrowitsch T, Neuser D, Petzinna D, Rupp M. Acarbose reduces the
risk for myocardial infarction in type 2 diabetic patients: meta-analysis of seven long-term
studies. Eur Heart J. 2004;25(1):10-16.
11. Brownlee M. Biochemistry and molecular cell biology of diabetic complications. Nature.
2001;414(6865):813-820.
12. Ceriello A, Esposito K, Piconi L, Ihnat MA, Thorpe JE, Testa R, Boemi M, Giugliano D.
Oscillating glucose is more deleterious to endothelial function and oxidative stress than mean
glucose in normal and type 2 diabetic patients. Diabetes. 2008;57(5):1349-1354.
13. Monnier L, Mas E, Ginet C, Michel F, Villon L, Cristol JP, Colette C. Activation of oxidative
stress by acute glucose fluctuations compared with sustained chronic hyperglycemia in patients
with type 2 diabetes. JAMA : the journal of the American Medical Association.
2006;295(14):1681-1687.
14. Botero D, Ebbeling CB, Blumberg JB, Ribaya-Mercado JD, Creager MA, Swain JF, Feldman
HA, Ludwig DS. Acute effects of dietary glycemic index on antioxidant capacity in a nutrient-
controlled feeding study. Obesity (Silver Spring). 2009;17(9):1664-1670.
15. Jenkins DJ, Kendall CW, McKeown-Eyssen G, Josse RG, Silverberg J, Booth GL, Vidgen E,
Josse AR, Nguyen TH, Corrigan S, Banach MS, Ares S, Mitchell S, Emam A, Augustin LS,
Parker TL, Leiter LA. Effect of a low-glycemic index or a high-cereal fiber diet on type 2
diabetes: a randomized trial. JAMA : the journal of the American Medical Association.
2008;300(23):2742-2753.
16. Mendis, S.; Puska, P.; Norrving, B. (editors) (2011), Global Atlas on cardiovascular disease
prevention and control, ISBN 978 92 4 156437 3.

67
17. Vanhecke TE, Miller WM, Franklin BA, Weber JE, McCullough PA. Awareness, knowledge,
and perception of heart disease among adolescents. Eur J Cardiovasc Prev Rehabil.
2006;13(5):718-723.
18. Genest J, McPherson R, Frohlich J, Anderson T, Campbell N, Carpentier A, Couture P, Dufour
R, Fodor G, Francis GA, Grover S, Gupta M, Hegele RA, Lau DC, Leiter L, Lewis GF, Lonn E,
Mancini GB, Ng D, Pearson GJ, Sniderman A, Stone JA, Ur E. 2009 Canadian Cardiovascular
Society/Canadian guidelines for the diagnosis and treatment of dyslipidemia and prevention of
cardiovascular disease in the adult - 2009 recommendations. Can J Cardiol. 2009;25(10):567-
579.
19. Executive Summary of The Third Report of The National Cholesterol Education Program
(NCEP) Expert Panel on Detection, Evaluation, And Treatment of High Blood Cholesterol In
Adults (Adult Treatment Panel III). JAMA. 2001;285(19):2486-2497.
20. Siri-Tarino PW, Sun Q, Hu FB, Krauss RM. Meta-analysis of prospective cohort studies
evaluating the association of saturated fat with cardiovascular disease. Am J Clin Nutr.
2010;91(3):535-546.
21. Jakobsen MU, O'Reilly EJ, Heitmann BL, Pereira MA, Balter K, Fraser GE, Goldbourt U,
Hallmans G, Knekt P, Liu S, Pietinen P, Spiegelman D, Stevens J, Virtamo J, Willett WC,
Ascherio A. Major types of dietary fat and risk of coronary heart disease: a pooled analysis of 11
cohort studies. The American journal of clinical nutrition. 2009;89(5):1425-1432.
22. Beulens JW, de Bruijne LM, Stolk RP, Peeters PH, Bots ML, Grobbee DE, van der Schouw YT.
High dietary glycemic load and glycemic index increase risk of cardiovascular disease among
middle-aged women: a population-based follow-up study. Journal of the American College of
Cardiology. 2007;50(1):14-21.
23. Pereira MA, Swain J, Goldfine AB, Rifai N, Ludwig DS. Effects of a low-glycemic load diet on
resting energy expenditure and heart disease risk factors during weight loss. JAMA : the journal
of the American Medical Association. 2004;292(20):2482-2490.
24. Larsen TM, Dalskov SM, van Baak M, Jebb SA, Papadaki A, Pfeiffer AF, Martinez JA,
Handjieva-Darlenska T, Kunesova M, Pihlsgard M, Stender S, Holst C, Saris WH, Astrup A,
Diet O, Genes P. Diets with high or low protein content and glycemic index for weight-loss
maintenance. The New England journal of medicine. 2010;363(22):2102-2113.
25. Jenkins DJ, Srichaikul K, Kendall CW, Sievenpiper JL, Abdulnour S, Mirrahimi A, Meneses C,
Nishi S, He X, Lee S, So YT, Esfahani A, Mitchell S, Parker TL, Vidgen E, Josse RG, Leiter LA.
The relation of low glycaemic index fruit consumption to glycaemic control and risk factors for
coronary heart disease in type 2 diabetes. Diabetologia. 2011;54(2):271-279.
26. Jarvi AE, Karlstrom BE, Granfeldt YE, Bjorck IE, Asp NG, Vessby BO. Improved glycemic
control and lipid profile and normalized fibrinolytic activity on a low-glycemic index diet in type
2 diabetic patients. Diabetes care. 1999;22(1):10-18.
27. Jackson SP. Arterial thrombosis-insidious, unpredictable and deadly. Nat Med.17(11):1423-1436.
28. Zimmet P, Alberti KG, Shaw J. Global and societal implications of the diabetes epidemic.
Nature. 2001;414(6865):782-787.
29. Donnelly R, Emslie-Smith AM, Gardner ID, Morris AD. ABC of arterial and venous disease:
vascular complications of diabetes. BMJ. 2000;320(7241):1062-1066.
30. Mokdad AH, Ford ES, Bowman BA, Dietz WH, Vinicor F, Bales VS, Marks JS. Prevalence of
obesity, diabetes, and obesity-related health risk factors, 2001. JAMA : the journal of the
American Medical Association. 2003;289(1):76-79.
31. Hanefeld M. Cardiovascular benefits and safety profile of acarbose therapy in prediabetes and
established type 2 diabetes. Cardiovasc Diabetol. 2007;6:20.
32. Colditz GA, Willett WC, Rotnitzky A, Manson JE. Weight gain as a risk factor for clinical
diabetes mellitus in women. Ann Intern Med. 1995;122(7):481-486.

68
33. Kelly T, Yang W, Chen CS, Reynolds K, He J. Global burden of obesity in 2005 and projections
to 2030. Int J Obes (Lond). 2008;32(9):1431-1437.
34. Sarwar N, Gao P, Seshasai SR, Gobin R, Kaptoge S, Di Angelantonio E, Ingelsson E, Lawlor
DA, Selvin E, Stampfer M, Stehouwer CD, Lewington S, Pennells L, Thompson A, Sattar N,
White IR, Ray KK, Danesh J. Diabetes mellitus, fasting blood glucose concentration, and risk of
vascular disease: a collaborative meta-analysis of 102 prospective studies.
Lancet.375(9733):2215-2222.
35. Tapp RJ, Shaw JE, Harper CA, de Courten MP, Balkau B, McCarty DJ, Taylor HR, Welborn TA,
Zimmet PZ. The prevalence of and factors associated with diabetic retinopathy in the Australian
population. Diabetes Care. 2003;26(6):1731-1737.
36. Molitch ME, DeFronzo RA, Franz MJ, Keane WF, Mogensen CE, Parving HH, Steffes MW.
Nephropathy in diabetes. Diabetes care. 2004;27 Suppl 1:S79-83.
37. Vigneri P, Frasca F, Sciacca L, Pandini G, Vigneri R. Diabetes and cancer. Endocr Relat Cancer.
2009;16(4):1103-1123.
38. Kirkman MS, McCarren M, Shah J, Duckworth W, Abraira C. The association between
metabolic control and prevalent macrovascular disease in Type 2 diabetes: the VA Cooperative
Study in diabetes. J Diabetes Complications. 2006;20(2):75-80.
39. Qaseem A, Vijan S, Snow V, Cross JT, Weiss KB, Owens DK. Glycemic control and type 2
diabetes mellitus: the optimal hemoglobin A1c targets. A guidance statement from the American
College of Physicians. Ann Intern Med. 2007;147(6):417-422.
40. Selvin E, Steffes MW, Zhu H, Matsushita K, Wagenknecht L, Pankow J, Coresh J, Brancati FL.
Glycated hemoglobin, diabetes, and cardiovascular risk in nondiabetic adults. The New England
journal of medicine.362(9):800-811.
41. Sabanayagam C, Liew G, Tai ES, Shankar A, Lim SC, Subramaniam T, Wong TY. Relationship
between glycated haemoglobin and microvascular complications: is there a natural cut-off point
for the diagnosis of diabetes? Diabetologia. 2009;52(7):1279-1289.
42. Boussageon R, Bejan-Angoulvant T, Saadatian-Elahi M, Lafont S, Bergeonneau C, Kassai B,
Erpeldinger S, Wright JM, Gueyffier F, Cornu C. Effect of intensive glucose lowering treatment
on all cause mortality, cardiovascular death, and microvascular events in type 2 diabetes: meta-
analysis of randomised controlled trials. BMJ.343:d4169.
43. Effect of intensive blood-glucose control with metformin on complications in overweight patients
with type 2 diabetes (UKPDS 34). UK Prospective Diabetes Study (UKPDS) Group. Lancet.
1998;352(9131):854-865.
44. Ceriello A. Postprandial hyperglycemia and diabetes complications: is it time to treat? Diabetes.
2005;54(1):1-7.
45. Kawano H, Motoyama T, Hirashima O, Hirai N, Miyao Y, Sakamoto T, Kugiyama K, Ogawa H,
Yasue H. Hyperglycemia rapidly suppresses flow-mediated endothelium-dependent vasodilation
of brachial artery. Journal of the American College of Cardiology. 1999;34(1):146-154.
46. Nishikawa T, Edelstein D, Du XL, Yamagishi S, Matsumura T, Kaneda Y, Yorek MA, Beebe D,
Oates PJ, Hammes HP, Giardino I, Brownlee M. Normalizing mitochondrial superoxide
production blocks three pathways of hyperglycaemic damage. Nature. 2000;404(6779):787-790.
47. Quagliaro L, Piconi L, Assaloni R, Da Ros R, Maier A, Zuodar G, Ceriello A. Intermittent high
glucose enhances ICAM-1, VCAM-1 and E-selectin expression in human umbilical vein
endothelial cells in culture: the distinct role of protein kinase C and mitochondrial superoxide
production. Atherosclerosis. 2005;183(2):259-267.
48. Standl E, Schnell O, Ceriello A. Postprandial hyperglycemia and glycemic variability: should we
care? Diabetes care.34 Suppl 2:S120-127.
69
49. Ceriello A, Bortolotti N, Crescentini A, Motz E, Lizzio S, Russo A, Ezsol Z, Tonutti L, Taboga
C. Antioxidant defences are reduced during the oral glucose tolerance test in normal and non-
insulin-dependent diabetic subjects. Eur J Clin Invest. 1998;28(4):329-333.
50. Ceriello A, Bortolotti N, Motz E, Crescentini A, Lizzio S, Russo A, Tonutti L, Taboga C. Meal-
generated oxidative stress in type 2 diabetic patients. Diabetes care. 1998;21(9):1529-1533.
51. Davi G, Ciabattoni G, Consoli A, Mezzetti A, Falco A, Santarone S, Pennese E, Vitacolonna E,
Bucciarelli T, Costantini F, Capani F, Patrono C. In vivo formation of 8-iso-prostaglandin
f2alpha and platelet activation in diabetes mellitus: effects of improved metabolic control and
vitamin E supplementation. Circulation. 1999;99(2):224-229.
52. Betteridge DJ. What is oxidative stress? Metabolism. 2000;49(2 Suppl 1):3-8.
53. Thompson LU, Yoon JH, Jenkins DJ, Wolever TM, Jenkins AL. Relationship between
polyphenol intake and blood glucose response of normal and diabetic individuals. Am J Clin
Nutr. 1984;39(5):745-751.
54. Klebanoff SJ, Locksley RM, Jong EC, Rosen H. Oxidative response of phagocytes to parasite
invasion. Ciba Found Symp. 1983;99:92-112.
55. Willcox JK, Ash SL, Catignani GL. Antioxidants and prevention of chronic disease. Crit Rev
Food Sci Nutr. 2004;44(4):275-295.
56. Steinberg D, Parthasarathy S, Carew TE, Khoo JC, Witztum JL. Beyond cholesterol.
Modifications of low-density lipoprotein that increase its atherogenicity. The New England
journal of medicine. 1989;320(14):915-924.
57. Albertini R, Moratti R, De Luca G. Oxidation of low-density lipoprotein in atherosclerosis from
basic biochemistry to clinical studies. Curr Mol Med. 2002;2(6):579-592.
58. Steinbrecher UP, Zhang HF, Lougheed M. Role of oxidatively modified LDL in atherosclerosis.
Free Radic Biol Med. 1990;9(2):155-168.
59. Berliner JA, Territo MC, Sevanian A, Ramin S, Kim JA, Bamshad B, Esterson M, Fogelman
AM. Minimally modified low density lipoprotein stimulates monocyte endothelial interactions. J
Clin Invest. 1990;85(4):1260-1266.
60. Singh U, Devaraj S, Jialal I. Vitamin E, oxidative stress, and inflammation. Annu Rev Nutr.
2005;25:151-174.
61. Rao AV, Agarwal S. Effect of diet and smoking on serum lycopene and lipid peroxidation. .
Nutrtion Research. 1998;18:713-721.
62. Rao A, Shen H. Effect of low dose lycopene intake on lycopene bioavailability and oxidative
stress. . Nutrition Research. 2002;22:1125-1131. .
63. Piconi L, Quagliaro L, Da Ros R, Assaloni R, Giugliano D, Esposito K, Szabo C, Ceriello A.
Intermittent high glucose enhances ICAM-1, VCAM-1, E-selectin and interleukin-6 expression in
human umbilical endothelial cells in culture: the role of poly(ADP-ribose) polymerase. J Thromb
Haemost. 2004;2(8):1453-1459.
64. de Zwart LL, Meerman JH, Commandeur JN, Vermeulen NP. Biomarkers of free radical damage
applications in experimental animals and in humans. Free Radic Biol Med. 1999;26(1-2):202-
226.
65. Hu ML. Measurement of protein thiol groups and glutathione in plasma. Methods Enzymol.
1994;233:380-385.
66. Ahotupa M, Ruutu M, Mantyla E. Simple methods of quantifying oxidation products and
antioxidant potential of low density lipoproteins. Clin Biochem. 1996;29(2):139-144.
67. Jentzsch AM, Bachmann H, Furst P, Biesalski HK. Improved analysis of malondialdehyde in
human body fluids. Free Radic Biol Med. 1996;20(2):251-256.
68. Kiss I, Sandor J, Ember I. Allelic polymorphism of GSTM1 and NAT2 genes modifies dietary-
induced DNA damage in colorectal mucosa. Eur J Cancer Prev. 2000;9(6):429-432.
70
69. Arab L, Steck-Scott S, Fleishauer AT. Lycopene and the lung. Exp Biol Med (Maywood).
2002;227(10):894-899.
70. Del Rio D, Stewart AJ, Mullen W, Burns J, Lean ME, Brighenti F, Crozier A. HPLC-MSn
analysis of phenolic compounds and purine alkaloids in green and black tea. J Agric Food Chem.
2004;52(10):2807-2815.
71. Awika JM, Rooney LW, Wu X, Prior RL, Cisneros-Zevallos L. Screening methods to measure
antioxidant activity of sorghum (sorghum bicolor) and sorghum products. J Agric Food Chem.
2003;51(23):6657-6662.
72. Prior RL, Hoang H, Gu L, Wu X, Bacchiocca M, Howard L, Hampsch-Woodill M, Huang D, Ou
B, Jacob R. Assays for hydrophilic and lipophilic antioxidant capacity (oxygen radical
absorbance capacity (ORAC(FL))) of plasma and other biological and food samples. J Agric
Food Chem. 2003;51(11):3273-3279.
73. van Tits LJ, de Waart F, Hak-Lemmers HL, van Heijst P, de Graaf J, Demacker PN, Stalenhoef
AF. Effects of alpha-tocopherol on superoxide production and plasma intercellular adhesion
molecule-1 and antibodies to oxidized LDL in chronic smokers. Free Radic Biol Med.
2001;30(10):1122-1129.
74. Takamatsu S, Takamatsu M, Satoh K, Imaizumi T, Yoshida H, Hiramoto M, Koyama M,
Ohgushi Y, Mizuno S. Effects on health of dietary supplementation with 100 mg d-alpha-
tocopheryl acetate, daily for 6 years. J Int Med Res. 1995;23(5):342-357.
75. Actis-Goretta L, Carrasquedo F, Fraga CG. The regular supplementation with an antioxidant
mixture decreases oxidative stress in healthy humans. Gender effect. Clin Chim Acta.
2004;349(1-2):97-103.
76. MRC/BHF Heart Protection Study of antioxidant vitamin supplementation in 20,536 high-risk
individuals: a randomised placebo-controlled trial. Lancet. 2002;360(9326):23-33.
77. Omenn GS, Goodman GE, Thornquist MD, Balmes J, Cullen MR, Glass A, Keogh JP, Meyskens
FL, Valanis B, Williams JH, Barnhart S, Hammar S. Effects of a combination of beta carotene
and vitamin A on lung cancer and cardiovascular disease. The New England journal of medicine.
1996;334(18):1150-1155.
78. Lonn E, Bosch J, Yusuf S, Sheridan P, Pogue J, Arnold JM, Ross C, Arnold A, Sleight P,
Probstfield J, Dagenais GR. Effects of long-term vitamin E supplementation on cardiovascular
events and cancer: a randomized controlled trial. JAMA : the journal of the American Medical
Association. 2005;293(11):1338-1347.
79. Halliwell B, Gutteridge JM, Cross CE. Free radicals, antioxidants, and human disease: where are
we now? J Lab Clin Med. 1992;119(6):598-620.
80. Miller ER, 3rd, Erlinger TP, Sacks FM, Svetkey LP, Charleston J, Lin PH, Appel LJ. A dietary
pattern that lowers oxidative stress increases antibodies to oxidized LDL: results from a
randomized controlled feeding study. Atherosclerosis. 2005;183(1):175-182.
81. Jenkins DJ, Wolever TM, Taylor RH, Barker H, Fielden H, Baldwin JM, Bowling AC, Newman
HC, Jenkins AL, Goff DV. Glycemic index of foods: a physiological basis for carbohydrate
exchange. The American journal of clinical nutrition. 1981;34(3):362-366.
82. Brand Miller J. The low GI handbook : the new glucose revolution guide to the long-term health
benefits of low GI eating. 1st Da Capo Press ed. Philadelphia, PA: Da Capo Lifelong; 2010.
83. Behall KM, Scholfield DJ, Canary J. Effect of starch structure on glucose and insulin responses
in adults. Am J Clin Nutr. 1988;47(3):428-432.
84. Jenkins DJ, Wolever TM, Leeds AR, Gassull MA, Haisman P, Dilawari J, Goff DV, Metz GL,
Alberti KG. Dietary fibres, fibre analogues, and glucose tolerance: importance of viscosity. Br
Med J. 1978;1(6124):1392-1394.
71
85. Jenkins AL, Jenkins DJ, Zdravkovic U, Wursch P, Vuksan V. Depression of the glycemic index
by high levels of beta-glucan fiber in two functional foods tested in type 2 diabetes. European
journal of clinical nutrition. 2002;56(7):622-628.
86. Wolever T, Katzman-Relle L, Jenkins A, Vuksan V, Josse R, Jenkins D. Glycaemic index of 102
complex carbohydrate foods in patients with diabetes. . Nutr Res 1994;14:651.
87. Bornet FR, Costagliola D, Rizkalla SW, Blayo A, Fontvieille AM, Haardt MJ, Letanoux M,
Tchobroutsky G, Slama G. Insulinemic and glycemic indexes of six starch-rich foods taken alone
and in a mixed meal by type 2 diabetics. Am J Clin Nutr. 1987;45(3):588-595.
88. Collier GR, Wolever TM, Wong GS, Josse RG. Prediction of glycemic response to mixed meals
in noninsulin-dependent diabetic subjects. Am J Clin Nutr. 1986;44(3):349-352.
89. Gannon MC, Nuttall FQ, Neil BJ, Westphal SA. The insulin and glucose responses to meals of
glucose plus various proteins in type II diabetic subjects. Metabolism: clinical and experimental.
1988;37(11):1081-1088.
90. Welch IM, Bruce C, Hill SE, Read NW. Duodenal and ileal lipid suppresses postprandial blood
glucose and insulin responses in man: possible implications for the dietary management of
diabetes mellitus. Clin Sci (Lond). 1987;72(2):209-216.
91. Wolever TM, Nuttall FQ, Lee R, Wong GS, Josse RG, Csima A, Jenkins DJ. Prediction of the
relative blood glucose response of mixed meals using the white bread glycemic index. Diabetes
care. 1985;8(5):418-428.
92. Yoon JH, Thompson LU, Jenkins DJ. The effect of phytic acid on in vitro rate of starch
digestibility and blood glucose response. Am J Clin Nutr. 1983;38(6):835-842.
93. Rea R, Thompson L, Jenkins D. Lectins in foods and their relation to starch digestibility. . Nutr
Res. 1985;5:919.
94. Jenkins DJ, Wolever TM, Collier GR, Ocana A, Rao AV, Buckley G, Lam Y, Mayer A,
Thompson LU. Metabolic effects of a low-glycemic-index diet. Am J Clin Nutr. 1987;46(6):968-
975.
95. Vuksan V, Sievenpiper JL, Koo VY, Francis T, Beljan-Zdravkovic U, Xu Z, Vidgen E. American
ginseng (Panax quinquefolius L) reduces postprandial glycemia in nondiabetic subjects and
subjects with type 2 diabetes mellitus. Archives of internal medicine. 2000;160(7):1009-1013.
96. Vuksan V, Sung MK, Sievenpiper JL, Stavro PM, Jenkins AL, Di Buono M, Lee KS, Leiter LA,
Nam KY, Arnason JT, Choi M, Naeem A. Korean red ginseng (Panax ginseng) improves glucose
and insulin regulation in well-controlled, type 2 diabetes: results of a randomized, double-blind,
placebo-controlled study of efficacy and safety. Nutrition, metabolism, and cardiovascular
diseases : NMCD. 2008;18(1):46-56.
97. Jenkins DJ, Wesson V, Wolever TM, Jenkins AL, Kalmusky J, Guidici S, Csima A, Josse RG,
Wong GS. Wholemeal versus wholegrain breads: proportion of whole or cracked grain and the
glycaemic response. BMJ. 1988;297(6654):958-960.
98. Ellis PR, Dawoud FM, Morris ER. Blood glucose, plasma insulin and sensory responses to guar-
containing wheat breads: effects of molecular weight and particle size of guar gum. The British
journal of nutrition. 1991;66(3):363-379.
99. Wolever TM. The glycemic index. World Rev Nutr Diet. 1990;62:120-185.
100. Collings P, Williams C, MacDonald I. Effects of cooking on serum glucose and insulin responses
to starch. Br Med J (Clin Res Ed). 1981;282(6269):1032.
101. Atkinson FS, Foster-Powell K, Brand-Miller JC. International tables of glycemic index and
glycemic load values: 2008. Diabetes care. 2008;31(12):2281-2283.
102. Kelly S, Frost G, Whittaker V, Summerbell C. Low glycaemic index diets for coronary heart
disease. Cochrane Database Syst Rev. 2004(4):CD004467.
72
103. Opperman AM, Venter CS, Oosthuizen W, Thompson RL, Vorster HH. Meta-analysis of the
health effects of using the glycaemic index in meal-planning. The British journal of nutrition.
2004;92(3):367-381.
104. Liu S, Manson JE, Buring JE, Stampfer MJ, Willett WC, Ridker PM. Relation between a diet
with a high glycemic load and plasma concentrations of high-sensitivity C-reactive protein in
middle-aged women. Am J Clin Nutr. 2002;75(3):492-498.
105. Liu S, Manson JE, Stampfer MJ, Holmes MD, Hu FB, Hankinson SE, Willett WC. Dietary
glycemic load assessed by food-frequency questionnaire in relation to plasma high-density-
lipoprotein cholesterol and fasting plasma triacylglycerols in postmenopausal women. Am J Clin
Nutr. 2001;73(3):560-566.
106. Frost G, Leeds AA, Dore CJ, Madeiros S, Brading S, Dornhorst A. Glycaemic index as a
determinant of serum HDL-cholesterol concentration. Lancet. 1999;353(9158):1045-1048.
107. Ford ES, Liu S. Glycemic index and serum high-density lipoprotein cholesterol concentration
among us adults. Archives of internal medicine. 2001;161(4):572-576.
108. Slyper A, Jurva J, Pleuss J, Hoffmann R, Gutterman D. Influence of glycemic load on HDL
cholesterol in youth. Am J Clin Nutr. 2005;81(2):376-379.
109. Wolever TM, Gibbs AL, Mehling C, Chiasson JL, Connelly PW, Josse RG, Leiter LA, Maheux
P, Rabasa-Lhoret R, Rodger NW, Ryan EA. The Canadian Trial of Carbohydrates in Diabetes
(CCD), a 1-y controlled trial of low-glycemic-index dietary carbohydrate in type 2 diabetes: no
effect on glycated hemoglobin but reduction in C-reactive protein. The American journal of
clinical nutrition. 2008;87(1):114-125.
110. Tavani A, Bosetti C, Negri E, Augustin LS, Jenkins DJ, La Vecchia C. Carbohydrates, dietary
glycaemic load and glycaemic index, and risk of acute myocardial infarction. Heart.
2003;89(7):722-726.
111. van Dam RM, Visscher AW, Feskens EJ, Verhoef P, Kromhout D. Dietary glycemic index in
relation to metabolic risk factors and incidence of coronary heart disease: the Zutphen Elderly
Study. European journal of clinical nutrition. 2000;54(9):726-731.
112. Grau K, Tetens I, Bjornsbo KS, Heitman BL. Overall glycaemic index and glycaemic load of
habitual diet and risk of heart disease. Public health nutrition. 2011;14(1):109-118.
113. Levitan EB, Mittleman MA, Hakansson N, Wolk A. Dietary glycemic index, dietary glycemic
load, and cardiovascular disease in middle-aged and older Swedish men. The American journal of
clinical nutrition. 2007;85(6):1521-1526.
114. Mursu J, Virtanen JK, Rissanen TH, Tuomainen TP, Nykanen I, Laukkanen JA, Kortelainen R,
Voutilainen S. Glycemic index, glycemic load, and the risk of acute myocardial infarction in
Finnish men: the Kuopio Ischaemic Heart Disease Risk Factor Study. Nutrition, metabolism, and
cardiovascular diseases : NMCD. 2011;21(2):144-149.
115. Sieri S, Krogh V, Berrino F, Evangelista A, Agnoli C, Brighenti F, Pellegrini N, Palli D, Masala
G, Sacerdote C, Veglia F, Tumino R, Frasca G, Grioni S, Pala V, Mattiello A, Chiodini P, Panico
S. Dietary glycemic load and index and risk of coronary heart disease in a large italian cohort: the
EPICOR study. Archives of internal medicine. 2010;170(7):640-647.
116. Levitan EB, Mittleman MA, Wolk A. Dietary glycaemic index, dietary glycaemic load and
incidence of myocardial infarction in women. The British journal of nutrition. 2010;103(7):1049-
1055.
117. Jenkins DJ, Ghafari H, Wolever TM, Taylor RH, Jenkins AL, Barker HM, Fielden H, Bowling
AC. Relationship between rate of digestion of foods and post-prandial glycaemia. Diabetologia.
1982;22(6):450-455.
118. Brand JC, Nicholson PL, Thorburn AW, Truswell AS. Food processing and the glycemic index.
Am J Clin Nutr. 1985;42(6):1192-1196.

73
119. Jenkins DJ, Wolever TM, Ocana AM, Vuksan V, Cunnane SC, Jenkins M, Wong GS, Singer W,
Bloom SR, Blendis LM, et al. Metabolic effects of reducing rate of glucose ingestion by single
bolus versus continuous sipping. Diabetes. 1990;39(7):775-781.
120. Jenkins DJ, Ocana A, Jenkins AL, Wolever TM, Vuksan V, Katzman L, Hollands M, Greenberg
G, Corey P, Patten R, et al. Metabolic advantages of spreading the nutrient load: effects of
increased meal frequency in non-insulin-dependent diabetes. Am J Clin Nutr. 1992;55(2):461-
467.
121. Wolever TM, Bolognesi C. Source and amount of carbohydrate affect postprandial glucose and
insulin in normal subjects. The Journal of nutrition. 1996;126(11):2798-2806.
122. Jenkins DJ, Kendall CW, Augustin LS, Franceschi S, Hamidi M, Marchie A, Jenkins AL,
Axelsen M. Glycemic index: overview of implications in health and disease. Am J Clin Nutr.
2002;76(1):266S-273S.
123. Hodge AM, English DR, O'Dea K, Giles GG. Glycemic index and dietary fiber and the risk of
type 2 diabetes. Diabetes care. 2004;27(11):2701-2706.
124. Schulze MB, Liu S, Rimm EB, Manson JE, Willett WC, Hu FB. Glycemic index, glycemic load,
and dietary fiber intake and incidence of type 2 diabetes in younger and middle-aged women. Am
J Clin Nutr. 2004;80(2):348-356.
125. Ma Y, Olendzki BC, Merriam PA, Chiriboga DE, Culver AL, Li W, Hebert JR, Ockene IS,
Griffith JA, Pagoto SL. A randomized clinical trial comparing low-glycemic index versus ADA
dietary education among individuals with type 2 diabetes. Nutrition. 2008;24(1):45-56.
126. Livesey G, Taylor R, Hulshof T, Howlett J. Glycemic response and health--a systematic review
and meta-analysis: relations between dietary glycemic properties and health outcomes. Am J Clin
Nutr. 2008;87(1):258S-268S.
127. Brand-Miller J, Hayne S, Petocz P, Colagiuri S. Low-glycemic index diets in the management of
diabetes: a meta-analysis of randomized controlled trials. Diabetes care. 2003;26(8):2261-2267.
128. Thomas D, Elliott E. Low glycaemic index, or low glycaemic load, diets for diabetes mellitus.
Cochrane Database Syst Rev. 2009 21(1):CD006296.
129. Bantle JP, Wylie-Rosett J, Albright AL, Apovian CM, Clark NG, Franz MJ, Hoogwerf BJ,
Lichtenstein AH, Mayer-Davis E, Mooradian AD, Wheeler ML. Nutrition recommendations and
interventions for diabetes: a position statement of the American Diabetes Association. Diabetes
care. 2008;31 Suppl 1:S61-78.
130. FAO. Carbohydrates in Human Nutrition. Report of a Joint FAO/WHO Expert Consultation.
Rome: Food and Agiculture Organization. FAO Food and Nutrition Paper. 1998;66.
131. Ceriello A, Colagiuri S. International Diabetes Federation guideline for management of postmeal
glucose: a review of recommendations. Diabet Med. 2008;25(10):1151-1156.
132. Recommendations for the nutritional management of patients with diabetes mellitus. European
journal of clinical nutrition. 2000;54(4):353-355.
133. Canadian Diabetes Association. Guidelines for the nutritional management of diabetes mellitus in
the new millennium. A position statement by the Canadian Diabetes Association. Can J Diabetes
Care. 2000;23:56.
134. Diabetes UK. Diabetes in practice. New nutritional guidelines. Version current 5. December
2003. Internet: http://www.diabetes.org.uk/
135. Diabetes Australia. Recommendations for the use of glycemic index in meal planning. Available
from http://www.diabetesaustralia.com.au/submissiondocuments.htm.
136. National Health and Medical Research Council: Dietary Guidelines for Older Australians.
Canberra, Australian Capital Territory, AusInfo, 1999.
137. Ceriello A, Falleti E, Motz E, Taboga C, Tonutti L, Ezsol Z, Gonano F, Bartoli E.
Hyperglycemia-induced circulating ICAM-1 increase in diabetes mellitus: the possible role of
oxidative stress. Horm Metab Res. 1998;30(3):146-149.

74
138. Paolisso G, D'Amore A, Giugliano D, Ceriello A, Varricchio M, D'Onofrio F. Pharmacologic
doses of vitamin E improve insulin action in healthy subjects and non-insulin-dependent diabetic
patients. Am J Clin Nutr. 1993;57(5):650-656.
139. Prior RL, Gu L, Wu X, Jacob RA, Sotoudeh G, Kader AA, Cook RA. Plasma antioxidant
capacity changes following a meal as a measure of the ability of a food to alter in vivo
antioxidant status. Journal of the American College of Nutrition. 2007;26(2):170-181.
140. Sharma A, Kharb S, Chugh SN, Kakkar R, Singh GP. Evaluation of oxidative stress before and
after control of glycemia and after vitamin E supplementation in diabetic patients. Metabolism:
clinical and experimental. 2000;49(2):160-162.
141. Inoue I, Shinoda Y, Nakano T, Sassa M, Goto S, Awata T, Komoda T, Katayama S. Acarbose
ameliorates atherogenecity of low-density lipoprotein in patients with impaired glucose tolerance.
Metabolism: clinical and experimental. 2006;55(7):946-952.
142. (BHNRC) NDLBHNRC. USDA Database for the Oxygen Radical Absorbance Capacity (ORAC)
of Selected Foods, Release 2. Agricultural Research Service (ARS), U.S. Department of
Agriculture (USDA). Available at: www.ars.usda.gov/nutrientdata/orac.
143. Association AH. Dietary guidelines for healthy American adults. A statement for physicians and
health professionals by the Nutrition Committee, American Heart Association. Circulation.
1986;74(6):1465A-1468A.
144. Krauss RM, Deckelbaum RJ, Ernst N, Fisher E, Howard BV, Knopp RH, Kotchen T,
Lichtenstein AH, McGill HC, Pearson TA, Prewitt TE, Stone NJ, Horn LV, Weinberg R. Dietary
guidelines for healthy American adults. A statement for health professionals from the Nutrition
Committee, American Heart Association. Circulation. 1996;94(7):1795-1800.
145. Mancini M, Mattock M, Rabaya E, Chait A, Lewis B. Studies of the mechanisms of
carbohydrate-induced lipaemia in normal man. Atherosclerosis. 1973;17(3):445-454.
146. Jeppesen J, Schaaf P, Jones C, Zhou MY, Chen YD, Reaven GM. Effects of low-fat, high-
carbohydrate diets on risk factors for ischemic heart disease in postmenopausal women. The
American journal of clinical nutrition. 1997;65(4):1027-1033.
147. Brand-Miller JC, Thomas M, Swan V, Ahmad ZI, Petocz P, Colagiuri S. Physiological validation
of the concept of glycemic load in lean young adults. The Journal of nutrition. 2003;133(9):2728-
2732.
148. Dickinson S, Hancock DP, Petocz P, Ceriello A, Brand-Miller J. High-glycemic index
carbohydrate increases nuclear factor-kappaB activation in mononuclear cells of young, lean
healthy subjects. The American journal of clinical nutrition. 2008;87(5):1188-1193.
149. Luscombe ND, Noakes M, Clifton PM. Diets high and low in glycemic index versus high
monounsaturated fat diets: effects on glucose and lipid metabolism in NIDDM. European journal
of clinical nutrition. 1999;53(6):473-478.
150. McMillan-Price J, Petocz P, Atkinson F, O'Neill K, Samman S, Steinbeck K, Caterson I, Brand-
Miller J. Comparison of 4 diets of varying glycemic load on weight loss and cardiovascular risk
reduction in overweight and obese young adults: a randomized controlled trial. Archives of
internal medicine. 2006;166(14):1466-1475.
151. Rizkalla SW, Taghrid L, Laromiguiere M, Huet D, Boillot J, Rigoir A, Elgrably F, Slama G.
Improved plasma glucose control, whole-body glucose utilization, and lipid profile on a low-
glycemic index diet in type 2 diabetic men: a randomized controlled trial. Diabetes care.
2004;27(8):1866-1872.
152. Thomas D, Elliott E, Baur L. Low glycaemic index or low glycaemic load diets for overweight
and obesity. Cochrane Database of Systematic Reviews. 2007;CD005105.
153. Wolever TM, Mehling C. High-carbohydrate-low-glycaemic index dietary advice improves
glucose disposition index in subjects with impaired glucose tolerance. The British journal of
nutrition. 2002;87(5):477-487.

75
154. Ludwig DS. The glycemic index: physiological mechanisms relating to obesity, diabetes, and
cardiovascular disease. JAMA : the journal of the American Medical Association.
2002;287(18):2414-2423.
155. Stroup DF, Berlin JA, Morton SC, Olkin I, Williamson GD, Rennie D, Moher D, Becker BJ, Sipe
TA, Thacker SB. Meta-analysis of observational studies in epidemiology: a proposal for
reporting. Meta-analysis Of Observational Studies in Epidemiology (MOOSE) group. JAMA : the
journal of the American Medical Association. 2000;283(15):2008-2012.
156. Higgins J, Green S. Cochrane handbook for systematic reviews of interventions version 5.0.0
updated:. The Cochrane Collaboration, 2008. 2008.
157. Begg CB, Mazumdar M. Operating characteristics of a rank correlation test for publication bias.
Biometrics. 1994;50(4):1088-1101.
158. Egger M, Davey Smith G, Schneider M, Minder C. Bias in meta-analysis detected by a simple,
graphical test. BMJ. 1997;315(7109):629-634.
159. Anderson KM, Odell PM, Wilson PW, Kannel WB. Cardiovascular disease risk profiles.
American heart journal. 1991;121(1 Pt 2):293-298.
160. Greenland S, Longnecker MP. Methods for trend estimation from summarized dose-response
data, with applications to meta-analysis. American journal of epidemiology. 1992;135(11):1301-
1309.
161. Gould WW. sg19: Linear splines and piecewise linear functions. Stata Technical Bulletin 15: 13–
17. Reprinted in Stata Technical Bulletin Reprints. College Station, TX: Stata Press. 1993;3:98-
104.
162. Panis C. sg24: The piecewise linear spline transformation. Stata Technical Bulletin 18: 27–29.
Reprinted in Stata Technical Bulletin Reprints. College Station, TX: Stata Press. 1994;3:146–
149.
163. Halton TL, Willett WC, Liu S, Manson JE, Albert CM, Rexrode K, Hu FB. Low-carbohydrate-
diet score and the risk of coronary heart disease in women. The New England journal of
medicine. 2006;355(19):1991-2002.
164. Foster-Powell K, Miller JB. International tables of glycemic index. Am J Clin Nutr.
1995;62(4):871S-890S.
165. Foster-Powell K, Holt SH, Brand-Miller JC. International table of glycemic index and glycemic
load values: 2002. Am J Clin Nutr. 2002;76(1):5-56.
166. Jakobsen MU, Dethlefsen C, Joensen AM, Stegger J, Tjonneland A, Schmidt EB, Overvad K.
Intake of carbohydrates compared with intake of saturated fatty acids and risk of myocardial
infarction: importance of the glycemic index. Am J Clin Nutr. 2010;91(6):1764-1768.
167. Hardy DS, Hoelscher DM, Aragaki C, Stevens J, Steffen LM, Pankow JS, Boerwinkle E.
Association of glycemic index and glycemic load with risk of incident coronary heart disease
among Whites and African Americans with and without type 2 diabetes: the Atherosclerosis Risk
in Communities study. Annals of epidemiology. 2010;20(8):610-616.
168. Knopp RH, Paramsothy P, Retzlaff BM, Fish B, Walden C, Dowdy A, Tsunehara C, Aikawa K,
Cheung MC. Gender differences in lipoprotein metabolism and dietary response: basis in
hormonal differences and implications for cardiovascular disease. Current atherosclerosis
reports. 2005;7(6):472-479.
169. Gordon DJ, Probstfield JL, Garrison RJ, Neaton JD, Castelli WP, Knoke JD, Jacobs DR, Jr.,
Bangdiwala S, Tyroler HA. High-density lipoprotein cholesterol and cardiovascular disease. Four
prospective American studies. Circulation. 1989;79(1):8-15.
170. Matthews KA, Meilahn E, Kuller LH, Kelsey SF, Caggiula AW, Wing RR. Menopause and risk
factors for coronary heart disease. The New England journal of medicine. 1989;321(10):641-646.
171. Reardon MF, Nestel PJ, Craig IH, Harper RW. Lipoprotein predictors of the severity of coronary
artery disease in men and women. Circulation. 1985;71(5):881-888.
76
172. Austin MA, Hokanson JE, Edwards KL. Hypertriglyceridemia as a cardiovascular risk factor.
The American journal of cardiology. 1998;81(4A):7B-12B.
173. Levitan EB, Cook NR, Stampfer MJ, Ridker PM, Rexrode KM, Buring JE, Manson JE, Liu S.
Dietary glycemic index, dietary glycemic load, blood lipids, and C-reactive protein. Metabolism:
clinical and experimental. 2008;57(3):437-443.
174. Hu Y, Block G, Norkus EP, Morrow JD, Dietrich M, Hudes M. Relations of glycemic index and
glycemic load with plasma oxidative stress markers. Am J Clin Nutr. 2006;84(1):70-76; quiz 266-
267.
175. Barclay AW, Petocz P, McMillan-Price J, Flood VM, Prvan T, Mitchell P, Brand-Miller JC.
Glycemic index, glycemic load, and chronic disease risk--a meta-analysis of observational
studies. Am J Clin Nutr. 2008;87(3):627-637.
176. Schisterman EF, Cole SR, Platt RW. Overadjustment bias and unnecessary adjustment in
epidemiologic studies. Epidemiology. 2009;20(4):488-495.
177. Ceriello A, Esposito K, Piconi L, Ihnat M, Thorpe J, Testa R, Bonfigli AR, Giugliano D. Glucose
"peak" and glucose "spike": Impact on endothelial function and oxidative stress. Diabetes Res
Clin Pract. 2008;82(2):262-267.
178. Ebbeling CB, Leidig MM, Sinclair KB, Seger-Shippee LG, Feldman HA, Ludwig DS. Effects of
an ad libitum low-glycemic load diet on cardiovascular disease risk factors in obese young adults.
Am J Clin Nutr. 2005;81(5):976-982.
179. Franz MJ, Bantle JP, Beebe CA, Brunzell JD, Chiasson JL, Garg A, Holzmeister LA, Hoogwerf
B, Mayer-Davis E, Mooradian AD, Purnell JQ, Wheeler M. Nutrition principles and
recommendations in diabetes. Diabetes Care. 2004;27 Suppl 1:S36-46.
180. Friedewald WT, Levy RI, Fredrickson DS. Estimation of the concentration of low-density
lipoprotein cholesterol in plasma, without use of the preparative ultracentrifuge. Clin Chem.
1972;18(6):499-502.
181. The Agricultural Research Service. Composition of Foods, Agriculture Handbook No 8. .
Washington, DC: US Department of Agriculture; 1992.
182. Wilson PW, Castelli WP, Kannel WB. Coronary risk prediction in adults (the Framingham Heart
Study). Am J Cardiol. 1987;59(14):91G-94G.
183. StataCorp. 2009. Stata Statistical Software: Release 11. College Station TSL.
184. Aviram M, Rosenblat M, Bisgaier CL, Newton RS, Primo-Parmo SL, La Du BN. Paraoxonase
inhibits high-density lipoprotein oxidation and preserves its functions. A possible peroxidative
role for paraoxonase. J Clin Invest. 1998;101(8):1581-1590.
185. Bhattacharyya T, Nicholls SJ, Topol EJ, Zhang R, Yang X, Schmitt D, Fu X, Shao M, Brennan
DM, Ellis SG, Brennan ML, Allayee H, Lusis AJ, Hazen SL. Relationship of paraoxonase 1
(PON1) gene polymorphisms and functional activity with systemic oxidative stress and
cardiovascular risk. JAMA : the journal of the American Medical Association.
2008;299(11):1265-1276.
186. Durrington PN, Mackness B, Mackness MI. Paraoxonase and atherosclerosis. Arterioscler
Thromb Vasc Biol. 2001;21(4):473-480.
187. Li HL, Liu DP, Liang CC. Paraoxonase gene polymorphisms, oxidative stress, and diseases. J
Mol Med (Berl). 2003;81(12):766-779.
188. Mackness M, Mackness B. Paraoxonase 1 and atherosclerosis: is the gene or the protein more
important? Free Radic Biol Med. 2004;37(9):1317-1323.
189. Mackness MI, Arrol S, Abbott C, Durrington PN. Protection of low-density lipoprotein against
oxidative modification by high-density lipoprotein associated paraoxonase. Atherosclerosis.
1993;104(1-2):129-135.
190. Ninio E. Phospholipid mediators in the vessel wall: involvement in atherosclerosis. Curr Opin
Clin Nutr Metab Care. 2005;8(2):123-131.

77
191. Watson AD, Berliner JA, Hama SY, La Du BN, Faull KF, Fogelman AM, Navab M. Protective
effect of high density lipoprotein associated paraoxonase. Inhibition of the biological activity of
minimally oxidized low density lipoprotein. J Clin Invest. 1995;96(6):2882-2891.
192. Laakso M. Cardiovascular disease in type 2 diabetes: challenge for treatment and prevention. J
Intern Med. 2001;249(3):225-235.
193. Juutilainen A, Kortelainen S, Lehto S, Ronnemaa T, Pyorala K, Laakso M. Gender difference in
the impact of type 2 diabetes on coronary heart disease risk. Diabetes Care. 2004;27(12):2898-
2904.
194. Kannel WB, McGee DL. Diabetes and cardiovascular disease. The Framingham study. JAMA :
the journal of the American Medical Association. 1979;241(19):2035-2038.


![BIOMARKERS OF ACUTE CARDIOVASCULAR AND PULMONARY …€¦ · [MPO], soluble lectin-like oxidized LDL receptor-1 [sLOX-1]) have been studied. Oxidized LDL cholesterol is a general](https://static.fdocuments.in/doc/165x107/605c811ec0acf95c3b5ec120/biomarkers-of-acute-cardiovascular-and-pulmonary-mpo-soluble-lectin-like-oxidized.jpg)