International Tables of Glycemic Index and Glycemic Load Values
Glycemic index, glycemic load, and risk of coronary heart disease: apan-European cohort study
Sieri, S., Agnoli, C., Grioni, S., Weiderpass, E., Mattiello, A., Sluijs, I., Sanchez, M. J., Jakobsen, M. U.,Sweeting, M., van der Schouw, Y. T., Nilsson, L. M., Wennberg, P., Katzke, V. A., Kühn, T., Overvad, K., Tong,T. Y. N., Conchi, M-I., Quirós, J. R., García-Torrecillas, J. M., ... Krogh, V. (2020). Glycemic index, glycemicload, and risk of coronary heart disease: a pan-European cohort study. The American journal of clinical nutrition.https://doi.org/10.1093/ajcn/nqaa157Published in:The American journal of clinical nutrition
Document Version:Peer reviewed version
Queen's University Belfast - Research Portal:Link to publication record in Queen's University Belfast Research Portal
Publisher rightsCopyright 2020 OUP. This work is made available online in accordance with the publisher’s policies. Please refer to any applicable terms ofuse of the publisher.
General rightsCopyright for the publications made accessible via the Queen's University Belfast Research Portal is retained by the author(s) and / or othercopyright owners and it is a condition of accessing these publications that users recognise and abide by the legal requirements associatedwith these rights.
Take down policyThe Research Portal is Queen's institutional repository that provides access to Queen's research output. Every effort has been made toensure that content in the Research Portal does not infringe any person's rights, or applicable UK laws. If you discover content in theResearch Portal that you believe breaches copyright or violates any law, please contact [email protected].
Download date:25. Mar. 2022
1
Glycemic index, glycemic load and risk of coronary heart disease: a pan-European cohort study
Sabina Sieri1, Claudia Agnoli1, Sara Grioni1, Elisabete Weiderpass2, Amalia Mattiello3, Ivonne
Sluijs4, Maria Jose Sanchez5,6, Marianne Uhre Jakobsen7, Michael Sweeting8,9
, Yvonne T van der
Schouw4, Lena Maria Nilsson10, Patrik Wennberg11, Verena A Katzke12, Tilman Kühn12, Kim
Overvad13, Tammy YN Tong14, Moreno-Iribas Conchi15, José Ramón Quirós16, Juan Manuel García-
Torrecillas17, Olatz Mokoroa18, Jesús-Humberto Gómez19, Anne Tjønneland20,21, Emiliy Sonestedt22,
Antonia Trichopoulou23, Anna Karakatsani23,24, Elissavet Valanou23, Jolanda MA Boer25, WM
Monique Verschuren 25, Marie-Christine Boutron-Ruault26,27, Guy Fagherazzi26,27 , Anne-Laure
Madika26, 27, 28 , Manuela M Bergmann29, Matthias B. Schulze30,31,32, Pietro Ferrari2, Heinz Freisling2,
Hannah Lennon2, Carlotta Sacerdote33, Giovanna Masala34, Rosario Tumino35, Elio Riboli36,
Nicholas J Wareham37, John Danesh8, Nita G Forouhi37, Adam S Butterworth8, and Vittorio Krogh1.
1Epidemiology and Prevention Unit, Fondazione IRCCS Istituto Nazionale dei Tumori, Milan, Italy
(SS,CA,SG,VK)
2 International Agency for Research on Cancer, World Health Organization, Lyon, France
(EW,PF,HF,HL)
3Department of Clinical Medicine and Surgery, Federico II University, Naples, Italy (AM)
4Julius Center for Health Sciences and Primary Care, University Medical Center Utrecht, Utrecht
University, Utrecht, the Netherlands (IS,YTV)
5Andalusian School of Public Health, Granada, Spain (MJS)
6CIBER Epidemiología y Salud Pública, Madrid, Spain (MJS)
7National Food Institute, Division for Diet, Disease Prevention and Toxicology, Technical University
of Denmark, Kongens Lyngby, Denmark (MUJ)
2
8MRC/BHF Cardiovascular Epidemiology Unit, Department of Public Health and Primary Care,
University of Cambridge, Cambridge, UK (MS, ASB, JD)
9Department of Health Sciences, University of Leicester, UK (MS)
10Department of Public Health and Clinical Medicine, Sustainable Health, Umeå University, Umeå,
Sweden (LMN)
11Department of Public Health and Clinical Medicine, Family Medicine, Umeå University, Umeå,
Sweden (PW)
12Cancer Epidemiology, German Cancer Research Center, Heidelberg, Germany (VAK, TK)
13Department of Public Health, Aarhus University, Aarhus, Denmark (KO)
14Cancer Epidemiology Unit, Nuffield Department of Population Health, University of Oxford,
Oxford, UK (TYNT)
15Public Health Institute of Navarra, IdiSNA, Pamplona, Spain (MIC)
16Public Health Directorate, Asturias, Spain (JRQ)
17Hospital Universitario Torrecárdenas, Almería, Spain (JMG)
18Public Health Division of Gipuzkoa, BioDonostia Research Institute, San Sebastian, Spain (OM)
19Department of Epidemiology, Murcia Regional Health Council, IMIB-Arrixaca, Murcia, Spain
(JHG)
20Diet, Genes and Environment, Danish Cancer Society Research Center, Copenhagen, Denmark
(AT)
21Department of Public Health, University of Copenhagen, Copenhagen, Denmark (AT)
22Nutritional Epidemiology, Department of Clinical Sciences Malmö, Lund University, Lund,
Sweden (ES)
23Hellenic Health Foundation, Athens, Greece (ATr, AK, EV)
24Pulmonary Medicine Department, School of Medicine, National and Kapodistrian University of
Athens, “ATTIKON” University Hospital, Haidari, Greece (AK)
3
25National Institute for Public Health and the Environment (RIVM), Bilthoven, the Netherlands
(JMAB, WMMV)
26CESP, Fac. de médecine, Univ. Paris-Sud, Fac. de médecine UVSQ, INSERM, Université Paris-
Saclay, 94805, Villejuif, France (MCB, GF, ALM)
27Gustave Roussy, F-94805, Villejuif, France (MCB, GF, ALM)
28Université Lille, CHU Lille, EA2694, Lille, France (ALM)
29 Department of Epidemiology, German Institute of Human Nutrition Potsdam-Rehbrücke, Nuthetal,
Germany (MMB)
30Department of Molecular Epidemiology, German Institute of Human Nutrition Potsdam-
Rehbruecke, Nuthetal, Germany (MBS)
31DZHK (German Center for Cardiovascular Research), partner site Berlin, Berlin, Germany (MBS)
32University of Potsdam, Institute of Nutritional Sciences, Nuthetal, Germany (MBS)
33Unit of Cancer Epidemiology, Città della Salute e della Scienza University-Hospital and Center for
Cancer Prevention (CPO), Turin, Italy (CS)
34Cancer Risk Factors and Lifestyle Epidemiology Unit. Institute for cancer research, prevention and
clinical network (ISPRO) Florence, Italy (GM)
35Cancer Registry and Histopathology Department, ‘Civic-M.P.Arezzo’ Hospital, ASP Ragusa,
Ragusa Italy (RT)
36Department of Epidemiology and Public Health, Imperial College London, London, UK (ER)
37MRC Epidemiology Unit, University of Cambridge School of Clinical Medicine, Cambridge, UK
(NJW, NGF)
Disclaimer
Where authors are identified as personnel of the International Agency for Research on Cancer/World
Health Organization, the authors alone are responsible for the views expressed in this article and they
4
do not necessarily represent the decisions, policy or views of the International Agency for Research
on Cancer or World Health Organization.
Address for correspondence
Claudia Agnoli, MSc
Epidemiology and Prevention Unit
Fondazione IRCCS Istituto Nazionale dei Tumori
Via Venezian 1,
I-20133 Milan, Italy
Tel: +39 02 23903509; Fax: +39 02 23903516
e-mail: [email protected]
Funding
EPIC-CVD was supported by the European Union Framework 7 (HEALTH-F2-2012-279233), the
European Research Council (268834), the UK Medical Research Council (G0800270 and
MR/L003120/1), the British Heart Foundation (SP/09/002 and RG/08/014 and RG13/13/30194), and
the UK National Institute of Health Research. The establishment of the study subcohort was supported
by the EU Sixth Framework Programme (FP6) (grant LSHM_CT_2006_037197 to the InterAct
project) and the Medical Research Council Epidemiology Unit (grants MC_UU_12015/1 and
MC_UU_12015/5). NJW and NGF acknowledge support from NIHR Biomedical Research Centre
Cambridge: Nutrition, Diet, and Lifestyle Research Theme (IS-BRC-1215-20014).

5
EPIC-Asturias was supported by the Regional Government of Asturias. EPIC-Greece was supported
by the Hellenic Health Foundation. EPIC-Heidelberg was supported by German Cancer Aid, the
German Cancer Research Centre, and the German Federal Ministry of Education and Research. EPIC-
Oxford was supported by the UK Medical Research Council (MR/M012190/1) and Cancer Research
UK (570/A16491). EPIC-Ragusa was supported by the Sicilian Regional Government, the Iblean
Charitable Association for Epidemiological Research (AIRE), Ragusa, and the Italian Association of
Blood Donors (AVIS) Ragusa. EPIC-Turin was supported by the Compagnia di San Paolo and the
Human Genetics Foundation (HuGeF) Turin. EPIC-NL was supported by the Dutch Ministry of
Public Health, Welfare and Sports (VWS), the Netherlands Organisation for Health Research and
Development (ZonMW); and the World Cancer Research Fund (WCRF). EPIC-Umeå was supported
by the Swedish Cancer Society, the Swedish Scientific Council and the Regional Government of
Västerbotten.
The funders had no role in study design, data collection and analysis, decision to publish, or
preparation of the manuscript.
Data described in the manuscript will be made available upon request pending application (see
website http://epic.iarc.fr/access/index.php.)
Short Title: Dietary glycemic load and coronary heart disease
Abbreviations List
CHD Coronary heart disease; CVD Cardiovascular disease; BMI Body mass index; GL Glycemic
load; GI Glycemic index; HR Hazard ratio; CI Confidence interval; CRP C-reactive protein; HDL
High density lipoprotein; HbA1c Hemoglobin A1c
6
ABSTRACT 1
Background: High carbohydrate intake raises blood triglycerides, glucose, and insulin, reduces 2
high density lipoproteins, and may increase risk of coronary heart disease (CHD). 3
Epidemiological studies indicate that high dietary glycemic index (GI) and load (GL) are 4
associated with increased CHD risk. 5
Objectives: To determine whether dietary GI, GL, and available carbohydrates are associated 6
with CHD risk in both sexes. 7
Methods: This large prospective study - the European Prospective Investigation into Cancer 8
and Nutrition- consisted of 338,325 participants who completed a dietary questionnaire. Hazard 9
ratios (HRs) with 95% confidence intervals (CI) for a CHD event, in relation to intake of GI, 10
GL and carbohydrates were estimated using covariate-adjusted Cox proportional hazard 11
models. 12
Results: After 12.8 years (median), 6378 participants had a CHD event. High GL was 13
associated with greater CHD risk: HR 1.16 95% CI 1.02,1.31; p-trend 0.035 highest vs. lowest 14
quintile; HR 1.18 95% CI 1.07,1.29 per 50 g/day of GL intake. The association between GL 15
and CHD risk was evident in those subjects with BMI ≥25 kg/m2 (HR 1.22 95% CI 1.11,1.35 16
per 50 g/day), but not in those with BMI<25 kg/m2 (HR 1.09 95% CI 0.98,1.22 per 50 g/day) 17
(p for interaction 0.022). 18
The GL-CHD association did not differ between men (HR 1.19 95% CI 1.08,1.30 per 50 g/day) 19
and women (HR 1.22 95% CI 1.07,1.40 per 50 g/day) (test for interaction not significant). GI 20
was associated with CHD risk only in the continuous model (HR 1.04 95% CI 1.00,1.08 per 5 21
units/day). High available carbohydrate was associated with greater CHD risk: HR 1.11 (95% 22
CI 1.03,1.18) per 50 g/day. High sugar intake was associated with greater CHD risk (HR 1.09 23
95% CI 1.02,1.17 per 50 g/day) 24
Conclusions: 25

7
This large pan-European study provides robust additional support for the hypothesis that a diet 26
that induces a high glucose response is associated with greater CHD risk. 27
28
Keywords 29
Glycemic index, Glycemic load, Coronary heart disease, Case-cohort study, EPIC-CVD study. 30
8
INTRODUCTION 31
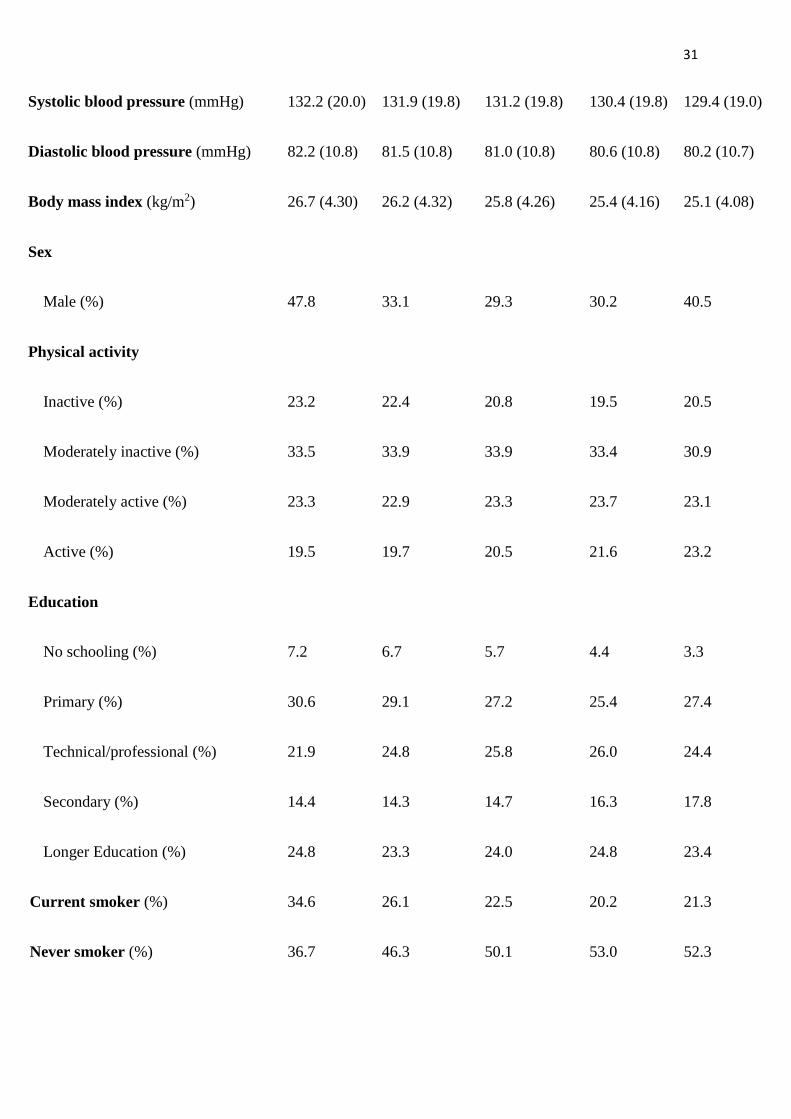
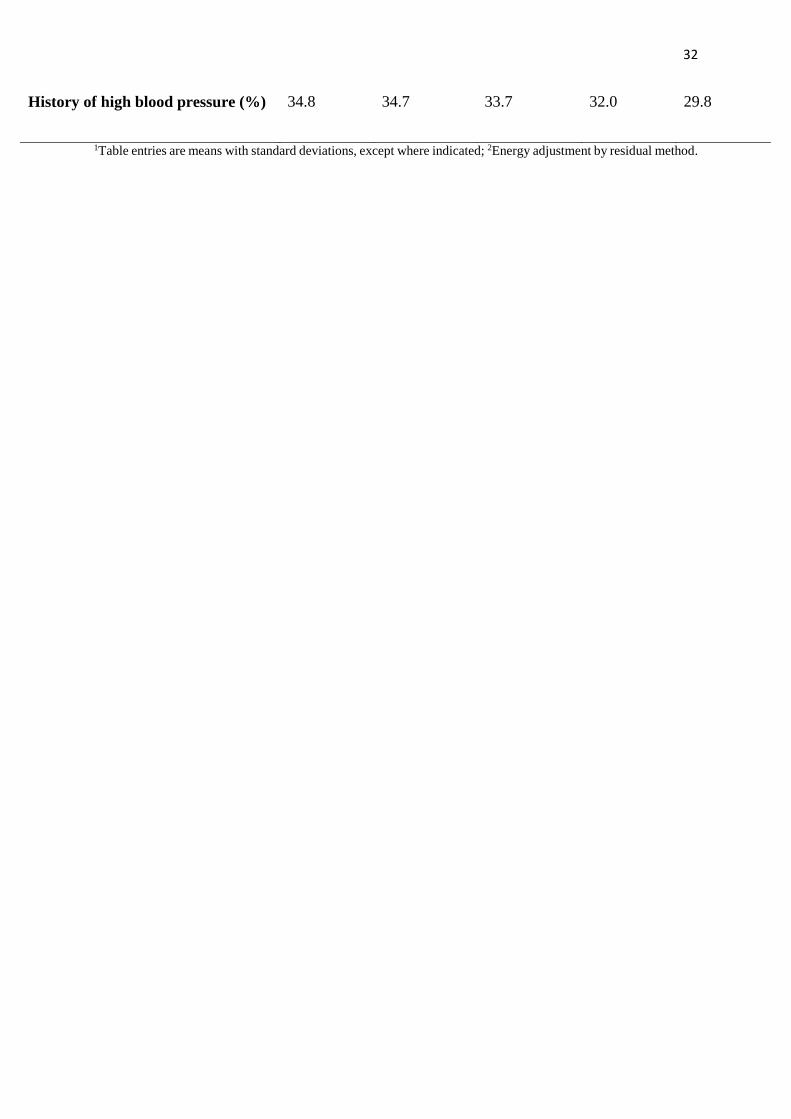
Dietary guidelines have long emphasized that reducing consumption of fat, particularly 32
saturated fat, and getting more calories from unsaturated fat or carbohydrate, lowers risk of 33
cardiovascular disease (CVD), including coronary heart disease (CHD) (1). Conversely, 34
evidence from observational studies suggests that replacing saturated fat by sugars or refined 35
starch does not reduce risk but may increase it (1,2); while replacing fat with carbohydrates 36
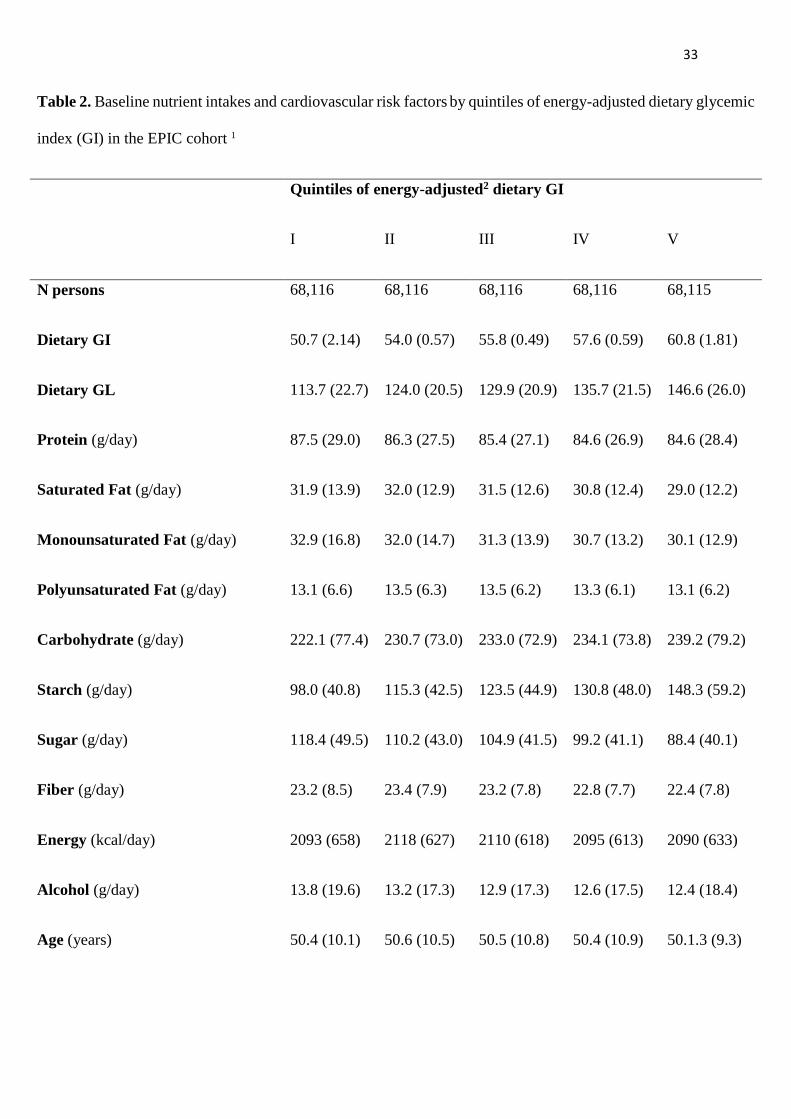
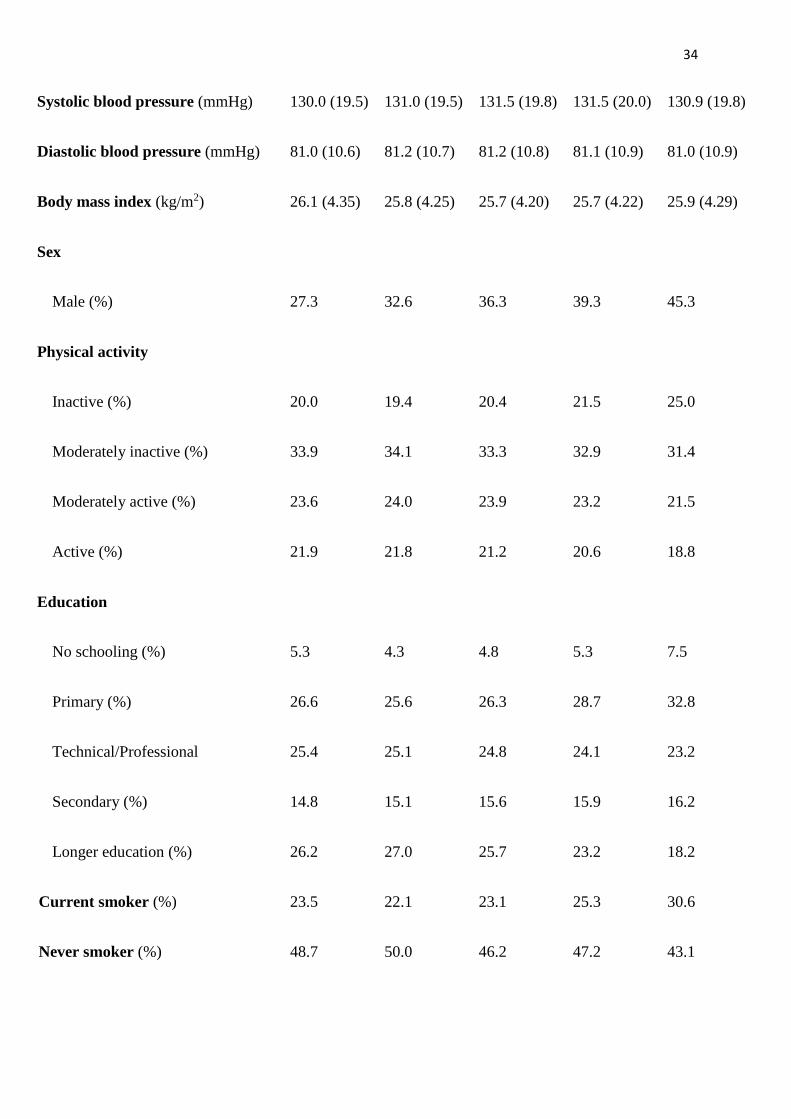
from whole fruits, vegetables, pulses, and whole grains may decrease risk (3). 37
High intake of carbohydrates, particularly refined carbohydrates, can raise fasting triglycerides 38
(4), reduce high density lipoproteins (HDL) (5), and increase blood glucose and insulin (6); and 39
may increase CHD risk. 40
Variation in the ability of carbohydrates to increase blood glucose is captured by the glycemic 41
index (GI) (7), which ranks carbohydrate foods according to their blood-glucose-raising ability. 42
Dietary GI is a measure of the overall ability of consumed carbohydrates to raise blood glucose. 43
Glycemic load (GL), the product of a food’s GI and its available carbohydrate, incorporates the 44
effect of the total amount of carbohydrate consumed (7). Dietary GL is the sum of the GLs for 45
all carbohydrate-containing foods consumed, and reflects the quantity as well as the blood-46
glucose-raising ability of consumed carbohydrates. 47
Recent reviews and meta-analyses on GI/GL and CHD risk (8-11) found that high GI and GL 48
diets were associated with increased CHD risk in women, especially women with high body 49
mass index (BMI), but in men findings were inconsistent. A 2019 meta-analysis of prospective 50
studies found that high dietary GI and GL were strongly associated with increased CHD risk in 51
both sexes (12). However, a large and comprehensive 2019 review and meta-analyses on 52
carbohydrate quality and several non-communicable disease endpoints including CHD, 53
reported that, across observational studies and clinical trials, GI had no or inconsistent 54
association with CHD, while high GL was moderately associated with increased CHD risk (13). 55
9
We estimated associations between risk of first CHD event and dietary GL, GI, and available 56
carbohydrate in a large pan-European cohort of men and women recruited to the European 57
Prospective Investigation into Cancer and Nutrition (EPIC). 58
METHODS 59
Study Population 60
EPIC is a prospective study of ≈520,000 men and women, mostly 35-70 years, recruited 61
between 1991 and 1999 from 23 centers in ten European countries: Denmark, France, Greece, 62
Germany, Italy, The Netherlands, Norway, Spain, Sweden, and the UK. Details of EPIC design 63
and methods are described elsewhere (14). Briefly, volunteers completed dietary and lifestyle 64
questionnaires, had their anthropometric measurements recorded by trained health professionals 65
(self-reported in France, Norway and Oxford); most also provided blood samples. All 66
participants gave written informed consent. Ethical committees of the International Agency for 67
Research on Cancer and local centers approved the EPIC protocol. 68
After exclusion of 10,455 with a history of myocardial infarction or stroke, 44,318 with a history 69
of diabetes, 6837 with no dietary data, and 7412 in the top or bottom 1% of the ratio of energy 70
intake to energy requirement, 452,752 remained. After also eliminating participants from 71
France and Norway for incomplete follow up and 2254 cases whose date of CHD diagnosis was 72
before the date of EPIC baseline (prevalent cases), a total of 338,325 participants remained, 73
including 6378 CHD incident cases (Supplementary Figure 1). 74
75
Measurements 76
First fatal and non-fatal CHD events were defined by codes 410-414 of the 9th edition, or I20-77
I25 of the 10th edition, of the International Classification of Diseases. EPIC centers identified 78
events by various methods including primary and secondary care databases, hospital 79
admissions records, and self-report (15). Non-fatal CHD events were validated from medical 80
10
records or databases. Fatalities were usually confirmed from mortality databases. End of 81
follow-up varied with center: from end of 2003 to end of 2010. 82
Diet over the year up to recruitment was assessed by country-specific (in some cases center-83
specific) questionnaires designed to capture local eating habits. Nutrient values of consumed 84
foods were obtained from the EPIC Nutrient Database (16). Published values of GIs (glucose 85
as reference) (17-19), were assigned to carbohydrate-containing foods as described elsewhere 86
(20). 87
Average dietary GI for each participant was calculated as the sum of the GIs of each food item 88
consumed, multiplied by the average daily amount consumed and percentage carbohydrate 89
content, all divided by the total daily carbohydrate intake. Dietary GL was calculated similarly 90
except that there was no division by daily carbohydrate intake. 91
A standardized lifestyle questionnaire at recruitment recorded menopausal status, hormone 92
treatment, medical history, physical activity, alcohol consumption, smoking, education, and 93
other information. Weight (kg) and height (m) were measured at recruitment, except in France, 94
the Oxford center, and Norway where they were measured in a subset and self-reported in the 95
rest. BMI was calculated as kg/m2. Physical activity was categorized according to the 96
Cambridge Physical Activity Index (21). 97
Blood pressure was measured using standard procedures, but was only available for 62% of 98
participants (22). We therefore used a composite blood pressure variable available for 92.4% 99
of participants: if one or more of self-reported hypertension, self-reported use of anti-100
hypertensive medication, systolic blood pressure >140 mmHg, diastolic blood pressure >90 101
mmHg were present, the participant was considered hypertensive. Other categories were: 102
normotensive or unknow/missing (7.6%). 103
Circulating CHD risk factors were available for sub-cohort of 18,157 EPIC participants 104
randomly sampled from all 23 EPIC centers, with stratification by center (23). The following 105
11
factors were measured: high-sensitivity C-reactive protein, total cholesterol, HDL cholesterol 106
and triglycerides (Stichting Huisartsen Laboratorium, Etten-Leur, the Netherlands), erythrocyte 107
hemoglobin A1c (G8 HPLC analyzer, Tosoh Bioscience, Japan), and glucose (Cobas enzymatic 108
assay, Roche Diagnostics, Mannheim, Germany). Non-HDL cholesterol was calculated as total 109
cholesterol minus HDL cholesterol, since LDL cholesterol was not directly assayed. These data 110
were not available for Norwegian participants. 111
Statistical methods 112
Participant characteristics are presented as means and standard deviations (continuous 113
variables), or percentages (categorical variables), by quintiles of energy-adjusted GI and GL. 114
Primary outcome variables were hazard ratios (HRs) for CHD in relation to variation in GI and 115
GL. Secondary outcome variables were HRs for CHD in relation to available carbohydrate, 116
starch, and sugar. HRs with 95% confidence intervals (CI) were estimated by Cox proportional 117
hazard models, using center, age and sex-stratified baseline hazards. 118
Age (years) was the time variable: participant entry was age at recruitment; exit was age at first 119
CHD event, death for other causes, loss to follow-up, or end of CHD follow-up (whichever 120
came first). Dietary intakes of interest were adjusted for energy intake using the regression-121
residual method (24) and categorized (quintiles) based on the entire cohort. Models were run 122
on men and women together, with stratification by sex only in subgroup analyses. The study 123
variables were also modeled as continuous variables, in which case HRs indicate risks 124
associated with 50 g/day (GL) or 5 units/day (GI) increments of intake. Available carbohydrate 125
was defined as starch and sugars: indigestible carbohydrate was excluded. 126
Three models are presented: model 1 stratified by center, age, and sex; model 2 additionally 127
adjusted for smoking status (current: 1-15 cig/day, 16-25 cig/day, 26+ cig/day; former: quit ≤10 128
years, 11-20 years, 20+ years previously; never), physical activity (inactive, moderately 129
inactive, moderately active, active), BMI (<25, 25-29.9, ≥30 kg/m2), alcohol consumption (not 130
12
drinker, sex-specific quintiles of intake: cut points in men 4.1, 10.6, 19.6, and 37.5 g/d; cut 131
points in women 1.1, 3.4, 7.7, and 14.7 g/d), education (no schooling, primary, 132
technical/professional, secondary, longer education) and blood pressure (high, normal, 133
unknown/missing); model 3 additionally adjusted (all continuous) for intakes of energy, 134
saturated fat, monounsaturated fat, protein, and fiber (or cereal fiber for the analyses 135
investigating GI and GL). Model 3, analyzing GL and available carbohydrate, was also run 136
adjusting for energy, polyunsaturated and monounsaturated fat (not saturated fat), protein, and 137
fiber (or cereal fiber); another model 3 was run adjusting for energy, polyunsaturated, saturated 138
monounsaturated fat, (not protein), and fiber (or cereal fiber). 139
To assess the significance of trends we employed orthogonal polynomial contrasts. Country-140
specific HRs for dietary GI and GL (continuous) were also estimated, and combined with 141
random effects meta-analyses. Pooled HRs were then plotted and between-country 142
heterogeneity was quantified by the I2 statistic (25). The proportional hazards assumption for 143
all variables in relation to CHD risk was tested using the Grambsch and Therneau method (26). 144
In all cases, the assumption was satisfied. 145
To assess whether dietary factors might act through circulating CHD risk factors, we performed 146
analysis of covariance to examine associations of GL/GI with biomarkers of CHD risk (CRP, 147
HDL cholesterol, non-HDL cholesterol, triglycerides, HbA1c, glucose), calculating mean levels 148
in each quintile of GL, and adjusting for the covariates used in model 3. We also examined 149
whether associations of CHD with dietary variables were influenced by reverse causality by 150
excluding CHD events diagnosed in first 2 years of follow up. 151
To examine whether associations of CHD with dietary variables were consistent across sub-152
groups of other risk factors, we conducted subgroup analyses by sex and BMI. Tests for 153
heterogeneity of trend were performed adding appropriate interaction terms to the models and 154

13
testing for significance using a Wald chi-square test. All analyses were conducted using Stata 155
software (version 14.0, Stata Corp, College Station, TX) 156
157

14
RESULTS 158
After 12.8 years (median), 6378 incident CHD cases (4267men, 2111 women) were identified 159
in the EPIC cohort. Table 1 shows baseline characteristics of the cohort by quintiles of energy-160
adjusted dietary GL. Mean GL varied substantially across quintiles (96.5-164.8); while mean 161
GI ranged from 53.4 (lowest quintile) to 58.3 (highest quintile). Participants in the highest GL 162
quintile consumed more carbohydrate and starch, and less fat, protein, and alcohol, and had 163
lower BMI, than those in the lowest; they were often more active and less often current smokers. 164
Table 2 shows cohort characteristics by quintiles of energy-adjusted dietary GI. Mean GI ranged 165
from 50.7 (lowest quintile) to 60.8 (highest quintile); GL ranged from 113.7 (lowest quintile) 166
to 146.6 (highest quintile). Those in the highest GI quintile consumed less saturated fat, 167
monounsaturated fat, and protein, and more carbohydrate and starch, than those in lower 168
quintiles; they were also less educated and more often smokers. Fiber intake and sugar intake 169
increased with increasing GL but decreased with increasing GI. 170
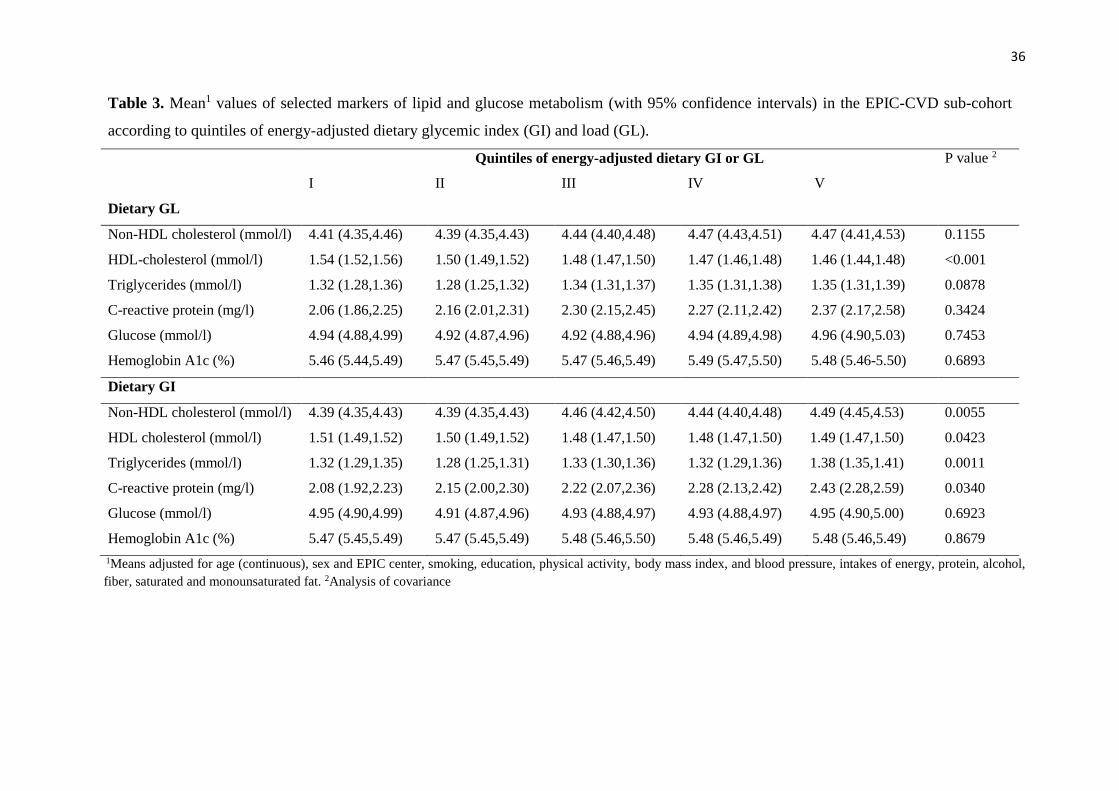
Table 3 shows baseline means of selected biomarkers by quintiles of energy-adjusted GL and 171
GI. Those in the highest GL and GI quintiles had significantly lower HDL cholesterol than those 172
in the lowest quintiles; those in the highest GI quintile had significantly higher triglycerides and 173
CRP than those in the lowest quintile. 174
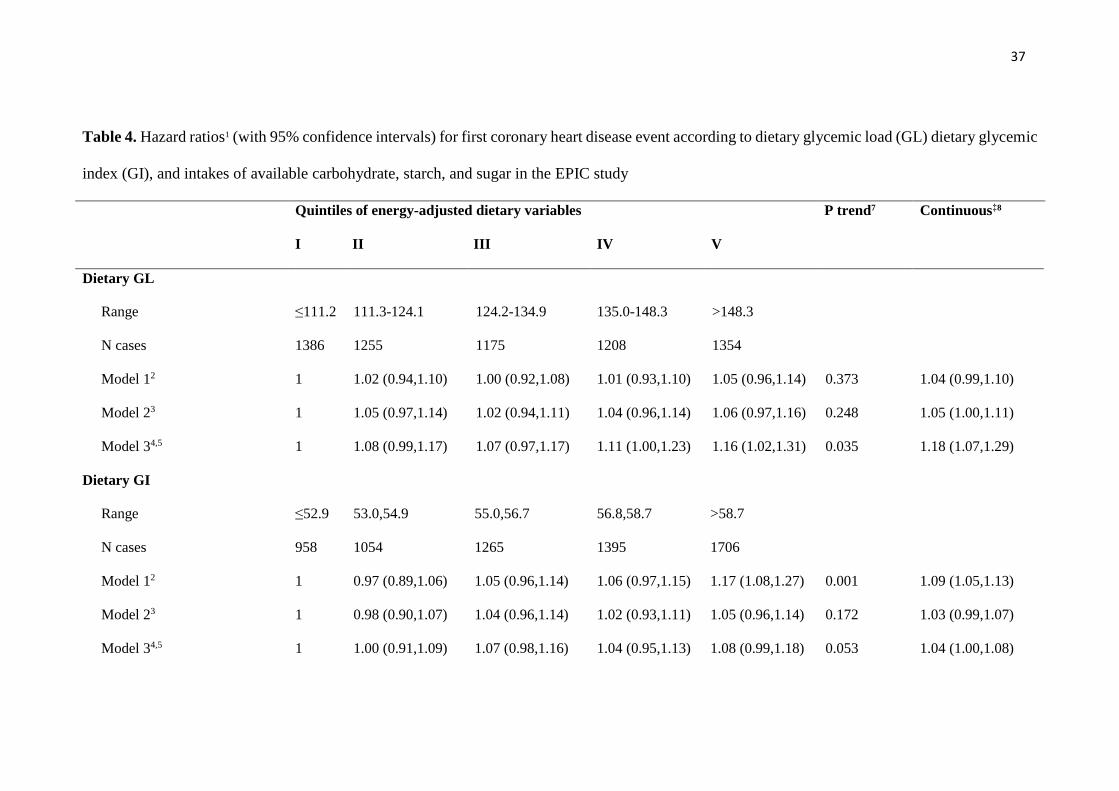
Table 4 shows HRs for CHD by quintiles of energy-adjusted GL, GI, available carbohydrate, 175
starch, and sugar. In models 1 (minimally-adjusted) and 2 (adjusted for CHD risk factors) CHD 176
risk was unrelated to GL. After adjusting for nutrient intake (model 3), the 4th and 5th GL 177
quintiles were associated with greater CHD risk, with p trend 0.035. For 50 g/day GL 178
increments the HR was 1.18 (95% CI 1.07,1.29). In this model, in which the only nutrients not 179
included were polyunsaturated and low-GI carbohydrate, the GL variable represents the effect 180
of substituting GL for polyunsaturated fat and low-GI carbohydrate on CHD risk. When the 181
adjustments in model 3 included polyunsaturated and monounsaturated fat (not saturated fat), 182
15
the HR for 50 g/day GL increments was 1.19 (95% CI 1.09,1.29). When the adjustments in 183
model 3 included polyunsaturated, monounsaturated and saturated fat (not protein), the HR for 184
50 g/day GL increments was 1.13 (95% CI 1.04,1.23) (data not in Tables). 185
GI was associated with greater CHD risk only in the continuous GI model (HR 1.04 95% CI 186
1.00,1.08 per 5 unit/day increment). 187
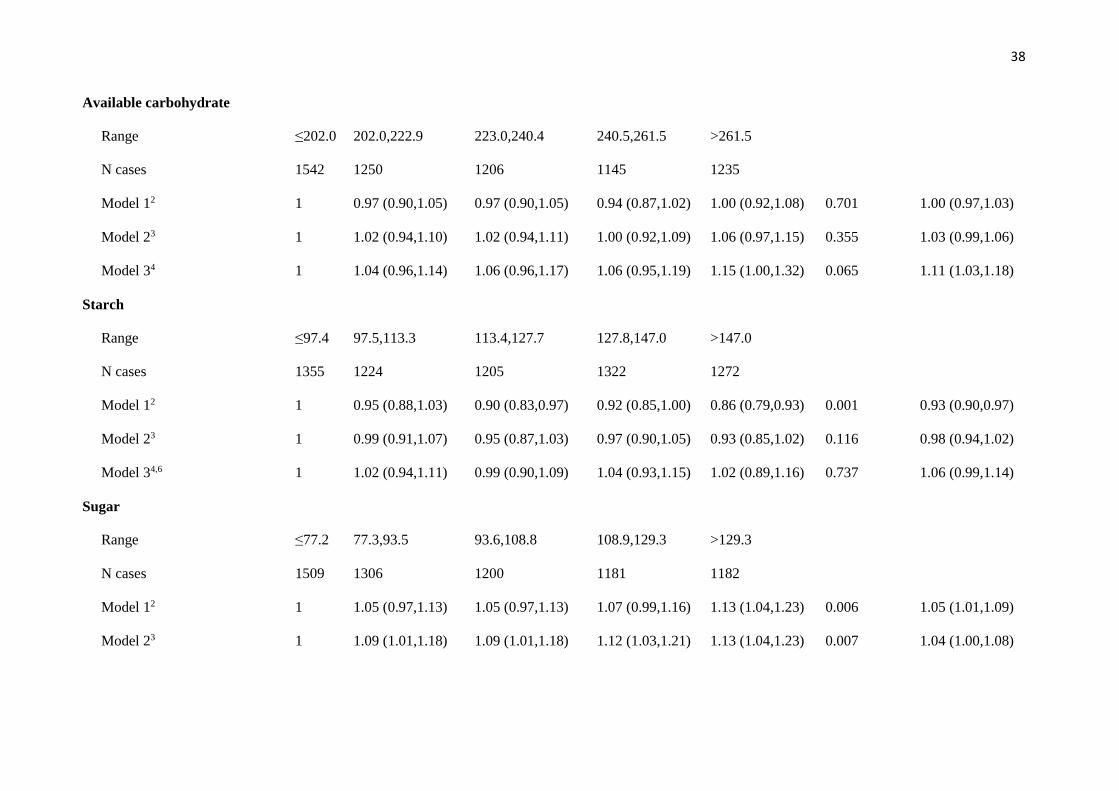
For available carbohydrate in model 3, those in the highest quintile of consumption had greater 188
CHD risk than those in the lowest (HR 1.15; 95% CI 1.00,1.32, p trend 0.065); the risk for 50 189
g/day GL increments was HR 1.11; 95% CI 1.03,1.18. When model 3 was run adjusting for 190
polyunsaturated fat, monounsaturated fat, and protein (not saturated fat), the HR for 50 g/day 191
increments was 1.14 (95% CI 1.07,1.22); when run adjusting for polyunsaturated, 192
monounsaturated, and saturated fat (not protein), the HR for 50 g/day increments was 1.08 (95% 193
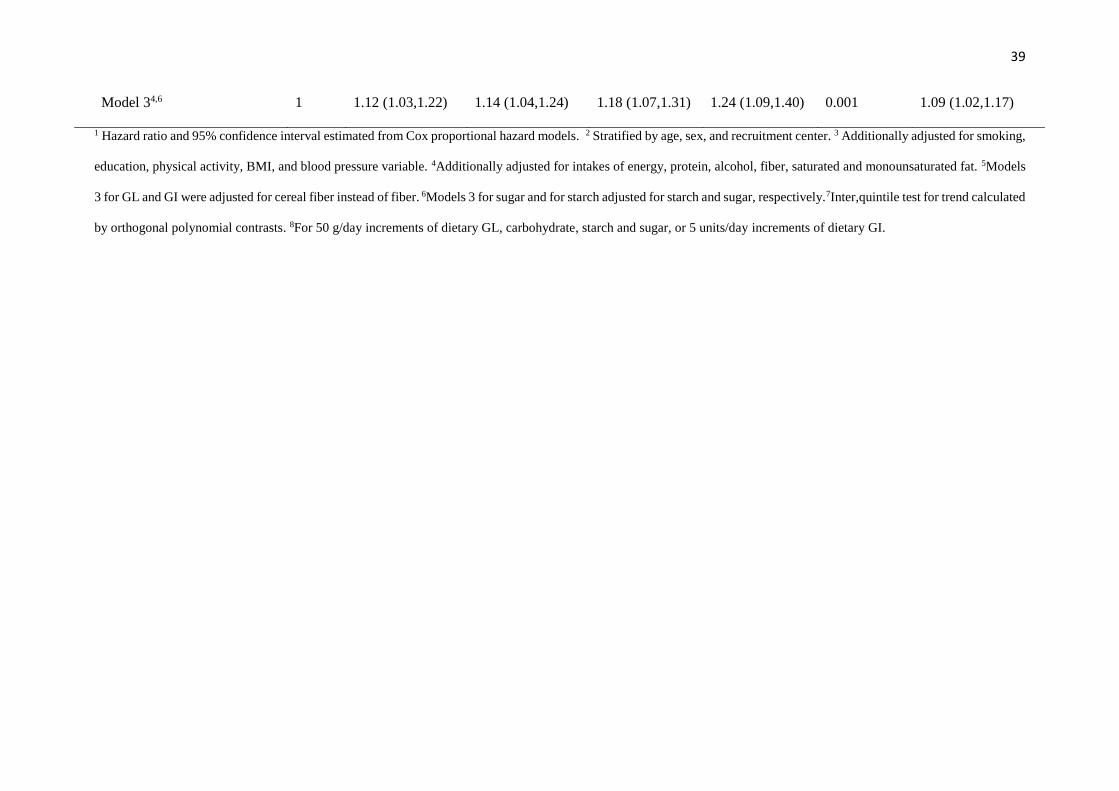
CI 1.02,1.15) (data not in Tables). Sugar intake was associated with greater CHD risk in all 194
quintiles of consumption, and the HR for 50 g/day increments was 1.09 (95% CI 1.02,1.17). 195
Starch was not associated with CHD risk. 196
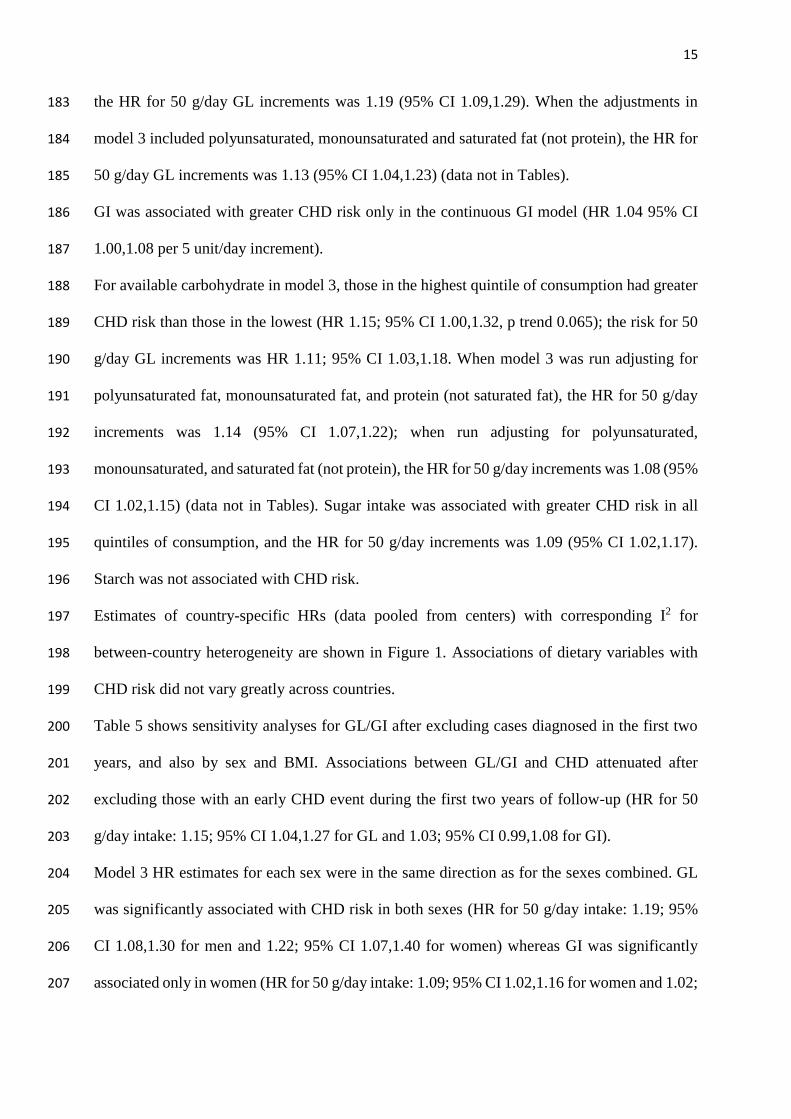
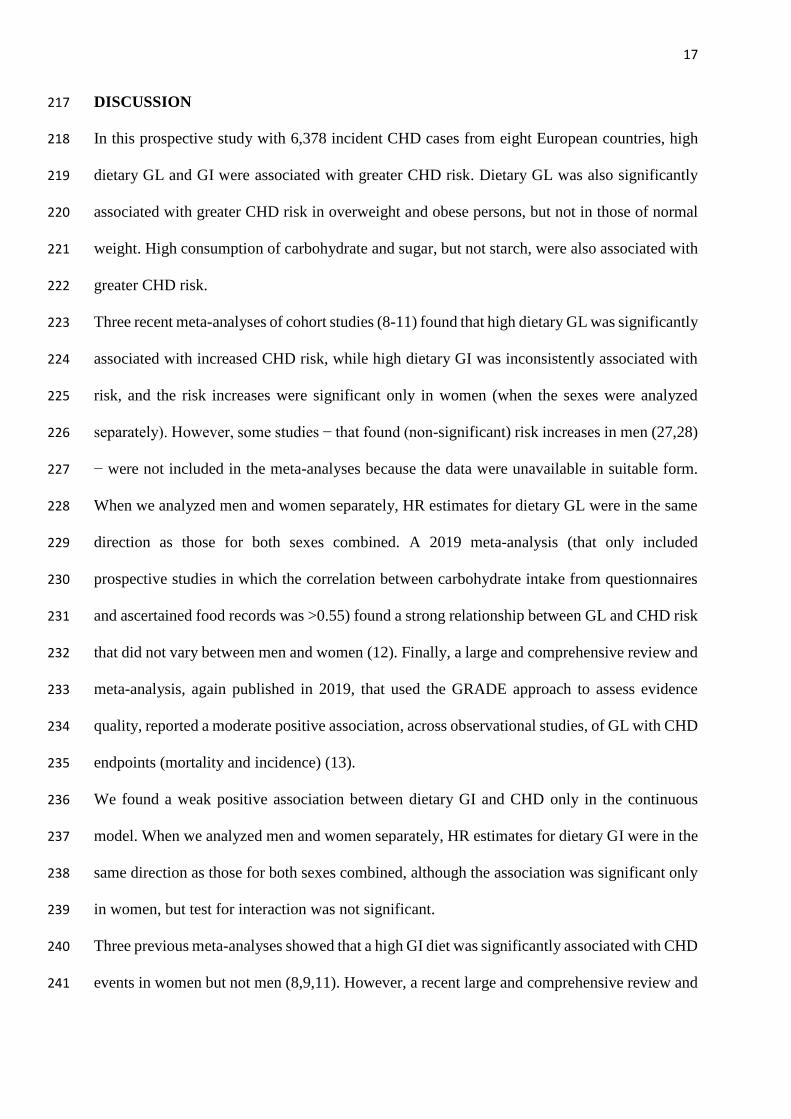
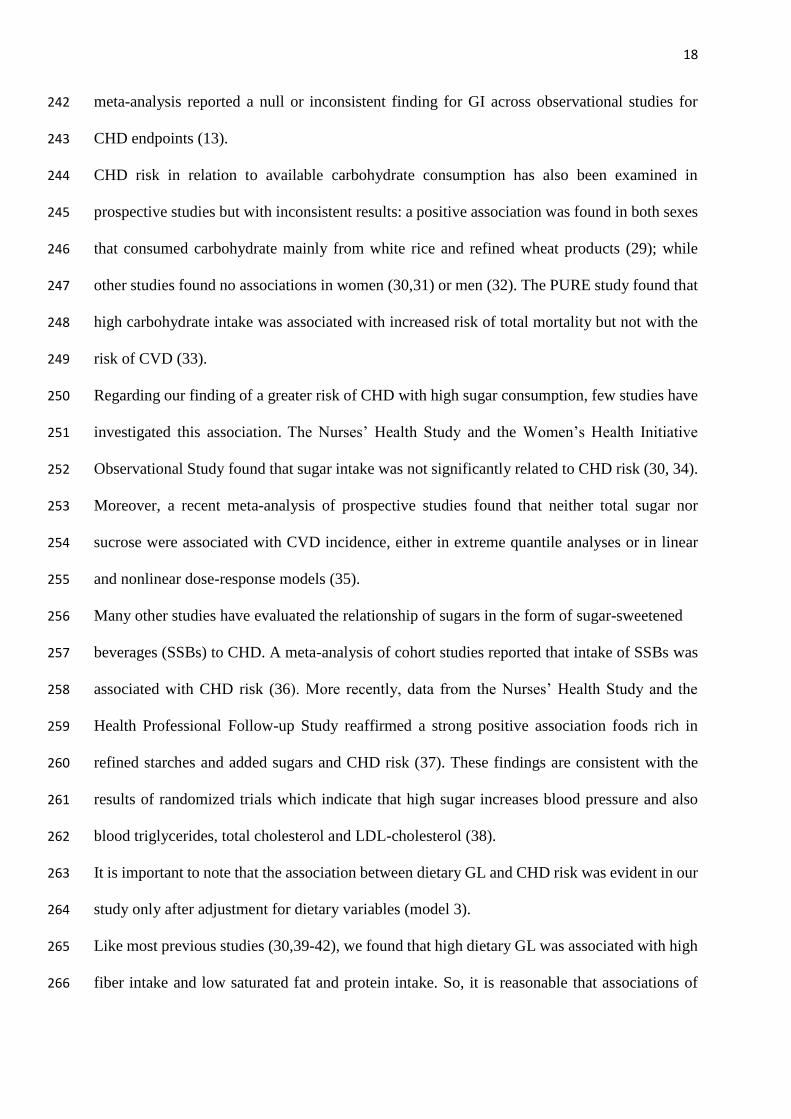
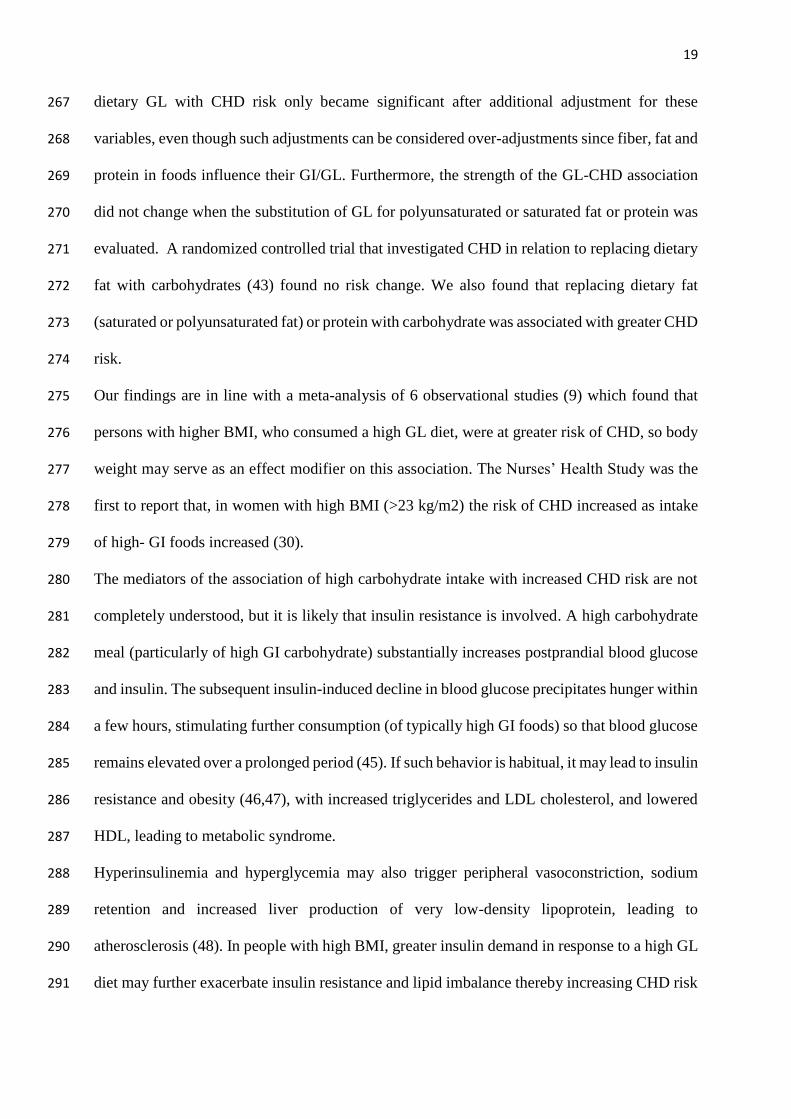
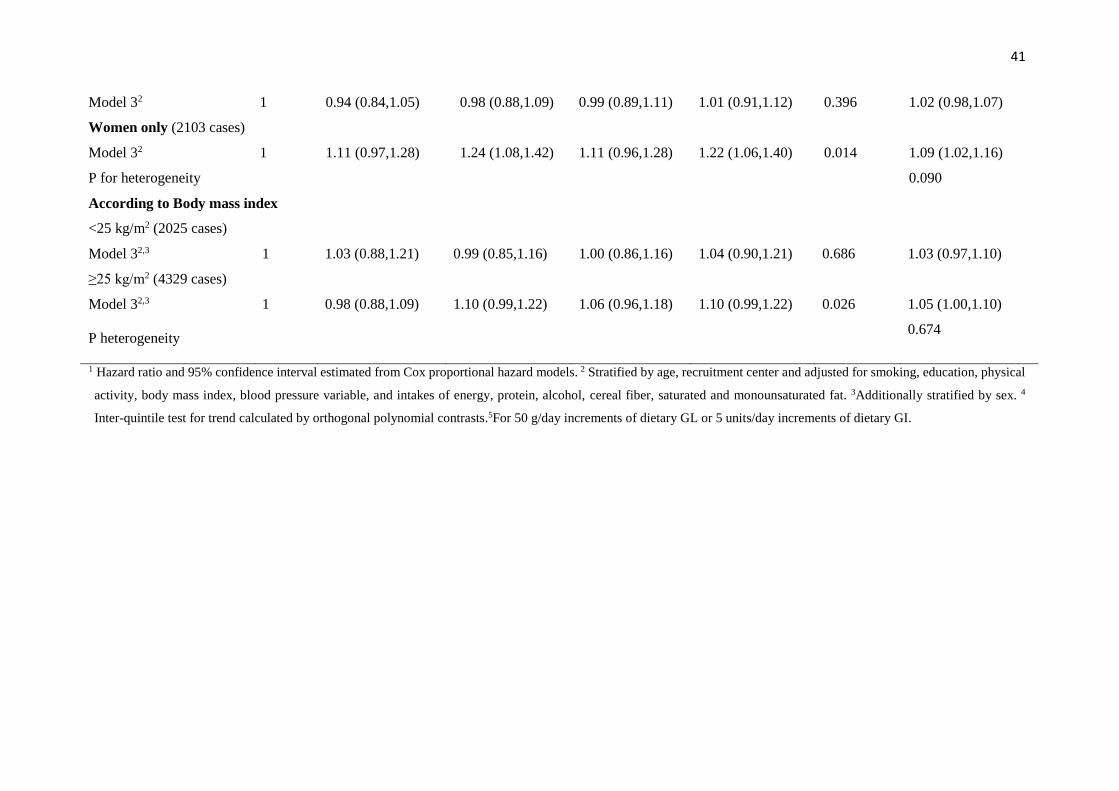
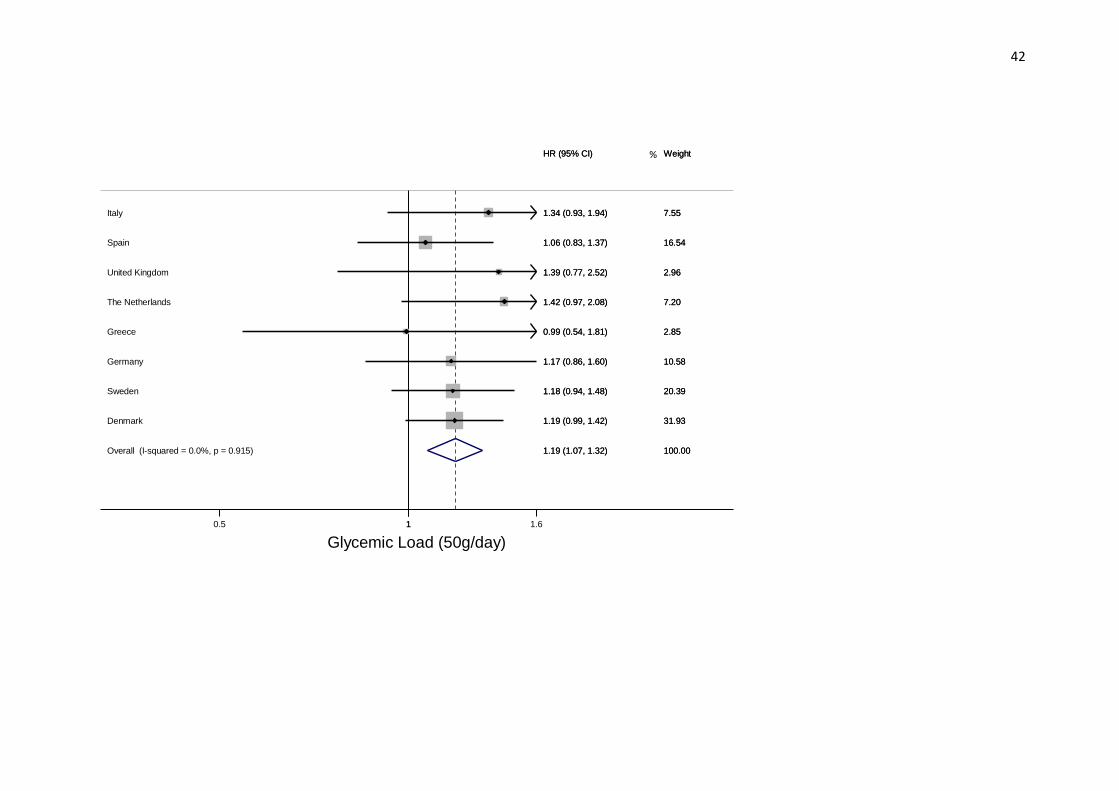
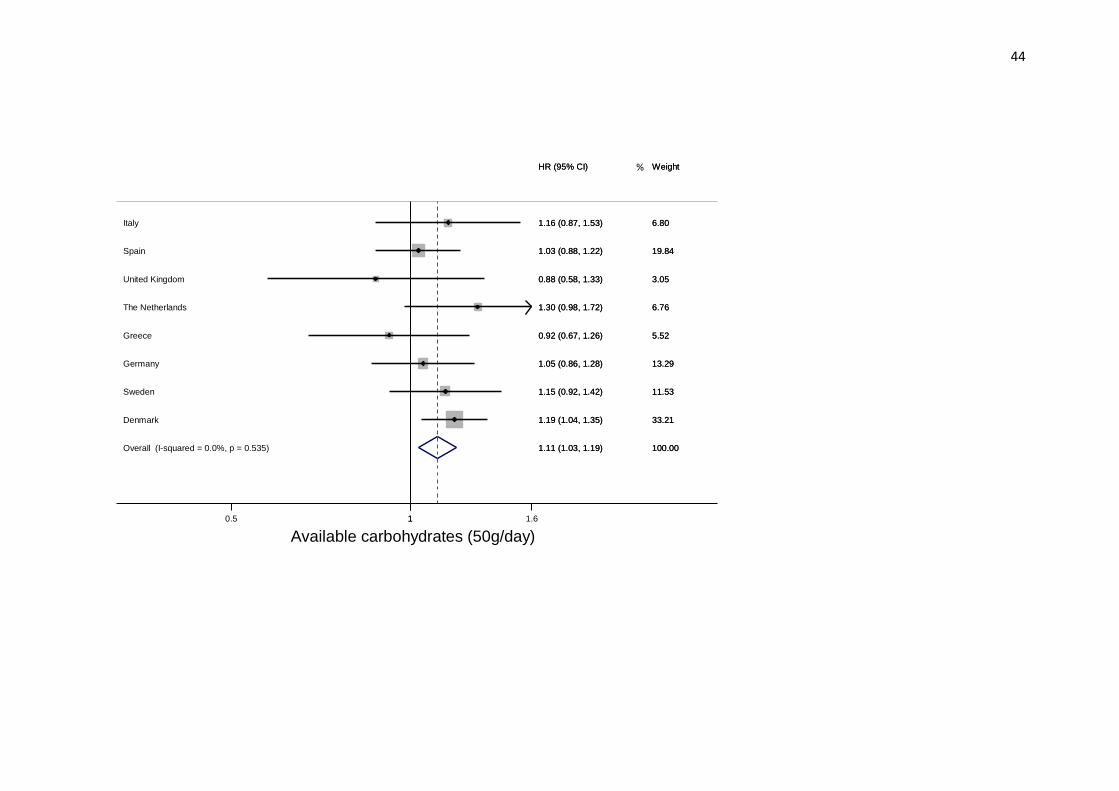
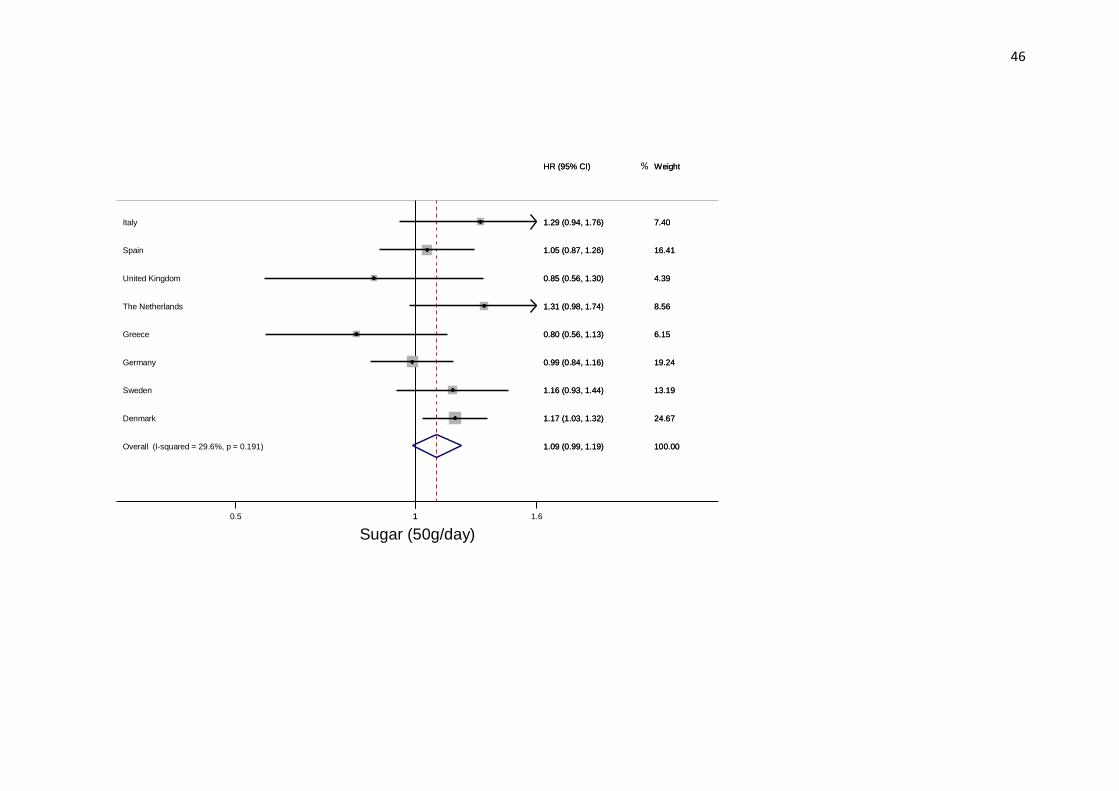
Estimates of country-specific HRs (data pooled from centers) with corresponding I2 for 197
between-country heterogeneity are shown in Figure 1. Associations of dietary variables with 198
CHD risk did not vary greatly across countries. 199
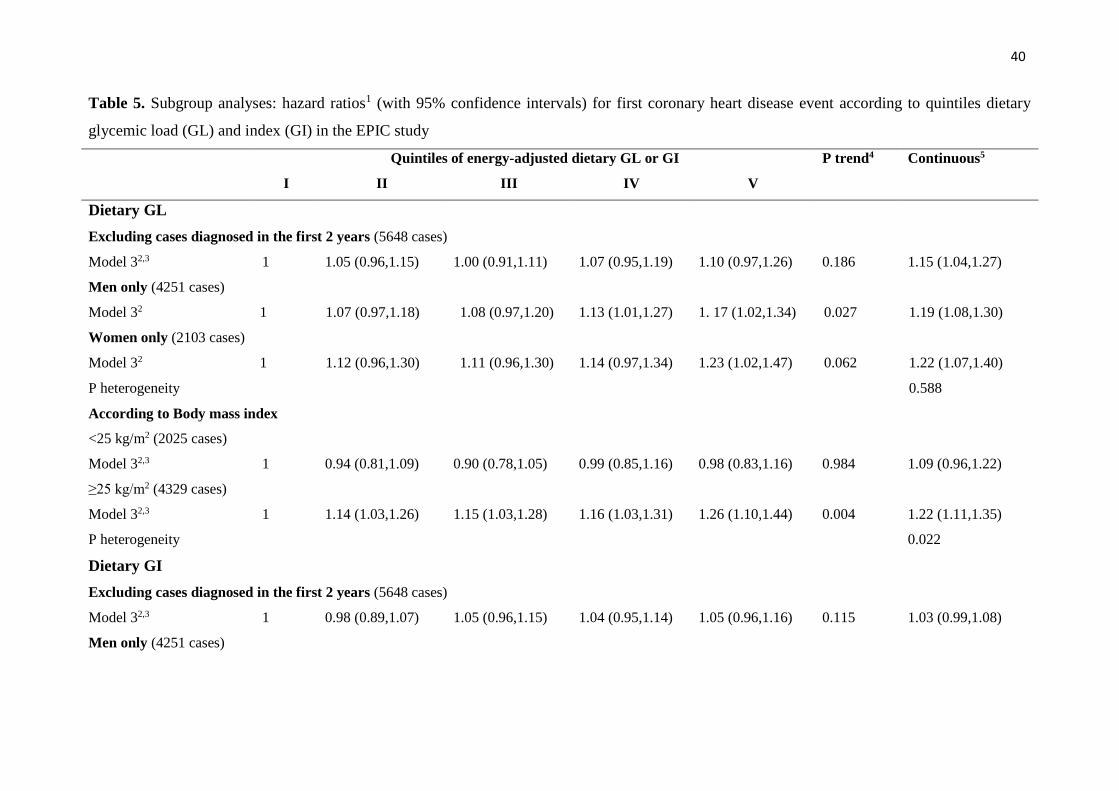
Table 5 shows sensitivity analyses for GL/GI after excluding cases diagnosed in the first two 200
years, and also by sex and BMI. Associations between GL/GI and CHD attenuated after 201
excluding those with an early CHD event during the first two years of follow-up (HR for 50 202
g/day intake: 1.15; 95% CI 1.04,1.27 for GL and 1.03; 95% CI 0.99,1.08 for GI). 203
Model 3 HR estimates for each sex were in the same direction as for the sexes combined. GL 204
was significantly associated with CHD risk in both sexes (HR for 50 g/day intake: 1.19; 95% 205
CI 1.08,1.30 for men and 1.22; 95% CI 1.07,1.40 for women) whereas GI was significantly 206
associated only in women (HR for 50 g/day intake: 1.09; 95% CI 1.02,1.16 for women and 1.02; 207

16
95% CI 0.98,1.07 for men). However, the interaction of dietary GL and GI with sex was not 208
significant. 209
Finally, associations between CHD and GL varied with BMI category. High GL was associated 210
with greater CHD risk among participants with BMI ≥25 mg/kg2 (HR for 50 g/day increments 211
1.22; 95% CI 1.11,1.35); whereas no association was found in participants with BMI <2525 212
mg/kg2 (HR for 50 g/day increments 1.09; 95% CI 0.96,1.22). The interaction of GL with BMI 213
was significant (p 0.022). 214
215
216
17
DISCUSSION 217
In this prospective study with 6,378 incident CHD cases from eight European countries, high 218
dietary GL and GI were associated with greater CHD risk. Dietary GL was also significantly 219
associated with greater CHD risk in overweight and obese persons, but not in those of normal 220
weight. High consumption of carbohydrate and sugar, but not starch, were also associated with 221
greater CHD risk. 222
Three recent meta-analyses of cohort studies (8-11) found that high dietary GL was significantly 223
associated with increased CHD risk, while high dietary GI was inconsistently associated with 224
risk, and the risk increases were significant only in women (when the sexes were analyzed 225
separately). However, some studies − that found (non-significant) risk increases in men (27,28) 226
− were not included in the meta-analyses because the data were unavailable in suitable form. 227
When we analyzed men and women separately, HR estimates for dietary GL were in the same 228
direction as those for both sexes combined. A 2019 meta-analysis (that only included 229
prospective studies in which the correlation between carbohydrate intake from questionnaires 230
and ascertained food records was >0.55) found a strong relationship between GL and CHD risk 231
that did not vary between men and women (12). Finally, a large and comprehensive review and 232
meta-analysis, again published in 2019, that used the GRADE approach to assess evidence 233
quality, reported a moderate positive association, across observational studies, of GL with CHD 234
endpoints (mortality and incidence) (13). 235
We found a weak positive association between dietary GI and CHD only in the continuous 236
model. When we analyzed men and women separately, HR estimates for dietary GI were in the 237
same direction as those for both sexes combined, although the association was significant only 238
in women, but test for interaction was not significant. 239
Three previous meta-analyses showed that a high GI diet was significantly associated with CHD 240
events in women but not men (8,9,11). However, a recent large and comprehensive review and 241
18
meta-analysis reported a null or inconsistent finding for GI across observational studies for 242
CHD endpoints (13). 243
CHD risk in relation to available carbohydrate consumption has also been examined in 244
prospective studies but with inconsistent results: a positive association was found in both sexes 245
that consumed carbohydrate mainly from white rice and refined wheat products (29); while 246
other studies found no associations in women (30,31) or men (32). The PURE study found that 247
high carbohydrate intake was associated with increased risk of total mortality but not with the 248
risk of CVD (33). 249
Regarding our finding of a greater risk of CHD with high sugar consumption, few studies have 250
investigated this association. The Nurses’ Health Study and the Women’s Health Initiative 251
Observational Study found that sugar intake was not significantly related to CHD risk (30, 34). 252
Moreover, a recent meta-analysis of prospective studies found that neither total sugar nor 253
sucrose were associated with CVD incidence, either in extreme quantile analyses or in linear 254
and nonlinear dose-response models (35). 255
Many other studies have evaluated the relationship of sugars in the form of sugar-sweetened 256
beverages (SSBs) to CHD. A meta-analysis of cohort studies reported that intake of SSBs was 257
associated with CHD risk (36). More recently, data from the Nurses’ Health Study and the 258
Health Professional Follow-up Study reaffirmed a strong positive association foods rich in 259
refined starches and added sugars and CHD risk (37). These findings are consistent with the 260
results of randomized trials which indicate that high sugar increases blood pressure and also 261
blood triglycerides, total cholesterol and LDL-cholesterol (38). 262
It is important to note that the association between dietary GL and CHD risk was evident in our 263
study only after adjustment for dietary variables (model 3). 264
Like most previous studies (30,39-42), we found that high dietary GL was associated with high 265
fiber intake and low saturated fat and protein intake. So, it is reasonable that associations of 266
19
dietary GL with CHD risk only became significant after additional adjustment for these 267
variables, even though such adjustments can be considered over-adjustments since fiber, fat and 268
protein in foods influence their GI/GL. Furthermore, the strength of the GL-CHD association 269
did not change when the substitution of GL for polyunsaturated or saturated fat or protein was 270
evaluated. A randomized controlled trial that investigated CHD in relation to replacing dietary 271
fat with carbohydrates (43) found no risk change. We also found that replacing dietary fat 272
(saturated or polyunsaturated fat) or protein with carbohydrate was associated with greater CHD 273
risk. 274
Our findings are in line with a meta-analysis of 6 observational studies (9) which found that 275
persons with higher BMI, who consumed a high GL diet, were at greater risk of CHD, so body 276
weight may serve as an effect modifier on this association. The Nurses’ Health Study was the 277
first to report that, in women with high BMI (>23 kg/m2) the risk of CHD increased as intake 278
of high- GI foods increased (30). 279
The mediators of the association of high carbohydrate intake with increased CHD risk are not 280
completely understood, but it is likely that insulin resistance is involved. A high carbohydrate 281
meal (particularly of high GI carbohydrate) substantially increases postprandial blood glucose 282
and insulin. The subsequent insulin-induced decline in blood glucose precipitates hunger within 283
a few hours, stimulating further consumption (of typically high GI foods) so that blood glucose 284
remains elevated over a prolonged period (45). If such behavior is habitual, it may lead to insulin 285
resistance and obesity (46,47), with increased triglycerides and LDL cholesterol, and lowered 286
HDL, leading to metabolic syndrome. 287
Hyperinsulinemia and hyperglycemia may also trigger peripheral vasoconstriction, sodium 288
retention and increased liver production of very low-density lipoprotein, leading to 289
atherosclerosis (48). In people with high BMI, greater insulin demand in response to a high GL 290
diet may further exacerbate insulin resistance and lipid imbalance thereby increasing CHD risk 291
20
(49). This scenario is supported by a meta-analysis of randomized intervention trials (50) which 292
found that lowering dietary GI reduced CVD risk factors, lowering triglycerides and LDL 293
cholesterol and raising HDL cholesterol. However, such responses are not always observed 294
(5152). From Table 3 it is evident that as dietary GI increased so did triglyceride and non-HDL 295
cholesterol levels; while as dietary GL increased HDL cholesterol decreased. These cross-296
sectional associations are nevertheless consistent with the hypothesis that insulin resistance 297
mediates the high carbohydrate-CHD association. A randomized intervention trial on patients 298
with diabetes found higher HDL cholesterol levels in the low GI treatment group (53). 299
Strengths of our study are: large number of CHD cases, prospective design, and long follow-300
up, limiting the likelihood of reverse causation and selection bias. Although we had extensive 301
data on potential confounders that were used as covariates in the models, we cannot rule out the 302
presence of residual confounding. 303
A limitation of our study is that the dietary questionnaires (14) were not designed to specifically 304
estimate dietary GI/GL, although application of GI values to food items is straightforward, and 305
Liu et al., found it was possible to accurately estimate dietary GI and GL from questionnaire 306
responses (54). Another limitation is that diet was only assessed at baseline. Some participants 307
may have changed their diet during follow-up, giving rise to misclassification of exposure 308
which would have weakened diet-disease associations. Finally, most people do not eat single 309
foods, but meals, and a food’s GI can vary depending on how it is prepared and combined with 310
other foods: it is not possible to take such interactions into account using a food questionnaire. 311
However strong correlations have been found between observed and calculated GIs for mixed 312
meals (55). 313
CONCLUSIONS 314
This large pan-European study has revealed a robust positive association between a diet that 315
induces a high glucose response and increased CHD risk. 316

21
Acknowledgements 317
We thank all EPIC participants. We also thank EPIC staff, including those at the EPIC-CVD 318
and EPIC-InterAct Coordinating Centres, for sample preparation and data handling, particularly 319
Sarah Spackman (EPIC-CVD Data Manager) and Nicola Kerrison (EPIC-InterAct Data 320
Manager, MRC Epidemiology Unit). We are also pleased to acknowledge Statistics Netherlands 321
for providing causes of death information on Dutch EPIC participants. Thanks are also due to 322
Don Ward for help with the English. 323
Authors’ contributions to the manuscript: 324
SS, VK, AC, SG, ASB and JD designed the study, had full access to all study data and take 325
responsibility for the integrity of the data and the accuracy of the analyses. SS drafted the 326
manuscript. SS and VK did the statistical analyses. VK, YTV, IS, LMN, VAK, KO, TYNT, 327
JRQ, JHG, AT, ES, AT, EW, JMAB, ATr, WMMV, MJF, MCB, MMB, MBS, PF, RT, GM, 328
AM, ER, ASB, AB, MS, JD, SG, TK, PW, OM, MUJ, JMG, AK, EV, IS, GF, ALM, HF, HL, 329
MIC, CS, NGF take responsibility for the databases and follow-up data. All authors contributed 330
to data interpretation, and critical revision of the article, and approved the final manuscript. 331
332
Disclosures 333
Adam Butterworth has received grants unrelated to the present study from AstraZeneca, Biogen, 334
Merck, Novartis, and Sanofi. All other authors affirm that they have no relationships with 335
industry relevant to present study. 336
22
References
1. Sacks FM, Lichtenstein AH, Wu JHY, Appel LJ, Creager MA, Kris-Etherton PM, Miller M,
Rimm EB, Rudel LL, Robinson JG et al. Dietary Fats and Cardiovascular Disease: A
Presidential Advisory From the American Heart Association. Circulation 2017;136:e1-e23.
2. Hu T, Bazzano LA. The low-carbohydrate diet and cardiovascular risk factors: evidence from
epidemiologic studies. Nutr Metab Cardiovasc Dis 2014;24:337-43.
3. Li Y, Hruby A, Bernstein AM, Ley SH, Wang DD, Chiuve SE, Sampson L, Rexrode KM, Rimm
EB, Willett WC et al. Saturated Fats Compared With Unsaturated Fats and Sources of
Carbohydrates in Relation to Risk of Coronary Heart Disease: A Prospective Cohort Study. J
Am Coll Cardiol 2015;66:1538-48.
4. Parks EJ, Hellerstein MK. Carbohydrate-induced hypertriacylglycerolemia: historical
perspective and review of biological mechanisms. Am J Clin Nutr 2000;71:412-33.
5. Siri PW, Krauss RM. Influence of dietary carbohydrate and fat on LDL and HDL particle
distributions. Curr Atheroscler Rep 2005;7:455-9.
6. Ludwig DS. The glycemic index: physiological mechanisms relating to obesity, diabetes, and
cardiovascular disease. JAMA 2002;287:2414-23.
7. Jenkins DJ, Wolever TM, Taylor RH, Barker H, Fielden H, Baldwin JM, Bowling AC, Newman
HC, Jenkins AL, Goff DV. Glycemic index of foods: a physiological basis for carbohydrate
exchange. Am J Clin Nutr 1981;34:362-6.
8. Dong JY, Zhang YH, Wang P, Qin LQ. Meta-analysis of dietary glycemic load and glycemic
index in relation to risk of coronary heart disease. Am J Cardiol 2012;109:1608-13.
23
9. Fan J, Song Y, Wang Y, Hui R, Zhang W. Dietary glycemic index, glycemic load, and risk of
coronary heart disease, stroke, and stroke mortality: a systematic review with meta-analysis.
PLoS One 2012;7:e52182.
10. Mirrahimi A, de Souza RJ, Chiavaroli L, Sievenpiper JL, Beyene J, Hanley AJ, Augustin LS,
Kendall CW, Jenkins DJ. Associations of glycemic index and load with coronary heart disease
events: a systematic review and meta-analysis of prospective cohorts. J Am Heart Assoc
2012;1:e000752.
11. Mirrahimi A, Chiavaroli L, Srichaikul K, Augustin LS, Sievenpiper JL, Kendall CW, Jenkins
DJ. The role of glycemic index and glycemic load in cardiovascular disease and its risk factors:
a review of the recent literature. Curr Atheroscler Rep 2014;16:381.
12. Livesey G, Livesey H. Coronary Heart Disease and Dietary Carbohydrate, Glycemic Index, and
Glycemic Load: Dose-Response Meta-analyses of Prospective Cohort Studies. Mayo Clin Proc
Innov Qual Outcomes 2019;3:52-69.
13. Reynolds A, Mann J, Cummings J, Winter N, Mete E, Te ML. Carbohydrate quality and human
health: a series of systematic reviews and meta-analyses. Lancet 2019;393:434-45.
14. Riboli E, Kaaks R. The EPIC Project: rationale and study design. European Prospective
Investigation into Cancer and Nutrition. Int J Epidemiol 1997;26 Suppl 1:S6-14.
15. Danesh J, Saracci R, Berglund G, Feskens E, Overvad K, Panico S, Thompson S, Fournier A,
Clavel-Chapelon F, Canonico M et al. EPIC-Heart: the cardiovascular component of a
prospective study of nutritional, lifestyle and biological factors in 520,000 middle-aged
participants from 10 European countries. Eur J Epidemiol 2007;22:129-41.PM:17295097
16. Slimani N, Deharveng G, Unwin I, Southgate DA, Vignat J, Skeie G, Salvini S, Parpinel M,
Moller A, Ireland J et al. The EPIC nutrient database project (ENDB): a first attempt to standardize
24
nutrient databases across the 10 European countries participating in the EPIC study. Eur J Clin
Nutr 2007; 61(9):1037-56
17. Foster-Powell K, Holt SH, Brand-Miller JC. International table of glycemic index and glycemic
load values: 2002. Am J Clin Nutr 2002;76:5-56.
18. Henry CJ, Lightowler HJ, Strik CM, Renton H, Hails S. Glycaemic index and glycaemic load
values of commercially available products in the UK. Br J Nutr 2005;94:922-30.
19. Human Nutrition Unit SoMaMB, University of Sydney. The Official Website of the Glycemic
Index and GI Database. Sydney, 2006. 2006.
20. Cust AE, Slimani N, Kaaks R, van BM, Biessy C, Ferrari P, Laville M, Tjonneland A, Olsen A,
Overvad K et al. Dietary carbohydrates, glycemic index, glycemic load, and endometrial cancer
risk within the European Prospective Investigation into Cancer and Nutrition cohort. Am J
Epidemiol 2007;166:912-23.
21. Ainsworth BE, Haskell WL, Whitt MC, Irwin ML, Swartz AM, Strath SJ, O'Brien WL, Bassett
DR, Jr., Schmitz KH, Emplaincourt PO et al. Compendium of physical activities: an update of
activity codes and MET intensities. Med Sci Sports Exerc 2000;32:S498-S504.
22. Schulze MB, Kroke A, Saracci R, Boeing H. The effect of differences in measurement procedure
on the comparability of blood pressure estimates in multi-centre studies. Blood Press Monit
2002;7:95-104.
23 . Langenberg C, Sharp S, Forouhi NG, Franks PW, Schulze MB, Kerrison N, Ekelund U, Barroso
I, Panico S, Tormo MJ et al. Design and cohort description of the InterAct Project: an
examination of the interaction of genetic and lifestyle factors on the incidence of type 2 diabetes
in the EPIC Study. Diabetologia 2011;54:2272-82.
24. Willett W, Stampfer MJ. Total energy intake: implications for epidemiologic analyses. Am J
Epidemiol 1986;124:17-27.
25
25. Ioannidis JP, Patsopoulos NA, Evangelou E. Uncertainty in heterogeneity estimates in meta-
analyses. BMJ 2007;335:914-6.
26. Grambsch PTT. Proportional hazards tests and diagnostics based on weighted residuals.
Biometrika 1994;81:515-26.
27. Jakobsen MU, Dethlefsen C, Joensen AM, Stegger J, Tjonneland A, Schmidt EB, Overvad K.
Intake of carbohydrates compared with intake of saturated fatty acids and risk of myocardial
infarction: importance of the glycemic index. Am J Clin Nutr 2010;91:1764-8.
28. Hardy DS, Hoelscher DM, Aragaki C, Stevens J, Steffen LM, Pankow JS, Boerwinkle E.
Association of glycemic index and glycemic load with risk of incident coronary heart disease
among Whites and African Americans with and without type 2 diabetes: the Atherosclerosis
Risk in Communities study. Ann Epidemiol 2010;20:610-6.
29. Yu D, Shu XO, Li H, Xiang YB, Yang G, Gao YT, Zheng W, Zhang X. Dietary carbohydrates,
refined grains, glycemic load, and risk of coronary heart disease in Chinese adults. Am J
Epidemiol 2013;178:1542-9.
30. Liu S, Willett WC, Stampfer MJ, Hu FB, Franz M, Sampson L, Hennekens CH, Manson JE. A
prospective study of dietary glycemic load, carbohydrate intake, and risk of coronary heart
disease in US women. Am J Clin Nutr 2000;71:1455-61.
31. Halton TL, Willett WC, Liu S, Manson JE, Albert CM, Rexrode K, Hu FB. Low-carbohydrate-
diet score and the risk of coronary heart disease in women. N Engl J Med 2006;355:1991-2002.
32. Simila ME, Kontto JP, Mannisto S, Valsta LM, Virtamo J. Glycaemic index, carbohydrate
substitution for fat and risk of CHD in men. Br J Nutr 2013;110:1704-11.
33 Dehghan M, Mente A, Zhang X, Swaminathan S, Li W, Mohan V, Iqbal R, Kumar R, Wentzel-
Viljoen E, Rosengren A et al. Associations of fats and carbohydrate intake with cardiovascular

26
disease and mortality in 18 countries from five continents (PURE): a prospective cohort study.
The Lancet 2017;390:2050-62.
34. Tasevska N, Pettinger M, Kipnis V, Midthune D, Tinker LF, Potischman N, Neuhouser ML,
Beasley JM, Van Horn L, Howard BV, Liu S, Manson JE, Shikany JM, Thomson CA, Prentice
RL. Associations of Biomarker-Calibrated Intake of Total Sugars with the Risk of Type 2
Diabetes and Cardiovascular Disease in the Women's Health Initiative Observational Study. Am
J Epidemiol. 2018; 1;187(10):2126-2135
35. Khan TA, Tayyiba M, Agarwal A, Mejia SB, de Souza RJ, Wolever TMS, Leiter LA, Kendall
CWC, Jenkins DJA, Sievenpiper JL. Relation of Total Sugars, Sucrose, Fructose, and Added
Sugars With the Risk of Cardiovascular Disease: A Systematic Review and Dose-Response
Meta-analysis of Prospective Cohort Studies. Mayo Clin Proc. 2019 Dec;94(12):2399-2414
36. Huang C, Huang J, Tian Y, Yang X, and Gu D. Sugar sweetened beverages consumption and risk
of coronary heart disease: a meta-analysis of prospective studies. Atherosclerosis. 2014; 234:
11–16
37 Li Y, Hruby A, Bernstein A.M, , Ley SH, Wang DD, Chiuve SE, Sampson L, Rexrode KM,
Rimm EB, Willett WC, Hu FB. Saturated fats compared with unsaturated fats and sources of
carbohydrates in relation to risk of coronary heart disease: a prospective cohort study. J Am Coll
Cardiol. 2015; 66: 1538–1548
38. Te Morenga LA, Howatson AJ, Jones RM, Mann J. Dietary sugars and cardiometabolic risk:
Systematic review and meta-analyses of randomized controlled trials of the effects on blood
pressure and lipids. Am J Clin Nutr; 2014, 100: 65–79
39. Beulens JW, de Bruijne LM, Stolk RP, Peeters PH, Bots ML, Grobbee DE, van der
Schouw YT. High dietary glycemic load and glycemic index increase risk of cardiovascular
disease among middle-aged women: a population-based follow-up study. J Am Coll Cardiol
2007;50:14-21.
27
40. Levitan EB, Mittleman MA, Wolk A. Dietary glycemic index, dietary glycemic load, and
incidence of heart failure events: a prospective study of middle-aged and elderly women. J Am
Coll Nutr 2010;29:65-71.
41. Levitan EB, Mittleman MA, Hakansson N, Wolk A. Dietary glycemic index, dietary glycemic
load, and cardiovascular disease in middle-aged and older Swedish men. Am J Clin Nutr
2007;85:1521-6.
42. Mursu J, Virtanen JK, Rissanen TH, Tuomainen TP, Nykanen I, Laukkanen JA, Kortelainen R,
Voutilainen S. Glycemic index, glycemic load, and the risk of acute myocardial infarction in
Finnish men: the Kuopio Ischaemic Heart Disease Risk Factor Study. Nutr Metab Cardiovasc
Dis 2011;21:144-9.
43. Prentice RL, Aragaki AK, Van HL, Thomson CA, Beresford SA, Robinson J, Snetselaar L,
Anderson GL, Manson JE, Allison MA et al. Low-fat dietary pattern and cardiovascular disease:
results from the Women's Health Initiative randomized controlled trial. Am J Clin Nutr
2017;106:35-43.
44. Grau K, Tetens I, Bjornsbo KS, Heitman BL. Overall glycaemic index and glycaemic load of
habitual diet and risk of heart disease. Public Health Nutr 2011;14:109-18.
45. Bell SJ, Sears B. Low-glycemic-load diets: impact on obesity and chronic diseases. Crit Rev
Food Sci Nutr 2003;43:357-77.
46. Pi-Sunyer FX. Glycemic index and disease. Am J Clin Nutr 2002;76:290S-8S.
47. Saris WH. Sugars, energy metabolism, and body weight control. Am J Clin Nutr 2003;78:850S-
7S.
48. Mottillo S, Filion KB, Genest J, Joseph L, Pilote L, Poirier P, Rinfret S, Schiffrin EL, Eisenberg
MJ. The metabolic syndrome and cardiovascular risk a systematic review and meta-analysis. J
Am Coll Cardiol 2010;56:1113-32.PM:20863953
28
49. Willett W, Manson J, Liu S. Glycemic index, glycemic load, and risk of type 2 diabetes. Am J
Clin Nutr 2002;76:274S-80S.
50. Nordmann AJ, Nordmann A, Briel M, Keller U, Yancy WS, Jr., Brehm BJ, Bucher HC. Effects
of low-carbohydrate vs low-fat diets on weight loss and cardiovascular risk factors: a meta-
analysis of randomized controlled trials. Arch Intern Med 2006;166:285-93.
51 Clar C, Al-Khudairy L, Loveman E, Kelly SA, Hartley L, Flowers N, Germano R, Frost G, Rees
K. Low glycaemic index diets for the prevention of cardiovascular disease. Cochrane Database
Syst Rev 2017;7:CD004467.
52 Goff LM, Cowland DE, Hooper L, Frost GS. Low glycaemic index diets and blood lipids: a
systematic review and meta-analysis of randomised controlled trials. Nutr Metab Cardiovasc
Dis 2013;23:1-10.
53. Jenkins DJ, Kendall CW, Keown-Eyssen G, Josse RG, Silverberg J, Booth GL, Vidgen E, Josse
AR, Nguyen TH, Corrigan S et al. Effect of a low-glycemic index or a high-cereal fiber diet on
type 2 diabetes: a randomized trial. JAMA 2008;300:2742-53.
54. Liu S, Manson JE, Stampfer MJ, Holmes MD, Hu FB, Hankinson SE, Willett WC. Dietary
glycemic load assessed by food-frequency questionnaire in relation to plasma high-density-
lipoprotein cholesterol and fasting plasma triacylglycerols in postmenopausal women. Am J
Clin Nutr 2001;73:560-6.
55. Wolever TM, Yang M, Zeng XY, Atkinson F, Brand-Miller JC. Food glycemic index, as given
in glycemic index tables, is a significant determinant of glycemic responses elicited by
composite breakfast meals. Am J Clin Nutr 2006;83:1306-12.
29
Figure 1.
Title: Forest plots showing country-specific hazard ratios (HRs) and 95% confidence intervals
(CI) for coronary heart disease in relation to dietary glycemic load, dietary glycemic index, and
intakes of available carbohydrate, starch and sugar.
Legend: The HRs were obtained from model 3, which was adjusted for age, sex, study center,
smoking, education, physical activity, BMI, blood pressure and intakes of energy, protein,
alcohol, fiber (available carbohydrate, starch and sugar), or cereal fiber (GI and GL), saturated
and monounsaturated fat. The analyses were stratified by country and combined with random-
effects meta-analysis. Weights are from random effects analysis.

30
Table 1. Baseline nutrient intakes and cardiovascular risk factors by quintiles of energy-adjusted dietary glycemic
load (GL) in the EPIC cohort1
Quintiles of energy-adjusted dietary GL2
I II III IV V
N persons 68,116 68,116 68,116 68,116 68,115
Dietary GL 96.5 (14.3) 118.0 (3.7) 129.5 (3.7) 141.2 (3.8) 164.8 (16.8)
Dietary GI 53.4 (3.6) 54.9 (3.2) 55.8 (3.1) 56.7 (3.1) 58.3 (3.3)
Protein (g/day) 98.9 (30.2) 84.6 (25.6) 80.0 (25.4) 78.8 (25.4) 85.9 (27.4)
Saturated Fat (g/day) 37.1 (14.4) 31.2 (12.1) 29.3 (11.7) 28.4 (11.7) 29.2 (12.2)
Monounsaturated Fat (g/day) 42.1 (17.4) 31.9 (12.6) 28.3 (11.6) 26.5 (11.4) 28.1 (12.2)
Polyunsaturated Fat (g/day) 15.5 (7.7) 13.1(6.0) 12.5 (5.6) 12.3 (5.6) 13.0 (5.8)
Carbohydrate (g/day) 201.7 (63.5) 203.8 (61.1) 215.5 (61.2) 237.1 (62.6) 301.0 (79.5)
Starch (g/day) 104.1 (40.6) 106.3 (39.1) 113.3 (39.2) 126.1 (41.0) 166.2 (60.6)
Sugars (g/day) 90.5 (36.8) 92.4 (35.9) 98.2 (37.4) 107.8 (40.7) 132.1 (54.5)
Fiber (g/day) 21.5 (7.4) 21.0 (6.9) 21.7 (7.1) 23.2 (7.4) 27.5 (8.9)
Energy (kcal/day) 2303 (656) 1997 (579) 1939 (575) 1979 (583) 2287 (649)
Alcohol (g/day) 25.5 (27.1) 14.0 (16.1) 10.2 (12.8) 8.12 (11.2) 7.17 (10.8)
Age 51.1 (9.3) 51.4 (9.9) 50.9 (10.6) 49.9 (11.2) 48.8 (11.4)
31
Systolic blood pressure (mmHg) 132.2 (20.0) 131.9 (19.8) 131.2 (19.8) 130.4 (19.8) 129.4 (19.0)
Diastolic blood pressure (mmHg) 82.2 (10.8) 81.5 (10.8) 81.0 (10.8) 80.6 (10.8) 80.2 (10.7)
Body mass index (kg/m2) 26.7 (4.30) 26.2 (4.32) 25.8 (4.26) 25.4 (4.16) 25.1 (4.08)
Sex
Male (%) 47.8 33.1 29.3 30.2 40.5
Physical activity
Inactive (%) 23.2 22.4 20.8 19.5 20.5
Moderately inactive (%) 33.5 33.9 33.9 33.4 30.9
Moderately active (%) 23.3 22.9 23.3 23.7 23.1
Active (%) 19.5 19.7 20.5 21.6 23.2
Education
No schooling (%) 7.2 6.7 5.7 4.4 3.3
Primary (%) 30.6 29.1 27.2 25.4 27.4
Technical/professional (%) 21.9 24.8 25.8 26.0 24.4
Secondary (%) 14.4 14.3 14.7 16.3 17.8
Longer Education (%) 24.8 23.3 24.0 24.8 23.4
Current smoker (%) 34.6 26.1 22.5 20.2 21.3
Never smoker (%) 36.7 46.3 50.1 53.0 52.3
32
History of high blood pressure (%) 34.8 34.7 33.7 32.0 29.8
1Table entries are means with standard deviations, except where indicated; 2Energy adjustment by residual method.
33
Table 2. Baseline nutrient intakes and cardiovascular risk factors by quintiles of energy-adjusted dietary glycemic
index (GI) in the EPIC cohort 1
Quintiles of energy-adjusted2 dietary GI
I II III IV V
N persons 68,116 68,116 68,116 68,116 68,115
Dietary GI 50.7 (2.14) 54.0 (0.57) 55.8 (0.49) 57.6 (0.59) 60.8 (1.81)
Dietary GL 113.7 (22.7) 124.0 (20.5) 129.9 (20.9) 135.7 (21.5) 146.6 (26.0)
Protein (g/day) 87.5 (29.0) 86.3 (27.5) 85.4 (27.1) 84.6 (26.9) 84.6 (28.4)
Saturated Fat (g/day) 31.9 (13.9) 32.0 (12.9) 31.5 (12.6) 30.8 (12.4) 29.0 (12.2)
Monounsaturated Fat (g/day) 32.9 (16.8) 32.0 (14.7) 31.3 (13.9) 30.7 (13.2) 30.1 (12.9)
Polyunsaturated Fat (g/day) 13.1 (6.6) 13.5 (6.3) 13.5 (6.2) 13.3 (6.1) 13.1 (6.2)
Carbohydrate (g/day) 222.1 (77.4) 230.7 (73.0) 233.0 (72.9) 234.1 (73.8) 239.2 (79.2)
Starch (g/day) 98.0 (40.8) 115.3 (42.5) 123.5 (44.9) 130.8 (48.0) 148.3 (59.2)
Sugar (g/day) 118.4 (49.5) 110.2 (43.0) 104.9 (41.5) 99.2 (41.1) 88.4 (40.1)
Fiber (g/day) 23.2 (8.5) 23.4 (7.9) 23.2 (7.8) 22.8 (7.7) 22.4 (7.8)
Energy (kcal/day) 2093 (658) 2118 (627) 2110 (618) 2095 (613) 2090 (633)
Alcohol (g/day) 13.8 (19.6) 13.2 (17.3) 12.9 (17.3) 12.6 (17.5) 12.4 (18.4)
Age (years) 50.4 (10.1) 50.6 (10.5) 50.5 (10.8) 50.4 (10.9) 50.1.3 (9.3)
34
Systolic blood pressure (mmHg) 130.0 (19.5) 131.0 (19.5) 131.5 (19.8) 131.5 (20.0) 130.9 (19.8)
Diastolic blood pressure (mmHg) 81.0 (10.6) 81.2 (10.7) 81.2 (10.8) 81.1 (10.9) 81.0 (10.9)
Body mass index (kg/m2) 26.1 (4.35) 25.8 (4.25) 25.7 (4.20) 25.7 (4.22) 25.9 (4.29)
Sex
Male (%) 27.3 32.6 36.3 39.3 45.3
Physical activity
Inactive (%) 20.0 19.4 20.4 21.5 25.0
Moderately inactive (%) 33.9 34.1 33.3 32.9 31.4
Moderately active (%) 23.6 24.0 23.9 23.2 21.5
Active (%) 21.9 21.8 21.2 20.6 18.8
Education
No schooling (%) 5.3 4.3 4.8 5.3 7.5
Primary (%) 26.6 25.6 26.3 28.7 32.8
Technical/Professional 25.4 25.1 24.8 24.1 23.2
Secondary (%) 14.8 15.1 15.6 15.9 16.2
Longer education (%) 26.2 27.0 25.7 23.2 18.2
Current smoker (%) 23.5 22.1 23.1 25.3 30.6
Never smoker (%) 48.7 50.0 46.2 47.2 43.1

35
History of high blood pressure (%) 32.0 33.1 33.1 33.6 33.2
1Table entries are means with standard deviations, except where indicated; 2Energy adjustment by residual method.
36
Table 3. Mean1 values of selected markers of lipid and glucose metabolism (with 95% confidence intervals) in the EPIC-CVD sub-cohort
according to quintiles of energy-adjusted dietary glycemic index (GI) and load (GL).
Quintiles of energy-adjusted dietary GI or GL P value 2
I II III IV V
Dietary GL
Non-HDL cholesterol (mmol/l) 4.41 (4.35,4.46) 4.39 (4.35,4.43) 4.44 (4.40,4.48) 4.47 (4.43,4.51) 4.47 (4.41,4.53) 0.1155
HDL-cholesterol (mmol/l) 1.54 (1.52,1.56) 1.50 (1.49,1.52) 1.48 (1.47,1.50) 1.47 (1.46,1.48) 1.46 (1.44,1.48) <0.001
Triglycerides (mmol/l) 1.32 (1.28,1.36) 1.28 (1.25,1.32) 1.34 (1.31,1.37) 1.35 (1.31,1.38) 1.35 (1.31,1.39) 0.0878
C-reactive protein (mg/l) 2.06 (1.86,2.25) 2.16 (2.01,2.31) 2.30 (2.15,2.45) 2.27 (2.11,2.42) 2.37 (2.17,2.58) 0.3424
Glucose (mmol/l) 4.94 (4.88,4.99) 4.92 (4.87,4.96) 4.92 (4.88,4.96) 4.94 (4.89,4.98) 4.96 (4.90,5.03) 0.7453
Hemoglobin A1c (%) 5.46 (5.44,5.49) 5.47 (5.45,5.49) 5.47 (5.46,5.49) 5.49 (5.47,5.50) 5.48 (5.46-5.50) 0.6893
Dietary GI
Non-HDL cholesterol (mmol/l) 4.39 (4.35,4.43) 4.39 (4.35,4.43) 4.46 (4.42,4.50) 4.44 (4.40,4.48) 4.49 (4.45,4.53) 0.0055
HDL cholesterol (mmol/l) 1.51 (1.49,1.52) 1.50 (1.49,1.52) 1.48 (1.47,1.50) 1.48 (1.47,1.50) 1.49 (1.47,1.50) 0.0423
Triglycerides (mmol/l) 1.32 (1.29,1.35) 1.28 (1.25,1.31) 1.33 (1.30,1.36) 1.32 (1.29,1.36) 1.38 (1.35,1.41) 0.0011
C-reactive protein (mg/l) 2.08 (1.92,2.23) 2.15 (2.00,2.30) 2.22 (2.07,2.36) 2.28 (2.13,2.42) 2.43 (2.28,2.59) 0.0340
Glucose (mmol/l) 4.95 (4.90,4.99) 4.91 (4.87,4.96) 4.93 (4.88,4.97) 4.93 (4.88,4.97) 4.95 (4.90,5.00) 0.6923
Hemoglobin A1c (%) 5.47 (5.45,5.49) 5.47 (5.45,5.49) 5.48 (5.46,5.50) 5.48 (5.46,5.49) 5.48 (5.46,5.49) 0.8679
1Means adjusted for age (continuous), sex and EPIC center, smoking, education, physical activity, body mass index, and blood pressure, intakes of energy, protein, alcohol,
fiber, saturated and monounsaturated fat. 2Analysis of covariance
37
Table 4. Hazard ratios1 (with 95% confidence intervals) for first coronary heart disease event according to dietary glycemic load (GL) dietary glycemic
index (GI), and intakes of available carbohydrate, starch, and sugar in the EPIC study
Quintiles of energy-adjusted dietary variables P trend7 Continuous‡8
I II III IV V
Dietary GL
Range ≤111.2 111.3-124.1 124.2-134.9 135.0-148.3 >148.3
N cases 1386 1255 1175 1208 1354
Model 12 1 1.02 (0.94,1.10) 1.00 (0.92,1.08) 1.01 (0.93,1.10) 1.05 (0.96,1.14) 0.373 1.04 (0.99,1.10)
Model 23 1 1.05 (0.97,1.14) 1.02 (0.94,1.11) 1.04 (0.96,1.14) 1.06 (0.97,1.16) 0.248 1.05 (1.00,1.11)
Model 34,5 1 1.08 (0.99,1.17) 1.07 (0.97,1.17) 1.11 (1.00,1.23) 1.16 (1.02,1.31) 0.035 1.18 (1.07,1.29)
Dietary GI
Range ≤52.9 53.0,54.9 55.0,56.7 56.8,58.7 >58.7
N cases 958 1054 1265 1395 1706
Model 12 1 0.97 (0.89,1.06) 1.05 (0.96,1.14) 1.06 (0.97,1.15) 1.17 (1.08,1.27) 0.001 1.09 (1.05,1.13)
Model 23 1 0.98 (0.90,1.07) 1.04 (0.96,1.14) 1.02 (0.93,1.11) 1.05 (0.96,1.14) 0.172 1.03 (0.99,1.07)
Model 34,5 1 1.00 (0.91,1.09) 1.07 (0.98,1.16) 1.04 (0.95,1.13) 1.08 (0.99,1.18) 0.053 1.04 (1.00,1.08)
38
Available carbohydrate
Range ≤202.0 202.0,222.9 223.0,240.4 240.5,261.5 >261.5
N cases 1542 1250 1206 1145 1235
Model 12 1 0.97 (0.90,1.05) 0.97 (0.90,1.05) 0.94 (0.87,1.02) 1.00 (0.92,1.08) 0.701 1.00 (0.97,1.03)
Model 23 1 1.02 (0.94,1.10) 1.02 (0.94,1.11) 1.00 (0.92,1.09) 1.06 (0.97,1.15) 0.355 1.03 (0.99,1.06)
Model 34 1 1.04 (0.96,1.14) 1.06 (0.96,1.17) 1.06 (0.95,1.19) 1.15 (1.00,1.32) 0.065 1.11 (1.03,1.18)
Starch
Range ≤97.4 97.5,113.3 113.4,127.7 127.8,147.0 >147.0
N cases 1355 1224 1205 1322 1272
Model 12 1 0.95 (0.88,1.03) 0.90 (0.83,0.97) 0.92 (0.85,1.00) 0.86 (0.79,0.93) 0.001 0.93 (0.90,0.97)
Model 23 1 0.99 (0.91,1.07) 0.95 (0.87,1.03) 0.97 (0.90,1.05) 0.93 (0.85,1.02) 0.116 0.98 (0.94,1.02)
Model 34,6 1 1.02 (0.94,1.11) 0.99 (0.90,1.09) 1.04 (0.93,1.15) 1.02 (0.89,1.16) 0.737 1.06 (0.99,1.14)
Sugar
Range ≤77.2 77.3,93.5 93.6,108.8 108.9,129.3 >129.3
N cases 1509 1306 1200 1181 1182
Model 12 1 1.05 (0.97,1.13) 1.05 (0.97,1.13) 1.07 (0.99,1.16) 1.13 (1.04,1.23) 0.006 1.05 (1.01,1.09)
Model 23 1 1.09 (1.01,1.18) 1.09 (1.01,1.18) 1.12 (1.03,1.21) 1.13 (1.04,1.23) 0.007 1.04 (1.00,1.08)
39
Model 34,6 1 1.12 (1.03,1.22) 1.14 (1.04,1.24) 1.18 (1.07,1.31) 1.24 (1.09,1.40) 0.001 1.09 (1.02,1.17)
1 Hazard ratio and 95% confidence interval estimated from Cox proportional hazard models. 2 Stratified by age, sex, and recruitment center. 3 Additionally adjusted for smoking,
education, physical activity, BMI, and blood pressure variable. 4Additionally adjusted for intakes of energy, protein, alcohol, fiber, saturated and monounsaturated fat. 5Models
3 for GL and GI were adjusted for cereal fiber instead of fiber. 6Models 3 for sugar and for starch adjusted for starch and sugar, respectively.7Inter,quintile test for trend calculated
by orthogonal polynomial contrasts. 8For 50 g/day increments of dietary GL, carbohydrate, starch and sugar, or 5 units/day increments of dietary GI.
40
Table 5. Subgroup analyses: hazard ratios1 (with 95% confidence intervals) for first coronary heart disease event according to quintiles dietary
glycemic load (GL) and index (GI) in the EPIC study
Quintiles of energy-adjusted dietary GL or GI P trend4 Continuous5
I II III IV V
Dietary GL
Excluding cases diagnosed in the first 2 years (5648 cases)
Model 32,3 1 1.05 (0.96,1.15) 1.00 (0.91,1.11) 1.07 (0.95,1.19) 1.10 (0.97,1.26) 0.186 1.15 (1.04,1.27)
Men only (4251 cases)
Model 32 1 1.07 (0.97,1.18) 1.08 (0.97,1.20) 1.13 (1.01,1.27) 1. 17 (1.02,1.34) 0.027 1.19 (1.08,1.30)
Women only (2103 cases)
Model 32 1 1.12 (0.96,1.30) 1.11 (0.96,1.30) 1.14 (0.97,1.34) 1.23 (1.02,1.47) 0.062 1.22 (1.07,1.40)
P heterogeneity 0.588
According to Body mass index
<25 kg/m2 (2025 cases)
Model 32,3 1 0.94 (0.81,1.09) 0.90 (0.78,1.05) 0.99 (0.85,1.16) 0.98 (0.83,1.16) 0.984 1.09 (0.96,1.22)
≥25 kg/m2 (4329 cases)
Model 32,3 1 1.14 (1.03,1.26) 1.15 (1.03,1.28) 1.16 (1.03,1.31) 1.26 (1.10,1.44) 0.004 1.22 (1.11,1.35)
P heterogeneity 0.022
Dietary GI
Excluding cases diagnosed in the first 2 years (5648 cases)
Model 32,3 1 0.98 (0.89,1.07) 1.05 (0.96,1.15) 1.04 (0.95,1.14) 1.05 (0.96,1.16) 0.115 1.03 (0.99,1.08)
Men only (4251 cases)
41
Model 32 1 0.94 (0.84,1.05) 0.98 (0.88,1.09) 0.99 (0.89,1.11) 1.01 (0.91,1.12) 0.396 1.02 (0.98,1.07)
Women only (2103 cases)
Model 32 1 1.11 (0.97,1.28) 1.24 (1.08,1.42) 1.11 (0.96,1.28) 1.22 (1.06,1.40) 0.014 1.09 (1.02,1.16)
P for heterogeneity 0.090
According to Body mass index
<25 kg/m2 (2025 cases)
Model 32,3 1 1.03 (0.88,1.21) 0.99 (0.85,1.16) 1.00 (0.86,1.16) 1.04 (0.90,1.21) 0.686 1.03 (0.97,1.10)
≥25 kg/m2 (4329 cases)
Model 32,3 1 0.98 (0.88,1.09) 1.10 (0.99,1.22) 1.06 (0.96,1.18) 1.10 (0.99,1.22) 0.026 1.05 (1.00,1.10)
P heterogeneity 0.674
1 Hazard ratio and 95% confidence interval estimated from Cox proportional hazard models. 2 Stratified by age, recruitment center and adjusted for smoking, education, physical
activity, body mass index, blood pressure variable, and intakes of energy, protein, alcohol, cereal fiber, saturated and monounsaturated fat. 3Additionally stratified by sex. 4
Inter-quintile test for trend calculated by orthogonal polynomial contrasts.5For 50 g/day increments of dietary GL or 5 units/day increments of dietary GI.
42
Overall (I-squared = 0.0%, p = 0.915)
ID
Study
Italy
Sweden
Germany
The Netherlands
Spain
Denmark
United Kingdom
Greece
1.19 (1.07, 1.32)
HR (95% CI)
1.34 (0.93, 1.94)
1.18 (0.94, 1.48)
1.17 (0.86, 1.60)
1.42 (0.97, 2.08)
1.06 (0.83, 1.37)
1.19 (0.99, 1.42)
1.39 (0.77, 2.52)
0.99 (0.54, 1.81)
100.00
Weight
%
7.55
20.39
10.58
7.20
16.54
31.93
2.96
2.85
1.19 (1.07, 1.32)
HR (95% CI)
1.34 (0.93, 1.94)
1.18 (0.94, 1.48)
1.17 (0.86, 1.60)
1.42 (0.97, 2.08)
1.06 (0.83, 1.37)
1.19 (0.99, 1.42)
1.39 (0.77, 2.52)
0.99 (0.54, 1.81)
100.00
Weight
%
7.55
20.39
10.58
7.20
16.54
31.93
2.96
2.85
10.5 1 1.6
Glycemic Load (50g/day)
%
43
Overall (I-squared = 27.8%, p = 0.207)
Sweden
ID
Spain
Italy
Study
United Kingdom
The Netherlands
Denmark
Germany
Greece
1.05 (1.00, 1.11)
1.04 (0.97, 1.12)
HR (95% CI)
1.07 (0.96, 1.19)
0.98 (0.83, 1.15)
1.36 (1.08, 1.71)
1.03 (0.91, 1.18)
0.99 (0.91, 1.07)
1.08 (0.94, 1.24)
1.26 (0.92, 1.72)
100.00
24.64
Weight
15.80
8.03
%
4.64
11.28
22.51
10.54
2.56
1.05 (1.00, 1.11)
1.04 (0.97, 1.12)
HR (95% CI)
1.07 (0.96, 1.19)
0.98 (0.83, 1.15)
1.36 (1.08, 1.71)
1.03 (0.91, 1.18)
0.99 (0.91, 1.07)
1.08 (0.94, 1.24)
1.26 (0.92, 1.72)
100.00
24.64
Weight
15.80
8.03
%
4.64
11.28
22.51
10.54
2.56
10.5 1 1.6
Glycemic Index (5units/day)
%
%
44
Overall (I-squared = 0.0%, p = 0.535)
Denmark
Sweden
Greece
The Netherlands
United Kingdom
ID
Italy
Germany
Spain
Study
1.11 (1.03, 1.19)
1.19 (1.04, 1.35)
1.15 (0.92, 1.42)
0.92 (0.67, 1.26)
1.30 (0.98, 1.72)
0.88 (0.58, 1.33)
HR (95% CI)
1.16 (0.87, 1.53)
1.05 (0.86, 1.28)
1.03 (0.88, 1.22)
100.00
33.21
11.53
5.52
6.76
3.05
Weight
6.80
13.29
19.84
%
1.11 (1.03, 1.19)
1.19 (1.04, 1.35)
1.15 (0.92, 1.42)
0.92 (0.67, 1.26)
1.30 (0.98, 1.72)
0.88 (0.58, 1.33)
HR (95% CI)
1.16 (0.87, 1.53)
1.05 (0.86, 1.28)
1.03 (0.88, 1.22)
100.00
33.21
11.53
5.52
6.76
3.05
Weight
6.80
13.29
19.84
%
10.5 1 1.6
Available carbohydrates (50g/day)
%

45
Overall (I-squared = 0.0%, p = 0.917)
Italy
United Kingdom
Denmark
The Netherlands
Sweden
ID
Study
Spain
Greece
Germany
1.10 (1.01, 1.19)
1.13 (0.85, 1.50)
0.99 (0.61, 1.60)
1.08 (0.92, 1.27)
1.34 (0.96, 1.88)
1.10 (0.87, 1.39)
HR (95% CI)
1.02 (0.85, 1.22)
1.06 (0.73, 1.52)
1.18 (0.93, 1.48)
100.00
8.82
3.03
28.09
6.15
12.76
Weight
%
22.45
5.26
13.43
1.10 (1.01, 1.19)
1.13 (0.85, 1.50)
0.99 (0.61, 1.60)
1.08 (0.92, 1.27)
1.34 (0.96, 1.88)
1.10 (0.87, 1.39)
HR (95% CI)
1.02 (0.85, 1.22)
1.06 (0.73, 1.52)
1.18 (0.93, 1.48)
100.00
8.82
3.03
28.09
6.15
12.76
Weight
%
22.45
5.26
13.43
1.5 1 1.6
Starch (50g/day)
%
46
Overall (I-squared = 29.6%, p = 0.191)
Denmark
Study
Italy
The Netherlands
ID
Germany
United Kingdom
Greece
Spain
Sweden
1.09 (0.99, 1.19)
1.17 (1.03, 1.32)
1.29 (0.94, 1.76)
1.31 (0.98, 1.74)
HR (95% CI)
0.99 (0.84, 1.16)
0.85 (0.56, 1.30)
0.80 (0.56, 1.13)
1.05 (0.87, 1.26)
1.16 (0.93, 1.44)
100.00
24.67
%
7.40
8.56
Weight
19.24
4.39
6.15
16.41
13.19
1.09 (0.99, 1.19)
1.17 (1.03, 1.32)
1.29 (0.94, 1.76)
1.31 (0.98, 1.74)
HR (95% CI)
0.99 (0.84, 1.16)
0.85 (0.56, 1.30)
0.80 (0.56, 1.13)
1.05 (0.87, 1.26)
1.16 (0.93, 1.44)
100.00
24.67
%
7.40
8.56
Weight
19.24
4.39
6.15
16.41
13.19
10.5 1 1.6
Sugar (50g/day)
%