Globefish Highlights - Issue 2/2015 · Celebrating 20 years of the Code of Conduct for Responsible...
64
HIGHLIGHTS A QUARTERLY UPDATE ON WORLD SEAFOOD MARKETS 30/04/2015 Issue 2/2015 2 Tel.: (+39) 06 57052884 - Fax: (+39) 06 57053020 - Email: globefi[email protected] - Website: www.globefish.org JANUARY-DECEMBER 2014 STATISTICS
Transcript of Globefish Highlights - Issue 2/2015 · Celebrating 20 years of the Code of Conduct for Responsible...

H I G H L I G H T SA QUARTERLY UPDATE ON WORLD SEAFOOD MARKETS
30/04/2015 Issue 2/2015
2
Tel.: (+39) 06 57052884 - Fax: (+39) 06 57053020 - Email: [email protected] - Website: www.globefish.org
JANUARY-DECEMBER 2014S T A T I S T I C S

Bibliographic reference:
GLOBEFISH Highlights2015FAO/GLOBEFISH Highlights (2/2015): p. 58
A quarterly updatebased onthe GLOBEFISH databank
About GLOBEFISH
All rights reserved. Reproduction and dissemination of material in this information product for educational or other non-commercial purposes are authorized without any prior written permission from the copyright holders provided the source is fully acknowledged. Reproduction of material in this informational product for resale or other commercial purposes is prohibited without written permission of the copyright holders. Applications for such permission should be addressed to the Chief, Electronic Publishing Policy and Support Branch, Communication Division, FAO, Viale delle Terme di Caracalla, 00153 Rome, Italy or by e-mail to copyright@ fao. org
© FAO GLOBEFISH 2015
GLOBEFISH forms part of the Products, Trade and Marketing Branch of the FAO Fisheries and Aquaculture Department and is part of the FISH INFOnetwork (see below). It collects information from the main market areas in developed countries for the benefit of the world’s producers and exporters. Part of its services is an electronic databank and the distribution of information through the GLOBEFISH European Fish Price Report, the GLOBEFISH Highlights, the GLOBEFISH Research Programme and the GLOBEFISH Commodity Updates.
The GLOBEFISH Highlights is based on information available in the databank, supplemented by market information from industry correspondents and from six regional services which form the FISH INFOnetwork: INFOFISH (Asia and the Pacific), INFOPESCA (Latin America and the Caribbean), INFOPECHE (Africa), INFOSAMAK (Arab countries), EUROFISH (Central and Eastern Europe) and INFOYU (China).
This issue of GLOBEFISH Highlights has been prepared by Audun Lem, Paola Sabatini and Karine Boisset with contributions from Shirlene M. Anthonysamy, Felix Dent, Eloisa Espinoza, Fatima Ferdouse, Erik Hempel, Marie Christine Monfort, Rodrigo Misa, Ferit Rad, Nianjun Shen and Stefania Vannuccini. Hilary Cochrane and Anna Child provided editing services and José Luis Castilla Civit was responsible for the layout with the assistance of Turan Rahimzadeh. The Norwegian Seafood Council provided data support for the FAO Fish Price Index.
GLOBEFISH Highlights is distributed to the subscribers of: INFOFISH Trade News, INFOPESCA Noticias Comerciales, INFOPECHE Nouvelles Commerciales, through EUROFISH and INFOYU. GLOBEFISH Highlights are also available in electronic form.
For subscription details please contact:
GLOBEFISH, FIPM/FAO Tel: (39-06) 5705 2884Viale delle Terme di Caracalla Fax: (39-06) 5705 3020
00153 Rome, ItalyEmail: [email protected]
www.globefish.org
1995-201520th AnniversAry of the Code of ConduCt for responsible fisheries
INSIDE THIS ISSUE...Global fish economy The global seafood industry in 2014 was characterized by sustained high prices for many important species, and a continuation of major trends in production and consumption growth. The expected shift in seafood consumption this year towards relatively greater consumption of farmed species compared with wild fish has been realized. On the production side, reduced anchoveta catches, a result of the El Niño climatic phenomenon, saw slightly reduced capture fisheries production while the global aquaculture sector continued its steady expansion. International prices have been increasing faster than production, pointing to the continued strengthening of demand for seafood around the world. p. 2
With some recovery in supplies of farmed shrimp, the trend in international shrimp trade was positive in 2014 with increased imports
in all major markets except Japan The USA continues to be the target market for many shrimp producing countries, however import demand has been weak since January 2015 due to the large unsold stocks imported in 2014. Primary demand in 2015 is also poor in Europe and in Japan, which has resulted in downward pressure on shrimp prices. Seasonal production could be delayed. p. 3
In 2014, frozen skipjack prices hit a six year low, resulting in non-traditional market demand worldwide Japan remained the largest market for sashimi tuna, though waning consumer
demand and falling imports led to market shrinkage. The USA has emerged as the second largest import market for fresh/chilled tuna. Meanwhile, import prices of fresh tuna loins increased significantly in the EU following the import ban on Sri Lankan tuna. p. 11
Cod prices up dramatically over the past yearThe cod season was off to a slow start in
January 2015, and reduced landings caused prices to hold firm. Modest reductions in global cod landings are expected in 2015. Pollock prices are very low at the moment, and the outlook is not good, as the TAC has been raised this year. p. 17
Octopus landings bounced back in 2014Increased octopus landings put some pressure on prices in 2014, while a decline in squid landings and tighter supplies are forecasted
for 2015. The cuttlefish market remains dull with somewhat tighter supplies. p. 22
Strong demand for tilapiaTilapia supplies into the international market are slowly growing from other sources in Asia, with Viet Nam set to ramp up production in 2015. Overall demand expected to remain strong in both
international and domestic markets with prices remaining firm. p. 26
Viet Nam faces weakening demand in major markets and increasing competition from neighbouring countries
In 2014, the world’s leading pangasius producer and exporter Viet Nam reported marginal profits primarily due to lower demand from the main markets, the EU and the USA. This weakening demand was somewhat made up for by higher exports to ASEAN countries, Latin America and the Middle East. As Vietnamese producers struggle with rising production costs, the country is also increasingly facing competition from neighbours in Southeast Asia, who are stepping up production for both local consumption and exports. p. 29
2015 starts positively with good demand and tight supply of seabass and seabream
Both Greece and Turkey benefitted from improved stability of the market in 2014 after a period of steadily increasing supply driven by the expanding Turkish industry. The growth phase, at least in terms of production volumes, now looks as if it has come to a halt and forecasts predict that this situation will continue for an additional two years. p. 31
Future looking bright despite Russian ban, however biological challenges pushing up costs
After successfully navigating some potentially treacherous market conditions following the Russian ban in August last year, the Norwegian farmed salmon industry will now look to capitalize on what are still relatively high prices supported by a global salmon production growth slowdown in 2015. Norway is once again leading the way in terms of production growth, with Chilean producers expected to register negative growth over the next 2 years at least, as they seek to ensure the improving biological situation continues. p. 36
Tighter supplies expectedIncreased mackerel supplies have forced prices down. Herring prices came up during
the winter due to tighter supplies, and are now expected to edge upwards. The outlook forecast is for tighter supplies of all small pelagics (except anchovies), and consequently firmer prices. p. 42
Fishmeal and fish oil prices further up With the irreversible trend of increasing demand for fishmeal and fish oil, pressure on supply pushed up prices for both commodities during 2014. While production in the USA,
Europe, Africa and Asia remained neutral or even positive, global fishmeal production only grew by 13.2% as there was significantly lower production from Peru, the largest fishmeal producer. p. 46
More Chinese bivalves on markets Global imports of bivalves experienced only a slight increase in 2014 compared with 2013 (0.9%). While mussel trade has remained stable, international purchases of scallops have declined. By contrast,
imports of clam, cockles and ark shells have grown by 4.7% or nearly 10 000 tonnes. China is the top supplier to the world bivalve market, with demand growing significantly from the Republic of Korea and Japan. p. 49
2014 a positive year for lobster trade with demand expected to further strengthen in the USA and EU Lobster is one of the most expensive fishery products entering international trade. The average
unit value is USD 20 per kg, while for shrimp it is around USD 10 per kg and for finfish it is below USD 5 per kg. Although overall world production of lobster is negligible when compared to finfish or shrimp, this notable price premium demonstrates the significance of the species, especially pertaining to livelihood opportunities. Indeed, in the Caribbean, more than 100 000 fishers concentrate on lobster, and in some fishing communities it is the only means of livelihood. p. 54
SPECIAL FEATURECelebrating 20 years of the Code of Conduct for Responsible Fisheries p. 56
Fish and fishery products statistics p. 58
CEPH
ALOP
DSGR
OUND
FISH
TILA
PIA
TUNA
SALM
ONSE
ABAS
S &
SEAB
REAM
PAN
GA
SIU
S
SMAL
L PE
LAGI
CSBI
VALV
ESLO
BSTE
R
SHRI
MP
GLOB
AL F
ISH
ECON
OMY
FISH
MEA
L & FI
SH O
IL
2 Globefish highlights April 2015
GLOBAL FISH ECONOMY
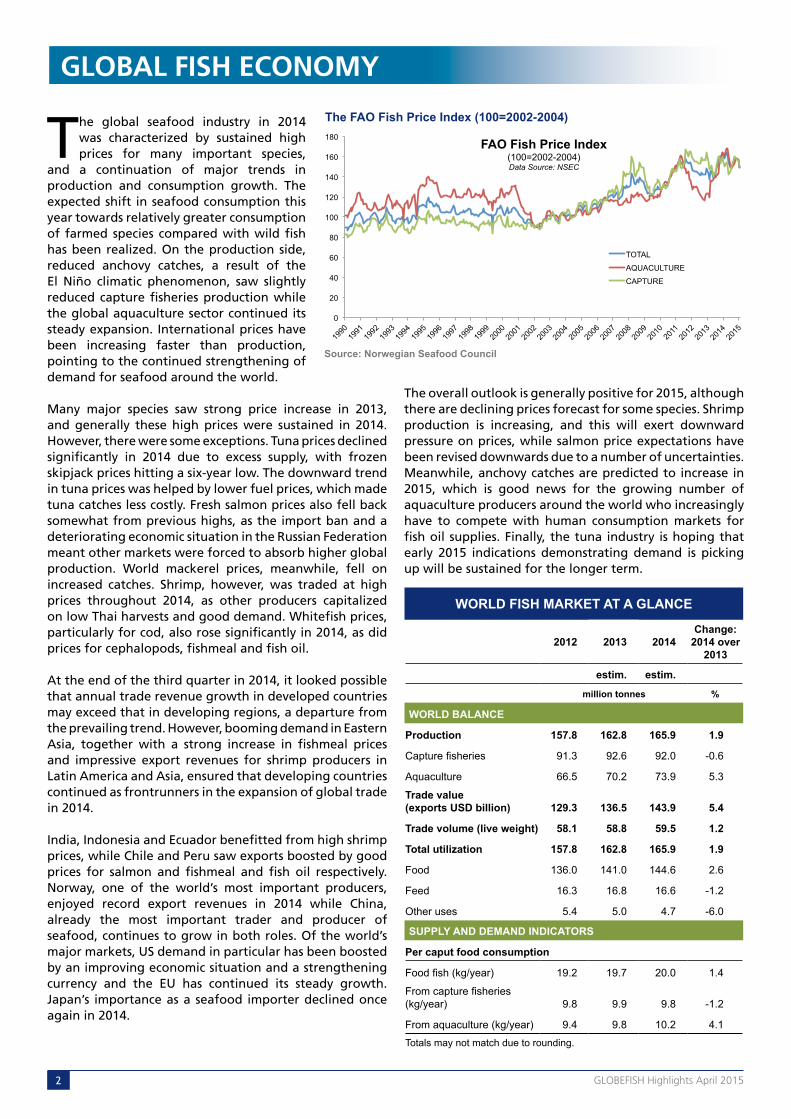
The overall outlook is generally positive for 2015, although there are declining prices forecast for some species. Shrimp production is increasing, and this will exert downward pressure on prices, while salmon price expectations have been revised downwards due to a number of uncertainties. Meanwhile, anchovy catches are predicted to increase in 2015, which is good news for the growing number of aquaculture producers around the world who increasingly have to compete with human consumption markets for fish oil supplies. Finally, the tuna industry is hoping that early 2015 indications demonstrating demand is picking up will be sustained for the longer term.
The global seafood industry in 2014 was characterized by sustained high prices for many important species,
and a continuation of major trends in production and consumption growth. The expected shift in seafood consumption this year towards relatively greater consumption of farmed species compared with wild fish has been realized. On the production side, reduced anchovy catches, a result of the El Niño climatic phenomenon, saw slightly reduced capture fisheries production while the global aquaculture sector continued its steady expansion. International prices have been increasing faster than production, pointing to the continued strengthening of demand for seafood around the world.
Many major species saw strong price increase in 2013, and generally these high prices were sustained in 2014. However, there were some exceptions. Tuna prices declined significantly in 2014 due to excess supply, with frozen skipjack prices hitting a six-year low. The downward trend in tuna prices was helped by lower fuel prices, which made tuna catches less costly. Fresh salmon prices also fell back somewhat from previous highs, as the import ban and a deteriorating economic situation in the Russian Federation meant other markets were forced to absorb higher global production. World mackerel prices, meanwhile, fell on increased catches. Shrimp, however, was traded at high prices throughout 2014, as other producers capitalized on low Thai harvests and good demand. Whitefish prices, particularly for cod, also rose significantly in 2014, as did prices for cephalopods, fishmeal and fish oil.
At the end of the third quarter in 2014, it looked possible that annual trade revenue growth in developed countries may exceed that in developing regions, a departure from the prevailing trend. However, booming demand in Eastern Asia, together with a strong increase in fishmeal prices and impressive export revenues for shrimp producers in Latin America and Asia, ensured that developing countries continued as frontrunners in the expansion of global trade in 2014.
India, Indonesia and Ecuador benefitted from high shrimp prices, while Chile and Peru saw exports boosted by good prices for salmon and fishmeal and fish oil respectively. Norway, one of the world’s most important producers, enjoyed record export revenues in 2014 while China, already the most important trader and producer of seafood, continues to grow in both roles. Of the world’s major markets, US demand in particular has been boosted by an improving economic situation and a strengthening currency and the EU has continued its steady growth. Japan’s importance as a seafood importer declined once again in 2014.
World fish market at a glance
2012 2013 2014
change: 2014 over
2013
estim. estim.
million tonnes %
World balance
Production 157.8 162.8 165.9 1.9
Capture fisheries 91.3 92.6 92.0 -0.6
Aquaculture 66.5 70.2 73.9 5.3
trade value (exports Usd billion) 129.3 136.5 143.9 5.4
trade volume (live weight) 58.1 58.8 59.5 1.2
total utilization 157.8 162.8 165.9 1.9
Food 136.0 141.0 144.6 2.6
Feed 16.3 16.8 16.6 -1.2
Other uses 5.4 5.0 4.7 -6.0
sUPPlY and demand indicators
Per caput food consumption
Food fish (kg/year) 19.2 19.7 20.0 1.4
From capture fisheries (kg/year) 9.8 9.9 9.8 -1.2
From aquaculture (kg/year) 9.4 9.8 10.2 4.1
Totals may not match due to rounding.
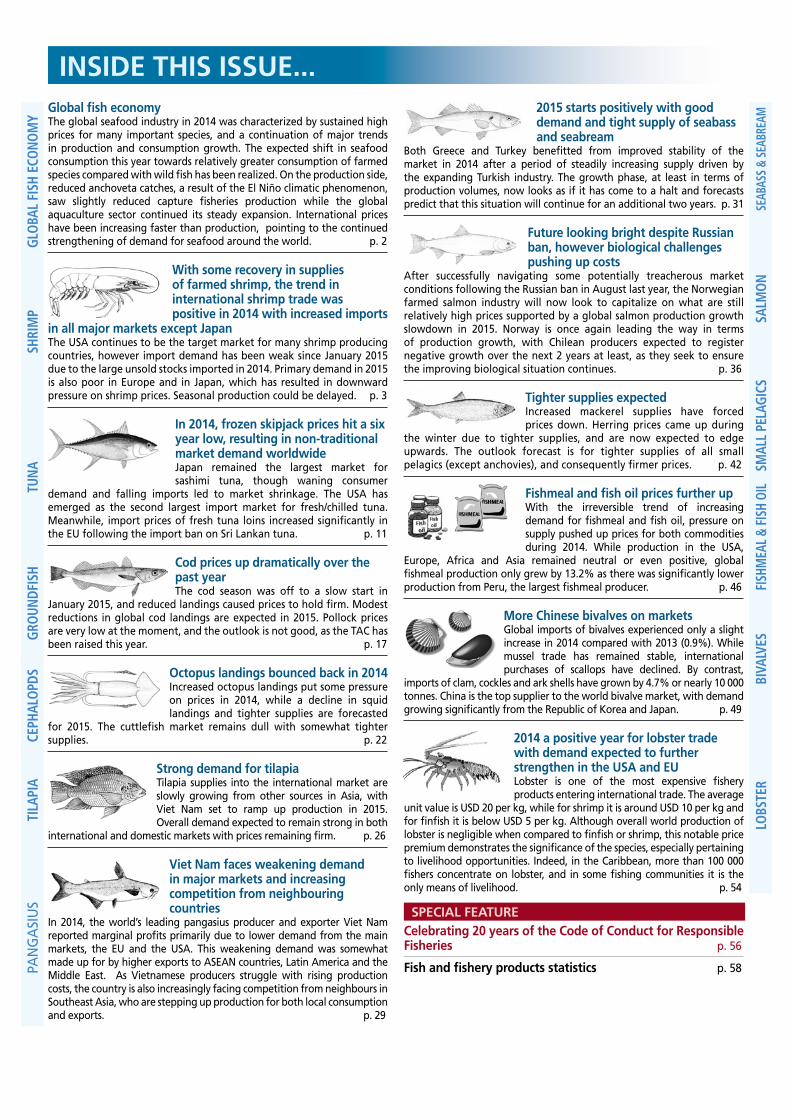
the fao fish Price index (100=2002-2004)
source: norwegian seafood council
0
20
40
60
80
100
120
140
160
180
1990
19
91 19
92 19
93 19
94 19
95 19
96 19
97 19
98 19
99 20
00 20
01 20
02 20
03 20
04 20
05 20
06 20
07 20
08 20
09 20
10 20
11 20
12 20
13 20
14 20
15
FAO Fish Price Index (100=2002-2004) Data Source: NSEC
TOTAL
AQUACULTURE
CAPTURE

3Globefish highlights April 2015
According to the Aquaculture Culture Asia-Pacific Magazine, global production of farmed shrimp increased from 3.4 million tonnes in 2013 to 3.6 million tonnes in 2014. Asian producers had the lion share at 3 million tonnes, whereas production in the Americas was estimated at 671 000 tonnes.
With production increasingly shifting from black tiger to vannamei shrimp in Viet Nam, Indonesia, and India, the farming of vannamei shrimp in Asia increased from 2.12 million tonnes in 2013 to 2.37 million tonnes in 2014. Subsequently, black tiger production in the region
suffered, decreasing from 744 000 tonnes in 2013 to 635 000 tonnes in 2014. Considering these factors, the year-on-year rise in Asian farmed shrimp production was 145 000 to 150 000 tonnes in 2014.
In terms of wild shrimp, in 2014, overall landings of shrimp in the USA were stable at 51 558 tonnes, which was only slightly lower than the volume landed in 2013. However, landings in Mississippi and Texas were significantly lower than in 2013. As a result, in December 2014, ex-vessel prices of shrimp in the USA were 18-20% higher compared with the same month the year before.
Import and export trends
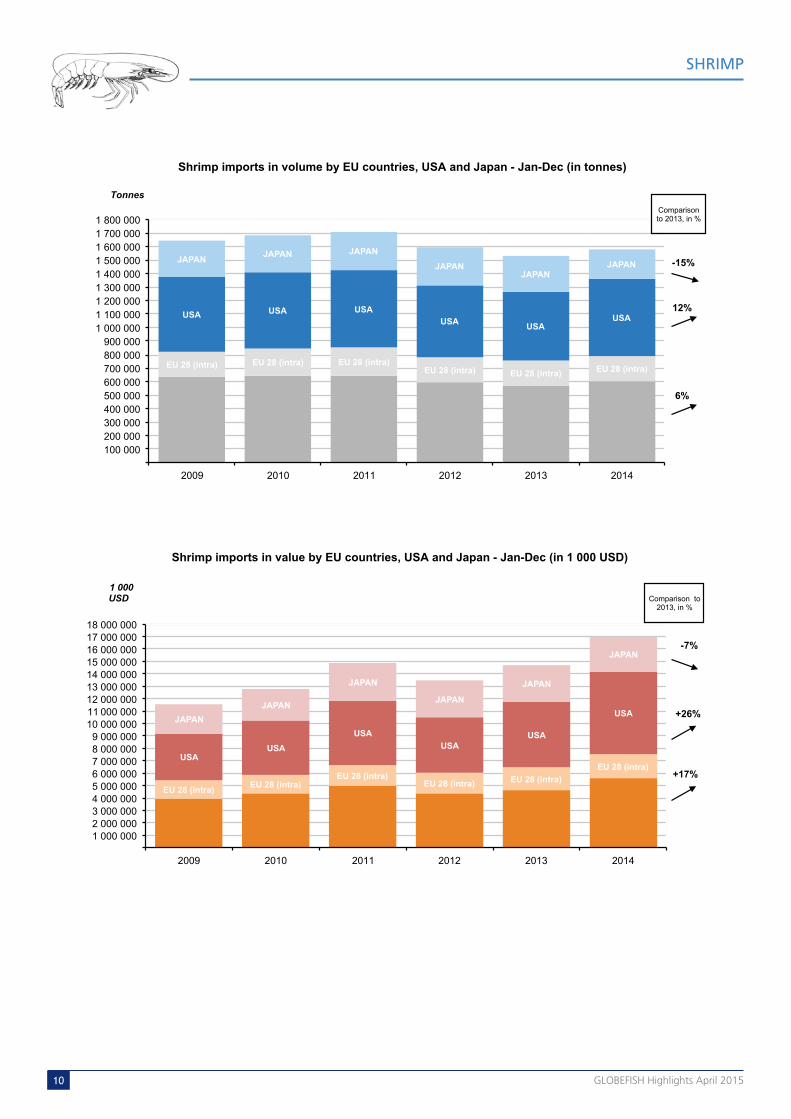
With some recovery in supplies, the trend in international shrimp trade was positive in 2014. Amongst the traditional large import markets, supplies increased significantly to the single largest market, the USA. The negative trend in EU imports was overturned, although with smaller growth compared with 2013 imports. In Japan, the weak yen curtailed shrimp imports significantly in 2014. Imports also increased in the other developed markets, namely in Switzerland, Australia and New Zealand.
Shrimp demand in the non-traditional developing markets was positive in 2014, particularly for domestic consumption in China, the Republic of Korea, Singapore and Mexico.
Viet Nam imported more than the previous year for re-export to China and for processing value-added products destined to developed markets, i.e. Japan, the USA, the EU and Australia.
On the supply side, the top five shrimp exporters were India (345 404 tonnes), Ecuador (300 576 tonnes), Indonesia (181 351 tonnes) and Thailand (167 057 tonnes) in 2014. Following the seasonal production pattern of farmed shrimp, exports increased from India (+37%), Ecuador (+34%), and Indonesia (+19%) but declined from China (-14%) and Thailand (-21%). With the rise in vannamei shrimp production and higher imports of raw material, Viet Nam exported more shrimp to the global market.
With some recovery in supplies of farmed shrimp, the trend in international shrimp trade was positive in 2014 with increased imports in all major markets except Japan
The USA continues to be the target market for many shrimp producing countries, however import demand has been weak since January 2015 due to the large unsold
stocks imported in 2014. Primary demand in 2015 is also poor in Europe and in Japan, which has resulted in downward pressure on shrimp prices. Seasonal production could be delayed.
SHRIMP
Source: FAO
Penaeusvannamei
42%
Giant tiger prawn 14%
Northern prawn
4%
Akiami paste shrimp
8%
Others32%
shrimp production by species (2012)
global production of farmed shrimp 2009 2014
(1 000 tonnes)
top five Producers 2013 2014
China 910 1 010
Indonesia 565 630
Viet Nam 560 569
India 345 345
Ecuador 286 3 000
World total including other 3 436.9 3 680.4
Source: AQUA Culture AsiaPacific

4 Globefish highlights April 2015
In 2014, Japanese imports of raw frozen and processed/value-added shrimp declined by 25 000 tonnes (-13.3%) and 13 300 tonnes (-20%) respectively against the same period last year. Compared with 2013, imports were lower from the top five exporting countries, including Viet Nam, Thailand, India, Indonesia and China. Japan increased imports of cheaper cold water shrimp from Argentina, Russia and Greenland. Imports of cooked/frozen coldwater shrimp also increased from Canada and Greenland by 50%, totaling 1 000 tonnes.
In terms of processed shrimp, Thailand remained the lead supplier to Japan even with reduced exports, while exports from Viet Nam were stable. Supplies of value-added shrimp to the Japanese market also declined from China and Indonesia.
2015 began with a significant decline in Japanese shrimp imports. Supplies of both raw and processed shrimp were significantly lower in January 2015 compared with a year earlier; indeed, total shrimp imports declined by almost 24% compared with the same month last year.
Imports of both tropical farmed shrimp and coldwater shrimp were at a four-year low. Raw frozen shrimp imports (shell-on and peeled), fell by 30% at 11 000 tonnes compared with 16 000 tonnes in January 2014. Even supplies of the popular Argentinean shrimp were 63% lower than a year ago. In terms of other suppliers, exports dropped from Viet Nam by 11%, from Thailand by 20%, from China by 35% and India by 25%. This trend is quite alarming as it occurred during the month when prices, particularly for farmed vannamei, were reasonably low and the local stocks in Japan needed to be replenished for the high consumption season in April/May.
Even with lower supplies, Thailand was the top exporter of processed/value-added shrimp in the Japanese market due to the market preference. Indonesia was the only source that managed to sell more processed shrimp (particularly cooked frozen products) during this period.
Import - USAAs a single market, the USA was the number one importer of shrimp in the global market in 2014. Year on year, imports were 60 000 tonnes higher (+12%) at 568 650 tonnes. Nearly, 78% of these supplies consisted of raw shell-on and peeled products. There was a 26% rise in import value in 2014, reaching USD 6.7 billion in 2014, while the average import price was 9.6% higher that that of 2013 due to higher imports of large sized shrimp, both shell-on and peeled.
Though India remained the top supplier in this market, exports from Indonesia and Ecuador were comparatively higher at 22 200 tonnes 17 800 tonnes respectively. In comparison, supplies from India increased by 14 600 tonnes.
Import - JapanTotal imports of shrimp in 2014 were 223 423 tonnes (-15%), which demonstrated a 100 000 tonnes decrease over the last decade, a significant decline in consumer demand.
During the seasonal peak in August-October 2014, farmed shrimp production improved moderately, with offer prices from exporting countries weakening in the US dollar. However, Japanese buyers had to pay more in yen due to the record devaluation of the yen against the dollar, which made imports more expensive for the market. In addition, falling consumer demand also contributed to inventory build-up in the market and the average holding cost increasing along the distribution chain.
importsshrimp (by product): Japan
2009 2010 2011 2012 2013 2014
(1 000 tonnes)
Live 0.1 0.1 0.1 0.1 0.1 0.1
Fresh/chilled ** ** ** ** ** **
Frozen, raw 197.6 205.3 205.2 200.5 187.3 162.3
Dried/salted/in brine 2.9 2.6 2.8 2.3 1.9 1.6
Cooked, frozen 20.9 21.6 23.6 24.5 24.2 20.0
Cooked & smoked 0.3 0.3 0.5 0.3 0.2 0.2
Frozen ebi 0.4 0.4 0.4
Prepared/preserved* 41.1 46.6 49.2 50.3 45.7 36.8
Sushi (with rice) 2.2 2.0 3.2 2.4 2.2 2.0
total 265.2 280.7 285.3 280.4 262.1 223.4
* (incl. tempura shrimp ); ** (included under others)
source: Japan customs/infofish
importsshrimp - raw frozen: Japan
2009 2010 2011 2012 2013 2014
(1 000 tonnes)
Viet Nam 39.9 40.5 34.1 33.8 34.3 31.4
India 24.3 28.3 30.9 27.7 31.5 30.7
Indonesia 34.8 32.0 30.8 31.5 32.3 25.8
Argentina 3.6 4.9 9.1 13.9 14.6 15.4
Thailand 32.1 37.7 36.6 35.3 20.4 11.9
China 14.9 13.8 17.2 15.3 14.5 11.7
Russian Fed. 7.1 7.9 7.8 6.7 6.2 6.3
Myanmar 6.7 5.9 6.0 6.2 6.2 5.6
Canada 7.2 7.1 6.0 5.9 4.7 5.2
Malaysia 5.1 7.3 9.1 7.3 4.8 3.5
Greenland 6.5 5.0 4.0 3.7 3.7 2.9
Philippines 4.0 3.5 3.3 2.9 2.4 2.6
Bangladesh 2.4 2.5 2.0 2.2 2.9 2.1
Others 9.0 9.0 8.5 8.2 8.6 7.2
total 197.6 205.3 205.2 200.5 187.3 162.3
source: Japan customs
SHRIMP

5Globefish highlights April 2015
SHRIMP
About two thirds of the USA experienced severe winter weather during the first three months of 2015. This severe weather affected restaurant business during the Lent period, when seafood consumption generally increases. Retail demand of shrimp was also low as households bought more staple products to ride out cold temperatures at home.
As of the reporting time, US domestic inventories remained high because of the surge of imports during the fourth quarter of last year and in January this year. US cold storages are also full with large stocks of vannamei shrimp. Imports of farmed black tiger shrimp increased as
well, though not at the same level as farmed vannamei. At the end of 2014, total shrimp supplies in the USA, which includes both imports and domestic landings, were up about 12-13% compared with 2013.
Import - EUIn general, consumer demand for shrimp did not improve much in Europe during 2014. However, compared with 2013, the EU imported more shrimp from external-EU countries in 2014 following the availability of the cheaper vannamei shrimp from Ecuador, India and Viet Nam. The price sensitive EU markets also imported lesser quantities of black tiger shrimp, which impacted exports from Bangladesh. Shrimp imports also declined into Russia (-17%) and Norway (-14%) but increased marginally into Switzerland (+3%).
Extra-EU imports of shrimp increased by 6% in 2014 compared with 2013, but remained below the level of
importsshrimp: Usa
Product2011 2012 2013 2014
1 000 tonnes
million Usd
1 000 tonnes
million Usd
1 000 tonnes
million Usd
1 000 tonnes
million Usd
Peeled frozen 207.1 1 939.4 205.4 1 794.9 199.3 2 100.3 229.1 2 798.0
Other frozen 95.5 943.1 71.0 669.4 70.3 824.7 73.8 1 014.9
Breaded 43.9 293.6 37.9 250.1 36.9 272.7 39.4 335.3
Other prep. 4.0 22.8 2.6 14.0 2.5 14.1 2.3 13.5
headless shell-on frozenAll sizes 223.0 1 927.9 215.6 1 714.8 196.8 2 058.3 219.7 2 485.5
< 15 17.8 263.8 19.0 266.4 16.6 267.6 19.4 340.1
15/20 20.9 237.2 24.4 223.0 21.0 266.7 23.3 329.6
21/25 30.1 295.5 29.5 244.4 29.7 337.4 32.6 403.7
26/30 30.3 264.3 33.0 260.2 29.7 314.5 31.8 368.4
31/40 45.5 349.9 41.4 296.5 38.4 377.2 40.0 413.5
41/50 28.3 194.5 25.9 171.4 25.5 225.1 26.1 244.7
51/60 26.8 180.2 21.7 134.4 18.9 150.2 22.5 199.0
61/70 13.7 85.8 12.1 72.0 10.0 75.3 13.5 111.2
> 70 9.6 56.7 8.6 46.5 6.9 44.3 10.1 75.3
Other products 3.6 37.4 2.4 21.3 3.5 44.7 4.7 49.3
total 577.1 5 164.3 534.9 4 464.5 509.3 5 314.8 569.1 6 696.5
source: nmfs
shrimp prices (16-20 count) in main wholesale markets, Usa and Japan
source: infofish
3
4
5
6
7
8
9
10
Dec-05 Dec-06 Dec-07 Dec-08 Dec-09 Dec-10 Dec-11 Dec-12 Dec-13 Dec-14 Dec-15
USD/lb Gulf brown, New York
Indian white, Tokyo
Source: Infofish
5
10
15
20
25
30
Dec-05 Dec-06 Dec-07 Dec-08 Dec-09 Dec-10 Dec-11 Dec-12 Dec-13 Dec-14 Dec-15
USD/kg
31/40
16/20
Source : ITN
shrimp prices Japan, black tiger origin indonesia
source: infofish
importsshrimp: Usa
2009 2010 2011 2012 2013 2014
(1 000 tonnes)India 20.0 30.3 48.2 66.1 94.2 108.8
Indonesia 69.3 61.1 70.3 74.1 81.2 103.4
Ecuador 61.6 65.0 73.8 81.5 74.7 92.5
Viet Nam 42.3 48.5 45.4 41.2 60.0 73.8
Thailand 192.8 203.4 185.8 136.1 84.2 64.6
China 44.2 48.2 43.0 35.7 32.5 32.5
Mexico 41.1 23.5 30.9 26.3 18.5 20.2
Malaysia 18.4 24.3 29.3 23.5 10.5 17.9
Peru 8.5 7.0 8.3 8.4 9.0 11.8
Honduras 8.7 10.3 10.4 9.1 8.5 8.0
Guyana 8.9 7.8 6.5 9.0 8.7 6.7
Others 36.7 32.0 25.1 24.2 27.3 29.0
total 552.6 561.5 577.1 535.0 509.3 569.1source: nmfs

6 Globefish highlights April 2015
RECENT NEWS
US cuts anti-dumping tariffs on Vietnamese shrimp but increases duties for Indian
shrimp
In its ninth preliminary review of antidumping duties, the US Department of Commerce raised
duties for Indian shrimp exporters and lowered them for Vietnamese exporters. The review period covered frozen shrimp imports between 1 February 2013, and 31 January 2014. These rates are only preliminary and there will be no immediate effect as rate changes only apply after the final results of an administrative review are determined, meaning they could enter into force possibly in September 2015. It is possible for preliminary rate assessments to be adjusted higher or lower between the preliminary and final determination. Commerce can change the data based on a verification of its findings, or errors in the preliminary calculations. Any changes to methodology based on proposed arguments can also change the rates.
Source: Seafood.com
importsshrimp: spain
2009 2010 2011 2012 2013 2014
(1 000 tonnes)
imPortsArgentina 36.2 42.7 49.2 42.3 43.6 46.9Ecuador 20.4 23.5 31.5 28.7 24.7 29.3China 25.4 22.7 22.5 18.3 19.7 15.8Nicaragua 6.5 5.9 7.0 8.5 8.4 11.1Morocco 5.2 4.2 4.8 3.9 3.8 4.4India 2.8 3.3 2.4 3.4 3.2 4.0Others 66.6 68.4 62.1 47.4 47.4 44.6total 163.2 170.7 179.5 152.4 150.8 156.1
eXPorts
Italy 10.7 12.4 16.5 14.3 14.9 12.9
Portugal 8.4 9.6 9.3 7.9 9.7 10.7
France 6.9 5.8 7.6 8.0 5.8 5.0
Others 4.2 3.1 5.2 4.9 5.1 5.5
total 30.2 30.8 38.6 35.1 35.6 34.1source: agencia tributaria
importsshrimp: italy
2009 2010 2011 2012 2013 2014
(1 000 tonnes)Ecuador 21.8 21.4 22.2 21.2 18.3 22.0Argentina 8.2 11.6 11.3 11.2 13.0 13.8India 5.9 5.9 6.3 5.5 5.4 7.4Spain 6.0 6.7 7.5 7.2 7.7 7.0Denmark 4.8 5.0 4.5 3.2 4.1 4.3Netherlands 3.9 4.9 5.1 4.1 2.5 3.7Viet Nam 2.9 2.6 3.3 2.0 2.4 2.7Others 16.7 15.8 14.0 10.6 10.7 10.0total 70.2 73.9 74.2 65.0 64.1 70.9source: istat
importsshrimp: france
2009 2010 2011 2012 2013 2014
(1 000 tonnes)Ecuador 17.8 24.4 26.7 28.6 31.2 31.0India 13.3 12.5 12.8 13.4 14.2 15.4Viet Nam 4.9 6.8 6.2 4.6 5.9 8.7Madagascar 8.6 7.6 7.7 7.4 6.4 5.9Netherlands 6.5 6.1 6.5 7.3 7.3 5.9Venezuela 3.9 4.5 4.4 6.3 5.9 4.7Bangladesh 3.5 4.6 5.8 4.9 6.4 4.2Spain 3.7 5.7 4.3 5.7 3.8 3.7Nicaragua 2.3 2.2 2.1 2.0 2.0 3.1Others 44.7 41.1 34.1 29.1 22.7 21.6total 109.1 115.5 110.7 109.2 105.8 104.2source: direction nationale des statistiques du commerce extérieur – dnsce
importsshrimp: denmark
2009 2010 2011 2012 2013 2014
(1 000 tonnes)
imPortsGreenland 71.5 70.5 66.3 59.3 58.4 53.6
Canada 16.6 13.1 11.3 15.4 15.8 16.8
Viet Nam 1.8 1.7 1.7 1.9 1.9 2.5
USA 0.2 0.5 1.6 1.8 1.5 2.3
Faroe Islands 2.4 2.0 0.4 1.2 1.0 1.8
India 0.6 0.6 0.6 0.5 1.2 1.6
Others 12.8 12.5 10.7 9.6 11.3 11.6
total 105.8 100.8 92.5 89.6 91.0 90.2
eXPortsSweden 19.3 19.0 20.5 21.5 23.1 21.3
UK 13.1 12.9 10.6 10.0 9.8 9.7
Russian Fed. 19.8 14.0 8.9 6.5 5.9 8.2
China 13.4 12.2 7.0 8.9 10.7 8.1
Italy 5.8 6.1 5.6 5.6 7.4 7.3
Germany 7.3 6.8 7.5 6.8 6.4 6.5
Norway 6.4 7.1 6.7 5.8 6.3 5.9
Netherlands 4.9 6.0 4.1 4.3 3.7 5.4
Morocco 3.4 4.0 2.3 3.3 4.8 4.6
Greenland 4.1 4.1 3.7 2.9 3.2 2.9
Others 19.4 20.4 20.9 18.5 17.1 15.3
total 116.9 112.7 97.9 94.1 98.4 95.3source: eUrostat
SHRIMP

7Globefish highlights April 2015
SHRIMP
annual imports during 2009-2012. The top six import markets were Spain, France, Denmark, the UK, the Netherlands and Italy in order of ranking. Imports increased in Spain (+4%), the Netherlands (+ 28%) and Italy (+10%) as well as in Germany and in Belgium by 5% each. Among these countries, Denmark is the major reprocessing center. Imports into the Netherlands and Belgium are distributed to the other EU markets, including Spain, France, Italy and to East European markets.
Spanish shrimp imports increased into most of the countries other than China. Supplies from Viet Nam were 55% higher than in 2013.
imports/exportsshrimp: belgium
2009 2010 2011 2012 2013 2014
(1 000 tonnes)
imPortsIndia 10.0 9.4 12.9 13.2 15.9 18.0
Netherlands 12.3 14.6 17.7 16.1 11.6 11.3
Bangladesh 12.0 12.7 12.8 9.9 9.0 10.5
Viet Nam 5.3 4.7 4.4 3.3 4.6 6.4
Ecuador 6.5 4.9 9.4 5.6 2.1 2.6
Others 19.4 20.2 16.6 12.0 10.6 8.0
total 65.5 66.4 73.9 60.2 53.9 56.9
eXPortsFrance 19.5 19.2 23.6 16.1 12.3 12.1
Netherlands 7.7 9.3 11.2 9.6 10.3 9.9
Spain 5.9 5.9 5.3 5.9 5.7 5.5
Germany 5.8 5.9 5.4 5.0 5.3 5.2
Italy 1.9 1.3 1.6 1.5 2.3 1.7
UK 4.5 3.1 1.6 0.9 1.4 1.6
Others 5.8 6.1 6.6 6.4 6.3 5.4
total 51.2 50.8 55.2 45.3 43.6 41.4source: eUrostat
importsshrimp: Uk
2009 2010 2011 2012 2013 2014
(1 000 tonnes)Canada 8.3 9.1 9.4 10.2 11.3 13.2
India 8.6 8.1 8.4 8.6 10.4 12.6
Viet Nam 5.5 5.8 7.7 5.8 7.3 8.6
Thailand 13.2 17.0 19.6 20.7 15.2 7.8
Denmark 9.8 9.4 8.2 7.3 8.0 7.4
Bangladesh 6.8 6.1 7.6 6.3 7.3 6.9
Iceland 7.9 7.6 6.1 6.1 4.4 4.3
Indonesia 7.6 8.0 5.9 3.1 3.9 4.1
Others 17.1 14.9 17.4 17.7 17.3 17.5
total 84.9 86.0 90.4 85.8 85.1 82.3source: her majesty’s revenue & customs
importsshrimp: germany
2009 2010 2011 2012 2013 2014
(1 000 tonnes)Viet Nam 9.6 11.5 12.2 9.6 8.7 11.1
Bangladesh 6.4 6.7 7.0 8.7 8.1 7.8
Netherlands 5.4 6.0 6.9 6.7 6.6 7.4
Thailand 11.5 12.4 10.6 10.8 7.8 6.1
India 5.5 5.2 4.7 4.5 4.7 4.8
Belgium 4.1 4.5 4.5 3.3 3.7 3.9
Others 16.3 16.8 15.8 15.6 14.9 16.0
total 58.9 63.1 61.7 59.2 54.5 57.1source: germany customs
imports/exportsshrimp: netherlands
2009 2010 2011 2012 2013 2014
(1 000 tonnes)
imPortsIndia 12.0 10.1 7.1 6.6 6.2 12.3
Germany 8.0 9.7 10.8 11.2 9.1 8.8
Morocco 7.4 8.5 9.0 7.9 7.4 8.4
Bangladesh 7.0 6.8 6.8 7.7 7.8 7.8
Belgium 5.1 5.7 9.4 6.9 6.7 7.2
Indonesia 6.1 5.4 4.2 2.4 3.6 5.8
Others 28.9 25.8 27.6 27.7 21.6 27.2
total 74.3 71.9 74.8 70.5 62.4 77.6
eXPortsMorocco 24.2 25.9 28.0 23.8 22.7 24.7
Germany 12.0 14.5 14.7 13.7 13.0 15.2
Belgium 17.5 17.3 18.0 15.2 11.0 11.8
France 14.6 14.7 13.9 12.3 9.3 7.5
Spain 4.7 2.3 2.2 2.2 2.4 4.1
Italy 2.6 3.4 3.7 3.2 2.2 2.4
Others 8.5 4.3 3.5 3.5 3.2 2.9
total 84.1 82.4 83.9 73.9 63.8 68.7source: eUrostat
14.30
7.0
10.0
13.0
16.0
Bangladesh BT, HL 16/20, c&f
USD/kg
BLACK TIGER - in Europe, origin: Bangladesh
source: european Price report

8 Globefish highlights April 2015
the main origin, Canada, by 15% but increased by a hefty 128% from Ecuador. Viet Nam was possibly the main supplier of shrimp to China in 2014, although the official data indicated only 2 178 tonnes imports from this source. The actual imports through unreported border trade could be ten times more including re-exports of products originating from Ecuador and India.
Direct imports from India also declined by 28% to 4 100 tonnes in 2014. Compared with 2013, imports from Indonesia into China increased by 367% to 2 500 tonnes.
The Republic of Korea imported 3.4% more shrimp in 2014 compared with 2013. Imports totaled nearly 63 000 tonnes, all of which was destined for domestic
India was the largest shrimp supplier to Belgian importers. Imports also increased from Bangladesh and Viet Nam during the reporting period. Imports recovered in the German market where Viet Nam remained the lead supplier.
Asia and other markets
Viet Nam was the largest shrimp importer in developing Asia, with imports meant for re-export, with or without further processing. Head-on shrimp imports are generally directed to the Chinese market. Cumulative shrimp imports from the top ten suppliers to this market crossed 155 000 tonnes last year, a 61% increase year on year. Ecuador supplied 75 000 tonnes, followed by India with 56 118 tonnes. Other notable suppliers were Iran, Thailand and Indonesia.
Shrimp trade in China was mixed in 2014. Exports declined by 13.6% but imports increased by almost 10% compared with 2013 reaching 78 000 tonnes. Supplies declined from
imports/exportshrimp: eU-28
2009 2010 2011 2012 2013 2014
(1 000 tonnes)
imPorts
Ecuador 74.7 80.7 97.3 92.2 82.9 93.1
India 65.3 60.0 59.5 60.6 66.4 83.2
Argentina 47.1 55.5 62.1 55.0 59.9 66.2
Greenland 74.3 72.6 68.3 61.2 60.1 55.1
Viet Nam 38.1 43.2 45.5 35.7 37.9 49.7
Denmark 46.3 49.5 44.8 43.4 47.1 44.0
Bangladesh 39.0 41.2 43.4 42.1 42.3 40.7
Canada 31.4 30.5 27.8 30.1 31.4 35.8
Netherlands 36.9 41.1 44.1 40.8 35.1 35.5
China 40.2 41.0 38.8 36.2 37.4 28.8
Spain 22.1 26.1 24.8 28.4 23.3 25.0
Belgium 24.3 23.4 27.7 21.6 22.9 22.7
Germany 18.9 21.7 22.1 19.8 19.1 18.8
Thailand 52.8 68.2 63.1 53.7 31.9 18.2
Indonesia 26.2 23.1 18.9 10.8 12.1 15.6
Morocco 14.0 14.5 15.1 13.1 13.3 15.4
Nicaragua 8.9 8.5 9.7 11.5 11.3 15.2
Others 163.1 147.9 137.1 126.6 123.7 128.0
grand total 823.5 848.6 850.0 782.6 758.0 790.9
total intra imports 187.7 202.9 202.1 188.7 185.4 183.6
total extra imports 635.8 645.7 647.9 593.9 572.6 607.3
eXPorts
grand total 362.2 373.9 370.2 335.3 326.8 316.3
total intra exports 261.4 275.0 284.4 258.0 253.1 245.8
total extra exports 100.8 98.9 85.8 77.3 73.7 70.5source: eUrostat
source: european Price report
7.20
3.5 5.0 6.5 8.0 9.5
11.0
40-50 pc/kg
USD/kg
WHITELEG SHRIMP - origin: Ecuador
source: european Price report
8.007.105.90
4.703.3 4.8 6.3 7.8 9.3
10.8
30-40 pc/lb 40-50 60-70 100-120
EUR/kg
WHITELEG SHRIMP - origin: Central America
source: european Price report
8.307.307.10
7.00
3.0 4.5 6.0 7.5 9.0
10.5
> 10-20 pc/kg > 20-30 > 30-40 > 40-60 > 60-80
EUR/kg
ARGENTINA RED SHRIMP - origin: Argentina
SHRIMP

9Globefish highlights April 2015
SHRIMP
Affected by the EMS disease, Mexico imported 36 000 tonnes of shrimp in 2014, which was 12% more than the previous year. Supplies were dominated by the Latin American producers.
Outlook
For 2015, world aquaculture experts foresee moderate recovery in farmed shrimp production in Thailand and also in Mexico, while India, Viet Nam and Indonesia will continue to focus more on vannamei aquaculture. Hence, overall production is expected to be better in 2015 compared with 2014. However, the first harvests of the season in India could be delayed until May due to the late stockings of the ponds. This same trend could occur in Thailand due to the ongoing draught in many farming regions. Moreover, farmers in the producing countries might be conservative in stocking their ponds due to the dwindling demand from the three major markets – the USA, EU and Japan. During January 2015, imports into the USA and Japan already were below last year’s level due to high local stocks. However, local inventories, particularly in the USA, may decrease if shrimp prices to the end consumer come down in the coming months. Unfortunately, many traders in the market are unable to reduce selling prices as they bought products at higher prices last year.
In the USA, demand for Indian shrimp may suffer due to the higher tariff rates under the latest review by the US Department of Commerce. In contrast, imports from Viet Nam may increase, which would be subject to reduced tariffs.
Meanwhile, the weakening of the euro is likely to reduce imports to the EU in the coming months. Japanese importers are also likely to be selective due to the weak yen though demand could be better for processed shrimp. These trends leave only the US market to absorb future production. Viet Nam will also continue to import more raw materials from India for re-export to China and for processing of value-added products. As of late March this year, exports from India to Viet Nam intensified again.
consumption. Supplies increased from Viet Nam, Ecuador and India but declined from China, Thailand and Malaysia, the countries affected by EMS. In recent news, Viet Nam and the Republic of Korea have signed a Free Trade Agreement, which should boost future exports of shrimp from Viet Nam to this market.
Amongst the other markets in East Asia, imports increased into Malaysia and Singapore but declined in Hong Kong SAR and Taiwan Province of China compared with 2013. Overall, shrimp prices in Asia remained high during 2013 and 2014, which negatively impacted household consumption in Southeast Asian markets.
In the Pacific rim, Australia imported 5% more in 2014 against the previous year with the top suppliers being China and Viet Nam. There were also higher imports from India (+63%) and Indonesia (10%). Imports into New Zealand increased by less than 1%. Reduced supplies from Thailand into New Zealand were largely compensated for by increased supplies from Viet Nam (+17%) and India (+97%).
imports/exportsshrimp: china
2009 2010 2011 2012 2013 2014
(1 000 tonnes)
imPortsCanada 9.7 15.5 13.6 13.7 20.3 17.2
Ecuador 0.3 1.2 5.6 6.4 7.4 16.8
Thailand 4.0 9.8 6.9 10.7 8.7 7.3
Argentina 0.6 0.3 1.6 2.4 5.8 6.2
Greenland 8.3 9.9 6.3 5.7 7.5 5.2
China 0.0 0.0 0.1 0.0 3.7 5.1
India 1.6 2.0 2.1 3.1 5.7 4.1
Others 18.4 18.9 17.1 12.8 12.2 16.3
total 42.9 57.6 53.1 54.7 71.3 78.2
eXPortsUSA 47.4 45.3 44.0 37.6 34.9 33.6
Japan 34.7 35.3 58.6 40.9 37.3 32.7
Malaysia 18.4 25.7 35.7 34.8 29.0 29.2
Hong Kong SAR 15.0 20.4 18.6 20.5 23.8 22.4
Spain 23.6 23.2 20.1 16.5 18.0 16.9
Republic of Korea 27.0 25.3 35.4 31.0 21.5 14.2
Taiwan PC 8.7 11.9 13.5 13.1 13.3 12.7
Australia 7.9 9.0 10.9 11.0 13.3 12.4
Russian Fed. 10.1 15.7 12.1 11.9 14.9 10.8
Canada 11.7 15.2 11.0 12.2 10.0 8.4
Mexico 8.1 12.3 10.4 8.2 12.3 7.8
Others 33.6 35.6 35.0 35.9 41.6 32.2
total 246.4 274.9 305.2 273.7 269.9 233.2
source: china customs
10 Globefish highlights April 2015
SHRIMP
eU 28 (intra) eU 28 (intra) eU 28 (intra) eU 28 (intra) eU 28 (intra) eU 28 (intra)
Usa Usa Usa Usa Usa
Usa
JaPan JaPan JaPan JaPan
JaPan JaPan
100 000 200 000 300 000 400 000 500 000 600 000 700 000 800 000 900 000
1 000 000 1 100 000 1 200 000 1 300 000 1 400 000 1 500 000 1 600 000 1 700 000 1 800 000
2009 2010 2011 2012 2013 2014
shrimp imports in volume by eU countries, Usa and Japan - Jan-dec (in tonnes)
shrimp imports in value by eU countries, Usa and Japan - Jan-dec (in 1 000 Usd)
Tonnes Comparison to 2013, in %
6%
-15%
12%
eU 28 (intra) eU 28 (intra) eU 28 (intra)
eU 28 (intra) eU 28 (intra) eU 28 (intra)
Usa Usa
Usa Usa
Usa
Usa JaPan JaPan
JaPan
JaPan
JaPan
JaPan
1 000 000 2 000 000 3 000 000 4 000 000 5 000 000 6 000 000 7 000 000 8 000 000 9 000 000
10 000 000 11 000 000 12 000 000 13 000 000 14 000 000 15 000 000 16 000 000 17 000 000 18 000 000
2009 2010 2011 2012 2013 2014
1 000 USD Comparison to
2013, in %
+17%
+26%
-7%

11Globefish highlights April 2015
TUNA
In 2014, frozen skipjack prices hit a six year low, resulting in non-traditional market demand worldwide
Japan remained the largest market for sashimi tuna, though waning consumer demand and falling imports led to market shrinkage. The USA has emerged as the second
largest import market for fresh/chilled tuna. Meanwhile, import prices of fresh tuna loins increased significantly in the EU following the import ban on Sri Lankan tuna.
Supply
Catches of yellowfin and skipjack in the Eastern and Western Pacific have increased since July 2014, however import demand from Southeast Asian canners did not match this supply trend. Indeed, Thai imports of frozen skipjack and yellowfin in 2014 fell by 10% and 7% respectively in comparison with 2013 imports. Likewise, in the Philippines, tuna landings increased by 14% in 2014 to 194 000 tonnes, while imports for canning were lower, particularly for yellowfin. During January to October 2014, Filipino tuna packers imported 41 000 tonnes of frozen skipjack, an increase of 31% compared with the same period in 2013.
In the Western and Central Pacific, skipjack catches have been strong. Thai packers have been slow in placing large orders, which could be a strategy to bring prices down, possibly to as low as USD 1 000 per tonne. Meanwhile, the cost of fishing is likely to decrease given the substantial decline in fuel prices. During late February 2015, the delivery price of frozen skipjack to Southeast Asia canneries reached USD 1 050 per tonne
In the Atlantic Ocean, the ICCAT FAD closure ended on 28 February 2015. Tuna catches have since improved with yellowfin making up the majority of landings. Prices of both skipjack and yellowfin have declined due to limited demand from the canneries.
In the Eastern Pacific, catches have also improved, with mainly skipjack being landed. Local canneries continue to report healthy inventories but low processing activity.
Within the aquaculture sector, global production of farmed bluefin tuna is expected to have reached 35 000 tonnes in 2014, about 500 tonnes more than in 2013. This increase could lead to some price weakening in the sashimi tuna market. Prices of bigeye and yellowfin tuna may also be affected by this trend. Supplies of Atlantic bluefin and Southern bluefin are forecasted to increase by 10%, whereas Pacific bluefin production is estimated to decline by the same percentage.
Meanwhile, the first attempt to farm bigeye and yellowfin tuna in Mexico has been unsuccessful due to a high mortality of juveniles, which is linked to feeding issues. As a result, commercial farming of bigeye and yellowfin has ceased for now.
In Japan, the annual landings of fresh and frozen tuna in 2014 declined compared with 2013. Catches of bluefin and bigeye tuna were stable.
Contrary to the global trend, skipjack landings were lower in 2014 than the previous year, particularly from the local pole and line fishery. As a result, skipjack prices for processing bushi or dried products remained relatively higher in the Japanese domestic market compared with
Source: FAO
Skipjack tuna50%
Yellowfin tuna24%
Bigeye tuna8%
Albacore5%
Atlantic bluefin tuna0%
Pacific bluefin tuna1%
Others12%
tuna production by species (2012)

12 Globefish highlights April 2015
products used for canning in Southeast Asia. So far for 2015, Japanese pole and line skipjack catches have been delayed, but the average catch rate has already improved compared with last year.
Recently confirmed by the Tokyo Metropolitan Authority, the word famous Tsukiji wholesale fish market in Japan will soon be closing to be replaced by Toyosu Wholesale Market in November 2016.
Non-canned tuna markets (fresh and frozen)
JapanFor 2014, Japan remained the largest sashimi tuna market but with waning demand. Overall imports of fresh and frozen tuna for the year were 3.4% higher at 227 702 tonnes compared with 2013. However, in a noticeable trend, the market imported less fresh tuna and more frozen tuna including loins.
Following the decade long negative trend, imports of air-flown fresh tuna were at half their level in 2014 when compared with the quantity imported in 2006.
Imports of frozen tuna loins, which have longer shelf life, increased marginally during this period. As of January 2015, frozen yellowfin inventories were high in the market due to the carry over stocks from last year as well as from large supplies by Chinese long liners.
In March this year, demand for fresh tuna increased marginally in wholesale trading but remained below the expected level due to the cold weather. From the beginning of 2015, auction prices of frozen bigeye tuna remained firm with stable demand compared with the expensive bluefin tuna. Frozen bigeye tuna prices increased by 3-10% during the last one and a half years due to lower catches.
USAIn recent years, the USA has emerged as the second largest market for non-canned and sashimi tuna after Japan. While demand for canned tuna remained flat, there were increased imports of fresh and frozen tuna in 2014 compared with 2013. Annual imports of fresh/chilled and frozen tuna (including loins) exceeded 40 000 tonnes. In 2014, the market imported more than 22 000 tonnes of fresh/chilled tuna and loins (air-flown), which is a volume almost equal to the annual imports of fresh/chilled tuna
importsfrozen tuna: Japan
2009 2010 2011 2012 2013 2014
(1 000 tonnes)Bigeye 77.1 73.4 62.1 79.1 72.7 73.9
Yellowfin 44.1 50.1 47.8 48.0 36.5 46.2
Skipjack 53.3 86.6 42.2 30 21.2 24.5
Albacore 8.5 23.2 18.0 15.2 22.1 17.3
S. Bluefin 6.9 6.8 7.4 7.4 8.6 10.0
N. Bluefin 4.0 1.8 3.2 0.4 0.5 0.4
total 193.8 215.3 180.8 182.2 161.6 172.3source: infofish
landingstuna: Japan
2009 2010 2011 2012 2013 2014
(1 000 tonnes)
Bluefin Fresh 2.2 1.0 2.0 1.1 2.0 2.3
Frozen 0.7 1.3 1.2 1.5 1.4 1.9
bigeye Fresh 7.9 5.7 6.1 5.4 4.2 4.4
Frozen 17.9 17.5 15.3 20.4 23.2 23.6
Yellowfin Fresh 7.6 8.9 7.9 7.0 6.5 4.5
Frozen 8.1 6.4 5.7 24.5 21.9 28.9
albacore Fresh 40.0 30.6 33.6 42.1 35.9 36.6
Frozen 16.7 16.9 16.7 23.8 22.2 16.8
skipjack Fresh 43.3 68.2 46.0 45.2 50.1 46.2
Frozen 200.9 212.6 182.2 217.6 207.4 197.6
total Fresh 101.0 114.4 95.6 100.8 98.7 94.0
Frozen 244.3 254.7 221.1 287.8 276.1 268.8
grand total 345.2 369.1 316.7 388.6 374.8 362.8source: infofish
importstuna Pouches: Usa
2009 2010 2011 2012 2013 2014
(1 000 tonnes)Thailand 22.0 21.7 18.9 20.0 19.3 15.3
Ecuador 11.3 13.3 12.2 13.0 15.3 15.3
Others 5.2 6.1 5.5 3.3 4.1 8.9
total 38.5 41.1 36.6 36.3 38.7 39.5source: nfms
importsfresh/chilled tuna: Japan
2009 2010 2011 2012 2013 2014
(1 000 tonnes)Bigeye 15.2 11.6 12.1 13.3 11.3 9.9
Yellowfin 15.5 16.1 13.6 12.2 9.9 8.0
Bluefin 5.8 4.0 2.6 3.4 4.0 3.8
S. bluefin 3.4 2.1 1.2 1.5 1.8 1.4
Albacore 0.3 0.3 0.2 0.2 0.2 0.1
Skipjack 0.0 0.0 0.0 0.0 0.0 0.0
total 40.2 34.1 29.8 30.6 27.2 23.3source: infofish
TUNA

13Globefish highlights April 2015
TUNA
Egypt, but declined in Canada (-5%) and Switzerland (-8%). Both New Zealand and Russia increased their imports significantly by almost 20% and 25% respectively. Strong imports were observed in the emerging markets in Latin America, mostly in Chile, Brazil, and Mexico.
USAIn the USA, the average import value of canned tuna was 13-14% lower in 2014 compared with 2013 due to weakening prices of skipjack. Nonetheless, imports of canned tuna as well as the higher value pouch tuna dropped in 2013. Imports of canned albacore however,
in Japan. In addition, there was another 21000 tonnes of raw frozen loins imported, which was processed from yellowfin and bigeye tuna. Notably in 2014, the average import prices of frozen tuna loins and frozen salmon fillets were almost equitable at USD 9.50 per kg.
Canned tuna
ExportsExport trends from Thailand, the leading producer of canned tuna, demonstrate growth in global demand for canned tuna in 2014, largely as a result of the lower price of skipjack. Indeed, in volume terms, Thai exports of canned tuna in 2014 increased by 10% compared with 2013. However, due to the general weakening of lower raw materials, the export value declined by 2.1%
In value terms, the top five export markets for Thai canned tuna were the USA, Australia, Japan, Canada and Libya. In terms of volumes however, the rank of export markets shifted to the USA, Egypt, Australia, Libya and Japan. The USA was the lead market for Thai canned tuna, taking an 18% share in total exports. Additionally, exports to the USA increased by almost 13% in 2014 compared with the previous year. Egypt replaced Australia as the second largest export destination in 2014. Thai canned tuna exports also increased to Australia, which was the third largest market. Due to the political unrest, there were lower exports to Libya. Japan experienced lower exports as well, which was associated with the weakening yen.
In the traditional EU markets, Thai canned tuna exports declined by 27% to the UK, 25% to France (mainly cooked loins), and 44% to Poland. Exports increased to the Netherlands (+13%) and Germany (+12%).
There were significantly higher exports from Thailand to the Middle East and North African markets namely: Jordan (+109%), Syria (+24%), Iran (+133%), Iraq (+335%), Oman (+34%), Tunisia (+12%), Morocco (+398%) and Turkey (+426%). In Latin America, Chile and Peru were the important markets for Thai canned tuna, where imports increased by 42% and 112% respectively. Thailand also exported more canned tuna to small and new markets in Asia and Africa.
ImportsImport demand for canned tuna in 2014 has increased, particularly from the Middle East and North Africa markets (MENA), which has been supported by lower prices of skipjack. In contrast, imports into the EU and USA, the top two markets, have remained flat. In fact, imports into the EU from non-EU countries declined moderately from 488 386 tonnes in 2013 to 487 602 in 2014. US imports were slightly higher, but experienced a negative demand trend for the main product group, tuna in brine. Import volumes of canned tuna in 2014 compared with 2013 increased in Japan (+1.1%), Australia (+2.5%) and
importstuna loins (cooked): Usa
2009 2010 2011 2012 2013 2014
(1 000 tonnes)Thailand 10.1 26.8 24.7 20.1 22.1 26.1
China 0.0 0.0 6.2 11.0 14.3 22.8
Fiji 12.7 14.9 4.6 10.3 11.6 10.6
Mauritius 9.3 4.9 8.6 5.8 7.5 8.1
Colombia 1.4 5.0 6.9 13.9 9.5 6.2
Ecuador 0.1 0.1 0.9 2.7 0.7 0.9
Others 15.1 13.1 9.6 2.5 4.1 3.1
total 48.7 64.8 61.5 66.3 69.8 77.8source: nfms
importscanned tuna (excl. pouches): Usa
2009 2010 2011 2012 2013 2014
(1 000 tonnes)Thailand 78.8 96.6 83.2 62.9 63.7 65.2
Viet Nam 13.1 17.7 19.2 19.2 18.0 16.6
Philippines 25.0 18.5 21.5 18.5 14.3 14.1
Indonesia 13.1 12.9 9.5 8.4 7.6 7.9
China 6.0 5.9 6.7 7.0 8.6 5.9
Ecuador 1.6 3.6 6.6 2.4 1.1 0.8
Others 4.4 4.1 3.9 5.8 5.6 7.4
total 142.0 159.3 150.6 124.2 118.9 117.9source: nfms
importsfresh tuna: Usa
2009 2010 2011 2012 2013 2014
(1 000 tonnes)Yellowfin 14.2 16.0 16.9 15.8 16.0 16.2
Bigeye 5.5 4.0 4.5 3.0 4.0 4.1
Albacore 0.7 0.5 0.7 0.7 0.9 0.8
Bluefin 0.4 0.5 1.2 0.5 0.7 0.8
Skipjack 0.0 0.0 0.0 0.0 0.0 0.0
Others 0.0 0.3 0.4 5.7 0.3 0.4
total 20.8 21.3 23.7 25.7 21.9 22.3source: nmfs

14 Globefish highlights April 2015
were higher despite the fact that this product costs more than the lightmeat skipjack and yellowfin.
The market also imported more cooked tuna loins for domestic processing, with imports increasing by 11.4% in 2014 to 77 817 tonnes. The top five suppliers were Thailand, China, Fiji, Mauritius and Colombia.
Overall, imports of processed and canned tuna in the US market were 3.2% higher in 2014 compared with the previous year, attributed to increased imports of canned albacore and cooked loins for domestic processing. The customs declared value of these products in 2014 totalled USD 1.06 billion compared with USD 1.14 billion in 2013.
EUIn 2014, import prices of canned tuna weakened considerably. However, the market did not respond to this development as both imports of canned tuna for direct consumption as well as for reprocessing decreased.
Overall imports of processed tuna (HS 160414) into the EU, including cooked loins, totaled 487 602 tonnes in 2014 compared with 488 386 tonnes imported in 2013. The leading suppliers in order were Ecuador, Mauritius, Thailand, Seychelles, and the Philippines. Mauritius and the Philippines increased their exports to the EU while the others reported declines. The top five EU import markets were Italy, France, the UK, Spain and Germany.
I N T E R N AT I O N A L T R A D E D E V E L O P M E N T S
The EU and Sri Lanka
Effective from mid-January 2015, the EU banned all imports of fishery products from Sri Lanka
including tuna due to the non-compliance of IUU regulations. This has resulted in higher imports of raw tuna from the Maldives to Sri Lanka for re-export processing of fresh and frozen tuna loins. Demand for tuna from the Maldives has also increased in the EU market, with the export price increasing significantly by 50-60%, from USD 12 per kg in March 2014 to USD 25 per kg in March this year (all air-flown). This price shift is significant given demand for this product group is generally low in the EU during the winter season. At this high price, cheaper tuna loin exports from Indonesia to the EU are likely to rise in 2015.
importscanned tuna: italy
2009 2010 2011 2012 2013 2014
(1 000 tonnes)Spain 38.1 41.6 45.8 41.9 37.1 50.0
Côte d’Ivoire 10.6 7.4 7.1 9.6 8.5 8.5
Seychelles 6.4 7.1 6.2 7.1 8.4 8.3
Ecuador 3.5 4.0 4.0 5.4 7.3 7.8
Colombia 8.9 8.0 9.7 8.9 7.3 7.7
Mauritius 4.2 4.6 5.1 5.1 5.0 5.4
Portugal 1.8 1.8 2.1 1.9 2.1 2.0
El Salvador 0.4 0.7 0.8 0.8 1.2 1.5
Ghana 0.0 0.0 0.1 0.6 1.5 1.4
Thailand 2.2 2.6 3.1 1.7 1.8 1.0
France 4.9 0.6 1.3 0.7 0.2 0.0
Others 2.5 1.9 2.2 1.6 3.1 4.3
total 83.5 80.3 87.5 85.3 83.5 97.9source: istat
importstuna loins: italy
2009 2010 2011 2012 2013 2014
(1 000 tonnes)Ecuador 13.2 9.9 12.7 10.5 12.1 6.9
Solomon Islands 2.2 1.9 3.6 3.9 3.9 6.2
Thailand 8.7 5.2 3.7 4.8 2.7 3.8
Philippines 0.0 0.0 0.0 0.2 1.8 3.0
Kenya 1.5 2.3 3.5 3.1 1.7 3.0
Indonesia 0.1 0.0 0.0 0.2 0.8 2.3
Mauritius 5.0 4.4 1.9 2.6 2.8 1.9
Colombia 2.0 1.4 2.5 1.3 1.4 1.5
China 2.5 2.2 2.5 1.5 1.6 1.0
Spain 0.1 0.1 0.2 0.2 0.9 1.0
Papua New Guinea 1.3 0.7 1.1 1.4 1.0 1.0
Madagascar 0.0 2.2 0.9 0.8 1.4 0.8
Others 0.6 2.7 1.3 0.4 1.3 1.3
total 37.2 33.0 33.9 30.9 33.4 33.7
source: istat
importstuna loins: spain
2009 2010 2011 2012 2013 2014
(1 000 tonnes)Ecuador 28.7 25.7 21.4 21.4 21.5 17.5
Thailand 6.6 5.6 11.2 2.5 4.6 7.3
China 1.9 2.8 3.7 1.8 5.0 7.2
Papua New Guinea 0.5 1.7 4.5 6.6 8.7 6.4
El Salvador 13.1 7.6 5.8 6.1 6.9 6.4
Guatemala 5.7 8.7 6.5 9.1 7.1 5.3
Mauritius 5.5 7.5 9.6 9.0 4.8 5.3
Philippines 0.0 0.0 0.0 0.0 1.5 2.1
Portugal 0.9 0.4 0.9 0.0 0.0 1.8
Kenya 1.7 1.3 0.8 1.2 0.2 1.5
Indonesia 0.0 0.0 1.4 2.5 1.7 1.1
Others 4.3 4.8 2.6 2.4 1.0 3.1
total 68.9 66.1 68.4 62.6 63.0 65.0source: agencia tributaria
TUNA

15Globefish highlights April 2015
TUNA
The market EU also imported 108 182 tonnes of cooked loins in 2014, which was a moderate 2% more than the previous year. Spain was the largest buyer. Ecuador was the leading supplier, though it experienced a 30% decline in exports, followed by Thailand, Papua New Guinea, and China. Imports from Thailand and China increased by 57% and 25% respectively.
Other MarketsJapan, Australia and Egypt are all important export markets for Asian canned tuna producers, with imports into all three markets increasing in 2014 over 2013.
Brazil reported significantly higher imports of canned tuna (+87%) with Ecuador, Thailand and Portugal as the main suppliers. Egypt remains an important market for Asian exporters, although imports declined in 2014 compared with 2013.
importscanned tuna: germany
2009 2010 2011 2012 2013 2014
(1 000 tonnes)Ecuador 16.2 8.9 16.4 10.0 15.3 14.1
Philippines 19.9 17.3 15.5 14.0 13.2 13.2
Viet Nam 4.0 3.3 5.4 6.1 8.8 8.6
Netherlands 4.3 6.3 7.7 5.6 5.3 8.4
Papua New Guinea 6.8 11.3 8.7 12.2 9.6 7.5
Thailand 4.3 4.1 3.2 3.2 5.2 5.6
Spain 0.5 0.7 0.6 5.0 5.0 3.9
Indonesia 8.2 6.7 8.1 5.6 5.0 3.9
Italy 1.0 0.9 1.2 1.5 2.0 2.6
Peru 0.0 0.0 0.0 0.0 1.5 1.6
Côte d’Ivoire 1.0 0.0 0.7 1.4 2.7 0.8
Seychelles 1.2 3.2 1.1 0.3 0.4 0.2
Others 2.2 4.1 5.4 3.8 2.0 3.1
total 69.6 66.8 74.0 68.7 76.0 73.5source: germany customs
importscanned tuna: Uk
2009 2010 2011 2012 2013 2014
(1 000 tonnes)Mauritius 23.0 28.6 23.0 23.5 24.2 21.2
Seychelles 19.7 14.5 15.9 13.3 15.6 14.8
Thailand 17.2 14.2 21.9 11.7 18.0 11.3
Ghana 19.3 18.6 14.8 15.1 12.7 11.1
Philippines 16.5 14.4 10.2 11.5 11.3 10.7
Ecuador 7.4 4.0 12.2 12.1 10.3 9.8
Indonesia 0.7 1.3 2.5 6.1 7.5 9.2
Spain 2.2 3.7 7.0 6.3 7.7 5.7
Papua New Guinea 2.4 1.3 2.8 3.2 3.4 5.6
Portugal 0.2 0.3 1.4 1.0 1.2 2.3
France 2.7 2.3 1.4 1.7 2.8 2.0
Netherlands 0.0 0.1 0.1 0.2 0.4 1.5
Others 4.8 4.5 3.8 3.5 4.2 3.0
total 116.1 107.8 117.0 109.2 119.3 108.2source: her majesty’s revenue & custom
exportscanned tuna: thailand
2009 2010 2011 2012 2013 2014
(1 000 tonnes)USA 112.7 117.3 99.3 81.6 70.5 79.6
Egypt 39.8 51.5 44.2 40.4 22.3 37.4
Australia 32.4 41.0 42.3 34.1 33.4 34.9
Libya 33.7 20.5 11.4 30.5 31.4 28.8
Japan 24.3 23.5 29.9 26.8 29.1 28.5
Canada 30.8 28.8 28.8 22.7 24.8 27.9
Saudi Arabia 17.0 18.7 20.8 20.1 16.3 14.7
South Africa 9.8 11.3 7.7 9.5 8.6 11.8
Chile 4.6 7.6 9.5 8.9 7.8 11.0
Papua New Guinea 3.6 5.5 5.0 8.9 7.7 10.3
UAE 6.0 7.4 10.2 7.6 7.9 8.5
UK 17.0 13.9 22.8 4.4 10.7 7.8
Others 153.7 188.5 186.4 116.4 126.2 135.3
total 485.4 535.5 518.3 411.9 396.7 436.5source: thai customs * included under “others”
importscanned tuna: france
2009 2010 2011 2012 2013 2014
(1 000 tonnes)Spain 18.2 21.4 26.0 16.4 18.2 26.2
Seychelles 12.8 13.3 17.2 21.2 24.0 20.0
Côte d’Ivoire 19.8 18.6 15.3 21.7 20.8 15.0
Ecuador 12.4 12.0 13.6 11.6 12.6 12.9
Mauritius 2.1 1.5 2.9 4.8 6.3 8.9
Ghana 5.8 7.7 8.2 6.2 5.9 6.6
Madagascar 8.2 5.5 7.1 5.6 5.9 6.0
Thailand 9.6 7.6 9.4 4.7 5.7 4.9
Senegal 1.8 0.8 0.2 0.1 1.0 2.0
Belgium 1.6 1.8 1.7 1.6 1.8 1.5
Papua New Guinea 1.1 0.8 0.2 0.8 1.6 1.3
Others 8.1 4.2 4.0 2.9 3.4 4.8
total 101.5 95.2 105.8 97.6 107.2 110.1source: direction nationale des statistiques du commerce extérieur – dnsce

16 Globefish highlights April 2015
Outlook
Demand for sashimi tuna is expected to improve in Japan during the spring festival in April and May. Likewise in the USA, summer demand for non-canned tuna is expected to be strong. In the price sensitive EU markets however, the steep increase in the Southeast Asian fresh tuna export price will likely impact consumer demand negatively.
Frozen skipjack prices seem to have stabilized at USD 1 050 per tonne for delivery to Thailand. As a result, canned tuna prices are unlikely to weaken further in the short-term.
US imports of canned tuna in January 2015 increased by 5% compared with the same month in 2014. Canned tuna imports into Australia and Japan also increased by 9% and 22% respectively over the same time period. These trends reflect positive indications for the first quarter of 2015 for the canned tuna market.
CFR PricesCanned Tuna*: USA, Europe
* 48x6.5 oz Europe, 48x6 oz USA, chunk, origin Thailandsource: infofish
0.00
10.00
20.00
30.00
40.00
50.00
60.00
Jan-09 Jan-10 Jan-11 Jan-12 Jan-13 Jan-14 Jan-15
US $/carton
Canned tuna: USA, Europe Europe
USA
0.95
1.00
0.5
1.0
1.5
2.0
2.5
3.0
Skipjack Bangkok CFR
USD/kg
TUNA - Pacific Ocean
source: european Price report
1.75
1.05
0.5
1.0
1.5
2.0
2.5
3.0
Yellowfin > 10 kg, Spain CFR
EUR/kg
TUNA - Spanish canneries
source: european Price report
5.30
7.60
2.0 3.5 5.0 6.5 8.0 9.5
Skipjack - frozen cooked loins, single cleaned, Spain/Italy DDP Yellowfin - frozen cooked loins, double cleaned, Italy DDP
USD/Kg
TUNA - Loins
source: european Price report
1.75
0.85 0.85
1.60
0.5
1.0
1.5
2.0
2.5
3.0
Skipjack, Seychelles, FOB Yellowfin, Seychelles, FOB
Skipjack, Abidjan ex-vessel Yellowfin, Abidjan, > 10 kg, ex-vessel
EUR/kg
TUNA - Indian/Atlantic Oceans
EUR/kg
TUNA - Indian/Atlantic Oceans
source: european Price report
coldstorage holdingstuna: Japan
Yellowfin
bigeye
albacore
skipjack
Others
0
20
40
60
80
100
120
2002 2003 2004 2005 2006 2007 2008 2009 2010 2011 2012 2013 2014
source: infofish
1 000 tonnes
TUNA

17Globefish highlights April 2015
GROUNDFISH
Cod prices up dramatically over the past year
The cod season was off to a slow start in January 2015, and reduced landings caused prices to hold firm. Modest reductions in global cod landings are expected in 2015.
Pollock prices are very low at the moment, and the outlook is not good, as the TAC has been raised this year.
The NGO Sustainable Fisheries Partnership (SFP) recently announced that the global whitefish resource could increase fiercely by 2020 if stocks were properly managed. SFP has calculated that the whitefish resource may grow by 25% to over five million tonnes by 2020. The organization also pointed out that some of the major whitefish fisheries, like the Barents Sea cod fishery, are being well managed and therefore have a chance to improve.
Cod
Global cod landings have been on a rising trend for the past decade, but in 2015 landings are expected to decline slightly. NFI expects that global landings may slip from 1.8 million tonnes in 2014 to 1.7 million tonnes in 2015. Cod quotas in the Barents Sea alone have been reduced by almost 100 000 tonnes, from 993 000 tonnes in 2014 to 894 000 tonnes in 2015 (Source: NFI).
SuppliesSo far for 2015, Barents Sea cod catches were slow. Norwegian landings were down by 54% during the first six weeks of 2015, from 117 000 tonnes in 2014 to just 53 000 tonnes in 2015. Russian landings were down by
39% during this same six week period, from 38 000 tonnes last year to just 23 000 tonnes this year. US catches of cod were also down considerably when comparing these same periods. Despite these reduced landings, the global market has not reacted to the extent that one might have expected, at least not yet.
The spring cod fishery along the northern coast of Norway, the so-called “skrei” fishery, was off to a slow start this
groundfish production by species (2012)
Alaska pollock45%
Source: FAO
Cod23%
Hake15%
Whiting6%
Haddock6%
Saithe5%
1106 1103 1196
1321
1479 1590
1782 1821 1720
0
200
400
600
800
1 000
1 200
1 400
1 600
1 800
2 000
2007 2008 2009 2010 2011
2012 2013 2014 2015E
1000
met
ric to
nnes
Whole fish Weight
Source: Groundfish Forum

18 Globefish highlights April 2015
GROUNDFISH
year. Most observers expect that larger volumes would be landed late in the season, just before Easter, when this fishery comes to a close. Normally, large amounts of cod are landed during January and February, but this year the cod arrived late, and consequently prices remained high in the beginning of the season.
TradeDespite political problems in the relationship between Norway and China, there is growing interest for Norwegian cod on the Chinese market. China is already a major buyer of round frozen cod from Norway, but most of this is imported for processing and re-export to the USA and EU. In 2014, China accounted for no less than 46% of Norwegian round frozen cod exports. The NSC is now targeting Chinese consumers as cod eaters, preparing promotional campaigns with the aim to increase Chinese consumption of Norwegian cod to about 20 000 tonnes over the next five years (Source: NSC).
The NSC reported reduced cod exports in February 2015 compared with the same month a year ago. Total whitefish exports were reduced by 33% in volume terms, however prices were up, so the reduction in value was only 9%.
Norwegian saltfish exports were down a massive 47% by volume, but strong price increases resulted in a lesser decline in value (-29%). Indeed, the average export price
for saltfish increased by 33% from February 2014 to February 2015.
Other whitefish products like stockfish, klipfish, frozen cod and fresh whitefish experienced similar price increases over the past year. Stockfish prices strengthened by 31%
importsfrozen cod fillets: germany
2009 2010 2011 2012 2013 2014
(1 000 tonnes)China 7.0 9.7 15.0 10.5 11.0 12.5
Poland 2.6 5.7 4.3 5.1 6.5 8.0
Greenland 0.4 0.1 0.2 0.3 1.6 1.6
Lithuania 0.1 0.5 0.7 0.4 0.4 1.5
Viet Nam 0.2 0.7 0.2 1.7 1.7 1.4
Denmark 1.5 2.2 2.7 1.3 0.9 1.3
UK 0.3 0.2 0.5 0.6 0.9 1.2
Norway 0.3 0.8 0.6 0.5 0.6 1.1
Russian Fed. 0.7 0.6 0.5 0.5 0.5 0.6
Netherlands 0.2 0.3 0.3 0.3 0.5 0.6
Others 1.3 1.0 1.0 0.7 1.0 1.0
total 14.6 21.8 26.0 21.9 25.6 30.8source: germany customs
importsfrozen cod: Uk
2009 2010 2011 2012 2013 2014
(1 000 tonnes)China 14.3 13.6 15.7 14.6 20.4 24.1
Iceland 15.9 15.0 15.5 14.6 17.4 17.1
Norway 8.0 8.8 9.3 7.9 10.1 15.1
Russian Fed. 10.8 11.1 9.7 12.7 11.8 10.1
Germany 1.5 6.3 8.7 7.6 6.5 5.9
Faroe Islands 5.5 5.6 6.2 6.0 6.2 4.8
Denmark 7.3 5.9 7.5 7.2 6.7 4.0
Greenland 1.1 1.9 2.0 2.5 2.6 2.1
Poland 3.9 2.2 2.2 2.4 2.5 2.0
Others 4.1 4.0 4.8 3.6 3.3 5.1
total 72.4 74.4 81.6 79.1 87.5 90.3source: her majesty’s revenue & customs
1.31 1.0 1.3 1.5 1.8 2.0 2.3 2.5
Fresh gutted
EUR/kg
COD - in Poland (FOB, origin: Baltic Sea)
source: european Price report
importsCod-like Groundfish: USA
2009 2010 2011 2012 2013 2014
(1 000 tonnes)
filletsChina 76.5 74.6 87.9 79.4 83.7 81.0
Iceland 8.4 9.2 7.1 9.7 11.0 9.6
Russian Fed. 1.7 8.3 5.2 4.7 6.5 5.2
Canada 5.4 5.3 4.9 5.3 3.8 4.1
Argentina 0.7 0.0 0.0 4.0 2.5 3.1
Norway 1.0 0.8 0.7 1.7 2.2 1.9
Thailand 1.0 1.1 1.4 1.0 1.5 1.2
Others 1.4 1.4 2.1 6.8 10.8 10.8
total 96.1 100.7 109.3 112.6 122.0 116.9
blocks/slabsChina 38.9 35.9 36.6 33.4 31.2 31.9
Iceland 1.0 0.7 0.7 1.1 1.7 1.6
Argentina 1.4 0.7 0.6 1.6 1.3 1.4
Norway 0.6 0.8 0.7 0.3 0.7 0.8
Russian Fed. 2.9 1.2 1.1 0.5 0.3 0.3
Canada 0.5 0.4 0.3 0.4 0.3 0.1
Others 1.4 1.8 1.4 2.7 2.2 0.9
total 46.7 41.5 41.4 40.0 37.7 37.0gr. total 142.8 142.2 150.7 152.6 159.7 153.9source: nmfs

19Globefish highlights April 2015
compared with February 2014, frozen whole cod prices were up by 61%, and fresh round cod by 44% (Source: NSC).
US imports of cod-like groundfish declined very moderately from 159 700 tonnes in 2013 to 153 900 tonnes in 2014 (-3.6%). The entire decline was registered in the fillet sector, with fillet imports decreasing from 122 000 tonnes to 116 900 tonnes (-4.2%). Imports of blocks and slabs were practically the same as 2013. The main supplier was China, which accounted for a massive 73.4% of total cod imports.
German imports of frozen cod fillets continued to rise in 2014, increasing by over 20% in 2014 compared with 2013. Total imports amounted to 30 800 tonnes, up from 25 600 tonnes in 2014. China and Poland were the dominant suppliers, shipping 12 500 tonnes and 8 000 tonnes, respectively.
Frozen cod imports also rose in the UK, which imported 90 300 tonnes in 2014, up from 87 500 tonnes in 2013 (+3.2%). China accounted for 24 100 tonnes (26.7%) of this. Other suppliers also played an important part; Iceland exported 17 100 tonnes, Norway 15 100 tonnes, and The Russian Federation 10 100 tonnes.
Alaska pollock
The Alaska pollock A season opened in January 2015 with a larger quota than compared with 2014. The Bering Sea quota for 2015 is 1.31 million tonnes, 3% higher than in
GROUNDFISH
2014. Less than half of the quota (40%) is allocated to the A season, which will end in early June.
The depreciation of the euro against the dollar has had a major effect on pollock prices, making US pollock more expensive for European buyers. Pollock roe prices are very low at the moment, actually at their lowest levels since the 1990s. In dollar terms, roe prices were 30% below last year, while in Japanese yen, the price was down just 20%. Although many producers are pinning their hopes on the B season now, price increases are unlikely as ample supplies of Alaska pollock are expected for 2015 (Source: Undercurrent News).
The European market for Alaska pollock was mixed in 2014. The largest importer, Germany, increased imports of frozen pollock fillets by 2.4%, from 136 900 tonnes in 2013 to 140 200 tonnes in 2014. The main and almost only suppliers were China (61% of total) and the USA (30% of total).
France, on the other hand, saw a slight decline in imports of frozen Alaska pollock fillets, from 50 900 tonnes in 2013 to 47 000 tonnes in 2014 (-7.7%). China is also the main supplier, accounting for 40% of the total, followed by Russia (22.8%) and the USA (21.3%).
importsfrozen alaska Pollock fillets: germany
2009 2010 2011 2012 2013 2014
(1 000 tonnes)China 86.6 88.2 84.2 87.7 87.3 83.5
USA 28.1 36.3 48.1 53.4 32.3 41.5
Russian Fed. 21.5 17.6 17.7 9.9 12.3 9.9
Others 6.3 4.5 5.1 6.1 5.0 5.3
total 142.5 146.6 155.1 157.1 136.9 140.2source: germany customs
importsfrozen hake fillets: germany
2009 2010 2011 2012 2013 2014
(1 000 tonnes)Peru 4.1 4.4 3.5 2.6 3.8 4.1
Namibia 2.2 2.5 3.1 3.0 3.0 3.0
USA 6.9 4.8 3.7 3.0 0.6 0.9
Argentina 3.6 2.5 1.3 1.3 1.5 0.8
Netherlands 0.1 0.1 0.5 0.1 0.2 0.2
South Africa 1.5 0.4 0.4 0.4 0.5 0.1
Others 1.4 0.7 1.3 0.7 0.4 0.5
total 19.8 15.4 13.8 11.1 10.0 9.6source: germany customs
importsfrozen alaska Pollock fillets: france
2009 2010 2011 2012 2013 2014
(1 000 tonnes)China 22.2 23.1 30.5 23.8 20.9 18.9
Russian Fed. 5.8 5.3 6.2 6.6 13.5 10.7
USA 6.0 5.2 9.8 9.0 9.6 10.0
Germany 2.7 4.0 5.7 4.9 6.1 6.5
Others 1.0 2.0 0.4 0.7 0.8 0.9
total 37.7 39.6 52.6 45.0 50.9 47.0source: direction nationale des statistiques du commerce extérieur – dnsce
importsfrozen hake fillets: italy
2009 2010 2011 2012 2013 2014
(1 000 tonnes)USA 0.0 2.5 3.3 3.5 3.8 5.9
South Africa 3.6 3.7 4.3 4.1 4.3 4.4
Namibia 2.2 3.3 3.5 3.3 5.0 3.9
Spain 1.8 2.3 2.5 2.4 2.2 3.3
Argentina 9.5 10.2 9.5 6.6 6.2 2.9
Uruguay 2.7 4.6 5.1 3.3 4.0 2.1
Peru 0.0 0.0 0.3 0.8 1.3 1.2
Others 2.8 3.2 3.2 2.7 2.4 1.5
total 22.6 29.8 31.7 26.7 29.2 25.2source: istat

20 Globefish highlights April 2015
In recent news in the pollock sector, the big are growing bigger. Only a few companies control the north Alaska pollock fishery, and consolidation is continuing on both sides of the Pacific. In Russia, the five largest companies will control 80% of the total Russian quota in 2015-2016, while in the USA, four companies (Trident, Maruha Nichiro, Nissui and American Seafoods) will control 80% of the US quota.
Hake
The embargo by Western countries on food exports to Russia has resulted in some shifts in trade patterns, and China seems to have benefited from the situation, emerging as the largest supplier of hake to Russia. In 2014, Chinese hake exports to Russia increased by 182%, while Canadian and US exports of hake to Russia dropped dramatically. North American hake is going through China on its way to Russia, but it is being processed in China so that the country of origin is changed (Source: Undercurrent News).
At the same time, Argentinean hake is being diverted from the EU to the USA, where demand is very strong. Over the last six months of 2014, Argentinean hake prices increased by 5% as a result of this strong demand. Prices are expected to stay at this level in coming weeks. Argentine exports of hake fillets to Europe are expected to decline while this price situation lasts.
Less frozen hake fillets was imported into the European market in 2014 compared with 2013. Germany had a slight decline in imports, which went from 10 000 tonnes to 9 600 tonnes, while Italy also imported less, from 29 200 tonnes to 25 200 tonnes. For Germany, the main suppliers were Peru and Namibia, while for Italy the main suppliers were the USA, South Africa and Namibia.
Surimi
There seems to be a shortage of surimi on the market at the moment. Tropical surimi production has declined, and many traders are now looking to Alaska pollock for supplies. However, Alaskan producers are asking for higher prices.
GROUNDFISH
Japan’s imports of Alaska pollock surimi from the USA rose by 17% in 2014 to 110 000 tonnes. In addition, Japan imported over 6 200 tonnes of Alaska pollock surimi from other countries. According to IntraFish, import prices were up by some 12%.
Russia, which has banned imports from major western suppliers, is now having to rely on producers in Asia (Thailand primarily) to supply surimi to the Russian market. In Japan, surimi inventories are low, and diminishing. Thus, price increases for surimi are likely.
Prices
Cod prices increased by almost 50% between February 2014 and the beginning of March 2015, and some analysts expect prices to go even higher. However, prices are
18.00
5.0
9.0
13.0
17.0
21.0
25.0
H&G - < 800 gr/pc
NOK/kg
HADDOCK - H&G, origin: Norway
source: european Price report
5.75 6.75 8.00 8.75
3.5
5.5
7.5
9.5
11.5
13.5
100-250 gr/pc 250-500 500-1000 >1000
EUR/kg
MONKFISH - In Spain, origin: Namibia
source: european Price report
4.00 4.10 4.50
2.5
3.0
3.5
4.0
4.5
5.0
Fillets, skin-on 4-6 Fillets, skin-on 6-8 Fillet, skin-on > 8
EUR/kg
HAKE - in Spain, origin: Namibia
source: european Price report
source: european Price report
2.48
2.0
2.3
2.5
2.8
Stick 250 gr/pc
EUR/kg
SURIMI - in France, origin: Spain

21Globefish highlights April 2015
M A R k E T F O C U S
Russian cod
The overall catch of fish in the Northern fishing basin is down due to strong storms. According
to the Federal Agency for Fisheries, from 1 January to the 18 March 2015, the catch in the Northern fishing basin was 146 500 tonnes, which is 13 800 tonnes lower compared with the respective period in 2014. The catch of cod during this same time period decreased to 78 600 tonnes, a reduction of 38 100 tonnes compared with the January-March period in 2014.
The main market trends for cod in Russia are sharply increasing prices and as a result, reduced output within the processing industry. According to the Federal State Statistics Service, the inflation for fish products reached 31% in one year (from February 2014 to February 2015). Cod species were noted as experiencing some of the most dramatic increases. Just within a short period of time, the price of cod went from RUB 157 per kg (ex-vessel) on 12 January 2015 to RUB 190 per kg on 22 January 2015. The market expects this price climb to continue. As the rouble weakened, increased exports of cod followed as the depreciation of the ruble made it more profitable for fishermen to export cod than to sell domestically,
As a result, the Russian fish processing industry is in a difficult situation. Prices for fish as raw materials are in US dollars, making it overly expensive for the sector. In addition, there is decreasing consumer purchasing power on the domestic market. Reducing the volume of cod on the local market will not improve the situation, as the costs of raw materials for local processing companies are rising, with potential profitability for companies on the decline.
still well below the peak experienced in 2007-2008. The general consensus in the industry is that cod prices should stay firm during 2015, with the quota reduction in the Barents Sea given as the main reason.
Haddock prices have been high for some time, but fluctuations in currency exchange rates have caused some shifts. According to Undercurrent News, the market reacted to the 37% reduction in TAC which was set by Russia and Norway for 2013. Since then, the TAC has been reduced further to 178 500 in 2014 and 2015. The depreciation of the Norwegian krone as well as the Russian ruble against the US dollar then pushed prices down and haddock is now just above the price of cod.
For Russian pollock, the Russian authorities are taking steps to keep as much fish as possible for the domestic market due to the import ban. This development has led to talk about dropping the preferential tax breaks for exporting, thus making Russian pollock more expensive on world markets.
GROUNDFISH
CFR Prices Groundfish Blocks: USA
source: infofish
0.5
1.0
1.5
2.0
2.5
3.0
Dec-05 Dec-06 Dec-07 Dec-08 Dec-09 Dec-10 Dec-11 D ec-12 Dec-13 Dec-14 Dec-15
USD/lb
cod
alaska pollock
norwegian export Prices average export prices in nok per kg, fob norway
source: central bureau of statistics, norway.
0
10
20
30
40
50
60
70
80
90
100
jan.1
1
apr.1
1
jul.1
1
okt.1
1
jan.1
2
apr.1
2
jul.1
2
okt.1
2
jan.1
3
apr.1
3
jul.1
3
okt.1
3
jan.1
4
apr-1
4
jul-1
4
oct-1
4
jan-1
5
nok/
kg fo
b no
rway
Frozen cod whole
Fresh cod
Frozen cod fillets
Fresh cod fillets
Outlook
Overall, supplies will remain more or less at the same levels as 2014, although there will be less cod available. It is expected that Alaska pollock supplies will increase somewhat. Although a number of the major groundfish suppliers are affected by the Russian import ban, global trade in groundfish species will only be marginally affected.
Cod prices are expected to rise during the first half of 2015, then stabilize during the second half. Foreign exchange fluctuations will affect trade as it is expected that the Norwegian krone will strengthen from its current weak position, and the weak ruble is making Russian groundfish easier to sell.

22 Globefish highlights April 2015
CEPHALOPODS
Octopus landings bounced back in 2014
Increased octopus landings put some pressure on prices in 2014, while a decline in squid landings and tighter supplies are forecasted for 2015. The cuttlefish market remains
dull with somewhat tighter supplies.
Octopus
2014 was a bumper year for production of octopus, according to information presented during the Global Seafood Marketing Conference in Las Vegas in January. Total octopus production rose to about 370 000 tonnes, which is the highest level since 2009. The main producer was China, which accounted for over 120 000 tonnes, followed by Japan (ca. 35 000 tonnes) and Mexico (ca. 34 000 tonnes). Interestingly, China did not become a major producer until 2003. Indeed, in 2002, China reported landings of only 741 tonnes.
The Yucatan region in Mexico is the country’s leading producer of octopus. In 2014, a total of 24 527 tonnes were landed, compared with 13 415 tonnes in 2013 (+83%). The 2014 season was particularly good for catching two species: the Octopus maya and the Octopus vulgaris. Of the total production, about 70% is exported to the EU (mainly Spain and Italy), while the rest is largely consumed locally. Smaller amounts are also shipped to Japan.
In Yucatan, there is ongoing research related to farming octopus, with the current focus on Octopus maya, the species that holds the greatest promise for aquaculture
operations. In recent years there have been major advances, including the design of tanks for grow-out and the development of a diet that makes it possible to grow the species to about 250 g, which is an acceptable size for the Mexican market.
In Japan, cold storage holdings of octopus are at a very low level. At the end of 2014, inventories were estimated at about 11 600 tonnes, which was 30% below the previous year. The main reason for this is lower supplies from Africa. Shipments from the two major suppliers, Morocco and Mauritania, were down by 33% and almost 50%, respectively, as difficult price negotiations between Japan and Mauritania stalled shipments. Since then, Japan has imported octopus mainly from Morocco. China profited somehow from this situation, as Chinese shipments to Japan increased by 23% during 2014. Other suppliers accounted for only minor volumes.
Italian octopus imports increased by 9% in 2014, to 46 200 tonnes. Thus, it appears that Italian imports are heading towards the same level as in earlier years. In 2009, for example, Italy imported 55 000 tonnes of octopus. The main supplier in 2014 was Morocco, accounting for 21% of total imports, but registering a major decline in shipments
Squid72 %
Cephalopods nei
18 %
Octopus9%
Cuttlefish1%
cephalopods production by species (2012)
Source : FAO

23Globefish highlights April 2015
The squid fishery in Argentina was not off to a good start in January, as landings of Illex were down by 60% compared with the same period in 2013 (Source: Merco Press). However, it is still early to draw any conclusions regarding this season.
Argentine squid exports declined by 2.7% in 2014, to 493 244 tonnes. However, the export value increased by
(-31.5%). Spain retained second place with 7 500 tonnes (16.2% of total), followed by Mexico (11%). Mexico registered a healthy growth in shipments to Italy, with a 45.7% increase in exports.
Spain also increased its imports of octopus in 2014, from 41 800 tonnes in 2013 to 44 200 tonnes in 2014 (+5.7%). The main supplier is neighbouring Morocco, which accounted for 18 900 tonnes or 42.8% of total imports. Other major suppliers included Mauritania (7 200 tonnes or 16% of total) and Portugal (6 400 tonnes or 14.5% of total). Statistics show that Morocco and Portugal lost market share in Spain, while Mauritania gained.
It is also worth noting that over the past decade, the USA has become a significant importer of octopus. In 2000, the USA imported about 13 000 tonnes, but this has since steadily increased, and in 2014 the country imported almost 20 000 tonnes of octopus.
Squid
Global squid production appears to be declining slightly, although over the past six years landings have been relatively stable at around 3 million tonnes. China is the most important supplier, accounting for about 900 000 tonnes in 2014, followed by Peru (ca. 510 000 tonnes), Republic of Korea (280 000 tonnes), and Japan (210 000 tonnes).
US squid landings increased dramatically in 2009-2010 after a period of steady decline from 2000 to 2008 (-80 000 tonnes). In 2009 there was a jump in US squid landings to about 110 000 tonnes, and further to ca. 155 000 tonnes in 2010. However, landings have been declining since 2010, and in 2014 were just under 120 000 tonnes (Source: NFI).
importssquid: italy
2009 2010 2011 2012 2013 2014
(1 000 tonnes)
Spain 17.9 20.4 21.0 19.9 22.2 20.1
Thailand 22.2 20.6 20.7 17.9 17.0 18.9
China 3.9 8.0 6.6 7.0 10.7 9.8
India 4.1 9.3 7.9 4.8 7.6 5.8
Viet Nam 6.6 8.6 7.6 6.6 5.5 4.6
Indonesia 1.5 2.2 3.4 2.8 2.3 2.2
Peru 2.3 1.2 1.5 1.7 2.9 2.1
South Africa 4.7 5.2 4.6 2.4 1.7 1.8
USA 1.0 1.0 1.7 1.4 0.7 1.8
Morocco 0.8 0.2 0.8 0.6 1.0 1.7
France 1.9 2.0 2.0 2.0 1.5 0.9
Others 3.2 5.0 1.6 3.5 5.3 3.2
total 70.1 83.7 79.4 70.6 78.4 72.9
source: istat
importssquid: Japan
2009 2010 2011 2012 2013 2014
(1 000 tonnes)
China 23.7 26.6 33.7 33.8 39.6 36.4
Peru 10.5 4.8 11.2 8.5 14.4 10.9
Chile 0.0 0.9 3.8 7.9 7.4 8.1
Argentina 3.0 0.4 0.6 0.6 5.7 7.5
Thailand 6.9 7.6 7.7 6.9 6.5 5.7
USA 4.0 6.3 5.9 5.1 7.3 3.8
Viet Nam 5.5 5.4 5.0 5.1 4.4 3.6
India 1.3 2.1 1.7 1.4 1.7 1.3
Republic of Korea 0.4 1.0 0.7 0.8 1.3 1.2
Philippines 0.8 1.1 1.0 1.2 1.2 1.2
Mexico 0.2 0.4 0.5 1.0 0.7 1.0
Indonesia 0.1 0.1 0.5 0.8 0.8 0.7
New Zealand 1.4 0.5 0.3 0.5 0.2 0.1
Others 1.2 2.2 1.3 1.5 2.0 1.3
total 59.0 59.4 73.9 75.1 93.2 82.8source: Japan customs
importsoctopus: spain
2009 2010 2011 2012 2013 2014
(1 000 tonnes)
Morocco 20.0 16.6 13.6 14.2 21.1 18.9
Mauritania 9.2 3.9 5.2 5.4 4.9 7.2
Portugal 1.1 2.0 1.6 2.2 7.0 6.4
Mexico 0.9 2.5 2.9 0.8 0.3 1.5
China 3.7 3.0 0.9 1.4 2.6 1.5
Viet Nam 1.7 1.7 1.6 0.8 0.8 1.4
Italy 1.0 1.3 1.0 1.2 1.5 1.2
Algeria 0.5 0.6 0.6 0.8 0.7 1.1
Senegal 1.0 1.1 2.3 1.8 0.6 1.1
India 1.2 1.0 1.7 0.9 0.6 1.1
Others 3.2 2.6 4.4 2.3 1.7 2.8
total 43.5 36.3 35.8 31.8 41.8 44.2
source: agencia tributaria
CEPHALOPODS

24 Globefish highlights April 2015
6.6% as prices went up. The main species was Illex, which accounted for 119 802 tonnes, a 10% reduction compared with 2013 (Source: Undercurrent news).
Viet Nam is predicting growth in its exports of cephalopods in 2015, particularly squid. The Vietnam Association of Seafood Exporters and Producers (VASEP) expects cephalopods exports to grow by as much as 15-25%. In 2014, the country exported cephalopods worth USD 438 million, an 8.5% increase compared with 2013. Japan is the most important market, accounting for about 23% of Viet Nam’s cephalopods exports. However, a recently signed free trade agreement between Viet Nam and Republic of Korea will likely also boost trade between these two countries (Source: INFOFISH).
Tighter supplies caused Japan to import less squid in 2014 compared with 2013, falling by 11.2% to 82 800 tonnes. The main supplier by far was China, accounting for 44% of total imports. However, China lost market share to Chile and Argentina, both of which shipped more squid to Japan in 2014. The USA, which has developed to become a major supplier over the past decade, suffered a major set-back as shipments to Japan fell by 48%.
European imports also declined somewhat in 2014. Italy imported 72 900 tonnes, which was 7% below the previous year. Of the major suppliers to Italy, only Thailand registered an increase in export volume.
On the Spanish market, imports declined from 97 100 tonnes in 2013 to 92 400 tonnes in 2014 (-4.8%). Practically all major suppliers suffered declining shipments, except the USA, which increased exports to Spain from 1 300 tonnes in 2013 to 5 000 tonnes in 2014. However, US exports in 2013 were at a particularly low level. Total US squid exports in 2013 stood at 96 216 tonnes, while in 2014 they bounced up to 120 887 tonnes. As much as up to 75% of US squid exports go to China, presumably for processing and re-exports (Source: NFI/NMFS).
The USA was the only major squid market where imports were more or less level with the previous year. Imports slipped very slightly from 69 400 tonnes to 69 200 tonnes. China remained the dominant supplier, accounting for a massive 56.6% of total US squid imports. For the other suppliers there were only minor changes. Total supplies of squid to the US market is estimated at about 78 000-80 000 tonnes annually (Source: NFI).
Cuttlefish
In February, Australia announced that the temporary closure of the giant cuttlefish (Sepia apama) in the northern Spencer Gulf was extended until 15 February. This action was explained as a precautionary measure while research into the behaviour of the species continues. Though a survey undertaken in 2014 indicated that the stock was increasing significantly, this needs to be further verified (Source: FIS.com).
Overall, supplies of cuttlefish have been a bit tight, and this is reflected in trade statistics. All major markets
importssquid: spain
2009 2010 2011 2012 2013 2014
(1 000 tonnes)Falkland Isl. (Malvinas) 31.6 48.5 33.3 48.1 39.1 38.8
India 15.1 22.3 18.0 20.4 16.2 16.8
China 8.1 12.0 13.4 10.6 10.8 8.7
Morocco 6.3 5.0 5.7 5.2 8.9 8.3
USA 1.4 2.4 5.7 5.5 1.3 5.0
Peru 9.3 12.4 9.7 11.1 8.2 4.2
Namibia 0.7 1.3 1.6 1.9 2.4 2.0
Mauritania 0.9 0.6 0.7 1.0 2.2 1.8
Portugal 1.9 2.7 2.2 1.4 1.2 1.4
France 1.3 1.9 2.0 2.8 1.4 1.0
Others 12.5 11.2 12.1 8.7 5.4 4.4
total 89.1 120.3 104.4 116.7 97.1 92.4source: agencia tributaria
source: european Price report
5.70
3.0
4.0
5.0
6.0
7.0
8.0
Squid - Whole, FAS, size M
EUR/kg
SQUID - in Italy, origin: South Africa
importssquid: Usa
2009 2010 2011 2012 2013 2014
(1 000 tonnes)China 26.1 37.4 38.8 38.3 39.7 39.2
Republic of Korea 5.9 5.4 4.8 3.6 4.2 4.7
Taiwan PC 6.9 4.5 3.3 3.4 3.1 4.0
India 3.8 5.1 5.5 5.5 4.4 3.9
Thailand 4.7 4.1 4.0 4.0 3.4 3.3
Peru 3.2 2.8 3.1 2.6 3.3 2.4
New Zealand 1.0 3.1 1.7 0.9 1.8 0.8
Others 4.5 4.1 6.1 12.6 9.5 10.9
total 56.1 66.5 67.3 70.9 69.4 69.2source: nmfs
CEPHALOPODS

25Globefish highlights April 2015
imported less in 2014 than in 2013. Japan’s cuttlefish imports declined by almost 10% to 11 900 tonnes, while Italy imported 17 400 tonnes, 14.7% less than in 2013, and Spanish cuttlefish imports dropped by 28% to 25 400 tonnes.
Outlook
Squid prices took a dive on the European market during the first few months of 2015. Landings are expected to be bit lower during 2015, and this will have some effect on prices. On the octopus market, supplies might be a little tighter this year, especially in Japan, and therefore prices are expected to improve moderately. The same is true for the cuttlefish market, where trade is cooling off.
source: Japan fisheries agency
Japan cold storage holdings of cephalopods
0
20
40
60
80
100
120
140
160
Sep-01 Sep-02 Sep-03 Sep-04 Sep-05 Sep-06 Sep-07 Sep-08 Sep-09 Sep-10 Sep-11 S ep-12 Sep-13 Sep-14
1 000 mt
cuttlefish nei
squid
importsCuttlefish: Spain
2009 2010 2011 2012 2013 2014
(1 000 tonnes)Morocco 13.4 13.6 14.1 15.2 15.9 14.0
France 2.7 3.0 3.8 4.8 3.8 3.0
Mauritania 2.9 2.0 1.3 2.4 3.5 2.2
Senegal 0.5 0.7 1.2 0.5 0.8 1.3
China 6.7 4.4 2.8 3.1 3.4 1.0
Ghana 1.5 1.9 1.5 0.7 0.3 0.8
India 20.1 18.8 15.4 9.5 4.8 0.7
Others 4.3 8.8 6.8 4.8 2.8 2.4
total 52.1 53.2 46.9 41.0 35.3 25.4source: agencia tributaria
importsCuttlefish: Italy
2009 2010 2011 2012 2013 2014
(1 000 tonnes)Spain 5.0 4.3 3.1 3.8 4.5 3.5
France 3.7 6.2 6.4 7.0 5.1 3.5
Tunisia 3.4 5.5 5.7 5.0 3.5 3.1
Morocco 2.9 1.9 1.7 1.9 1.7 2.1
Senegal 2.3 2.2 2.1 1.5 2.0 1.7
Others 6.6 5.8 5.3 5.7 3.6 3.5
total 24.0 25.8 24.3 24.9 20.4 17.4source: istat
importsCuttlefish: Japan
2009 2010 2011 2012 2013 2014
(1 000 tonnes)Thailand 7.5 6.9 6.0 5.6 4.5 4.6
Morocco 2.7 3.2 1.9 2.7 3.0 2.3
Viet Nam 3.9 3.9 3.8 3.6 2.5 2.2
Malaysia 1.9 1.8 1.3 1.4 1.3 1.3
Iran 0.3 1.0 0.6 1.0 0.3 0.5
Republic of Korea 0.8 0.5 0.6 0.4 0.4 0.2
Others 1.9 1.7 1.8 1.5 1.2 0.8
total 19.0 19.0 16.0 16.2 13.2 11.9source: Japan customs
B U S I N E S S F O C U S
According to Undercurrent News, an increase in global demand for baby octopuses has resulted
in Indian seafood exporters scouring for the marine product, which is mostly caught from the western coast. As the availability of baby octopuses is limited, the exporters must pay a premium price to purchase them from the fishermen for shipment. The unprecedented increase in the demand is related to limited landings in Viet Nam. “From USD 2.2 to USD 2.8 per kg last year, the prices have increased to USD 3.3 to USD 3.5 per kg. Those weighing from 10 to 100 g are classified as babies. The number of pieces in a kg is more in the case of baby octopuses,’’ said Alphonse Joseph, managing director of Capithan Exporting Company. As a result of high demand, the fishermen have increased their local prices to around USD 3 per kg.
Source: Undercurrent News
CEPHALOPODS

26 Globefish highlights April 2015
Strong demand for tilapia
Tilapia supplies into the international market are slowly growing from other sources in Asia, with Viet Nam set to ramp up production in 2015. Overall demand expected
to remain strong in both international and domestic markets with prices remaining firm.
TILAPIA
China
Chinese export volumes of tilapia in 2014 remained stable with 402 000 tonnes exported, while the value was up 4.6% compared with 2013 as prices strengthened globally. Indeed, in 2014, the average Chinese export price of frozen tilapia fillets increased by 4.9% compared with 2013 and stood at USD 4.60 per kg.
Frozen fillet export volumes, which make up a significant part of overall Chinese tilapia exports (42%), declined by 6.5%, primarily to the main market, the USA. This decline however, was compensated for by higher exports of whole frozen and breaded tilapia. African markets were the main destinations for these category products.
Meanwhile, Iran has emerged as a potential market for tilapia fillets as import volumes increased to 9 286 tonnes in 2014 which means an impressive 171% increase over 2013. The frozen fillet market in Iran used to be dominated by New Zealand hoki, however, tilapia is now making in roads as a cheaper alternative. Pangasius fillets have not been able to enter this market as the fish does not have scales and therefore cannot be consumed due to religious reasons.
According to INFOFISH estimates, China exported approximately 926 000 tonnes of tilapia as whole fish equivalent in 2014. Live tilapia exports from China to Hong Kong SAR were estimated to be more than 10 000 tonnes for 2014.
USA
Total tilapia import volumes into the US market grew only marginally (+0.7%) in 2014 compared with the previous year. The usual demand from Lent during the first quarter of the year will likely result in increased tilapia imports during this time period.
Frozen fillets, which account for the largest share of imports, experienced 3.2% growth in 2014 compared with the previous year. This marginal import growth was primarily due to lower supplies of both whole frozen and fresh tilapia fillets. On the contrary, these two categories showed growth in the previous reporting period (2013 against 2012). Taiwan (Province of China) substantially declined their frozen tilapia imports to the US market as the domestic market absorbed production.
Fresh tilapia import volumes in 2014 were 5.6% lower compared with 2013, while the import value declined only marginally (-1%). Honduras remained the largest supplier, growing its exports to the USA by 19.5%. Behind Honduras were Costa Rica and Colombia, with Colombia supplying more in 2014 than in the previous year.
importsWhole frozen tilapia: Usa
2009 2010 2011 2012 2013 2014
(1 000 tonnes)China 29.7 22.9 25.7 23.4 24.3 24.7
Taiwan PC 13.2 16.3 12.2 10.4 16.4 12.1
Thailand 0.9 1.2 0.6 0.5 0.4 1.0
Others 0.4 0.5 1.2 1.0 0.7 2.1
total 44.2 40.9 39.7 35.3 41.8 39.9source: nmfs
importstilapia (by product form): Usa
2009 2010 2011 2012 2013 2014
(1 000 tonnes)Whole frozen 44.2 40.9 39.7 35.3 41.8 39.9Frozen fillets 114.8 150.8 132.5 168.3 159.9 165.0Fresh fillets 24.4 23.7 20.8 20.7 26.8 25.3total 183.3 215.4 193.0 224.3 228.5 230.2source: nmfs
exportstilapia: china
2009 2010 2011 2012 2013 2014
(1000 tonnes)Frozen whole 33.1 75.7 107.6 111.5 134.6 139.0
Frozen fillets 134.9 186.6 158.1 179.2 182.1 170.3
Prepared 90.0 59.5 63.3 69.8 85.8 92.5
total 258.0 321.8 329.0 360.5 402.5 401.8
(million Usd)Frozen whole 48.2 126.0 202.4 203.4 285.7 310.9
Frozen fillets 444.8 688.6 664.0 702.0 793.2 778.5
Prepared 216.0 189.8 240.3 253.5 368.6 424.2
total 709.0 1 004.4 1 106.7 1 158.9 1 447.5 1 513.6
source: china customs

27Globefish highlights April 2015
In terms of whole frozen tilapia, contrary to the 2012-2013 period, imports into the US market in 2014 declined by almost 2 000 tonnes, while the import value rose by USD 8.6 million. The decline can be attributed to the 30% decline in supplies from Taiwan (Province of China) as well as to the fact that the Philippines exported nearly 90 tonnes less during the period under review. Among the newcomers as exporters to this market are Myanmar and Bangladesh, though they both provided only small volumes. Although China has recently been increasingly
diverting whole frozen tilapia to the African markets, supplies into the US market increased in 2014. Chinese tilapia in Africa is selling at a price which is lower than the domestic production. Meanwhile, frozen fillet import volumes increased from, Myanmar, Mexico and Viet Nam.
EU
According to Eurostat, during 2014, the EU imported 31 126 tonnes of tilapia, an 8.2% decline from 2013. Of that total, 58% was comprised of frozen fillets, 42% of whole frozen and a small volume of fresh fillets. Spain, the Netherlands and the UK showed positive growth for tilapia imports in 2014 compared with the previous year while other EU countries imported less.
China was by far the leading supplier in all product categories. Although China reported lower supplies of frozen categories in 2014 compared with 2013, they supplied 15% more fresh tilapia fillets during this period. The decline in frozen supplies from China was somewhat made up for by other suppliers including Viet Nam, India, Indonesia, Thailand, Taiwan (Province of China) and Bangladesh. These sources accounted for 32% of frozen fillet supplies to the EU. Interestingly, the average import price of frozen tilapia fillets from Taiwan (Province of China) and Indonesia are higher in comparison with other suppliers due to the premium quality.
Although imports of whole frozen tilapia into the EU were down by almost 9.5% in 2014, supplies increased from sources in Asia other than China, namely Thailand, Viet Nam, Indonesia and India. Newcomers included Myanmar and Sri Lanka, which supplied a total of 35 tonnes in 2014.
Asia
Regional production of farmed tilapia was nearly 3.3 million tonnes in 2012 and grew the following year due to affordable prices and rising demand. While most of the supplies entered domestic fresh fish markets, trade also took place between the neighbouring countries. Exports have increased from Indonesia, Thailand and some others countries in South Asia.
Once the world’s largest tilapia exporter, Taiwan’s (Province of China) exports are again on the rise. Taiwan (Province of China) is second to China in whole frozen tilapia exports with 26 233 tonnes more exported in 2014 compared with 2013. Taiwan (Province of China) supplied about 55% of its frozen tilapia (mostly whole products) to the USA and increased exports of whole frozen tilapia to the Middle East, Canada and Australia. In terms of sashimi quality fillets, exports to Japan increased, fetching an average price of USD 10.25 per kg, though the Taiwan (Province of China) market absorbed most of the production.
With the ongoing challenges in the pangasius industry, the Vietnamese government is planning to strengthen
Wholesale Prices of tilapia fillets in the Usa
source: infofish
1.0
1.5
2.0
2.5
3.0
3.5
4.0
4.5
Dec-05 Dec-06 Dec-07 Dec-08 Dec-09 Dec-10 Dec-11 Dec-12 Dec-13 Dec-14 Dec-15
USD/lb
frozen**
fresh*
importsfresh tilapia fillets: Usa
2009 2010 2011 2012 2013 2014
(1 000 tonnes)Honduras 6.5 7.2 8.1 6.3 8.2 9.8
Costa Rica 5.7 5.8 1.7 4.2 6.5 5.2
Colombia 1.6 1.8 2.4 2.6 3.8 4.1
Ecuador 9.1 7.9 7.6 6.6 4.8 2.4
Taiwan PC 0.2 0.2 0.4 0.3 0.7 0.4
El Salvador 0.5 0.3 0.3 0.1 0.4 0.1
Others 0.8 0.5 0.3 0.6 2.4 3.3
total 24.4 23.7 20.8 20.7 26.8 25.3source: nmfs
importsfrozen tilapia fillets: Usa
2009 2010 2011 2012 2013 2014
(1 000 tonnes)China 100.7 135.5 118.7 149.9 143.6 147.7
Indonesia 8.8 10.2 9.2 11.9 11.8 11.6
Thailand 0.7 1.1 1.3 2.4 1.5 1.5
Taiwan PC 2.3 2.2 1.4 1.8 1.5 1.1
Ecuador 1.1 0.6 0.5 0.9 0.7 0.1
Others 1.2 1.1 1.4 1.4 0.8 3.0
total 114.8 150.8 132.5 168.3 159.9 165.0source: nmfs
TILAPIA

28 Globefish highlights April 2015
TILAPIA
large-scale sustainable tilapia production and export in 2015, according to the Vietnam Association of Seafood Exporters and Producers (VASEP). The Directorate of Fisheries envision tilapia farming areas will reach 21 000 ha, with a production of 140 000 tonnes and exports of 50 000 tonnes in 2015. By 2020, the Ministry of Agriculture and Rural Development plans to increase the country’s tilapia pond farming area to 25 000 ha, with a production of 200 000 tonnes and exports of 80 000 tonnes. In the first ten months of 2014, the export value of Vietnamese tilapia was USD 27.359 million, an increase of 180% compared with 2013. VASEP announced that the top ten markets took a share of USD 21.705 million (79.34%), which included the USA (21%), Spain and Colombia.
Tilapia imports into Asian countries are modest as most local production enters the domestic markets. During 2014, approximately 7 000 tonnes were imported into Asia. Hong Kong SAR was the largest importer among Asian countries with a total of 2 514 tonnes of frozen tilapia (whole and fillets). Imports into Japan mainly consisted of izumidai quality (sashimi) tilapia which is supplied by Taiwan (Province of China) as well as imports from the Philippines, most of which is directed to the Filipino community in Japan. Recently, frozen tilapia imports entered new markets, namely Iran, Ukraine and Kazakhstan.
In the Middle East, where total fishery imports were over USD 1 billion, total tilapia imports (comprising whole, breaded and fillets) were estimated to be over 17 000 tonnes for 2014. About 75% of the share was absorbed by Israel followed by the United Arab Emirates, Saudi Arabia, Jordan, Egypt and Kuwait. Africa has emerged as a potential target market by many producers in Asia, particularly India and Viet Nam, as tilapia imports have increased in these markets at attractive prices.
Latin America
The National Aquaculture Association of Honduras (ANDAH) estimates that for 2014, Honduras experienced a 5% increase in overall tilapia exports, with growth taking place in the US and Canadian market. Indeed, fresh tilapia fillet exports from Honduras reached record figures in 2014 with a volume of nearly 10 000 tonnes worth USD 75 million, showing a significant increase compared with the 8 200 tonnes exported in 2013 for a value of USD 65 million.
According to the ANDAH, the domestic market for tilapia is growing, which has resulted in small and medium aquaculture producers moving into farming this species. Tilapia prices in the domestic market vary according to the area of production, type of product and season. During Easter of 2014, tilapia fillets reached a value of USD 2.72 per kg while whole fish sold at USD 1.36 per kg, according to the Honduran Market Information System for Agricultural Products.
In Costa Rica, exports of fresh tilapia fillets to the US market reached a volume of 5 200 tonnes worth USD 42 million in 2014, which is a remarkable decline of almost 25% from 2013, when 6 500 tonnes were exported for a value of USD 54 million.
Outlook
Besides China, production is expected to increase as demand for tilapia remains strong in both major markets and in the domestic market of producing countries. As a result of this strong demand, prices are likely to stay firm.
The 4th International Trade and Technical Conference and Exposition on Tilapia took place from 2 to 4 April 2015 in
Kuala Lumpur, Malaysia. The Conference was organized by INFOFISH, with the collaboration of the Food and Agriculture Organization of the United Nations, the Common Fund for Commodities and the Ministry of Agriculture and Agro-Based Industry of Malaysia.
With a global production close to 7 million MT in 2012, tilapia is indeed looking towards being the fish for the future. Production is increasing significantly beyond the major producers signaling the growing demand. Domestic markets in producing countries are increasingly absorbing more along with higher offer prices. Increased production of farmed tilapia in the major producing countries (China, Egypt, Indonesia, the Philippines, Brazil, Thailand and Bangladesh) supported the rising domestic demand and contributed to national food security programme in 2013. International tilapia trade also grew due to demand from the USA and many non-traditional emerging markets.
TILAPIA 2015 Kuala Lumpur was the fourth in series of highly successful international technical and trade conferences on tilapia: an international forum where internationally renowned speakers addressed issues of relevance to the industry encompassing the industry situation and outlook, production and processing, markets and marketing, technological developments and related issues. More than 300 delegates from the industry, government, academia, as well as potential investors and marketers attended the conference.
The accompanying trade show featured seafood buyers and sellers, farmers, processors and exporters, as well as suppliers of fishing and aquaculture equipment, goods and services, processing equipment, and transport and distribution services.
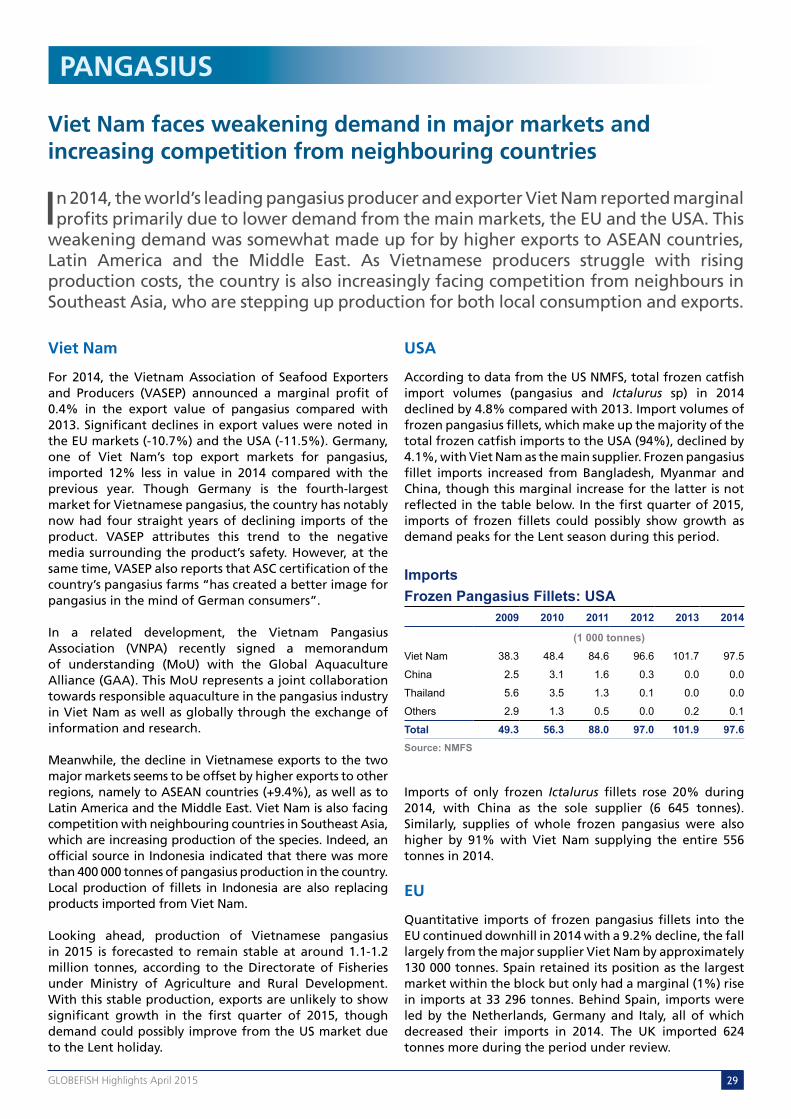
29Globefish highlights April 2015
Viet Nam faces weakening demand in major markets and increasing competition from neighbouring countries
In 2014, the world’s leading pangasius producer and exporter Viet Nam reported marginal profits primarily due to lower demand from the main markets, the EU and the USA. This
weakening demand was somewhat made up for by higher exports to ASEAN countries, Latin America and the Middle East. As Vietnamese producers struggle with rising production costs, the country is also increasingly facing competition from neighbours in Southeast Asia, who are stepping up production for both local consumption and exports.
PANGASIUS
Viet Nam
For 2014, the Vietnam Association of Seafood Exporters and Producers (VASEP) announced a marginal profit of 0.4% in the export value of pangasius compared with 2013. Significant declines in export values were noted in the EU markets (-10.7%) and the USA (-11.5%). Germany, one of Viet Nam’s top export markets for pangasius, imported 12% less in value in 2014 compared with the previous year. Though Germany is the fourth-largest market for Vietnamese pangasius, the country has notably now had four straight years of declining imports of the product. VASEP attributes this trend to the negative media surrounding the product’s safety. However, at the same time, VASEP also reports that ASC certification of the country’s pangasius farms “has created a better image for pangasius in the mind of German consumers”.
In a related development, the Vietnam Pangasius Association (VNPA) recently signed a memorandum of understanding (MoU) with the Global Aquaculture Alliance (GAA). This MoU represents a joint collaboration towards responsible aquaculture in the pangasius industry in Viet Nam as well as globally through the exchange of information and research.
Meanwhile, the decline in Vietnamese exports to the two major markets seems to be offset by higher exports to other regions, namely to ASEAN countries (+9.4%), as well as to Latin America and the Middle East. Viet Nam is also facing competition with neighbouring countries in Southeast Asia, which are increasing production of the species. Indeed, an official source in Indonesia indicated that there was more than 400 000 tonnes of pangasius production in the country. Local production of fillets in Indonesia are also replacing products imported from Viet Nam.
Looking ahead, production of Vietnamese pangasius in 2015 is forecasted to remain stable at around 1.1-1.2 million tonnes, according to the Directorate of Fisheries under Ministry of Agriculture and Rural Development. With this stable production, exports are unlikely to show significant growth in the first quarter of 2015, though demand could possibly improve from the US market due to the Lent holiday.
USA
According to data from the US NMFS, total frozen catfish import volumes (pangasius and Ictalurus sp) in 2014 declined by 4.8% compared with 2013. Import volumes of frozen pangasius fillets, which make up the majority of the total frozen catfish imports to the USA (94%), declined by 4.1%, with Viet Nam as the main supplier. Frozen pangasius fillet imports increased from Bangladesh, Myanmar and China, though this marginal increase for the latter is not reflected in the table below. In the first quarter of 2015, imports of frozen fillets could possibly show growth as demand peaks for the Lent season during this period.
Imports of only frozen Ictalurus fillets rose 20% during 2014, with China as the sole supplier (6 645 tonnes). Similarly, supplies of whole frozen pangasius were also higher by 91% with Viet Nam supplying the entire 556 tonnes in 2014.
EU
Quantitative imports of frozen pangasius fillets into the EU continued downhill in 2014 with a 9.2% decline, the fall largely from the major supplier Viet Nam by approximately 130 000 tonnes. Spain retained its position as the largest market within the block but only had a marginal (1%) rise in imports at 33 296 tonnes. Behind Spain, imports were led by the Netherlands, Germany and Italy, all of which decreased their imports in 2014. The UK imported 624 tonnes more during the period under review.
importsfrozen Pangasius fillets: Usa
2009 2010 2011 2012 2013 2014
(1 000 tonnes)Viet Nam 38.3 48.4 84.6 96.6 101.7 97.5
China 2.5 3.1 1.6 0.3 0.0 0.0
Thailand 5.6 3.5 1.3 0.1 0.0 0.0
Others 2.9 1.3 0.5 0.0 0.2 0.1
total 49.3 56.3 88.0 97.0 101.9 97.6source: nmfs

30 Globefish highlights April 2015
PANGASIUS
In a different trend, imports of whole frozen pangasius into the EU are increasing at a steady pace with 3 244 tonnes imported in 2014, nearly 3% more compared with 2013. The leading suppliers were Viet Nam, Indonesia, Thailand, Myanmar and Bangladesh.
Asia
Pangasius fillets clearly remain a popular product in Asia. According to national statistics, imports of frozen pangasius fillets to namely Singapore, Thailand, China, Malaysia, Taiwan (Province of China), Hong Kong SAR, India, Japan and Republic of Korea, came to an approximate total of 65 000 tonnes, roughly a 16% increase over 2013. Despite rising volumes, average import prices into these markets indicate mixed trends. Though in most Asian markets prices were higher in 2014 than 2013, the average import price of frozen pangasius fillets in Japan was USD 3.35 per kg (-6%), which encouraged 1 317 tonnes more imports during the period. Similarly, lower import prices in India at USD 1.53 per kg (-10.5%) encouraged a 280% increase of frozen pangasius fillet imports, where the product is largely consumed by the hotel and restaurant trade.
Latin America
Latin America appears to have been one of the most lucrative regions for Vietnamese pangasius exporters for the year as the region imported 35% more frozen fillets in 2014 compared with 2013, reaching almost 120 000 tonnes. Notably, all Latin American markets showed positive growth in imports, with Mexico, Brazil and Colombia leading. Despite the suspension of pangasius imports from Viet Nam, Brazil’s imports increased in 2014 compared with the previous year.
Outlook
Official sources from Viet Nam report that production of pangasius is expected to remain stable due to rising production costs coupled with growing competition among producers in the region. Although imports slowed down in the major markets, namely the EU and the USA, demand in the first quarter of 2015 is expected to strengthen in both markets due to demand around the Lent holiday season.
630
806
1114
1332
400
600
800
1000
1200
1400
Carp - whole - live Carp - Fresh, whole, gutted, head-on Carp - Slices, fresh on ice Carp - Fillets, fresh on ice
HUF/kg
CARP - in Europe, origin: Hungary
source: european Price report
B U S I N E S S F O C U S
As reported in SeafoodSource, the unrelenting drive for lower and lower prices, especially
from supermarket buyers, is now being blamed for the noticeable decline in the quality of pangasius products exported from Viet Nam to Europe. Along with the increase in anti-dumping taxes in the USA, these factors have led to a decline in pangasius sales to the two major overseas markets.
Pangasius exporters in Viet Nam have always competed with each other on price. Though there have been numerous attempts by authorities such as the Vietnamese Association of Seafood Exporters and Producers to increase the export price and have exporters agree not to sell below a certain level, the exporters do not follow this agreement, as they want to secure their own individual orders. As a result, the only way to meet the prices stipulated by overseas buyers is for the processors to bind in extra water by tumbling the fillets in chemical solutions prior to freezing and to add excess glaze afterwards, leading to poorer quality fish.
At the North Atlantic Seafood Conference in March, a consultant advising the Nestle-owned French company Davigel, which delivers meals to 10 000 restaurants daily, said the company was now considering whether it should continue to sell pangasius as sales had suffered.
Source: SeafoodSource.com
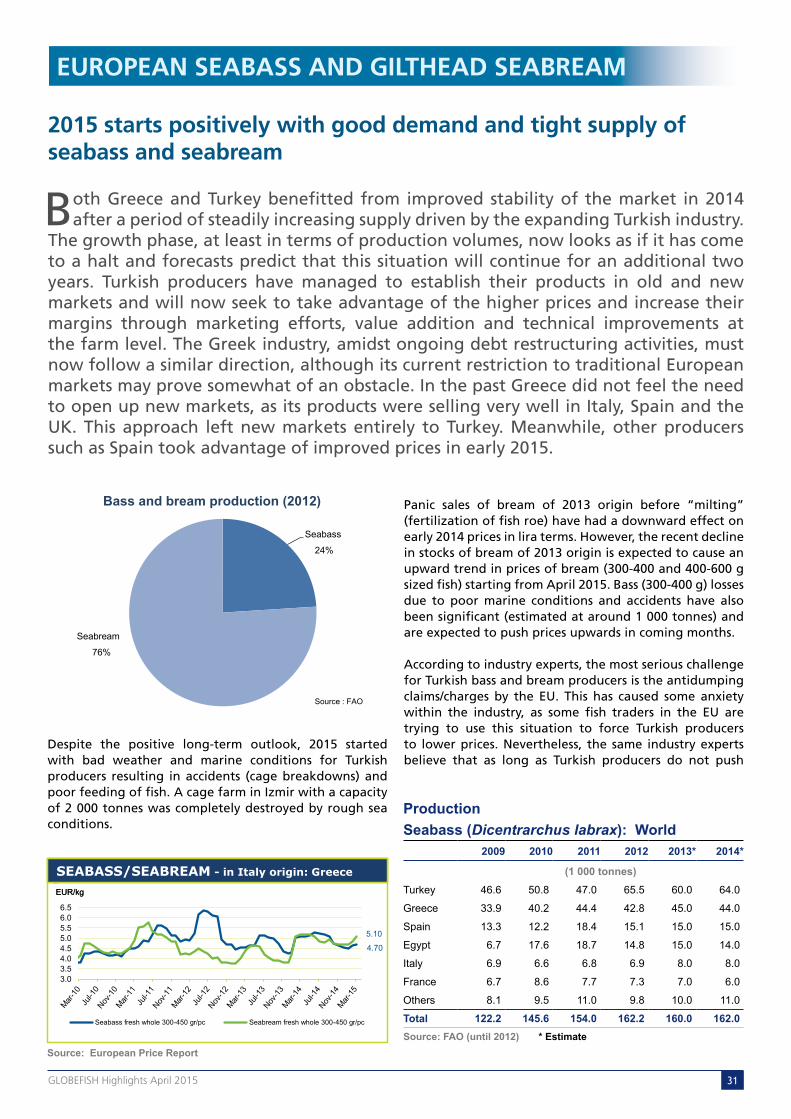
31Globefish highlights April 2015
2015 starts positively with good demand and tight supply of seabass and seabream
Both Greece and Turkey benefitted from improved stability of the market in 2014 after a period of steadily increasing supply driven by the expanding Turkish industry.
The growth phase, at least in terms of production volumes, now looks as if it has come to a halt and forecasts predict that this situation will continue for an additional two years. Turkish producers have managed to establish their products in old and new markets and will now seek to take advantage of the higher prices and increase their margins through marketing efforts, value addition and technical improvements at the farm level. The Greek industry, amidst ongoing debt restructuring activities, must now follow a similar direction, although its current restriction to traditional European markets may prove somewhat of an obstacle. In the past Greece did not feel the need to open up new markets, as its products were selling very well in Italy, Spain and the UK. This approach left new markets entirely to Turkey. Meanwhile, other producers such as Spain took advantage of improved prices in early 2015.
EUROPEAN SEABASS AND GILTHEAD SEABREAM
Despite the positive long-term outlook, 2015 started with bad weather and marine conditions for Turkish producers resulting in accidents (cage breakdowns) and poor feeding of fish. A cage farm in Izmir with a capacity of 2 000 tonnes was completely destroyed by rough sea conditions.
Panic sales of bream of 2013 origin before “milting” (fertilization of fish roe) have had a downward effect on early 2014 prices in lira terms. However, the recent decline in stocks of bream of 2013 origin is expected to cause an upward trend in prices of bream (300-400 and 400-600 g sized fish) starting from April 2015. Bass (300-400 g) losses due to poor marine conditions and accidents have also been significant (estimated at around 1 000 tonnes) and are expected to push prices upwards in coming months.
According to industry experts, the most serious challenge for Turkish bass and bream producers is the antidumping claims/charges by the EU. This has caused some anxiety within the industry, as some fish traders in the EU are trying to use this situation to force Turkish producers to lower prices. Nevertheless, the same industry experts believe that as long as Turkish producers do not push
Seabass
24%
Seabream
76%
bass and bream production (2012)
Source : FAO
5.10
4.70
3.0 3.5 4.0 4.5 5.0 5.5 6.0 6.5
Seabass fresh whole 300-450 gr/pc Seabream fresh whole 300-450 gr/pc
EUR/kg
SEABASS/SEABREAM - in Italy origin: Greece
EUR/kg
SEABASS/SEABREAM - in Italy origin: Greece
source: european Price report
Productionseabass (Dicentrarchus labrax): World
2009 2010 2011 2012 2013* 2014*
(1 000 tonnes)Turkey 46.6 50.8 47.0 65.5 60.0 64.0
Greece 33.9 40.2 44.4 42.8 45.0 44.0
Spain 13.3 12.2 18.4 15.1 15.0 15.0
Egypt 6.7 17.6 18.7 14.8 15.0 14.0
Italy 6.9 6.6 6.8 6.9 8.0 8.0
France 6.7 8.6 7.7 7.3 7.0 6.0
Others 8.1 9.5 11.0 9.8 10.0 11.0
total 122.2 145.6 154.0 162.2 160.0 162.0source: fao (until 2012) * estimate

32 Globefish highlights April 2015
for further capacity expansion, and the present demand levels from Europe and other markets continues strong, bass and bream prices will rise.
Indeed, production plans for hatcheries in 2015 underscore Turkish producers’ determination to level off their production capacities in order to preserve the current supply and demand balance. However, some producers are now turning their attention to other opportunities. According to Undercurrent News, the vertically integrated company Kilic, the largest producer in Turkey, is considering diversification of species and markets as well as exploring the possibility of initiating operations in Central and South America in order to better access the potentially lucrative US market.
Greek farmers and exporters secured higher prices on their major European markets in January 2015 compared with last year, particularly for bream. Export volumes for both species, however, are substantially less. Feed sales were down 15% in the same month, pointing to fewer fish in the pens. The same pattern was reflected in annual
Production seabream (Sparus aurata): World
2009 2010 2011 2012 2013* 2014*
(1 000 tonnes)Greece 60.7 57.4 71.1 72.5 73.0 71.0
Turkey 29.5 29.3 33.0 31.7 45.0 47.0
Spain 24.4 21.4 16.4 17.4 18.0 19.0
Egypt 8.1 17.1 15.9 16.5 17.0 17.0
Italy 5.7 6.6 5.9 6.1 8.0 7.0
Tunisia 2.0 2.8 4.6 6.1 6.0 7.0
Cyprus 2.6 2.8 3.1 3.2 3.0 3.0
Malta 2.0 1.8 1.1 2.6 3.0 3.0
France 1.5 2.6 2.4 2.0 2.0 2.0
Israel 1.1 1.2 1.4 2.1 2.0 2.0
Others 6.6 7.8 6.6 7.8 8.0 9.0
total 144.1 150.8 161.4 167.8 185.0 187.0source: fao (until 2012) * estimate
exportsfresh seabass: greece
2009 2010 2011 2012 2013 2014
(1 000 tonnes)Italy 15.1 18.3 17.2 16.7 15.3 17.5
Portugal 2.2 2.6 2.2 2.5 2.6 2.6
France 3.3 3.8 3.9 3.3 2.8 2.4
Spain 3.6 4.7 3.8 3.1 3.6 2.3
UK 2.3 3.3 3.2 2.4 2.0 1.5
Others 3.0 4.2 5.1 3.6 3.3 2.8
total 29.5 36.9 35.4 31.6 29.6 29.1source: eUrostat
exportsfresh seabream: greece
2009 2010 2011 2012 2013 2014
(1 000 tonnes)Italy 28.4 26.5 20.5 21.6 21.7 20.4
Spain 9.2 8.7 7.7 8.4 10.1 9.4
France 6.8 6.7 6.1 6.2 6.1 5.9
Portugal 3.4 3.2 4.0 4.4 4.9 4.7
Germany 3.0 2.2 2.0 2.4 2.5 2.2
Netherlands 1.2 1.2 1.0 1.1 1.1 1.0
UK 1.8 1.7 1.9 2.1 1.2 1.0
Others 3.0 2.8 2.2 2.8 4.7 2.9
total 56.8 53.0 45.4 49.0 52.3 47.5
source: eUrostat
exportsfresh seabass: turkey
2009 2010 2011 2012 2013 2014
(1 000 tonnes)Netherlands 2.2 2.0 1.7 1.4 3.7 4.3
Italy 4.4 2.3 1.7 2.3 2.7 3.8
Russian Fed. 0.2 0.6 1.4 1.1 2.5 3.7
Spain 2.5 2.3 2.0 0.8 2.0 2.6
UK 0.6 0.4 0.6 1.0 1.4 2.2
USA 0.0 0.2 0.1 0.2 0.8 1.9
Lebanon 1.0 1.5 1.1 0.6 1.0 1.3
Others 3.4 2.2 1.4 0.9 2.2 1.7
total 14.3 11.5 10.0 8.3 16.3 21.5source: state institute of statistics
exportsfresh seabream: turkey
2009 2010 2011 2012 2013 2014
(1 000 tonnes)Russian Fed. 0.3 0.6 1.4 1.9 2.6 3.9
Netherlands 1.1 1.0 1.0 1.5 2.9 3.7
Italy 2.0 2.1 1.6 2.6 2.6 3.6
Spain 0.5 0.4 1.9 1.7 1.5 3.5
Lebanon 2.0 2.1 1.9 1.7 3.4 3.3
United Arab Emitates 0.2 0.2 0.2 0.5 0.8 1.4
UK 0.2 0.3 0.5 0.6 0.7 1.3
Others 1.1 0.8 1.1 1.6 3.6 3.3
total 7.4 7.5 9.6 12.1 18.1 24.0source : state institute of statistics
EUROPEAN SEABASS AND GILTHEAD SEABREAM
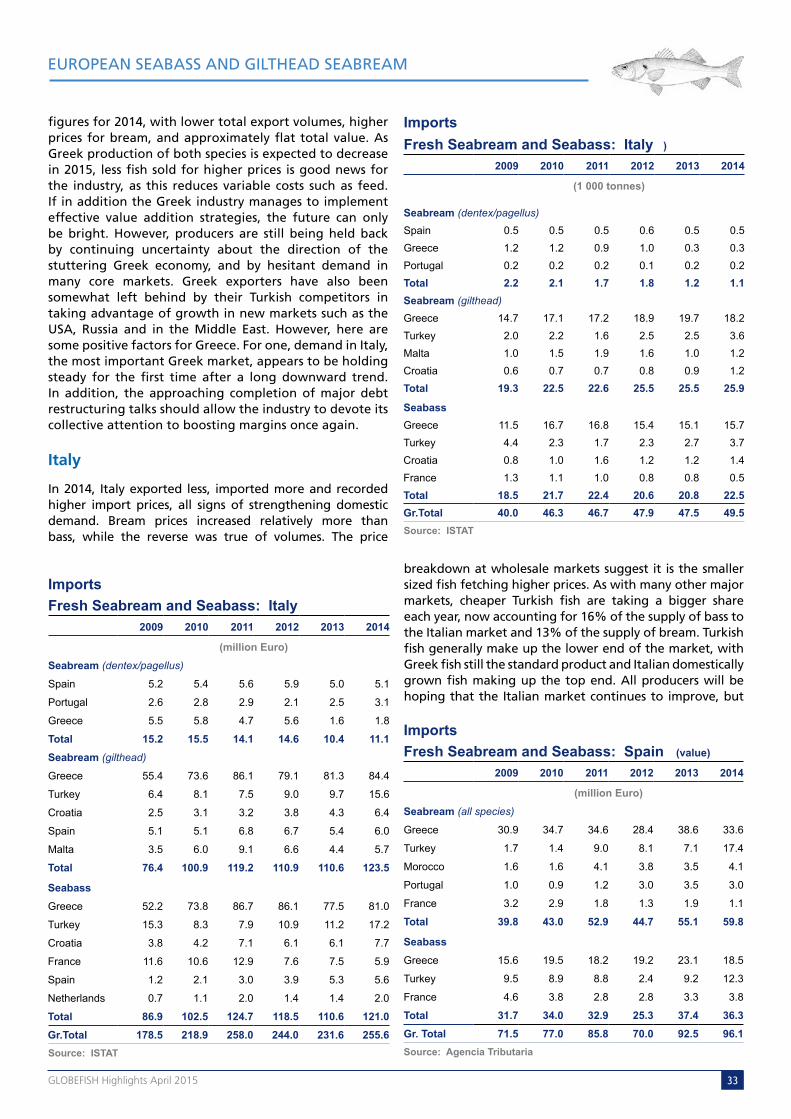
33Globefish highlights April 2015
EUROPEAN SEABASS AND GILTHEAD SEABREAM
figures for 2014, with lower total export volumes, higher prices for bream, and approximately flat total value. As Greek production of both species is expected to decrease in 2015, less fish sold for higher prices is good news for the industry, as this reduces variable costs such as feed. If in addition the Greek industry manages to implement effective value addition strategies, the future can only be bright. However, producers are still being held back by continuing uncertainty about the direction of the stuttering Greek economy, and by hesitant demand in many core markets. Greek exporters have also been somewhat left behind by their Turkish competitors in taking advantage of growth in new markets such as the USA, Russia and in the Middle East. However, here are some positive factors for Greece. For one, demand in Italy, the most important Greek market, appears to be holding steady for the first time after a long downward trend. In addition, the approaching completion of major debt restructuring talks should allow the industry to devote its collective attention to boosting margins once again.
Italy
In 2014, Italy exported less, imported more and recorded higher import prices, all signs of strengthening domestic demand. Bream prices increased relatively more than bass, while the reverse was true of volumes. The price
breakdown at wholesale markets suggest it is the smaller sized fish fetching higher prices. As with many other major markets, cheaper Turkish fish are taking a bigger share each year, now accounting for 16% of the supply of bass to the Italian market and 13% of the supply of bream. Turkish fish generally make up the lower end of the market, with Greek fish still the standard product and Italian domestically grown fish making up the top end. All producers will be hoping that the Italian market continues to improve, but
importsfresh seabream and seabass: italy
2009 2010 2011 2012 2013 2014
(million euro)seabream (dentex/pagellus)
Spain 5.2 5.4 5.6 5.9 5.0 5.1
Portugal 2.6 2.8 2.9 2.1 2.5 3.1
Greece 5.5 5.8 4.7 5.6 1.6 1.8
total 15.2 15.5 14.1 14.6 10.4 11.1seabream (gilthead)
Greece 55.4 73.6 86.1 79.1 81.3 84.4
Turkey 6.4 8.1 7.5 9.0 9.7 15.6
Croatia 2.5 3.1 3.2 3.8 4.3 6.4
Spain 5.1 5.1 6.8 6.7 5.4 6.0
Malta 3.5 6.0 9.1 6.6 4.4 5.7
total 76.4 100.9 119.2 110.9 110.6 123.5
seabassGreece 52.2 73.8 86.7 86.1 77.5 81.0
Turkey 15.3 8.3 7.9 10.9 11.2 17.2
Croatia 3.8 4.2 7.1 6.1 6.1 7.7
France 11.6 10.6 12.9 7.6 7.5 5.9
Spain 1.2 2.1 3.0 3.9 5.3 5.6
Netherlands 0.7 1.1 2.0 1.4 1.4 2.0
total 86.9 102.5 124.7 118.5 110.6 121.0gr.total 178.5 218.9 258.0 244.0 231.6 255.6source: istat
importsfresh seabream and seabass: italy )
2009 2010 2011 2012 2013 2014
(1 000 tonnes)
seabream (dentex/pagellus)Spain 0.5 0.5 0.5 0.6 0.5 0.5Greece 1.2 1.2 0.9 1.0 0.3 0.3Portugal 0.2 0.2 0.2 0.1 0.2 0.2total 2.2 2.1 1.7 1.8 1.2 1.1seabream (gilthead)Greece 14.7 17.1 17.2 18.9 19.7 18.2Turkey 2.0 2.2 1.6 2.5 2.5 3.6Malta 1.0 1.5 1.9 1.6 1.0 1.2Croatia 0.6 0.7 0.7 0.8 0.9 1.2total 19.3 22.5 22.6 25.5 25.5 25.9
seabassGreece 11.5 16.7 16.8 15.4 15.1 15.7Turkey 4.4 2.3 1.7 2.3 2.7 3.7Croatia 0.8 1.0 1.6 1.2 1.2 1.4France 1.3 1.1 1.0 0.8 0.8 0.5total 18.5 21.7 22.4 20.6 20.8 22.5gr.total 40.0 46.3 46.7 47.9 47.5 49.5source: istat
importsfresh seabream and seabass: spain (value)
2009 2010 2011 2012 2013 2014
(million euro)seabream (all species)
Greece 30.9 34.7 34.6 28.4 38.6 33.6
Turkey 1.7 1.4 9.0 8.1 7.1 17.4
Morocco 1.6 1.6 4.1 3.8 3.5 4.1
Portugal 1.0 0.9 1.2 3.0 3.5 3.0
France 3.2 2.9 1.8 1.3 1.9 1.1
total 39.8 43.0 52.9 44.7 55.1 59.8
seabassGreece 15.6 19.5 18.2 19.2 23.1 18.5
Turkey 9.5 8.9 8.8 2.4 9.2 12.3
France 4.6 3.8 2.8 2.8 3.3 3.8
total 31.7 34.0 32.9 25.3 37.4 36.3gr. total 71.5 77.0 85.8 70.0 92.5 96.1source: agencia tributaria

34 Globefish highlights April 2015
2014 was kept approximately at the same level as in 2013, reaching 7 850 tonnes (-1%). Bass was responsible for 49%, and bream for 51% of the total import volume.
Supplies of bass and bream from Greece, Cyprus, France and Spain drastically dropped due to the import restrictions
lowered forecasted growth compared with the rest of the EU will introduce some concern as to whether high prices can be sustained in the long term.
Spain
Spain is another market where there is a clear divergence between bream and bass prices, with bass prices down at wholesale markets so far this year and bream prices marginally up. Again, the price increase is particularly evident for the smaller fish sizes. Like Italy, Spain imported more fish in 2014 and exported less. Another clear trend is the convergence of Turkish prices, which are increasing, with those of Greek product, which are remaining approximately stable. Spanish exports of both farmed bass and farmed bream, directed primarily to the Portuguese and French markets, are being sold at higher prices as supply from other sourced contracts.
France
The French market has a tendency not to follow prevailing trends, and is generally averse to cheaper Turkish fish. As a result, the reduced Greek supply has led to price increases for imported fish that has filtered down to the retail level. Meanwhile, domestic farmed and wild fish are increasingly being diverted to the domestic market and promotional efforts are focusing on French-origin product.
Russia
The effect of the food embargo, which was introduced in August 2014, enhanced the principal position of Turkey as the top supplying country of bass and bream to Russia. According to data from the Russian Federal State Customs, the Russian import volume of fresh bass and bream in
importsfresh seabream and seabass: france (Quantity)
2009 2010 2011 2012 2013 2014
(1 000 tonnes)seabream (dentex/pagellus)
Spain 0.5 0.5 0.7 0.5 0.3 0.3
Greece 0.5 0.7 0.9 0.3 0.1 0.2
total 1.4 1.6 2.0 1.0 0.6 0.8seabream (gilthead)
Greece 5.2 4.6 4.7 4.4 6.1 5.2
Spain 1.9 1.4 1.0 2.3 2.8 2.5
Turkey 0.1 0.2 0.2 0.4 0.5 0.5
total 7.4 6.9 6.0 7.3 10.0 9.1
seabassGreece 3.1 3.5 3.8 2.7 3.0 2.1
Spain 0.4 0.7 0.8 1.0 1.4 1.0
total 4.8 5.3 5.4 4.8 5.9 4.7gr. total 13.6 13.8 13.4 13.1 16.5 14.6source: direction nationale des statistiques du commerce extérieur – dnsce
importsfresh seabream and seabass: france (value)
2009 2010 2011 2012 2013 2014
(million euro)seabream (dentex/pagellus)
Spain 1.7 1.8 3.1 1.9 1.3 1.3
Greece 2.2 3.0 5.1 1.7 0.5 0.7
total 5.3 6.4 9.9 4.1 2.4 3.3seabream (gilthead)
Greece 18.9 20.6 23.7 20.8 21.8 21.6
Spain 7.2 6.7 5.2 11.6 12.6 10.6
Turkey 0.4 0.6 1.0 1.6 2.1 2.2
total 27.6 30.5 31.5 35.2 39.6 39.2
seabassGreece 14.1 17.2 20.6 16.5 13.4 11.7
Spain 1.8 3.8 4.9 6.9 8.8 6.6
Netherlands 1.8 2.0 1.7 1.7 2.2 2.9
UK 1.8 2.1 2.3 2.0 2.4 2.8
Turkey 2.1 1.2 1.4 1.6 2.5 1.8
total 23.6 28.1 32.3 31.1 32.1 29.6gr. total 56.5 65.0 73.7 70.4 74.1 72.1source: direction nationale des statistiques du commerce extérieur – dnsce
importsfresh seabream and seabass: spain (Quantity)
2009 2010 2011 2012 2013 2014
(1 000 tonnes)seabream (all species)
Greece 8.5 8.2 6.7 6.4 8.2 7.1
Turkey 0.5 0.4 1.9 2.1 1.8 3.8
Morocco 0.4 0.3 0.4 0.4 0.4 0.4
Portugal 0.2 0.2 0.2 0.3 0.3 0.2
France 0.4 0.3 0.2 0.1 0.1 0.1
total 10.2 9.7 9.9 9.2 11.0 11.7
seabassGreece 3.6 4.6 3.5 3.9 4.9 4.1
Turkey 2.5 2.4 1.9 0.6 2.2 2.7
France 0.4 0.4 0.3 0.3 0.7 1.9
total 6.9 7.5 6.1 4.8 8.1 8.8gr. total 17.1 17.2 16.0 14.0 19.1 20.5source: agencia tributaria
EUROPEAN SEABASS AND GILTHEAD SEABREAM

35Globefish highlights April 2015
EUROPEAN SEABASS AND GILTHEAD SEABREAM
from those countries. In contrast, Russian import of bass from Turkey went up 39% reaching 3 815 tonnes and import of bream went up 50% to 4 027 tonnes in 2014, compared with the year before. While Turkish-origin fish accounted for 64% in 2013, in 2014 this notably increased to 94%. Russian imports of frozen bass and bream are also following an upward trend. In 2014, Russia imported 300 tonnes of frozen bass and 344 tonnes of frozen bream from Turkey.
Other markets
The US market for bass continues to grow, with Turkey rapidly catching up with Greece in terms of supply share. The UK market is also sourcing increasing amounts of product from Turkey, although it has sharply decreased total import volumes in response to higher prices. In Germany, where demand appears to be good, the same trend can be observed, with Turkey supplying almost as much bream as Greece to the market in 2014.
Outlook
The negative growth in harvest volumes in the major supplying countries, Greece and Turkey, forecasts that relatively higher prices should continue in 2015, although the main driver of demand growth can be expected to come from new markets. As in the past Turkey has been more successful in securing a share in these new markets, it is the Turkish industry that is more optimistic in the medium term. However, it is clear that the sector as a whole must now focus on alternative strategies, on both the production and marketing side, to add value and drive down costs. Meanwhile, the significant decrease in projected bream production could see the divergent trend between relatively higher bream prices and lower bass prices continue, which might present additional challenges for suppliers and buyers alike.
importsfresh seabream and seabass: germany
Jan-sep
2009 2010 2011 2012 2013 2014
(1 000 tonnes)seabream(dentex/pagellus)
Greece 0.3 0.4 0.3 0.3 0.3 0.4
total 0.4 0.5 0.3 0.4 0.4 0.5seabream(gilthead)
Turkey 0.1 0.0 0.1 0.3 0.9 1.0
Greece 0.5 0.7 0.6 1.0 0.9 0.6
Italy 0.1 0.1 0.1 0.1 0.2 0.5
total 1.0 1.1 1.0 1.5 2.7 2.7
seabassGreece 0.2 0.4 0.4 0.5 0.5 0.3
Italy 0.1 0.2 0.3 0.1 0.1 0.2
France 0.1 0.1 0.1 0.1 0.1 0.1
total 0.6 0.8 1.0 1.2 1.8 1.8gr.total 2.0 2.4 2.3 3.1 4.9 5.0source: germany customs
importsfresh seabass: Uk
2009 2010 2011 2012 2013 2014
(1 000 tonnes)Netherlands 1.4 2.0 1.5 1.4 2.6 2.9
Greece 1.9 3.4 4.1 5.0 4.7 1.6
Turkey 0.3 0.0 0.0 0.1 0.7 1.0
Germany 0.1 0.0 0.0 0.6 0.6 0.5
Others 1.3 1.0 1.6 1.0 0.8 0.7
total 5.0 6.4 7.2 8.1 9.4 6.7source : her majesty’s revenue & customs
7.13 7.25
4.0 5.0 6.0 7.0 8.0 9.0
10.0
1000-2000 gr/pc fresh whole 2000-4000
EUR/kg
MEAGRE - in Italy, origin: Egypt
source: european Price report
importsfresh seabream: Uk
2009 2010 2011 2012 2013 2014
(1 000 tonnes)Greece 1.0 1.1 1.5 3.7 3.0 1.6
Netherlands 0.5 0.6 0.5 0.5 0.8 0.6
Turkey 0.1 0.0 0.1 0.1 0.2 0.6
Germany 0.1 0.0 0.0 0.2 0.3 0.3
Others 0.5 0.7 0.8 0.5 0.3 0.4
total 2.2 2.4 2.9 5.0 4.6 3.5source: her majesty’s revenue & customs

36 Globefish highlights April 2015
Future looking bright despite Russian ban, however biological challenges pushing up costs
After successfully navigating some potentially treacherous market conditions following the Russian ban in August last year, the Norwegian farmed salmon industry will now look
to capitalize on what are still relatively high prices supported by a global salmon production growth slowdown in 2015. Norway is once again leading the way in terms of production growth, with Chilean producers expected to register negative growth over the next two years at least, as they seek to ensure that the improving biological situation continues.
SALMON
This will be the first drop in Chilean production since the ISA outbreak in 2010, which signals a new phase in the industry’s development. Consolidation is continuing with a number of major mergers and acquisition possibilities being considered, while profit margins are beginning to converge with those of Norwegian farmers. This latter trend is largely the result of relatively better management of sea lice on Chilean farms, improved overall productivity growth and better access to markets such as the Russian Federation and China in addition to their main markets of the USA and Brazil.
Meanwhile, in the wild salmon market, there is expected to be an overall increase in catches of wild Pacific salmon species in Eastern Russia and Alaska. The pink salmon harvest, in particular, is returning to normal levels after a weak 2013. Meanwhile, sockeye harvests are also expected to be well above the norm, with the Bristol Bay total figure forecast to be the third highest since 1960.
Prices
Prices for Norwegian fresh whole Atlantics in the first quarter 2015 have languished somewhat below last year’s levels for the same period, after peaking around Christmas. Although the krone is currently substantially weaker than the euro compared with the exchange rate last year, there are a number of other contributing factors to this development. One is that relatively higher
seawater temperatures in 2015 are boosting growth rates and pushing against biomass ceilings, which in turn means more fish must be harvested. This necessity is growing more pronounced as the end of a temporary increase in biomass limits was set to end on 1 April. There is also the continued absence of the Russian market which traditionally absorbs a lot of early year volumes. More recently, China also introduced a ban on salmon imports from three Norwegian counties, citing disease concerns.
Short-term future price expectations are also suffering, with Fish Pool forward contracts over the next three months being driven steadily down. Despite these low expectations, the estimated minimum price at the end of August is still around the NOK 37 per kg mark. For Chilean salmon, the current trend is similar, with fresh fillet prices in the USA somewhat below last year’s level as the US market is facing more plentiful supply and Brazilian economic conditions
Atlantic salmon69%
Pink(=Humpback)
salmon14%
Chum(Keta=Dog) salmon
6%
Coho (=Silver) salmon
6%
Sockeye(=Red) salmon
5%
salmon production (farmed and wild) by species (2012)
Source: FAO
Productionfarmed salmon: World
2009 2010 2011 2012 2013* 2014* 2015* 2016*
(1 000 tonnes)
atlantic salmonNorway 863 940 1 065 1 232 1 200 1 250 1 250 1 310
Chile 233 123 264 400 490 620 600 630
UK 133 155 158 163 165 165 170 170
Canada 100 101 102 108 120 125 135 140
Faeroe Islands 51 45 60 77 80 85 88 88
Australia 30 32 35 44 44 44 44 44
Ireland 12 16 12 12 15 16 17 18
USA 14 20 19 19 20 22 22 22
Others 3 6 10 12 12 12 12 12
total 1 440 1 438 1 726 2 067 2 146 2 187 2 338 2 434
Pacific salmonChile 158 123 161 164 140 130 170 175
New Zealand 12 13 14 12 12 13 13 13
Japan 16 15 0 10 8 8 8 8
total 186 151 175 186 160 136 191 196gr. total 1 626 1 589 1 901 2 252 2 306 2 323 2 529 2 630source: fao (until 2012) * estimate

37Globefish highlights April 2015
are currently depressing demand. For frozen Coho on the Japanese market, yen import prices are approximately the same as last year, although volumes are higher.
Norway
SalmonBiomass in Norwegian farms in the first two months of 2015 were above those in 2014, as were export volumes. However, with prices down compared with last year, overall export value in NOK terms were approximately flat. Though the krone has recovered slightly versus the euro in the last few months, it is still weaker than last year, a positive for Norwegian exporters that has prevented a further drop in NOK prices. Exchange rate development versus the US dollar has been even more favourable, allowing Norway to direct more volumes to the already well-supplied US market with only a slight drop in prices.
In terms of annual figures for 2014, export performance was impressive, particularly given the Russian embargo that has been in force since August. Total Norwegian salmon export volume for 2014 was 4% higher than in 2013, according to the Norwegian Seafood Council (NSC), with a slight increase in the average export price for fresh whole salmon at NOK 41 per kg. However, as a result of their exclusion from the Russian market, 11% more salmon was exported to the EU, for a total of 720 000 tonnes.
As was expected, this had a negative impact on prices, although the exchange rate trend and ample demand, in particular for fresh and frozen fillets, ensured the impact was minimal. Poland and France remain the top two export destinations for Norwegian salmon.
Looking at other markets, there was an inevitable drop in Norwegian exports to Eastern Europe in 2014, by some 37% in value terms. In addition to the Russian ban, the Ukrainian market is also affected by continuing political and economic instability in the region. The lack of opportunities in this region, however, were compensated for by booming demand in the USA and Asia. According to the NSC, Norway exported 9 000 more tonnes of Atlantic salmon to the USA in 2014, at high prices. These exports consisted of approximately 37% frozen fillets and 30% fresh fillets. In Asia, a similar trend was observed, with notable increases in volumes to Israel, Hong Kong SAR and Republic of Korea.
The specific challenges facing the Norwegian salmon industry were discussed by key figures in the industry at the North Atlantic Seafood Council in Bergen at the beginning of March. Generally, it was acknowledged that the basic drivers for strong future growth are in place, but certain obstacles must be overcome if the full potential of the industry is to be realized. Well-known issues having to do with shifting regulatory frameworks were raised, as were the physical limits to expansion. Another major concern is sea lice. Although numbers are slightly down at the beginning of 2015, in the longer term sea lice
4.68
2.0
3.0
4.0
5.0
6.0
7.0
Fresh, gutted, head-on, 3-6 kg/pc
EUR/kg
SALMON - in France, origin: Norway
source: european Price report
exports (quantity)salmon and trout: norway
2009 2010 2011 2012 2013 2014
(1 000 tonnes)salmon 709.9 782.5 837.6 994.9 956.5 1 004.3Fresh 570.4 618.0 685.4 828.9 796.3 831.3
Frozen 44.0 50.6 50.9 50.4 44.6 45.5
Fresh fillet 57.1 66.9 55.2 66.8 69.2 77.3
Froz. Fillet 36.3 44.7 44.3 46.7 44.4 48.0
trout 40.1 26.4 27.1 55.6 54.4 49.7source: norwegian seafood council
exports (value)salmon and trout: norway
2009 2010 2011 2012 2013 2014
(bill. nok)salmon 23.6 31.2 29.1 29.5 39.6 44.0Fresh 17.5 23.2 21.9 22.9 31.6 34.1
Frozen 1.2 1.6 1.6 1.2 1.4 1.5
Fresh fillet 2.7 3.7 2.9 2.9 3.8 4.7
Froz. Fillet 1.9 2.5 2.5 2.4 2.6 3.4
trout 1.2 1.1 0.9 1.7 2.2 2.2source: norwegian seafood council
SALMON
Salmon Fillet Prices (FOB Miami, Chilled, C-trim, Alt. fresh, 3-4 lbs)
source: Urner barry’s seafood Price
2.00
2.50
3.00
3.50
4.00
4.50
5.00
5.50
6.00
Mar-07 Mar-08 Mar-09 Mar-10 Mar-11 M ar-12 Mar-13 Mar-14 Mar-15
USD/lb

38 Globefish highlights April 2015
continues to cause problems for farms in Norway, and treatment pushes up costs. Alternative (non-medicinal) treatments were discussed, such as cleaner wrasse stocking, pen design and offshore locations, but further R&D investment is needed.
Trout
The first and second half of 2014 were sharply contrasting in the Norwegian trout industry. Good performance up until the Russian ban in August pushed up overall figures for the year and the NSC reports approximately flat total export value for the year compared with 2013, with a 4% increase in the average price for fresh whole trout. Following the removal of the Russian market, however, volumes dropped significantly and prices also fell. Despite increased volumes to alternative markets like Belarus and Japan, this trend has continued into 2015.
ChileIn 2014, the Chilean salmon and trout industry exceeded USD 4 billion in export value for the first time in history (USD 4 363.3 million according to InfoTrade). This figure represents an increase of 24.2% compared to USD 3 513.2
exports (value) salmon and trout: chile
2009 2010 2011 2012 2013 2014
(million Usd)Japan 825 909 1 260 1 140 833 1 050
USA 554 448 721 807 1 144 1 383
EU (25) 160 72 121 111 218 249
Lat.America 290 347 427 452 658 759
Others 273 285 497 383 660 922
total 2 101 2 060 3 026 1 753 3 513 4 363source: boletín de exportaciones del ifoP
exports (unit value)salmon and trout: chile
2009 2010 2011 2012 2013 2014
(in Usd/kg) salmon 5.58 6.78 7.29 5.24 6.59 7.46 Frozen 5.09 5.97 6.73 5.23 5.80 7.13
Fresh 6.68 8.30 8.10 5.94 7.77 7.86
Canned 6.68 8.14 11.22 9.83 9.12 10.35
Salted 5.53 6.31 7.10 6.47 4.12 7.44
Smoked 13.00 14.31 15.74 13.61 16.18 17.81
trout 6.00 7.15 8.20 6.32 6.88 9.30 Frozen 5.71 6.92 7.94 5.97 6.42 8.75
Fresh 7.13 7.91 8.87 7.61 9.09 11.55
Canned 7.34 9.27 11.12 0.00 0.00 0.00
Salted 5.67 6.23 7.28 6.68 5.99 6.83
Smoked 11.98 12.81 14.94 14.59 14.72 19.67
average 5.69 6.94 7.59 5.78 6.65 7.70source: boletín de exportaciones del ifoP
exports (value)salmon and trout: chile
2009 2010 2011 2012 2013 2014
(million Usd)salmon 1 506.9 1 158.6 1 890.7 2 001.0 2 752.9 3 662.5 Frozen 996.9 691.1 1 138.4 1 133.0 1 510.0 2 163.2
Fresh 436.4 407.8 656.2 800.7 1 178.6 1 442.2
Canned 17.8 9.0 6.1 7.0 10.2 9.8
Salted 20.6 14.9 37.5 15.3 7.0 5.5
Smoked 35.3 35.9 52.4 45.3 47.1 41.8
trout 594.5 902.3 1 065.6 892.0 760.2 700.8 Frozen 503.8 743.7 898.0 754.4 623.4 567.3
Fresh 42.0 100.6 85.4 61.9 69.4 76.8
Canned 1.0 0.6 0.2 0.0 0.0 0.0
Salted 8.4 18.5 26.2 18.1 12.3 10.4
Smoked 39.4 38.9 55.7 58.3 55.1 46.2
total 2 101.0 2 061.0 2 956.0 2 893.0 3 513.2 4 363.3source: boletín de exportaciones del ifoP
exports (quantity)salmon and trout: chile
2009 2010 2011 2012 2013 2014
(1 000 tonnes)salmon 270.2 170.9 259.2 347.3 417.6 491.1 Frozen 195.7 115.8 169.1 208.8 260.2 303.5
Fresh 65.3 49.1 81.0 132.2 151.7 183.6
Canned 2.7 1.1 0.5 0.8 1.1 0.9
Salted 3.7 2.4 5.3 2.4 1.7 0.7
Smoked 2.7 2.5 3.3 3.1 2.9 2.3
trout 99.1 126.2 130.0 141.0 110.5 75.3 Frozen 88.3 107.4 113.0 126.3 97.0 64.8
Fresh 5.9 12.7 9.6 8.1 7.6 6.6
Canned 0.1 0.1 0.0 0.0 0.0 0.0
Salted 1.5 3.0 3.6 2.7 2.1 1.5
Smoked 3.3 3.0 3.7 3.9 3.7 2.4
total 369.2 297.2 389.3 488.3 528.1 566.5source: boletín de exportaciones del ifoP
2.90 2.70
1.5
2.0
2.5
3.0
3.5
Trout: Salmo spp Rainbow Trout: Oncorhynchus mykiss
EUR/kg
TROUT - Ex-farm prices in Italy
source: european Price report
SALMON

39Globefish highlights April 2015
SALMON
million registered in 2013. In terms of volume, 566 500 tonnes were shipped in 2014, which represents an increase of 7.3% compared with 528 100 tonnes exported in 2013.
Over 800 000 tonnes of salmon and trout were harvested, and according to the National Fisheries and Aquaculture, this figure represents 96% of the joint Chilean production of Atlantic salmon, rainbow trout and coho salmon.
In terms of Atlantic salmon, there was an increase in harvest weights and performance, and a decrease in mortality. Meanwhile, coho salmon saw a slight increase in harvest weights and performance while for rainbow trout, although there was a decrease in mortality, this occurred in conjunction with a decrease in harvest weights and performance. Thus, the challenge for the coming years is to improve production indicators of rainbow trout.
Meanwhile, the Director of the National Fisheries Service (Sernapesca), José Miguel Burgos, categorically said to Aqua.cl that “2014 was one of the best in the last five years for sanitary conditions”. During 2014, Atlantic salmon were in healthy condition while for trout, improvements were lower. Burgos said that there is a consolidated model to control the ISA virus, although some cases were recorded during 2014. Mortality did not exceed 1.5 million salmon where total salmon in water exceeded 150 million.
In economic terms, the President of the Association of Chilean Salmon Industry AG (SalmonChile), Felipe Sandoval, explained to the same Chilean website that while the rise in dollars benefits exports, it also increases the value of their operational costs because the industry is “dollarized”. Sandoval added that “although the price factor of the US currency is important to the industry’s utilities, the fact that most influences is the final value of salmon”.
Currently, the salmon industry is progressing in implementing long-term health strategies for production. Companies are actively participating in the development of research and technology to strengthen their decisions, as well as the transfer of such knowledge. To Alfredo Tello, Analyst of the Technological Institute of Salmon of SalmonChile, the speed and effectiveness with which they incorporate these new strategies into their production
model will largely determine how quickly and effectively the industry will become sustainable.
UkScottish farmed salmon is in high demand in big markets, and 2014 was another growth year following on significant expansion of their export industry in 2013. Good demand from the USA has driven this growth over recent years, although demand in France for quality certified Scottish salmon (Label Rouge) has also been bouncing back. China is another destination that is steadily growing in importance, and Scottish industry representatives have emphasized the key role of Asian markets in future development. In January 2015, however, UK exports were substantially down, primarily because the USA had increased fresh whole Atlantic imports from Canada and Norway.
Domestic demand for salmon is also good in the UK, particularly for fresh salmon. According to consumer research firm Nielsen, total retail sales for 2014 came to 54 300 tonnes worth GBP 862 million, up 2.8% and 5.4% from the previous year respectively. Large mid-range food retail chains account for the vast majority of sales.
exportssalmon: Uk (by product and country)
2009 2010 2011 2012 2013 2014
(1 000 tonnes)
freshUSA 21.1 25.4 31.3 31.2 38.4 41.4France 17.5 21.4 18.4 18.9 17.7 25.2China 0.0 0.0 3.7 6.1 9.5 13.4Ireland 3.2 2.5 3.3 4.0 4.3 5.8Poland 1.2 2.7 6.4 7.6 6.8 4.6Germany 1.9 1.9 1.4 1.0 0.8 1.2Others 5.5 6.2 6.3 9.6 14.6 11.5total 50.4 60.1 70.7 78.3 92.2 103.1
Fresh filletsIreland 1.6 1.3 1.6 2.0 1.6 1.5USA 1.6 1.8 5.8 0.6 0.1 1.0France 1.6 1.8 1.1 1.1 1.1 0.9Germany 0.3 0.2 0.4 0.7 0.5 0.6Belgium 0.6 0.7 0.8 1.7 0.9 0.6Others 0.5 2.0 1.8 1.2 2.2 1.9total 6.2 7.8 11.5 7.3 6.4 6.5
frozenUkraine 0.0 0.0 0.1 0.8 1.3 1.8France 1.2 2.4 1.5 1.3 1.4 1.6Estonia 0.0 0.1 0.3 0.6 0.8 1.0Russian Fed. 1.2 2.2 1.7 2.8 1.1 0.6Others 5.7 1.7 2.3 2.4 1.9 2.4total 8.1 6.4 5.9 7.9 6.5 7.4
other salmontotal 7.4 9.2 9.0 8.1 7.8 8.1gr. total 72.1 83.5 97.1 101.6 112.9 125.1source: her majesty’s revenue & customs
exports (quantity)salmon and trout: chile
2009 2010 2011 2012 2013 2014
(1 000 tonnes)Japan 152.6 144.0 175.0 195.0 147.3 140.1
USA 68.8 45.2 68.7 105.0 124.3 138.4
EU (25) 25.5 8.7 13.0 18.0 32.8 31.3
Lat.America 57.4 50.6 60.0 87.0 101.3 111.2
Others 64.9 48.6 72.0 83.0 122.4 145.5
total 369.2 297.2 388.7 488.0 528.1 566.5source: ifoP

40 Globefish highlights April 2015
Markets
In the weeks following the Russian ban, Chilean salmon exporters seized the opportunity presented by the exclusion of Norway, their main competitor, from this important market. Indeed, frozen Atlantic salmon exports to Russia from Chile almost tripled in the second half of 2014 compared with the same period in 2013. The average Russian consumer, however, has not retained his purchasing power. Seafood consumption has dropped substantially, with retail sales down almost 50%. Inflation has risen as well, with the weak ruble increasing import prices. Expensive seafood items like salmon have suffered in particular, and Russia’s new suppliers have been finding it increasingly difficult to find buyers.
Brazil is another market where economic problems and a rapidly weakening currency have hurt demand. Fortunately for the world’s salmon suppliers, the USA has been a consistent source of strong demand, although with domestic and Canadian production growing it has an ever increasing range of supply options.
Russian Federation The substitution of fresh salmon from Norway by frozen salmon from non-sanctioned countries has led to lower volumes of high-quality salmon on the Russian market for both fish processing companies producing steaks and fillets from fresh salmon, and final consumers, who are often offered previously frozen salmon as fresh in retail stores.
After the embargo, fresh salmon was moved to the category of elite products, and its price in the retail segment jumped from 600 RUB per kg in August 2014 to RUB 1 200 RUB per kg in the beginning of 2015. This sharp price increase could not be negated, even with additional volumes of processed Norwegian salmon exported from Belarus to the Russian market.
While in 2012 and 2013 Russia was the largest importer of Norwegian salmon, the total Russian import of salmon collapsed by 34% to 73 400 tonnes in 2014. The Faroe Islands and Chile are now the main supplying countries of Atlantic salmon to Russia, but in total, those countries cannot make up even a half of previously imported volumes.
The lack of salmon on the Russian market can be partially filled by domestic salmon species. According to the Federal Agency for Fisheries, Norwegian salmon is getting substituted with Pacific salmon species from the Russian Far East (total catch of 337 000 tonnes in 2014). In addition, the output of farmed Atlantic salmon in the North-Western Federal District of Russia is around 20 000 tonnes.
FranceDemand for salmon in France suffered somewhat from high prices and negative publicity in 2014, although total import value was approximately flat. There was a notable shift in composition of suppliers, as Norwegian fresh farmed
importssalmon: germany (by origin)
2009 2010 2011 2012 2013 2014
(1 000 tonnes)Norway 55.4 58.5 58.2 51.0 51.4 53.0
Poland 29.6 27.9 29.3 36.5 46.4 43.4
Denmark 9.9 9.0 10.4 8.8 14.0 26.8
China 13.9 17.5 15.3 12.9 12.0 15.8
Chile 8.1 2.0 3.4 2.6 7.8 7.7
USA 4.1 3.6 4.1 3.2 5.5 6.4
Lithuania 3.5 5.2 6.0 5.8 4.8 6.1
Netherlands 2.5 2.2 2.3 1.9 3.2 5.0
UK 2.5 2.9 3.0 3.4 3.7 3.3
Faroe Islands 0.1 0.5 0.0 0.1 0.4 1.1
Belgium 0.3 0.4 0.3 0.3 0.6 1.1
Others 6.4 4.9 5.1 2.2 3.9 4.1
total 136.2 134.7 137.4 128.7 153.6 173.8
source: germany customs
importssalmon: france
2009 2010 2011 2012 2013 2014
(1 000 tonnes)fresh whole 107.4 111.1 109.3 122.1 111.0 104.3 Norway 74.0 79.3 76.3 87.9 77.5 68.0
UK 19.3 21.1 21.6 21.5 21.5 25.3
Sweden 2.4 2.3 2.6 2.5 4.6 3.6
Ireland 3.8 4.8 4.5 5.3 2.7 3.1
frozen Pac 4.8 4.7 4.6 2.8 3.4 3.4 USA 4.0 4.3 4.5 2.6 2.9 3.1
frozen atl 3.3 4.6 8.6 1.1 0.9 0.7
Poland 0.0 0.6 0.1 0.0 0.4 0.2
Norway 0.9 0.9 5.6 0.4 0.2 0.1
smoked 5.7 7.4 7.8 9.3 8.7 7.8 UK 1.0 0.8 0.9 0.8 0.6 0.8
Poland 3.4 5.3 5.5 6.8 6.5 5.0
Germany 0.3 0.4 0.4 0.5 0.5 0.5
Fresh fillets 9.7 10.6 12.0 19.3 19.5 17.8 Norway 8.2 9.6 11.0 17.1 17.0 13.9
Frozen fillets 21.7 21.0 20.6 19.2 22.7 23.1 Chile 9.0 3.8 4.4 6.0 8.8 7.0
China 5.8 8.2 8.2 5.4 4.9 5.5
Norway 2.9 3.4 2.8 3.0 3.7 3.3
canned 2.0 1.8 1.8 1.6 2.0 1.4 Thailand 0.3 0.4 0.3 0.4 0.5 0.3
Denmark 0.7 0.4 0.6 0.6 0.5 0.3
Germany 0.3 0.2 0.0 0.0 0.2 0.2
grand total 154.7 161.2 164.7 175.4 168.2 158.5source: direction nationale des statistiques du commerce extérieur – dnsce
SALMON

41Globefish highlights April 2015
SALMON
Atlantic salmon - the target of an anti-salmon farming media campaign - was replaced to some extent by French certified farmed Scottish salmon. There has also been an increase in demand for frozen fillets, particularly from the Faroe Islands, and for domestic French smoked product.
Germany Seafood consumption in Germany is following an overall downward trend, but salmon has so far been an exception. Germany imported more salmon at higher prices in 2014, boosting purchases of Norwegian fresh whole Atlantics in particular. This latter shift is being driven by large discount retail chains, with NSC reporting an 80% increase in fresh salmon consumption in Germany between 2012 and 2014. The German market has also established frozen and smoked segments, with imports of cheap frozen fillets from China growing significantly in 2014.
Japan Long the major market for the bulk of Chilean farmed coho production, Japan saw a large drop in import volumes of frozen whole coho in 2014. Imports of frozen fillets, however, increased significantly, likely reflecting the fact that declining demand for seafood in Japan has forced domestic processing plants to close. Additionally, the even year drop in sockeye harvest volumes, which traditionally competes with farmed coho, contributed to the increase of frozen fillet imports. The substantial weakening of the yen, which has made salmon and other seafood imports more expensive, explains the decrease in total import volumes. For 2015, the forecasted flat coho production, the stabilizing yen and increased sockeye harvests should slow or reverse price increases.
Outlook
Despite the recent downward revision of forward prices, there is still a relatively positive outlook for the rest of 2015. This is the inevitable result of continued strong growth in demand and slowing supply growth. The deterioration of the economic situation in Russia and Brazil is presenting a temporary challenge to suppliers, but the USA, the EU and Asia are evidently capable of absorbing excess volumes.
In the longer term, it is rising costs relating to biological management and feed that are more of a concern for the industry. This is also causing discussions regarding the viability of land-based salmon farming to become less one-sided, as evidenced by debate at the North Atlantic Seafood Forum in early March.
importssalmon: Japan
2009 2010 2011 2012 2013 2014
(1 000 tonnes)fresh * 21.4 20.8 23.0 29.2 22.8 20.7 Norway 18.6 18.0 19.7 26.4 19.4 18.4
Australia 1.1 1.3 1.7 1.2 0.8 0.4
UK 0.4 0.4 0.6 0.6 0.6 0.4
Canada 0.6 0.3 0.2 0.4 1.2 0.6
frozen** 128.3 128.3 143.1 148.9 137.9 115.1 Chile 81.5 71.3 94.0 111.6 94.7 75.9
Russian Fed. 21.7 24.9 28.3 24.9 34.5 28.2
USA 21.3 22.8 16.6 9.7 4.7 7.6
N. Zealand 2.0 1.6 1.5 0.8 1.9 0.2
Canada 0.7 6.7 1.4 0.8 1.1 2.4
Fresh fillets NA NA NA 6.2 7.7 9.7 Norway NA NA NA 5.5 7.6 9.7
Frozen fillets NA NA NA 15.4 14.5 22.2 Chile NA NA NA 9.1 9.2 16.8
Norway NA NA NA 4.7 3.5 3.0
grand total 149.9 149.4 166.6 200.2 183.2 168.3source: Japan customs
* mainly atlantic **mainly Pacific Note: 2008-2011 grand totals do not include fillets
importssalmon: Usa
2009 2010 2011 2012 2013 2014
(1 000 tonnes)
Fresh fillets Chile 41.5 21.5 43.0 67.5 80.8 92.4
Norway 18.8 22.7 8.3 3.7 5.9 10.7
UK 4.9 3.6 5.0 3.4 3.3 4.6
Canada 5.0 6.8 5.0 4.9 6.3 3.7
Other 3.4 2.9 8.1 7.4 8.5 9.7
Total fresh fillets 73.5 57.5 69.4 86.9 104.8 121.1Frozen fillets 54.9 60.9 37.3 62.9 72.9 81.9smoked 4.3 4.5 4.8 5.2 5.2 5.1salted 0.0 0.0 0.0 0.0 0.0 0.0total 132.7 122.9 111.5 155.0 182.9 208.1all salmon 241.9 234.1 240.2 280.8 297.6 315.9source: nmfs
importssalmon: germany (by product)
2009 2010 2011 2012 2013 2014
(1 000 tonnes)Fresh salmon 51.7 49.9 51.7 44.9 48.9 64.3
Frozen salmon 6.6 5.9 5.4 5.1 9.9 10.2
Smoked salmon 32.8 32.8 35.7 34.5 39.1 37.2
Fresh fillets 8.2 8.2 6.9 7.3 8.8 10.6
Frozen fillets 33.5 33.4 31.7 26.7 32.9 36.1
Salted 1.6 2.9 4.3 7.3 10.2 10.3
Canned 3.0 2.7 2.7 2.8 3.8 5.0
total 136.2 134.7 137.4 128.7 153.6 173.8source: germany customs

42 Globefish highlights April 2015
Tighter supplies expected
Increased mackerel supplies have forced prices down. Herring prices came up during the winter due to tighter supplies, and are now expected to edge upwards. The outlook
forecasts tighter supplies of all small pelagics (except anchovies), and consequently firmer prices.
SMALL PELAGICS
Mackerel
SuppliesSpanish trawlers started the 2015 season in January on a pessimistic note, as their quota had been reduced by 26.3% compared with 2014. The bottom trawl quota thus amounted to only 8 470 tonnes, which is 28.3% of the total quota allocated to Spain for all fishing gears. The Spanish quota amounts to only 7.6% of the EU quota, which was set in an agreement between the EU, Norway and the Faroe Islands earlier. Galician purse seiners were also dissatisfied with their 2015 mackerel quota, which was reduced by 25.5% to 2 626 tonnes.
These low quotas worry the Spanish mackerel sector, which blames the government for the low quota. In response, the government reminded the sector that it is the EU that has imposed the severe sanctions on Spain for exceeding the catch quota in 2009 and 2010. 10 000 tonnes of mackerel thus are deducted from the Spanish quota every year. As consequence of Spanish dissatisfaction with the quotas,
the EU and Spain met at the end of February 2015 to discuss a possible increase in the Spanish quotas. The EU conceded that these sanctions may be applied to species other than mackerel so that the impact on the Spanish mackerel fleet would be somewhat negated.
In contrast, Chilean fishermen were happy with their 2015 allocation of a horse mackerel quota of 297 000 tonnes in the South Pacific. This was an increase of 7 000 tonnes (+2.4%) compared with the 2014 quota. Other major fishing nations involved in this fishery are China, which received a quota of 29 200 tonnes, and the EU, with a quota of 28 100 tonnes (Source: FIS.com).
source: nsc/central bureau of statistics, norway
Norwegian Frozen Mackerel Export Prices
importsfrozen mackerel: germany
2009 2010 2011 2012 2013 2014
(1 000 tonnes)Faroe Islands 0.0 2.4 4.9 5.5 3.2 7.3
UK 1.2 1.9 7.6 9.4 10.1 7.2
Netherlands 4.7 5.4 5.3 5.4 3.0 3.4
Ireland 3.9 4.9 3.6 2.6 3.2 2.6
Norway 2.2 1.4 0.5 2.0 1.4 2.2
Poland 3.5 3.2 3.9 0.7 1.4 1.8
Denmark 4.5 4.0 3.5 1.7 1.5 1.0
Others 1.7 1.6 3.3 1.0 1.0 1.1
total 21.7 24.8 32.6 28.3 24.8 26.6
source: germany customs
exportsfrozen mackerel: norway
2009 2010 2011 2012 2013 2014
(1 000 tonnes)China 33.2 51.0 56.9 48.0 52.3 81.1
Japan 51.7 80.5 74.7 48.0 53.0 72.6
Nigeria 4.3 25.0 3.1 27.7 3.8 52.3
Netherlands 4.8 5.9 10.8 18.4 8.7 36.1
Republic of Korea 7.7 12.1 14.2 13.1 16.9 35.4
Turkey 18.0 26.0 19.2 18.8 20.0 24.0
Egypt 0.0 3.6 0.0 3.4 8.1 11.2
Lithuania 2.5 1.5 3.5 8.6 7.4 8.5
Poland 12.1 8.3 5.3 7.5 9.1 7.6
Russian Fed. 19.9 16.0 18.1 19.6 12.1 6.4
Viet Nam 0.2 0.6 2.0 2.4 3.2 6.0
USA 1.8 4.0 2.8 2.9 4.0 4.7
Thailand 1.5 2.0 2.4 3.8 6.3 4.5
Taiwan PC 2.3 2.6 3.0 7.2 5.4 4.4
Ukraine 13.0 8.5 9.4 7.4 8.5 3.7
Indonesia 0.0 0.0 0.7 1.5 2.9 3.6
Ghana 0.0 1.1 0.1 1.6 3.2 2.9
Others 15.3 16.3 13.1 23.5 18.3 22.9
total 188.3 265.0 239.3 263.4 243.2 387.9
source: statistics norway
0
5
10
15
20
25
30
35
40
Sep
'10
Nov
'10
Jan
'11
Mar
'11
May
'11
Jul '
11
Sep
'11
Nov
'11
Jan
'12
Mar
'12
May
'12
Jul '
12
Sep
'12
Nov
'12
Jan
'13
Mar
'13
May
'13
Jul '
13
Sep
'13
Nov
'13
Jan
'14
Mar
'14
May
'14
Jul '
14
Sep
'14
Nov
'14
Jan
'15
no
k p
er k
g fo
b n
orw
ay
>600 grammes
<600 grammes
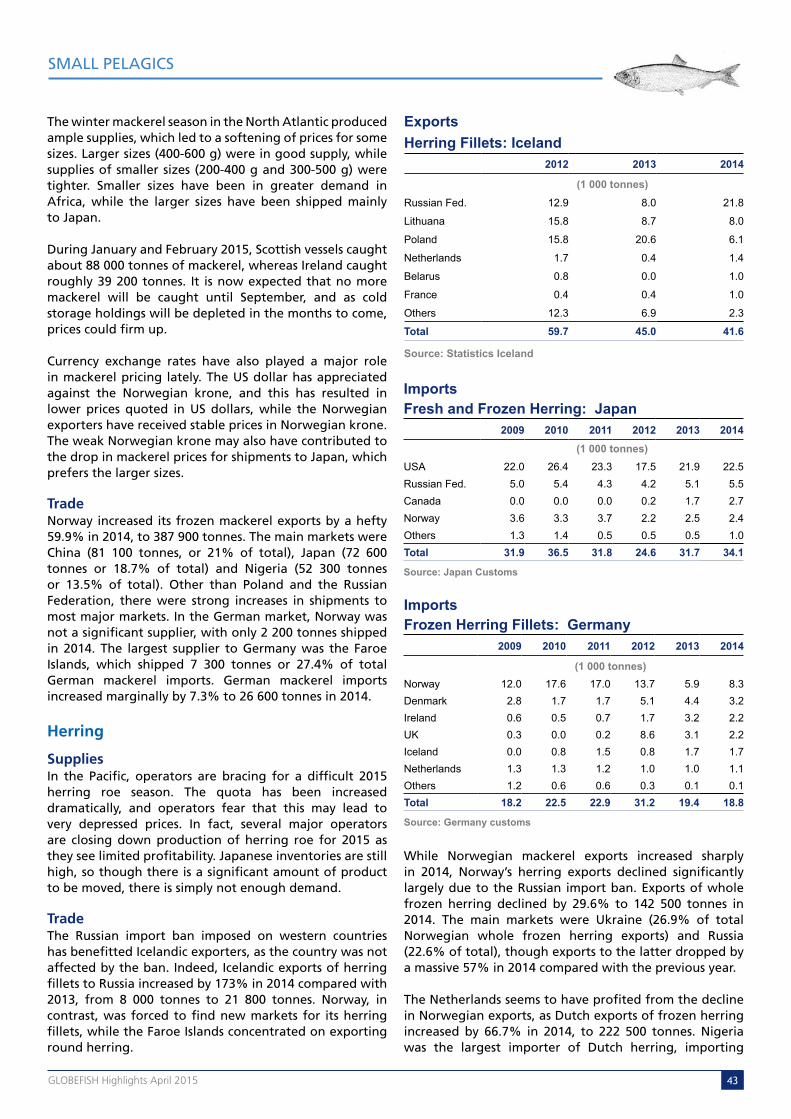
43Globefish highlights April 2015
The winter mackerel season in the North Atlantic produced ample supplies, which led to a softening of prices for some sizes. Larger sizes (400-600 g) were in good supply, while supplies of smaller sizes (200-400 g and 300-500 g) were tighter. Smaller sizes have been in greater demand in Africa, while the larger sizes have been shipped mainly to Japan.
During January and February 2015, Scottish vessels caught about 88 000 tonnes of mackerel, whereas Ireland caught roughly 39 200 tonnes. It is now expected that no more mackerel will be caught until September, and as cold storage holdings will be depleted in the months to come, prices could firm up.
Currency exchange rates have also played a major role in mackerel pricing lately. The US dollar has appreciated against the Norwegian krone, and this has resulted in lower prices quoted in US dollars, while the Norwegian exporters have received stable prices in Norwegian krone. The weak Norwegian krone may also have contributed to the drop in mackerel prices for shipments to Japan, which prefers the larger sizes.
TradeNorway increased its frozen mackerel exports by a hefty 59.9% in 2014, to 387 900 tonnes. The main markets were China (81 100 tonnes, or 21% of total), Japan (72 600 tonnes or 18.7% of total) and Nigeria (52 300 tonnes or 13.5% of total). Other than Poland and the Russian Federation, there were strong increases in shipments to most major markets. In the German market, Norway was not a significant supplier, with only 2 200 tonnes shipped in 2014. The largest supplier to Germany was the Faroe Islands, which shipped 7 300 tonnes or 27.4% of total German mackerel imports. German mackerel imports increased marginally by 7.3% to 26 600 tonnes in 2014.
Herring
SuppliesIn the Pacific, operators are bracing for a difficult 2015 herring roe season. The quota has been increased dramatically, and operators fear that this may lead to very depressed prices. In fact, several major operators are closing down production of herring roe for 2015 as they see limited profitability. Japanese inventories are still high, so though there is a significant amount of product to be moved, there is simply not enough demand.
TradeThe Russian import ban imposed on western countries has benefitted Icelandic exporters, as the country was not affected by the ban. Indeed, Icelandic exports of herring fillets to Russia increased by 173% in 2014 compared with 2013, from 8 000 tonnes to 21 800 tonnes. Norway, in contrast, was forced to find new markets for its herring fillets, while the Faroe Islands concentrated on exporting round herring.
While Norwegian mackerel exports increased sharply in 2014, Norway’s herring exports declined significantly largely due to the Russian import ban. Exports of whole frozen herring declined by 29.6% to 142 500 tonnes in 2014. The main markets were Ukraine (26.9% of total Norwegian whole frozen herring exports) and Russia (22.6% of total), though exports to the latter dropped by a massive 57% in 2014 compared with the previous year.
The Netherlands seems to have profited from the decline in Norwegian exports, as Dutch exports of frozen herring increased by 66.7% in 2014, to 222 500 tonnes. Nigeria was the largest importer of Dutch herring, importing
importsfresh and frozen herring: Japan
2009 2010 2011 2012 2013 2014
(1 000 tonnes)USA 22.0 26.4 23.3 17.5 21.9 22.5Russian Fed. 5.0 5.4 4.3 4.2 5.1 5.5Canada 0.0 0.0 0.0 0.2 1.7 2.7Norway 3.6 3.3 3.7 2.2 2.5 2.4Others 1.3 1.4 0.5 0.5 0.5 1.0total 31.9 36.5 31.8 24.6 31.7 34.1
source: Japan customs
importsfrozen herring fillets: germany
2009 2010 2011 2012 2013 2014
(1 000 tonnes)Norway 12.0 17.6 17.0 13.7 5.9 8.3Denmark 2.8 1.7 1.7 5.1 4.4 3.2Ireland 0.6 0.5 0.7 1.7 3.2 2.2UK 0.3 0.0 0.2 8.6 3.1 2.2Iceland 0.0 0.8 1.5 0.8 1.7 1.7Netherlands 1.3 1.3 1.2 1.0 1.0 1.1Others 1.2 0.6 0.6 0.3 0.1 0.1total 18.2 22.5 22.9 31.2 19.4 18.8
source: germany customs
exportsherring fillets: iceland
2012 2013 2014
(1 000 tonnes)Russian Fed. 12.9 8.0 21.8
Lithuana 15.8 8.7 8.0
Poland 15.8 20.6 6.1
Netherlands 1.7 0.4 1.4
Belarus 0.8 0.0 1.0
France 0.4 0.4 1.0
Others 12.3 6.9 2.3
total 59.7 45.0 41.6
source: statistics iceland
SMALL PELAGICS

44 Globefish highlights April 2015
94 400 tonnes or 42.5% of total Dutch frozen herring exports. Egypt also took a large amount (68 200 tonnes), while China took 16 000 tonnes (up 116%) and Malta took 10 300 tonnes (a notable 758% increase). It is suspected that some of Malta’s imports will be re-exported to other markets.
German imports of frozen herring fillets fell slightly in 2014, to 18 800 tonnes, after seeing a dramatic fall in 2013, when imports declined by almost 40%. Main suppliers of frozen herring fillets to Germany were Norway (44% of total imports), Denmark (17% of total) and Ireland (12% of total).
Japanese imports of fresh and frozen herring increased by 7.6% in 2014, to 34 100 tonnes. The main supplier by far is still the USA, which accounted for two thirds of total imports, followed by Russia (16% of total) and Canada (8% of total).
Pilchard/sardines/anchovy
Peru has reported a significant recovery of the Pacific anchovy stock in the southern region. A recent oceanographic survey estimated the biomass to be 607 000 tonnes, 98% of which were juveniles (Source: FIS.com). This represents a major resource recovery and bodes well for future years. However, since most of this consists of juveniles, the Instituto del Mar del Peru (IMARPE) recommended that fishing activities remain closed until the adult stock is adequate. The Peruvian Ministry of Fisheries has announced that the anchovy season will open in either April or May.
The sardine fishery in Portugal has had a period of six months of inactivity due to a previous decline in landings and consequently reduced quotas. Over the past six years, catches of sardines in Portuguese waters have declined from 65 000 tonnes in 2008 to just 15 000 tonnes in 2014 (Source: FIS.com). Authorities and fishermen alike are now hoping for a recovery as the stock has been left in peace for this six-month period, the longest ban the fishery has ever experienced. In addition, there have been favourable weather conditions for the species and thus the fishery was expected to be opened in March.
Canned sardines
The European canned sardine market is still relatively stable. Imports during 2014 did not differ much from imports in 2013. Germany imported slightly less in 2014 (6 800 tonnes) compared with 2013 (7 200 tonnes). The main suppliers to the German market were Morocco, Peru and the Netherlands. France imported practically the same amount (16 800 tonnes) as in 2013, mainly from Morocco, Portugal and Spain, while the UK also had very little change at 12 400 tonnes. Main suppliers to the UK were Morocco, Portugal and Thailand.
exportsfrozen Whole herring: norway
2009 2010 2011 2012 2013 2014
(1 000 tonnes)Ukraine 106.6 69.5 55.9 58.3 33.8 38.3Russian Fed. 151.6 121.1 77.1 60.0 75.0 32.2Lithuania 24.5 22.7 22.8 26.1 35.8 25.9Netherlands 14.2 17.8 15.5 9.7 12.3 13.2Latvia 5.1 4.3 4.6 4.2 10.6 6.2Kazakhstan 16.7 14.4 10.9 3.2 2.1 4.7Egypt 13.6 22.6 16.3 15.3 10.9 3.4Germany 3.1 3.2 4.2 3.1 3.5 2.9Japan 3.5 3.5 2.6 3.0 2.7 2.6Poland 5.6 4.9 2.8 3.3 3.8 2.5Nigeria 119.5 129.2 44.7 6.7 2.9 0.8Others 36.1 34.9 23.5 12.2 9.0 9.8total 500.1 448.1 280.9 205.1 202.4 142.5
source: statistics norway
exportsdutch frozen herring
2009 2010 2011 2012 2013 2014
(1 000 tonnes)Nigeria 48.1 48.9 37.3 66.0 59.5 94.4Egypt 31.3 23.6 18.2 34.3 42.8 68.2China 10.4 10.1 7.7 7.7 7.4 16.0Malta 0.5 1.0 0.8 0.8 1.2 10.3Côte d’Ivoire 0.7 0.1 0.0 0.4 3.4 5.4Tunisia 0.0 0.0 0.8 0.5 0.0 3.5Benin 0.0 0.0 0.0 0.5 0.2 3.1France 0.4 0.9 1.5 4.4 1.1 2.8Germany 1.7 2.2 2.4 3.1 3.1 2.6Spain 0.1 0.3 2.0 2.3 1.1 2.5Lithuania 1.1 0.7 1.8 4.7 1.4 2.1Dem. Rep. of Congo 0.0 0.0 0.0 0.0 0.0 1.5UK 0.6 0.8 1.8 1.2 3.5 1.5Ghana 0.0 0.0 0.0 2.2 2.0 1.1Others 5.0 3.6 3.9 5.3 6.8 7.5total 99.9 92.5 78.0 133.5 133.5 222.5
source: eurostat
source: nsc/central bureau of statistics, norway
Norwegian Frozen Herring Export Prices
SMALL PELAGICS
0
2
4
6
8
10
12
14
16
18
Sep
'10
Nov
'10
Jan
'11
Mar
'11
May
'11
Jul '
11
Sep
'11
Nov
'11
Jan
'12
Mar
'12
May
'12
Jul '
12
Sep
'12
Nov
'12
Jan
'13
Mar
'13
May
'13
Jul'1
3 S
ep '1
3 N
ov '1
3 Ja
n '1
4 M
ar '1
4 M
ay '1
4 Ju
l '14
S
ep '1
4 N
ov '1
4 Ja
n '1
5
no
k p
er k
g fo
b n
orw
ay
Whole frozen
Frozen fillets
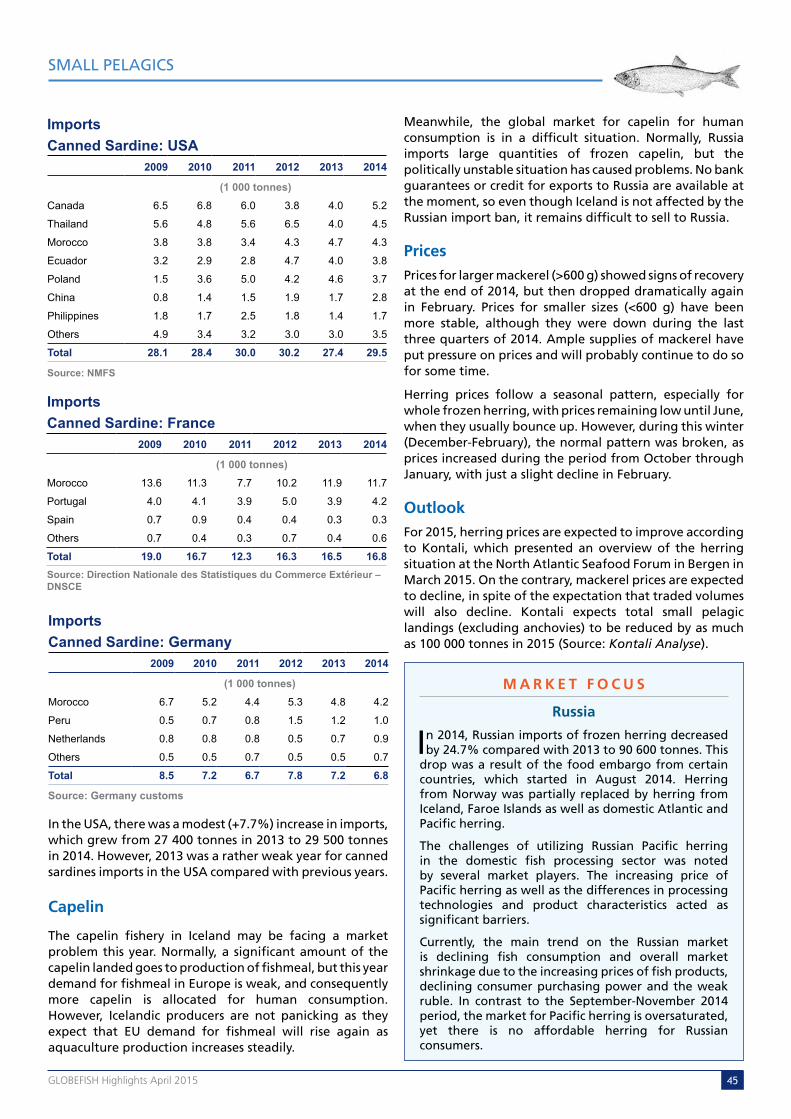
45Globefish highlights April 2015
SMALL PELAGICS
In the USA, there was a modest (+7.7%) increase in imports, which grew from 27 400 tonnes in 2013 to 29 500 tonnes in 2014. However, 2013 was a rather weak year for canned sardines imports in the USA compared with previous years.
Capelin
The capelin fishery in Iceland may be facing a market problem this year. Normally, a significant amount of the capelin landed goes to production of fishmeal, but this year demand for fishmeal in Europe is weak, and consequently more capelin is allocated for human consumption. However, Icelandic producers are not panicking as they expect that EU demand for fishmeal will rise again as aquaculture production increases steadily.
Meanwhile, the global market for capelin for human consumption is in a difficult situation. Normally, Russia imports large quantities of frozen capelin, but the politically unstable situation has caused problems. No bank guarantees or credit for exports to Russia are available at the moment, so even though Iceland is not affected by the Russian import ban, it remains difficult to sell to Russia.
PricesPrices for larger mackerel (>600 g) showed signs of recovery at the end of 2014, but then dropped dramatically again in February. Prices for smaller sizes (<600 g) have been more stable, although they were down during the last three quarters of 2014. Ample supplies of mackerel have put pressure on prices and will probably continue to do so for some time.
Herring prices follow a seasonal pattern, especially for whole frozen herring, with prices remaining low until June, when they usually bounce up. However, during this winter (December-February), the normal pattern was broken, as prices increased during the period from October through January, with just a slight decline in February.
OutlookFor 2015, herring prices are expected to improve according to Kontali, which presented an overview of the herring situation at the North Atlantic Seafood Forum in Bergen in March 2015. On the contrary, mackerel prices are expected to decline, in spite of the expectation that traded volumes will also decline. Kontali expects total small pelagic landings (excluding anchovies) to be reduced by as much as 100 000 tonnes in 2015 (Source: Kontali Analyse).
M A R k E T F O C U S
Russia
In 2014, Russian imports of frozen herring decreased by 24.7% compared with 2013 to 90 600 tonnes. This
drop was a result of the food embargo from certain countries, which started in August 2014. Herring from Norway was partially replaced by herring from Iceland, Faroe Islands as well as domestic Atlantic and Pacific herring.
The challenges of utilizing Russian Pacific herring in the domestic fish processing sector was noted by several market players. The increasing price of Pacific herring as well as the differences in processing technologies and product characteristics acted as significant barriers.
Currently, the main trend on the Russian market is declining fish consumption and overall market shrinkage due to the increasing prices of fish products, declining consumer purchasing power and the weak ruble. In contrast to the September-November 2014 period, the market for Pacific herring is oversaturated, yet there is no affordable herring for Russian consumers.
importscanned sardine: france
2009 2010 2011 2012 2013 2014
(1 000 tonnes)Morocco 13.6 11.3 7.7 10.2 11.9 11.7
Portugal 4.0 4.1 3.9 5.0 3.9 4.2
Spain 0.7 0.9 0.4 0.4 0.3 0.3
Others 0.7 0.4 0.3 0.7 0.4 0.6
total 19.0 16.7 12.3 16.3 16.5 16.8source: direction nationale des statistiques du commerce extérieur – dnsce
importscanned sardine: germany
2009 2010 2011 2012 2013 2014
(1 000 tonnes)Morocco 6.7 5.2 4.4 5.3 4.8 4.2
Peru 0.5 0.7 0.8 1.5 1.2 1.0
Netherlands 0.8 0.8 0.8 0.5 0.7 0.9
Others 0.5 0.5 0.7 0.5 0.5 0.7
total 8.5 7.2 6.7 7.8 7.2 6.8
source: germany customs
importscanned sardine: Usa
2009 2010 2011 2012 2013 2014
(1 000 tonnes)Canada 6.5 6.8 6.0 3.8 4.0 5.2
Thailand 5.6 4.8 5.6 6.5 4.0 4.5
Morocco 3.8 3.8 3.4 4.3 4.7 4.3
Ecuador 3.2 2.9 2.8 4.7 4.0 3.8
Poland 1.5 3.6 5.0 4.2 4.6 3.7
China 0.8 1.4 1.5 1.9 1.7 2.8
Philippines 1.8 1.7 2.5 1.8 1.4 1.7
Others 4.9 3.4 3.2 3.0 3.0 3.5
total 28.1 28.4 30.0 30.2 27.4 29.5
source: nmfs
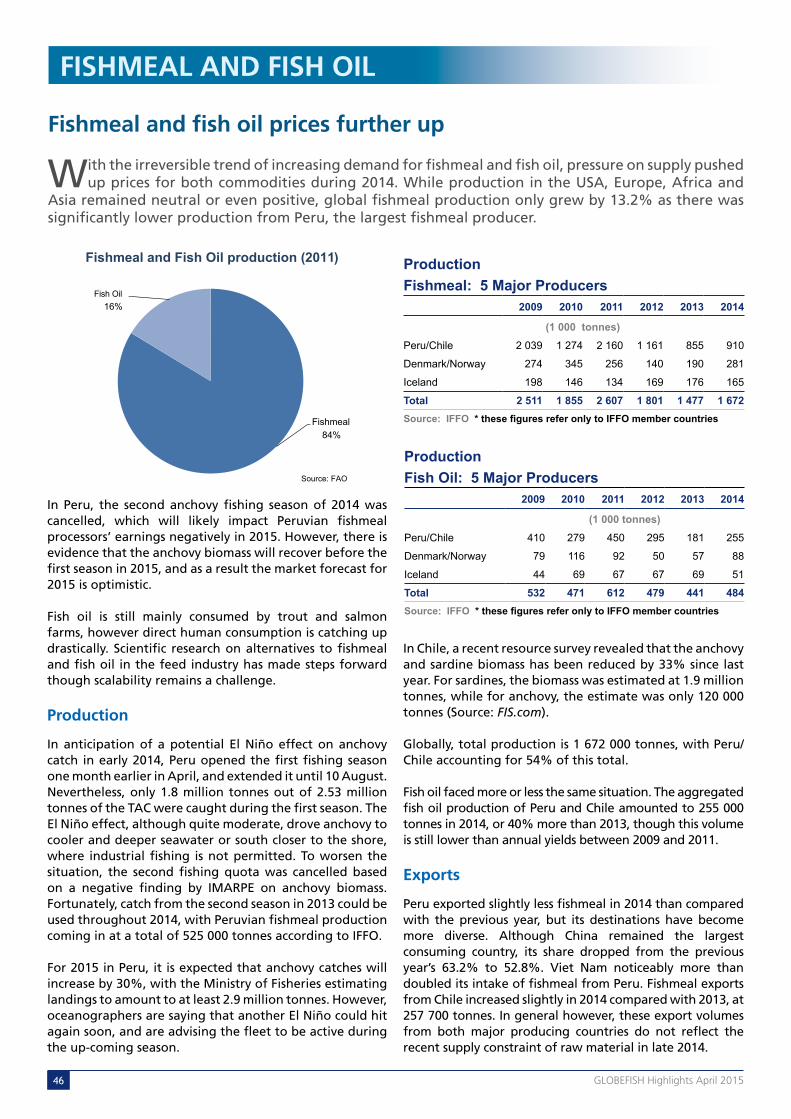
46 Globefish highlights April 2015
Fishmeal and fish oil prices further up
With the irreversible trend of increasing demand for fishmeal and fish oil, pressure on supply pushed up prices for both commodities during 2014. While production in the USA, Europe, Africa and
Asia remained neutral or even positive, global fishmeal production only grew by 13.2% as there was significantly lower production from Peru, the largest fishmeal producer.
FISHMEAL AND FISH OIL
In Peru, the second anchovy fishing season of 2014 was cancelled, which will likely impact Peruvian fishmeal processors’ earnings negatively in 2015. However, there is evidence that the anchovy biomass will recover before the first season in 2015, and as a result the market forecast for 2015 is optimistic.
Fish oil is still mainly consumed by trout and salmon farms, however direct human consumption is catching up drastically. Scientific research on alternatives to fishmeal and fish oil in the feed industry has made steps forward though scalability remains a challenge.
Production
In anticipation of a potential El Niño effect on anchovy catch in early 2014, Peru opened the first fishing season one month earlier in April, and extended it until 10 August. Nevertheless, only 1.8 million tonnes out of 2.53 million tonnes of the TAC were caught during the first season. The El Niño effect, although quite moderate, drove anchovy to cooler and deeper seawater or south closer to the shore, where industrial fishing is not permitted. To worsen the situation, the second fishing quota was cancelled based on a negative finding by IMARPE on anchovy biomass. Fortunately, catch from the second season in 2013 could be used throughout 2014, with Peruvian fishmeal production coming in at a total of 525 000 tonnes according to IFFO.
For 2015 in Peru, it is expected that anchovy catches will increase by 30%, with the Ministry of Fisheries estimating landings to amount to at least 2.9 million tonnes. However, oceanographers are saying that another El Niño could hit again soon, and are advising the fleet to be active during the up-coming season.
In Chile, a recent resource survey revealed that the anchovy and sardine biomass has been reduced by 33% since last year. For sardines, the biomass was estimated at 1.9 million tonnes, while for anchovy, the estimate was only 120 000 tonnes (Source: FIS.com).
Globally, total production is 1 672 000 tonnes, with Peru/Chile accounting for 54% of this total.
Fish oil faced more or less the same situation. The aggregated fish oil production of Peru and Chile amounted to 255 000 tonnes in 2014, or 40% more than 2013, though this volume is still lower than annual yields between 2009 and 2011.
Exports
Peru exported slightly less fishmeal in 2014 than compared with the previous year, but its destinations have become more diverse. Although China remained the largest consuming country, its share dropped from the previous year’s 63.2% to 52.8%. Viet Nam noticeably more than doubled its intake of fishmeal from Peru. Fishmeal exports from Chile increased slightly in 2014 compared with 2013, at 257 700 tonnes. In general however, these export volumes from both major producing countries do not reflect the recent supply constraint of raw material in late 2014.
Productionfishmeal: 5 major Producers
2009 2010 2011 2012 2013 2014
(1 000 tonnes)Peru/Chile 2 039 1 274 2 160 1 161 855 910
Denmark/Norway 274 345 256 140 190 281
Iceland 198 146 134 169 176 165
total 2 511 1 855 2 607 1 801 1 477 1 672source: iffo * these figures refer only to IFFO member countries
Productionfish oil: 5 major Producers
2009 2010 2011 2012 2013 2014
(1 000 tonnes)Peru/Chile 410 279 450 295 181 255
Denmark/Norway 79 116 92 50 57 88
Iceland 44 69 67 67 69 51
total 532 471 612 479 441 484source: iffo * these figures refer only to IFFO member countries
Source: FAO
Fishmeal84%
Fishoi l16%
fishmeal and fish oil production (2011)
Fish Oil

47Globefish highlights April 2015
FISHMEAL AND FISH OIL
Fish oil exports faired well in Peru, Chile and the USA. In Chile, total fish oil exports reached 86 700 tonnes, the highest volume since 2009. The USA exported 77 800 tonnes in 2014, more than in any year since 2009. The significant demand of fish oil for aquaculture as well as for human direct consumption is driving these export volume growths.
importsfishmeal: Uk
2009 2010 2011 2012 2013 2014
(1 000 tonnes)Norway 2.6 3.7 3.1 0.1 5.6 14.0
Ireland 22.2 11.2 2.6 9.8 12.5 12.2
Peru 53.1 33.3 28.6 24.2 11.9 11.0
Germany 2.5 14.9 14.9 10.4 7.3 9.6
Denmark 19.1 29.7 23.7 10.3 11.2 6.9
Chile 4.7 1.2 1.5 1.9 2.9 3.4
Spain 0.0 0.0 0.1 0.4 1.4 2.5
Iceland 1.6 2.8 3.5 7.3 5.7 2.3
France 1.2 1.1 1.8 1.4 1.8 1.1
Others 7.6 3.5 4.1 8.3 5.4 7.8
total 114.5 101.4 83.9 74.1 65.8 70.9
source: her majesty’s revenue & customs
importsfishmeal*: Usa
2009 2010 2011 2012 2013 2014
(1 000 tonnes)Chile 5.9 13.1 10.9 17.4 17.3 29.4Mexico 17.9 5.8 12.9 15.6 19.0 13.5Canada 6.7 6.7 6.1 5.3 4.5 4.1Others 4.4 13.5 4.5 5.0 6.9 6.6total 34.8 39.1 34.4 43.3 47.7 53.6source: nmfs * excluding solubles
exportsfishmeal: chile
2009 2010 2011 2012 2013 2014
(1 000 tonnes)China 328.5 119.5 157.0 131.2 105.2 91.6
Republic of Korea 29.7 20.4 17.0 21.2 15.3 23.9
Japan 61.0 54.7 37.0 30.3 22.9 21.5
Spain 29.9 23.8 19.0 15.7 17.2 19.4
Italy 25.8 18.6 20.0 12.9 12.6 13.8
Taiwan PC 20.6 8.0 13.0 12.1 5.0 8.3
Germany 30.1 12.5 16.0 16.7 0.5 3.2
Others 79.3 61.1 38.0 59.2 61.2 75.8
total 605.0 318.6 317.0 299.3 239.9 257.7source: Produce
exportsfish oil: Usa
2009 2010 2011 2012 2013 2014
(1 000 tonnes)Menhaden 31.5 62.2 44.1 17.8 46.0 53.6
Other 17.4 14.8 21.2 20.5 19.9 24.2
total 48.9 77.0 65.3 38.3 65.9 77.8source: nmfs
exportsfish oil: Peru
2009 2010 2011 2012 2013 2014
(1 000 tonnes)Denmark 85.1 42.7 58.0 88.7 35.3 43.7
Belgium 67.3 44.8 40.1 48.8 19.8 26.2
Chile 22.5 61.9 45.1 40.1 14.0 25.6
Canada 17.1 19.9 11.7 18.3 0.5 9.0
Norway 19.5 14.2 7.9 26.7 8.9 8.1
China 31.5 16.7 11.2 5.0 4.5 5.6
Australia 9.7 12.4 5.2 4.1 4.5 4.6
Others 34.5 22.4 32.1 41.6 11.4 12.2
total 287.2 235.1 211.3 273.3 98.8 134.9source: Produce
exportsfishmeal: Peru
2009 2010 2011 2012 2013 2014
(1 000 tonnes)China 753.9 554.5 758.0 681.9 535.4 446.1
Germany 269.1 136.3 119.2 193.5 90.7 117.9
Japan 117.1 112.2 95.8 113.1 47.4 71.3
Viet Nam 61.4 34.5 44.3 52.1 19.2 39.7
Taiwan PC 62.5 37.5 46.3 53.7 18.2 24.9
UK 54.4 32.2 30.8 19.7 12.2 9.4
Others 218.8 177.3 198.0 205.8 123.6 134.9
total 1 537.2 1 084.5 1 292.5 1 319.8 846.7 844.4source: Produce
exportsfish oil: chile
2009 2010 2011 2012 2013 2014
(1 000 tonnes)Belgium 22.4 2.1 0.0 5.4 1.4 15.9Denmark 0.0 4.0 0.0 3.0 0.0 13.7Japan 10.6 7.5 14.2 10.6 9.2 6.5Indonesia 0.9 1.2 4.8 4.8 4.5 6.3Viet Nam 6.4 4.9 6.2 6.1 5.5 5.9China 0.0 11.0 5.4 6.8 8.5 1.0Norway 1.0 6.4 3.5 1.6 2.3 0.0Others 39.4 13.1 27.9 29.6 36.8 37.6
total 80.8 50.0 62.0 67.9 68.1 86.7source: boletín de exportaciones del ifoP

48 Globefish highlights April 2015
Outlook
According to the latest reporting on both climate and anchovy biomass, 2015 will not be another poor year for anchovy catch. However, without any raw materials due to the closed second fishing season in 2014, Peruvian fishmeal producers’ earnings will definitely be impacted negatively in 2015.
The 2014 Atlantic Menhaden Stock Assessment confirmed that Atlantic menhaden is not overfished, which may indicate a positive menhaden quota expectation. According to IFFO, domestic fishmeal production in China dropped by 25% due to a recent consolidation, which led to the withholding of licenses for small firms. In general, one can expect a slightly better supply situation taking into consideration output from Africa and Europe.
Efforts to find alternative ingredients for fish feed never cease. Seaweed, mushrooms, beef tallow, cottonseed flour and wheat gluten are now alternatives on the top of the list. If soymeal prices did not demonstrate significant competitiveness in 2013 and early 2014, with the price ratio between fishmeal and soymeal staying at 2.8:1 to 3.6:1, the said ratio recorded at 4.2:1 in March 2015 should be much more convincing. Diversification and alternatives are the only solutions to the ever-growing demand for fishmeal and fish oil for the agriculture sector and direct human consumption.
Markets
China has been the largest buyer of Peruvian and Chilean fishmeal exports for many years. However, China reduced its share from 75% in 2013 to less than 60% in 2014. This decrease can be explained by the fact that China built up their stock in early 2014 to 253 000 tonnes, and with the unclear situation on anchovy catch in the first fishing season, ceased to import further volumes.
All of the traditional fishmeal markets, such as Germany, the UK and the USA managed to import more in 2014. The USA sourced more than half of its fishmeal from Chile, which is significantly more than compared with six years ago when Chile supplied less than 17%. Germany imported 22.6% of its fishmeal from Africa, whereas six years ago African fishmeal represented less than 2% of its total fishmeal imports.
Prices
Up until June 2014, prices for fishmeal in international markets did not respond significantly to the anticipated supply shortage implied by the low anchovy catch in Peru. This quiet was broken shortly after the first anchovy fishing season in Peru was over in August. Indeed in October 2014, the FOB price for super prime fishmeal in Peru was recorded at USD 2 400 per tonne. High market prices were then further confirmed by the cancellation of the second fishing season. Prices of fish oil followed the same trend.
In anticipation that the anchovy biomass will recover before the first fishing season can start in May, there seems to be consensus in the marketplace that the fishmeal and fish oil supply will return to normal levels for the year. As a result, starting in December 2014, prices for both commodities have gradually dropped.
FISHMEAL AND FISH OIL
PricesFishmeal and Soymeal
PricesFishmeal and Fish Oil Prices Europe
source: oil World
source: oil World
importsfishmeal: germany
2009 2010 2011 2012 2013 2014
(1 000 tonnes)Peru 251.1 159.3 115.7 145.1 75.8 129.0Morocco 5.6 36.0 19.2 22.2 21.9 26.1Mauritania 0.0 0.0 0.0 4.0 10.1 18.3Denmark 14.9 13.5 12.0 7.5 17.4 13.9South Africa 0.0 0.0 1.0 5.5 1.2 4.4Faroe Islands 1.5 4.4 0.0 0.0 3.1 3.8USA 9.9 2.0 1.0 0.0 0.0 3.5France 4.2 3.7 4.4 4.5 10.4 3.2Chile 15.5 4.8 10.1 22.1 0.5 3.2Panama 2.2 0.2 0.9 8.4 0.9 2.1Iceland 0.0 0.0 1.5 1.3 20.1 1.5Others 5.6 3.8 1.0 8.0 6.1 6.9total 310.5 227.7 166.8 228.6 167.5 215.9
source: germany customs
0
500
1 000
1 500
2 000
2 500
3 000
Dec
-11
Jan-
12
Feb
-12
Mar
-12
Apr
-12
May
-12
Jun-
12
Jul-1
2 A
ug-1
2 S
ep-1
2 O
ct-1
2 N
ov-1
2 D
ec-1
2 Ja
n-13
F
eb-1
3 M
ar-1
3 A
pr-1
3 M
ay-1
3 Ju
n-13
Ju
l-13
Aug
-13
Sep
-13
Oct
-13
Nov
-13
Dec
-13
Jan-
14
Feb
-14
Mar
-14
Apr
-14
May
-14
Jun-
14
Jul-1
4 A
ug-1
4 S
ep-1
4 O
ct-1
4 N
ov-1
4 D
ec-1
4 Ja
n-15
F
eb-1
5 M
ar-1
5 A
pr-1
5 M
ay-1
5 Ju
n-15
Ju
l-15
Aug
-15
Sep
-15
Oct
-15
Nov
-15
Dec
-15
US
D/to
nne
Fish oil
Fishmeal
0
500
1 000
1 500
2 000
2 500
Dec-
05
Dec-
06
Dec-
07
Dec-
08
Dec-
09
Dec-
10
Dec-
11
Dec-
12
Dec-
13
Dec-
14
Dec-
15
USD/tonne
fishmeal*
soymeal**
* all origins, 64-65% cif hamburg; 44% cif rotterdam

49Globefish highlights April 2015
BIVALVES
More Chinese bivalves on markets
Global imports of bivalves experienced only a slight increase in 2014 compared with 2013 (0.9%). While mussel trade has remained stable, international purchases of
scallops have declined. By contrast, imports of clam, cockles and ark shells have grown by 4.7% or nearly 10 000 tonnes. China is the top supplier to the world bivalve market, with demand growing significantly from the Republic of Korea and Japan.
Mussels
Global tradeInternational trade of mussels continues to be significant, with 276 900 tonnes imported by the top ten importing countries in 2014, which is roughly the same amount as the year before. Imports are dominated by nine European countries, which are responsible for 67% of global imports of mussels, mainly Mytilus edulis, Mytilus galloprovincialis and Mytilus chiliensis. Despite the slight drop in exports (-1.1% between 2013 and 2014), Chile remains the number one world exporter.
EUFor 2014, EU imports of mussels reached 198 100 tonnes, which is 4.2% lower compared with the yearly average recorded in the six year period (2009-2014). 2014 was actually the lowest year for imports during this period, with 2011 the peak year, recording imports of 224 700 tonnes. During this six year period, France was the highest importing country with a 27% market share followed by Italy (20% market share), Belgium (14%) and the Netherlands (13%). 2014 was unique in that France and Italy both increased their import volumes by 2.5% and 4% respectively. The Netherlands’ imports dropped significantly by 29.9% (-8 100 tonnes).
FranceOver the past six years (2009-2014), the performance of individual mussel suppliers to France has shifted dramatically. Indeed, Spain’s market share plummeted from 37% in 2009 to 25% in 2014, although the country
has remained the top supplier to the French market. The Netherlands kept its position as the second lead supplier, however its market share dropped from 28% to 23%. Chile challenged many of the more traditional suppliers, moving from a negligible position in 2009 (below the eighth supplier) to become the third lead exporter, increasing its supplies to France by 91 % from 2011 to 2014, up to a total of 10 100 tonnes.
In terms of domestic production, rope grown mussels produced by 30 producers in a specific part of Western France
Source: FAO
Oysters60%
Mussels24%
Scallops12%
Clams4%
bivalves production by species (2012)
imports/exportsmussel: World
2013 2014
(1 000 tonnes)
imPortsFrance 52.2 53.5
Italy 42.2 43.9
USA 32.2 33.9
Belgium 27.2 27.9
Spain 23.2 19.8
Netherlands 27.1 19.0
Germany 15.5 15.0
Russian Fed. 8.5 8.7
UK 5.7 6.0
Republic of Korea 4.6 4.5
total 277.0* 276.9*
eXPortsChile 64.9 64.2
Netherlands 47.2 50.2
Spain 47.6 48.6
New Zealand 28.7 33.1
Denmark 18.3 21.2
Canada 16.3 15.3
Italy 11.1 14.2
Greece 10.6 11.4
China 8.2 8.9
Ireland 12.8 8.0
UK 8.9 4.8
total 300.8 300.5*source: gtis * estimates

50 Globefish highlights April 2015
grown mussels tend to receive a premium. Retail prices of the specific Bouchot grown mussel have reached a historical peak, selling at nearly EUR 5 per kg.
ItalyItalian imports of mussels reached a record high in 2014 with 43 900 tonnes imported, a 23% increase compared with 35 800 tonnes, the annual average in the six year period (2009-2014). Spain, the major supplier, lost significant market share falling from 70% in 2009 to 53% in 2014. Greece, the second supplier to Italy, maintained its position and market share over the six year period, while Chile quickly grew as a supplier from 2012 onwards, capturing 18% of the market share in 2014.
Spain2014 Spanish imports of mussels stabilized at about 20 000 tonnes, which is the exact annual average during the six year period. Chile has been the dominant supplier since the beginning of the period and continued in this position taking a 60% market share in 2014. Italy, the far second supplier, took a 20% market share in 2014.
IrelandDuring September-November of 2014, the coast of Ireland was impacted by a bloom of common and toxic algae, dynophysis, or more commonly known as red tide. Affected mussels were unfit for human consumption and therefore could not be harvested until they naturally spawned in March. This resulted in a halt in sales, which directly impacted two dozen companies, which employ some 200 workers.
(Charente Maritime) will be awarded the well-known quality food label, Label Rouge, for the May-October 2015 season. The French market is highly segmented, and domestically
imports/exportsclam/cockle/ark shell
2013 2014
(1 000 tonnes)
imPortsRepublic of Korea 61.4 73.0Japan 72.4 65.8Spain 25.5 30.3USA 22.4 23.3Portugal 10.0 12.2Italy 6.8 8.4Thailand 7.3 7.7China 8.1 7.5Singapore 5.6 5.3Canada 3.6 3.7Hong Kong SAR 3.3 3.5Taiwan PC 3.8 1.8Ukraine 6.7 0.0
total 243.3* 254.8*
eXPortsChina 144.9 154.8Republic of Korea 11.5 11.7Portugal 6.6 9.5USA 9.8 9.2Italy 9.4 9.1Canada 8.7 9.1Thailand 8.7 7.2Netherlands 5.6 7.0UK 3.2 4.2Chile 3.0 3.8Taiwan PC 2.9 0.7total 227.6 2 41*source: gtis * estimates
importsmussels: eU-28
2009 2010 2011 2012 2013 2014
(1 000 tonnes)France 55.8 63.3 60.2 54.7 52.2 53.5Italy 41.4 37.1 37.8 41.5 42.2 43.9Belgium 29.9 29.6 28.3 28.1 27.2 27.9Netherlands 22.7 23.3 35.7 28.3 27.1 19.0Spain 15.4 17.9 25.4 18.1 23.2 19.8Germany 16.0 14.3 16.8 21.4 15.5 15.0UK 5.9 6.8 7.2 6.2 5.7 6.0Portugal 3.0 3.0 4.2 2.7 4.0 3.4Others 12.3 9.1 9.1 8.5 4.3 9.6total 202.4 204.5 224.7 209.3 201.4 198.1source: eUrostat and customs
4.98
3.0 3.5 4.0 4.5 5.0 5.5 6.0
Monthly average consumer prices in metropolitan France
EUR/kg
MUSSEL BOUCHOT - in France - Source Insee
source: european Price report
importsmussels: spain
2009 2010 2011 2012 2013 2014
(1 000 tonnes)Chile 8.8 10.7 18.2 11.4 14.8 11.8
Italy 1.0 1.2 1.5 2.7 4.0 3.9
New Zealand 2.1 2.5 2.9 1.7 1.3 1.4
France 1.5 2.3 1.6 1.8 2.0 1.3
Others 1.9 1.3 1.1 0.5 1.1 1.4
total 15.4 17.9 25.4 18.1 23.2 19.8
source: agencia tributaria
BIVALVES
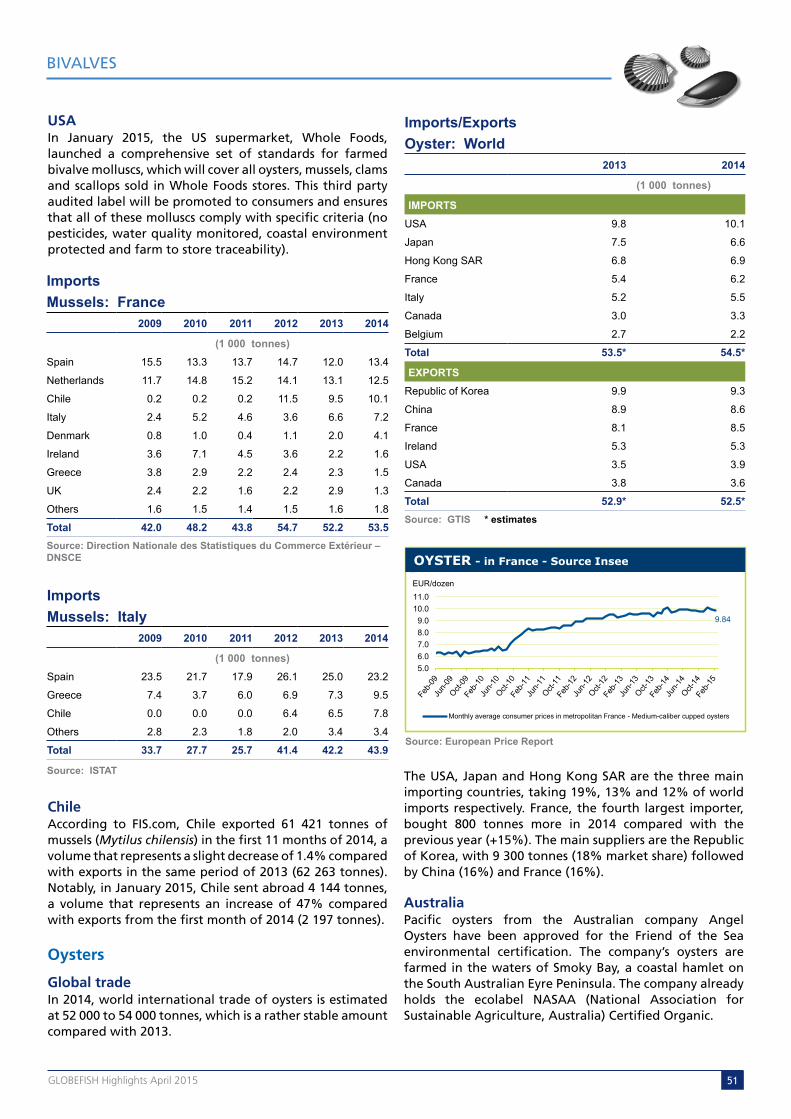
51Globefish highlights April 2015
BIVALVES
USAIn January 2015, the US supermarket, Whole Foods, launched a comprehensive set of standards for farmed bivalve molluscs, which will cover all oysters, mussels, clams and scallops sold in Whole Foods stores. This third party audited label will be promoted to consumers and ensures that all of these molluscs comply with specific criteria (no pesticides, water quality monitored, coastal environment protected and farm to store traceability).
ChileAccording to FIS.com, Chile exported 61 421 tonnes of mussels (Mytilus chilensis) in the first 11 months of 2014, a volume that represents a slight decrease of 1.4% compared with exports in the same period of 2013 (62 263 tonnes). Notably, in January 2015, Chile sent abroad 4 144 tonnes, a volume that represents an increase of 47% compared with exports from the first month of 2014 (2 197 tonnes).
Oysters
Global tradeIn 2014, world international trade of oysters is estimated at 52 000 to 54 000 tonnes, which is a rather stable amount compared with 2013.
The USA, Japan and Hong Kong SAR are the three main importing countries, taking 19%, 13% and 12% of world imports respectively. France, the fourth largest importer, bought 800 tonnes more in 2014 compared with the previous year (+15%). The main suppliers are the Republic of Korea, with 9 300 tonnes (18% market share) followed by China (16%) and France (16%).
Australia Pacific oysters from the Australian company Angel Oysters have been approved for the Friend of the Sea environmental certification. The company’s oysters are farmed in the waters of Smoky Bay, a coastal hamlet on the South Australian Eyre Peninsula. The company already holds the ecolabel NASAA (National Association for Sustainable Agriculture, Australia) Certified Organic.
importsmussels: france
2009 2010 2011 2012 2013 2014
(1 000 tonnes)Spain 15.5 13.3 13.7 14.7 12.0 13.4
Netherlands 11.7 14.8 15.2 14.1 13.1 12.5
Chile 0.2 0.2 0.2 11.5 9.5 10.1
Italy 2.4 5.2 4.6 3.6 6.6 7.2
Denmark 0.8 1.0 0.4 1.1 2.0 4.1
Ireland 3.6 7.1 4.5 3.6 2.2 1.6
Greece 3.8 2.9 2.2 2.4 2.3 1.5
UK 2.4 2.2 1.6 2.2 2.9 1.3
Others 1.6 1.5 1.4 1.5 1.6 1.8
total 42.0 48.2 43.8 54.7 52.2 53.5source: direction nationale des statistiques du commerce extérieur – dnsce
importsmussels: italy
2009 2010 2011 2012 2013 2014
(1 000 tonnes)Spain 23.5 21.7 17.9 26.1 25.0 23.2
Greece 7.4 3.7 6.0 6.9 7.3 9.5
Chile 0.0 0.0 0.0 6.4 6.5 7.8
Others 2.8 2.3 1.8 2.0 3.4 3.4
total 33.7 27.7 25.7 41.4 42.2 43.9
source: istat
9.84
5.0 6.0 7.0 8.0 9.0
10.0 11.0
Monthly average consumer prices in metropolitan France - Medium-caliber cupped oysters
EUR/dozen
OYSTER - in France - Source Insee
source: european Price report
imports/exportsoyster: World
2013 2014
(1 000 tonnes)
imPortsUSA 9.8 10.1
Japan 7.5 6.6
Hong Kong SAR 6.8 6.9
France 5.4 6.2
Italy 5.2 5.5
Canada 3.0 3.3
Belgium 2.7 2.2
total 53.5* 54.5*
eXPortsRepublic of Korea 9.9 9.3
China 8.9 8.6
France 8.1 8.5
Ireland 5.3 5.3
USA 3.5 3.9
Canada 3.8 3.6
total 52.9* 52.5*source: gtis * estimates
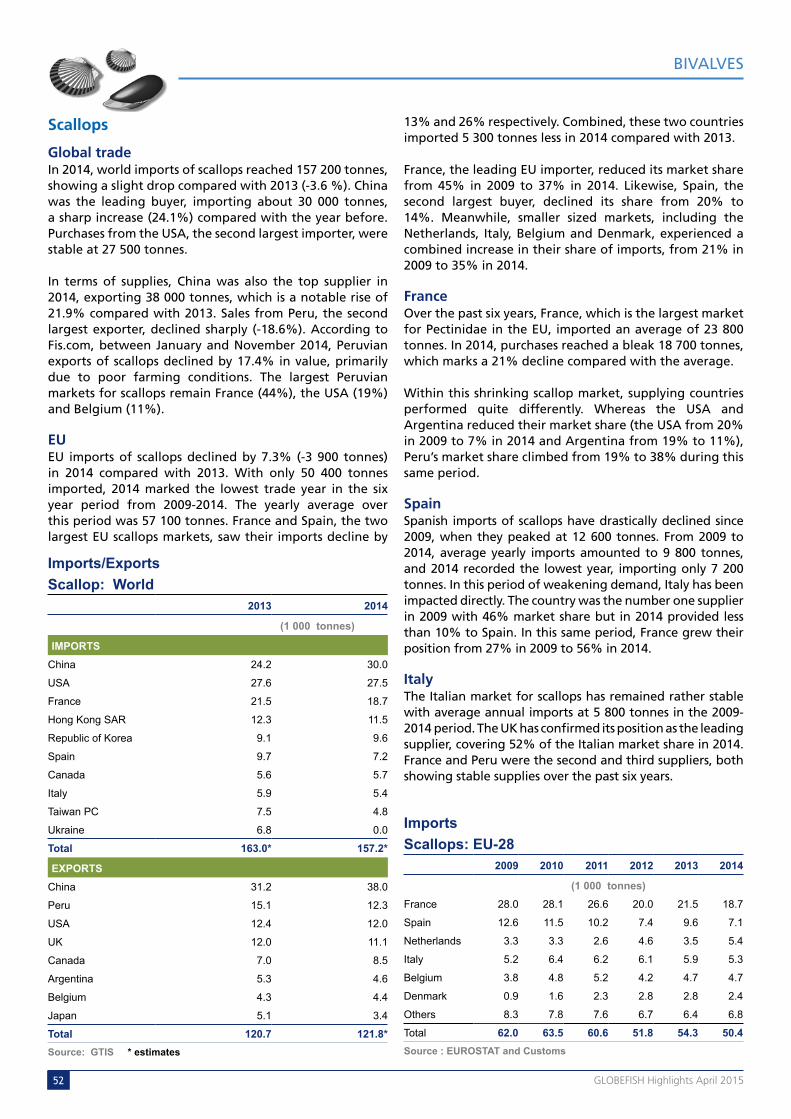
52 Globefish highlights April 2015
Scallops
Global tradeIn 2014, world imports of scallops reached 157 200 tonnes, showing a slight drop compared with 2013 (-3.6 %). China was the leading buyer, importing about 30 000 tonnes, a sharp increase (24.1%) compared with the year before. Purchases from the USA, the second largest importer, were stable at 27 500 tonnes.
In terms of supplies, China was also the top supplier in 2014, exporting 38 000 tonnes, which is a notable rise of 21.9% compared with 2013. Sales from Peru, the second largest exporter, declined sharply (-18.6%). According to Fis.com, between January and November 2014, Peruvian exports of scallops declined by 17.4% in value, primarily due to poor farming conditions. The largest Peruvian markets for scallops remain France (44%), the USA (19%) and Belgium (11%).
EUEU imports of scallops declined by 7.3% (-3 900 tonnes) in 2014 compared with 2013. With only 50 400 tonnes imported, 2014 marked the lowest trade year in the six year period from 2009-2014. The yearly average over this period was 57 100 tonnes. France and Spain, the two largest EU scallops markets, saw their imports decline by
13% and 26% respectively. Combined, these two countries imported 5 300 tonnes less in 2014 compared with 2013.
France, the leading EU importer, reduced its market share from 45% in 2009 to 37% in 2014. Likewise, Spain, the second largest buyer, declined its share from 20% to 14%. Meanwhile, smaller sized markets, including the Netherlands, Italy, Belgium and Denmark, experienced a combined increase in their share of imports, from 21% in 2009 to 35% in 2014.
FranceOver the past six years, France, which is the largest market for Pectinidae in the EU, imported an average of 23 800 tonnes. In 2014, purchases reached a bleak 18 700 tonnes, which marks a 21% decline compared with the average.
Within this shrinking scallop market, supplying countries performed quite differently. Whereas the USA and Argentina reduced their market share (the USA from 20% in 2009 to 7% in 2014 and Argentina from 19% to 11%), Peru’s market share climbed from 19% to 38% during this same period.
SpainSpanish imports of scallops have drastically declined since 2009, when they peaked at 12 600 tonnes. From 2009 to 2014, average yearly imports amounted to 9 800 tonnes, and 2014 recorded the lowest year, importing only 7 200 tonnes. In this period of weakening demand, Italy has been impacted directly. The country was the number one supplier in 2009 with 46% market share but in 2014 provided less than 10% to Spain. In this same period, France grew their position from 27% in 2009 to 56% in 2014.
ItalyThe Italian market for scallops has remained rather stable with average annual imports at 5 800 tonnes in the 2009-2014 period. The UK has confirmed its position as the leading supplier, covering 52% of the Italian market share in 2014. France and Peru were the second and third suppliers, both showing stable supplies over the past six years.
importsscallops: eU-28
2009 2010 2011 2012 2013 2014
(1 000 tonnes)France 28.0 28.1 26.6 20.0 21.5 18.7
Spain 12.6 11.5 10.2 7.4 9.6 7.1
Netherlands 3.3 3.3 2.6 4.6 3.5 5.4
Italy 5.2 6.4 6.2 6.1 5.9 5.3
Belgium 3.8 4.8 5.2 4.2 4.7 4.7
Denmark 0.9 1.6 2.3 2.8 2.8 2.4
Others 8.3 7.8 7.6 6.7 6.4 6.8
Total 62.0 63.5 60.6 51.8 54.3 50.4source : eUrostat and customs
imports/exportsscallop: World
2013 2014
(1 000 tonnes)
imPortsChina 24.2 30.0
USA 27.6 27.5
France 21.5 18.7
Hong Kong SAR 12.3 11.5
Republic of Korea 9.1 9.6
Spain 9.7 7.2
Canada 5.6 5.7
Italy 5.9 5.4
Taiwan PC 7.5 4.8
Ukraine 6.8 0.0
total 163.0* 157.2*
eXPortsChina 31.2 38.0
Peru 15.1 12.3
USA 12.4 12.0
UK 12.0 11.1
Canada 7.0 8.5
Argentina 5.3 4.6
Belgium 4.3 4.4
Japan 5.1 3.4
total 120.7 121.8*source: gtis * estimates
BIVALVES

53Globefish highlights April 2015
BIVALVES
USAAccording to estimates from the National Marine Fisheries Service (NMFS), the supply of US sea scallops in 2015 will increase by 37 to 40% compared with 2014. Findings noted that “from 1 March 2015 to 28 February 2016, the supply of US sea scallops is set to increase from around 32-35 million lbs in 2014 to 46-48 million lbs in 2015” (Source: Undercurrent News). However, this forecasted increase, which has not been made official by American authorities, is being questioned by large-scale private operators, namely Eastern Fisheries and Oceans Fleet Fisheries.
JapanAccording to Seafood.com, the major fishery cooperatives in Northern Japan are reporting that in 2015, landings of scallops in the Sea of Okhotsk will decrease. Production estimates, including both wild and cultured scallops, are around 284 000 tonnes, reflecting a 12% drop compared with 2014’s production of 322 000 tonnes.
Clams, cockles, ark shells
The international trade for clams, cockles and ark shells has slightly increased in 2014 compared with 2013, with total imports growing by 4.7% to reach 254 800 tonnes.
The Republic of Korea, the number one importer in this market, purchased 73 000 tonnes in 2014, an 18.9% increase over the previous year. Japan and the Republic of Korea import over half of the world’s total imports (54%).
China is the unbeatable exporter in this market, with 154 800 tonnes sold in 2014, representing 64% of global exports of these molluscs. The Republic of Korea is the second largest supplier, though it provides no more than 5% of the world market share.
Outlook
An increasing amount of farmed and wild bivalve products complying with quality or environmental standards will be sold on the market in 2015. Labelling may possibly lift prices and help the economic situation of producers in this period of high competition and losses due to climate change. As evidenced in recently published scientific findings, ocean acidification remains a significant potential threat for marine bivalves.
R E C E N T N E W S
Ocean acidification
In an article published in the journal Nature Climate Change in January 2015, 17 authors from
13 academic, government and environmental institutions, analysed how shellfisheries in 15 states in the USA are likely to be impacted by ocean acidification. The results demonstrate that 16 out of 23 US regions analysed are exposed to rapid ocean acidification. Scientists also examined how shellfisheries can adapt to these potentially harmful changes, with recommendations including reducing local nitrogen pollution in rivers along the coasts and raising shellfish where the ocean is less affected (Source: Ekstrom, J., et al. 2015).
Source: ASC press release
importsscallops: italy
2008 2009 2010 2011 2012 2013
(1 000 tonnes)UK 2.4 2.5 3.0 3.6 3.3 2.8
France 1.1 0.8 1.2 0.9 0.9 1.0
Peru 0.5 0.5 0.5 0.5 0.5 0.6
Denmark 0.1 0.1 0.2 0.2 0.2 0.2
Greece 0.1 0.1 0.3 0.3 0.3 0.1
Others 1.4 1.1 1.2 0.6 0.8 0.7
total 5.6 5.2 6.4 6.1 5.9 5.4
source: istat
importsscallops: spain
2009 2010 2011 2012 2013 2014
(1 000 tonnes)France 3.3 3.6 3.8 2.1 5.5 4.0
UK 1.0 1.3 1.2 1.8 1.5 1.1
Italy 5.8 4.1 3.0 1.9 1.3 0.7
Others 2.4 2.5 2.2 1.8 1.4 1.4
total 12.6 11.5 10.2 7.5 9.7 7.2
source: agencia tributaria
importsscallops: france
2009 2010 2011 2012 2013 2014
(1 000 tonnes)Peru 5.3 8.0 6.9 3.8 6.0 7.1
UK 4.6 4.0 4.4 4.1 5.1 4.0
Argentina 5.3 6.0 5.5 4.1 3.6 2.0
Canada 1.6 1.7 1.3 1.0 1.5 1.5
USA 5.5 3.6 4.4 3.4 2.6 1.3
Ireland 0.3 0.4 0.4 0.5 0.7 0.6
Others 5.4 4.5 3.8 3.1 1.9 2.2
total 28.0 28.1 26.6 20.0 21.5 18.7source: direction nationale des statistiques du commerce extérieur – dnsce

54 Globefish highlights April 2015
EU
After the USA, the second major market for lobster is the EU. Roughly 23 000 tonnes of lobster are imported into the EU annually, mainly from the USA and Canada. In recent years, the slight decline in US imports has been balanced by stronger shipments from Canada. While in the past some Canadian lobster passed through the USA to be re-exported to the EU market, this trade is now done directly. The recent EU-Canadian free trade agreement is expected to further develop direct trade links between the two countries, with more Canadian lobster expected to reach the EU market in coming years.
Other notable developments for 2014 include Iceland replacing Cuba as the number three exporting country, with Iceland providing over 1 000 tonnes to the EU market. Cuba, which has always been a major supplier to the EU in view of the US embargo on Cuban products, declined its exports to below 600 tonnes for 2014. Some of this decline is due to stringent management measures, but it is also likely that a portion of Cuban lobster is now
LOBSTER
2014 a positive year for lobster trade with demand expected to further strengthen in the USA and EU
Lobster is one of the most expensive fishery products entering international trade. The average unit value is USD 20 per kg, while for shrimp it is around USD 10 per kg
and for finfish it is below USD 5 per kg. Although overall world production of lobster is negligible when compared to finfish or shrimp, this notable price premium demonstrates the significance of the species, especially pertaining to livelihood opportunities. Indeed, in the Caribbean, more than 100 000 fishers concentrate on lobster, and in some fishing communities it is the only means of livelihood.
Supplies
In late 2014, the lobster research community of the Caribbean met in Panama City to evaluate the status of the lobster resource in the Western Central Atlantic areas. Overall, their findings of the stock were positive, with scientists indicating that recent efforts to improve the management of the resource are working. In some areas, the stock can now be evaluated as fully exploited, which is an improvement over the previous over-exploited level. Closing seasons and establishing fishing sanctuaries have proved to be the most efficient management measures. However, challenges to management remain. Some Caribbean countries have failed to impose a moratorium on assisted diving, a fishing method that takes the lives of several hundred fishermen each year. The impact of making this fishing method illegal, which would result in thousands of unemployed people, was considered a socioeconomic non-viable option.
Lobster fisheries in the USA and Canada have been well managed for several decades through establishing a minimum size system.
USA
For 2014, the value of US lobster imports reached a new record of over USD 1 billion. This represents an 8% increase over the 2013 value with strong growth exclusively fuelled by Canadian lobster exports, which dominate the US market by over 85%. Countries harvesting lobster from Caribbean waters represent about 10% of US lobster imports in value terms, but these countries did not report any significant growth in exports during 2014. Lobster imports into the US market also grew in terms of volume, reaching an all time record high of 53 000 tonnes for 2014, an 8% increase compared with the previous year. Canada managed to increase its lobster exports by 10% from 40 000 tonnes to over 44 000 tonnes from 2013 to 2014. The Caribbean countries reported stable exports of lobsters to the US market during the period under review. The unit value of lobster in the US market is high at USD 20 per kg, with some lobster from Caribbean countries fetching more than USD 30 per kg.
importslobster: Usa
2009 2010 2011 2012 2013 2014
(1 000 tonnes)Canada 30.0 33.5 35.6 38.4 40.3 44.6
Nicaragua 1.4 1.5 1.8 1.7 1.7 1.6
Brazil 2.1 3.1 2.2 1.5 1.7 1.6Honduras 1.3 0.1 1.7 1.7 1.4 1.3Bahamas 1.8 1.7 1.4 1.8 1.5 1.2China 0.6 1.1 0.6 0.6 0.8 0.9South Africa 0.5 0.4 0.3 0.3 0.6 0.4
Australia 0.7 0.5 0.4 0.2 0.2 0.2
Belize 0.1 0.2 0.3 0.2 0.2 0.2
Dominican Rep. 0.1 0.2 0.3 0.3 0.3 0.2
Others 1.5 3.2 1.4 1.1 1.6 1.1
total 40.1 45.5 46.0 47.8 50.3 53.3source: nmfs
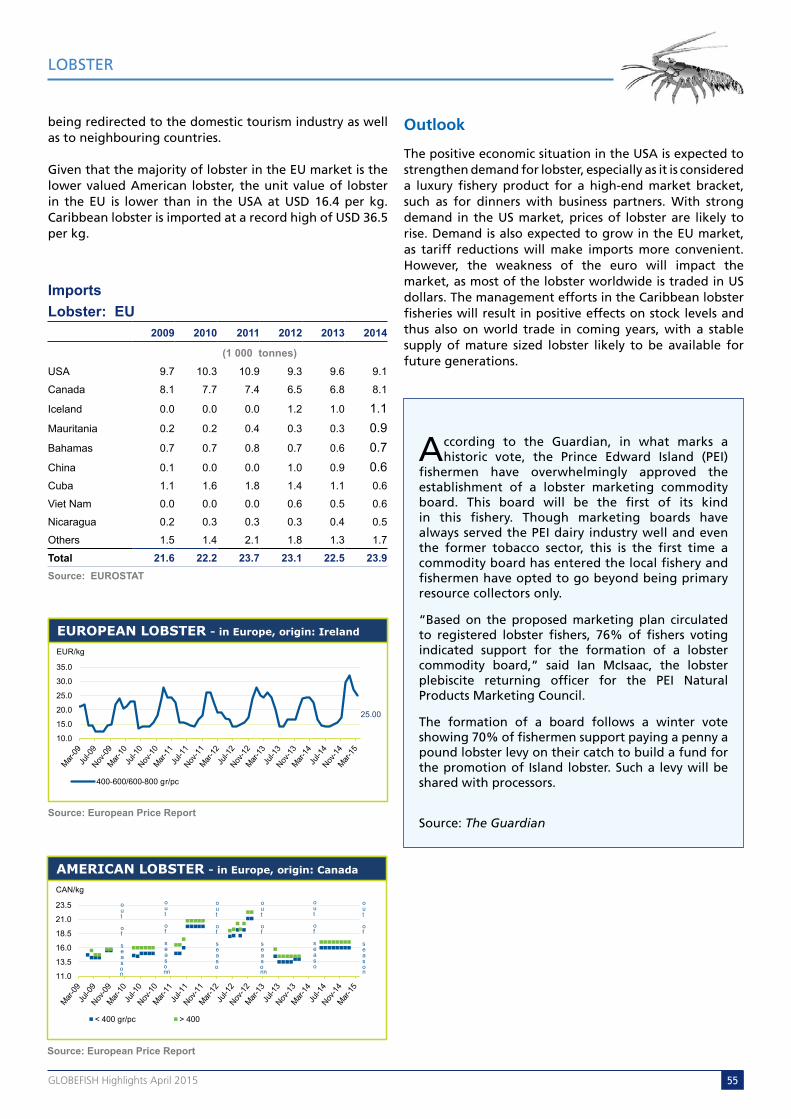
55Globefish highlights April 2015
LOBSTER
being redirected to the domestic tourism industry as well as to neighbouring countries.
Given that the majority of lobster in the EU market is the lower valued American lobster, the unit value of lobster in the EU is lower than in the USA at USD 16.4 per kg. Caribbean lobster is imported at a record high of USD 36.5 per kg.
25.00
10.0
15.0
20.0
25.0
30.0
35.0
400-600/600-800 gr/pc
EUR/kg
EUROPEAN LOBSTER - in Europe, origin: Ireland
source: european Price report
Outlook
The positive economic situation in the USA is expected to strengthen demand for lobster, especially as it is considered a luxury fishery product for a high-end market bracket, such as for dinners with business partners. With strong demand in the US market, prices of lobster are likely to rise. Demand is also expected to grow in the EU market, as tariff reductions will make imports more convenient. However, the weakness of the euro will impact the market, as most of the lobster worldwide is traded in US dollars. The management efforts in the Caribbean lobster fisheries will result in positive effects on stock levels and thus also on world trade in coming years, with a stable supply of mature sized lobster likely to be available for future generations.
According to the Guardian, in what marks a historic vote, the Prince Edward Island (PEI)
fishermen have overwhelmingly approved the establishment of a lobster marketing commodity board. This board will be the first of its kind in this fishery. Though marketing boards have always served the PEI dairy industry well and even the former tobacco sector, this is the first time a commodity board has entered the local fishery and fishermen have opted to go beyond being primary resource collectors only.
“Based on the proposed marketing plan circulated to registered lobster fishers, 76% of fishers voting indicated support for the formation of a lobster commodity board,” said Ian McIsaac, the lobster plebiscite returning officer for the PEI Natural Products Marketing Council.
The formation of a board follows a winter vote showing 70% of fishermen support paying a penny a pound lobster levy on their catch to build a fund for the promotion of Island lobster. Such a levy will be shared with processors.
Source: The Guardian
importslobster: eU
2009 2010 2011 2012 2013 2014
(1 000 tonnes)USA 9.7 10.3 10.9 9.3 9.6 9.1
Canada 8.1 7.7 7.4 6.5 6.8 8.1
Iceland 0.0 0.0 0.0 1.2 1.0 1.1Mauritania 0.2 0.2 0.4 0.3 0.3 0.9Bahamas 0.7 0.7 0.8 0.7 0.6 0.7China 0.1 0.0 0.0 1.0 0.9 0.6Cuba 1.1 1.6 1.8 1.4 1.1 0.6
Viet Nam 0.0 0.0 0.0 0.6 0.5 0.6
Nicaragua 0.2 0.3 0.3 0.3 0.4 0.5
Others 1.5 1.4 2.1 1.8 1.3 1.7
total 21.6 22.2 23.7 23.1 22.5 23.9source: eUrostat
11.0
13.5
16.0
18.5
21.0
23.5
< 400 gr/pc > 400
out of season nn nn n
CAN/kg
AMERICAN LOBSTER - in Europe, origin: Canada
out of seaso
out of seaso
out of seaso
out of seaso
out of seaso
source: european Price report
56 Globefish highlights April 2015
SPECIAL FEATURE
Celebrating 20 years of the Code of Conduct for Responsible Fisheries
The Code of Conduct for Responsible Fisheries (CCRF) celebrates its twentieth anniversary this year. Drafted
by 170 nations, negotiated at the Food and Agriculture Organization of the United Nations (FAO), and adopted unanimously by member states at the FAO Conference on 31 October 1995, the CCRF lays forth principles and standards for national and international efforts to ensure sustainable exploitation of aquatic living resources in harmony with the environment.
Though much has changed over the past 20 years, and additional agreements and measures have been adopted to support the CCRF, it remains a remarkably robust, forward-looking and key instrument to achieving sustainable fisheries and aquaculture.
Most countries are applying fisheries policies and legislation compatible with the CCRF, and FAO is assisting other nations to more closely align their policies and legislation with these principles and standards.
Safeguarding our marine resources through Blue Growth
In addition to the CCRF’s crucial role in creating key agreements and measures to achieving sustainable fisheries and aquaculture, it also serves as the foundation for the recent FAO-supported Blue Growth initiative, which will serve as a platform for many fisheries-related activities in the years to come.
Blue Growth is a coherent approach for the sustainable, integrated and socio-economically sensitive management of oceans and wetlands, focusing on capture fisheries, aquaculture, ecosystem services, trade and social protection of coastal communities. This initiative is innovative in that it focuses on the relevance of the CCRF in a larger context, beyond the traditional fisheries sector, with a greater emphasis on the related social, economic and environmental issues of fisheries and aquaculture.
How fish can feed a growing planet
The CCRF is also a key instrument in helping to meet the challenges of strengthening the fisheries sector to play a significant role in ensuring food security for a world population expected to reach 9 billion by 2050.
As illustrated in the 2014 State of World Fisheries and Aquaculture (SOFIA):• World capitafish consumptionhas increased froman
average of 9.9 kg in the 1960s to almost 20 kg today. • Fishprovidesmorethan2.9billionpeoplewithabout
20% or more of their animal protein, and 4.3 billion people with about 15% of such proteins.
• In 2012, just over 156 million tonnes of fish weresupplied globally. By 2030, FAO estimates place fish demand at slightly more than 261 million tonnes. That is a supply-demand gap projection of over 100 million additional tonnes of fish product needed to meet the expected demand by 2030.
How can this increased demand be satisfied while still guaranteeing the sustainability of the fisheries sector, as outlined in the CCRF? This will be the main challenge over the coming decades.
Below are some areas in which the CCRF has been essential and pivotal in the past 20 years, and will continue to work over the coming decades to address this challenge.
Combating Illegal, Unreported and Unregulated (IUU) fishing
The CCRF made clear the role port states play in supporting its objectives. A key measure adopted in 2009 to support their role is the Agreement on Port State Measures to Prevent, Deter and Eliminate Illegal, Unreported and Unregulated Fishing. The Agreement aims to prevent illegally caught fish from entering international markets through ports.
Under the terms of the treaty, foreign vessels must provide advance notice and request permission for port entry. Countries are expected to conduct regular inspections and to deny the use of ports or port services to offending vessels. Information sharing networks are also envisaged. Thus far, 11 countries have ratified, accepted, approved, or accessed the Agreement, but that number must reach 25 for the treaty to enter into force.
Looking ahead, and considering the importance for consumers to ensure the traceability of their seafood products, the Port State Measures Agreement entering into force would be a crucial step forward to ensuring the sustainability of fish coming into the international market through ports, while further weakening the market for IUU fishing. Implementation of the Port State Measures Agreement and capacity development support to ratifying countries will be one important tool for combating illegal, unreported and unregulated fishing over the next two decades of the CCRF.
Protecting the rights of small-scale fishers
20 years ago, the CCRF recognized that those engaged in subsistence and small-scale fisheries should have access to a secure and just livelihood. Following a lengthy consultation process, the Voluntary Guidelines on the Responsible Governance of Tenure of Land, Fisheries

57Globefish highlights April 2015
CELEBRATING 20 YEARS OF THE CODE OF CONDUCT FOR RESPONSIBLE FISHERIES
and Forests in the Context of National Food Security was negotiated extensively and endorsed in May 2012 by the Committee on Food Security, comprising member countries, civil society organizations, and the private sector.
Two years later, in June 2014, the Committee on Fisheries, following an extensive consultation process involving over 4 000 people from over 100 countries, endorsed the Voluntary Guidelines for Securing Sustainable Small-Scale Fisheries in the Context of Food Security and Poverty Eradication (SSF Guidelines). These Guidelines complement the CCRF and provide a global consensus on small-scale fisheries governance and development. Based on a human rights approach, they not only address the key issues of fisheries tenure governance and management, but also social issues, decent work and employment, gender equality, climate change and disaster risk management.
For too long, small-scale fishers and their communities have been neglected and excluded from national, regional and global decision-making processes. The SSF Guidelines are the first international agreement aimed at protecting the rights of these key stakeholders. Looking ahead, it will be important to begin the work on implementation, ensuring that the rights of these small-scale fishers are upheld, and that they are enabled to fully contribute to achieving food security and poverty eradication.
Strengthening the world’s most widely traded food commodity
Seafood products are already among the most widely traded commodities in the world, with trade totaling around USD 145 billion per year. Well before the adoption of the CCRF, GLOBEFISH was established in 1984 to provide up-to-date information on markets and prices.
The work carried out by GLOBEFISH is highly relevant to the CCRF, especially to its Article 11 on post-harvest practices and trade. GLOBEFISH is committed to providing accurate and unbiased marketing and trade information to improve the fishery sector. Although it serves both private industry and government, a special emphasis is placed on ensuring that developing countries and countries in transition have the tools, knowledge, and information they need to compete globally.
Tackling food loss and waste
20 years ago, the CCRF addressed the need to minimize waste, which is a wider problem across the entire food value chain. Annually, it is estimated that roughly one-third of food produced for human consumption is lost or wasted globally, translating into about 1.3 billion tonnes per year. The environmental footprint of this loss is staggering, as production utilizes valuable land and water resources for food that never reaches the plates of consumers.
The fisheries sector also plays a significant role in this discussion, and serious efforts must be made to minimize waste and by-catch within the sector. In some areas of the world, the share of fish wasted in the value chain is estimated at as high as 20-30%. At a time when the demand for fish is rapidly increasing, these losses are unacceptable.
Progress has undoubtedly been made since the adoption of the CCRF, and today there is a greater consciousness to address this issue. Many parts of the fish that were previously seen as waste or byproducts in the past are now recognized as being rich in micronutrients, such as vitamins and minerals. For instance, the salmon industry is rapidly moving towards a “zero-waste strategy”, and has been highly successful. Salmon by-products are being used in fish silage. Additionally, bones, heads, and other fish parts are being crushed and processed into various products rich in minerals, proteins, and omega-3 fatty acids.
Projects in Africa and Latin America are producing nutrient-dense powder products by crushing bones of bigger fish, or whole smaller fish that are rich in these micronutrients. These powders have been tested in school feeding and other nutrition programmes, and serve as a needed boost of nutrients to vulnerable populations. There is scope to widen these projects as additional work is done to eliminate food loss and waste.
Looking ahead to the next 20 years
2015 marks the 20-year celebration of the CCRF, however it is clear that there are significant challenges the fisheries and aquaculture sectors will face over the next 20 years and beyond. The CCRF, its related instruments, and the new Blue Growth Initiative will be important tools in helping to ensure sustainable fisheries and aquaculture for future generations.
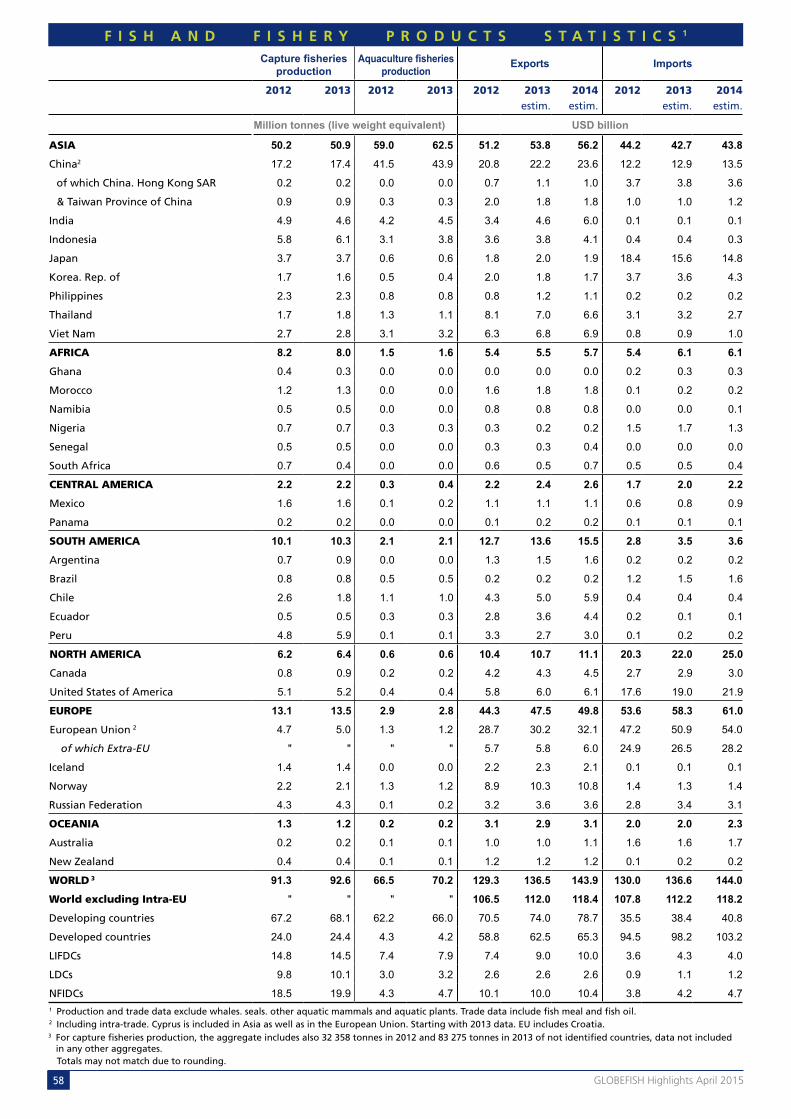
58 Globefish highlights April 2015
F I S H A N D F I S H E R Y P R O D U C T S S T A T I S T I C S 1
Capture fisheries production
Aquaculture fisheries production
exports imports
2012 2013 2012 2013 2012 2013 2014 2012 2013 2014estim. estim. estim. estim.
million tonnes (live weight equivalent) Usd billion
ASIA 50.2 50.9 59.0 62.5 51.2 53.8 56.2 44.2 42.7 43.8
China2 17.2 17.4 41.5 43.9 20.8 22.2 23.6 12.2 12.9 13.5
of which China. Hong Kong SAR 0.2 0.2 0.0 0.0 0.7 1.1 1.0 3.7 3.8 3.6
& Taiwan Province of China 0.9 0.9 0.3 0.3 2.0 1.8 1.8 1.0 1.0 1.2
India 4.9 4.6 4.2 4.5 3.4 4.6 6.0 0.1 0.1 0.1
Indonesia 5.8 6.1 3.1 3.8 3.6 3.8 4.1 0.4 0.4 0.3
Japan 3.7 3.7 0.6 0.6 1.8 2.0 1.9 18.4 15.6 14.8
Korea. Rep. of 1.7 1.6 0.5 0.4 2.0 1.8 1.7 3.7 3.6 4.3
Philippines 2.3 2.3 0.8 0.8 0.8 1.2 1.1 0.2 0.2 0.2
Thailand 1.7 1.8 1.3 1.1 8.1 7.0 6.6 3.1 3.2 2.7
Viet Nam 2.7 2.8 3.1 3.2 6.3 6.8 6.9 0.8 0.9 1.0
AFRICA 8.2 8.0 1.5 1.6 5.4 5.5 5.7 5.4 6.1 6.1
Ghana 0.4 0.3 0.0 0.0 0.0 0.0 0.0 0.2 0.3 0.3
Morocco 1.2 1.3 0.0 0.0 1.6 1.8 1.8 0.1 0.2 0.2
Namibia 0.5 0.5 0.0 0.0 0.8 0.8 0.8 0.0 0.0 0.1
Nigeria 0.7 0.7 0.3 0.3 0.3 0.2 0.2 1.5 1.7 1.3
Senegal 0.5 0.5 0.0 0.0 0.3 0.3 0.4 0.0 0.0 0.0
South Africa 0.7 0.4 0.0 0.0 0.6 0.5 0.7 0.5 0.5 0.4
CENTRAL AMERICA 2.2 2.2 0.3 0.4 2.2 2.4 2.6 1.7 2.0 2.2
Mexico 1.6 1.6 0.1 0.2 1.1 1.1 1.1 0.6 0.8 0.9
Panama 0.2 0.2 0.0 0.0 0.1 0.2 0.2 0.1 0.1 0.1
SOUTH AMERICA 10.1 10.3 2.1 2.1 12.7 13.6 15.5 2.8 3.5 3.6
Argentina 0.7 0.9 0.0 0.0 1.3 1.5 1.6 0.2 0.2 0.2
Brazil 0.8 0.8 0.5 0.5 0.2 0.2 0.2 1.2 1.5 1.6
Chile 2.6 1.8 1.1 1.0 4.3 5.0 5.9 0.4 0.4 0.4
Ecuador 0.5 0.5 0.3 0.3 2.8 3.6 4.4 0.2 0.1 0.1
Peru 4.8 5.9 0.1 0.1 3.3 2.7 3.0 0.1 0.2 0.2
NORTH AMERICA 6.2 6.4 0.6 0.6 10.4 10.7 11.1 20.3 22.0 25.0
Canada 0.8 0.9 0.2 0.2 4.2 4.3 4.5 2.7 2.9 3.0
United States of America 5.1 5.2 0.4 0.4 5.8 6.0 6.1 17.6 19.0 21.9
EUROPE 13.1 13.5 2.9 2.8 44.3 47.5 49.8 53.6 58.3 61.0
European Union 2 4.7 5.0 1.3 1.2 28.7 30.2 32.1 47.2 50.9 54.0
of which Extra-EU " " " " 5.7 5.8 6.0 24.9 26.5 28.2
Iceland 1.4 1.4 0.0 0.0 2.2 2.3 2.1 0.1 0.1 0.1
Norway 2.2 2.1 1.3 1.2 8.9 10.3 10.8 1.4 1.3 1.4
Russian Federation 4.3 4.3 0.1 0.2 3.2 3.6 3.6 2.8 3.4 3.1
OCEANIA 1.3 1.2 0.2 0.2 3.1 2.9 3.1 2.0 2.0 2.3
Australia 0.2 0.2 0.1 0.1 1.0 1.0 1.1 1.6 1.6 1.7
New Zealand 0.4 0.4 0.1 0.1 1.2 1.2 1.2 0.1 0.2 0.2
WORLD 3 91.3 92.6 66.5 70.2 129.3 136.5 143.9 130.0 136.6 144.0
World excluding Intra-EU " " " " 106.5 112.0 118.4 107.8 112.2 118.2
Developing countries 67.2 68.1 62.2 66.0 70.5 74.0 78.7 35.5 38.4 40.8
Developed countries 24.0 24.4 4.3 4.2 58.8 62.5 65.3 94.5 98.2 103.2
LIFDCs 14.8 14.5 7.4 7.9 7.4 9.0 10.0 3.6 4.3 4.0
LDCs 9.8 10.1 3.0 3.2 2.6 2.6 2.6 0.9 1.1 1.2
NFIDCs 18.5 19.9 4.3 4.7 10.1 10.0 10.4 3.8 4.2 4.71 Production and trade data exclude whales. seals. other aquatic mammals and aquatic plants. Trade data include fish meal and fish oil. 2 Including intra-trade. Cyprus is included in Asia as well as in the European Union. Starting with 2013 data. EU includes Croatia. 3 For capture fisheries production, the aggregate includes also 32 358 tonnes in 2012 and 83 275 tonnes in 2013 of not identified countries, data not included
in any other aggregates. Totals may not match due to rounding.

59Globefish highlights April 2015

60 Globefish highlights April 2015

The GLOBEFISH Research Programme provides detailed analysis of selected markets, species and products of relevance in international fish trade. In addition, studies are published on specific issues of importance to the sector.
c I would like to order _____ copy(ies) of volume number _____________________ for a total of €_______
c By bank cheque in € made out to FAO GLOBEFISH for € _______________________
c By bank transfer in Euro to: FAO GLOBEFISH FAO Trust Fund (EUR) Bank Name: HSBC Bank, Plc 8 Canada Square London E14 5HQ, UK Swift/BIC: MIDLGB22 Account Number: 67115083 IBAN: GB04MIDL40051567115083
or By credit card: c Visa c MasterCard
Credit Card Number: ____________________ Expiry Date: _____________________
Signature: ______________________________ For € :__________________________
Please provide the following information:
NAME: ..........................................................................
COMPANY: ..................................................................
POSTAL ADDRESS: ....................................................
CITY: .............................................................................
COUNTRY: ...................................................................
TEL.: ..............................................................................
FAX: ..............................................................................
E-MAIL: .................................... @.................................
Date: ........./ ........./ .........
Glo
befis
h R
esea
rch
Prog
ram
me
Kindly return this form to:GLOBEFISH - FIPMFood and Agriculture Organization of the UNViale delle Terme di Caracalla, 00153 Rome, ItalyTel: (+39) 06 570 544163Fax: (+39) 06 570 53020E-mail: [email protected]
Research ProgrammeVol. 118 Sole: Production and markets Apr 2015 €30Vol. 117 The Seafood market in Japan Jan 2015 €30Vol. 116 The European market for bivalves other than mussels May 2014 €30Vol. 115 The European market for mussels April 2014 €30Vol. 114 Eel (Anguilla spp.): Production and trade * July 2014 ----Vol. 113 Exchange rates and the seafood trade* Jan 2014 €30Vol. 112 By-products of tuna processing Jul 2013 €30Vol .111 Technical guide to fish canning May 2013 €30Vol. 110 Innovative uses of fisheries by-products Feb 2013 €30Vol. 109 Seafood markets in Southern Africa Jan 2013 €30 Vol. 108 Risks and benefits of seafood consumption* Jan 2013 €30 Vol. 107 El eco-etiquetado de productos pesqueros en España Sep 2012 €30Vol. 106 El mercado de productos pesqueros en España Aug 2012 €30Vol. 105 The European market for shrimp Aug 2012 €30 Vol. 104 The Seafood Market in France Aug 2011 €30 Vol. 103 Turbot – Production Technology and Markets Feb 2011 €30 Vol. 102 The Ornamental Fish Trade Nov 2010 €40Vol. 101 Markets for Tilapia Jul 2010 €30Vol. 100 Importance of APEC in world fisheries and aquaculture Mar 2010 €30Vol. 99 Viet Nam - Seafood from Waterland Mar 2010 €30
* free electronic version available at www.globefish.org/globefish-research-programme.html

Food and Agriculture Organization of the United NationsFisheries and Aquaculture Policy and Economics DivisionProducts, Trade and Marketing BranchViale delle Terme di Caracalla00153 Rome - ITALYTel: +39 06 570 52884Fax: +39 06 570 53020E-mail: [email protected] site: www.globefish.org