West Coast Groundfish Observer Program
104
1
Transcript of West Coast Groundfish Observer Program
1
2
This document should be cited as follows: Jannot, J., Heery, E., Bellman, M.A., and J. Majewski. 2011. Estimated bycatch of marine mammals, seabirds, and sea turtles in the US west coast commercial groundfish fishery, 2002-2009. West Coast Groundfish Observer Program. National Marine Fisheries Service, NWFSC, 2725 Montlake Blvd E., Seattle, WA 98112. West Coast Groundfish Observer Program National Marine Fisheries Service Northwest Fisheries Science Center Fishery Resource Analysis and Monitoring Division 2725 Montlake Blvd E Seattle, WA 98112
3
TABLE OF CONTENTS
INTRODUCTION....................................................................................................4
Marine Mammal Protection Act ..............................................................4 Endangered Species Act ..........................................................................5 Migratory Bird Treaty Act .......................................................................5 West Coast Groundfish Fishery ...............................................................5 Groundfish Observer Programs ...............................................................6
METHODS ...............................................................................................................8
Designation of ‘take’ versus ‘non-take’ interactions ...............................8 Designation of strata ................................................................................9 Marine mammals .....................................................................................9 Seabirds..................................................................................................13 Sea turtles...............................................................................................15 Ratio estimator and bycatch estimates...................................................16 At-sea hake sector bycatch estimates.....................................................16 Non-hake sector bycatch estimates........................................................19 Sensitivity Analyses...............................................................................25
RESULTS & DISCUSSION..................................................................................25
SUMMARY AND CONCLUSIONS ....................................................................30
ACKNOWLEDGMENTS .....................................................................................31
REFERENCES.......................................................................................................32
4
INTRODUCTION
The marine ecosystem on the United States (US) west coast supports a diversity of marine mammals, seabirds, and sea turtles. For conservation and management purposes, it is important that various sources of mortality for these organisms be identified and their severity be evaluated. The distributions of marine mammals, seabirds, and sea turtles overlap with commercial fisheries operating within the US Exclusive Economic Zone (EEZ). One source of mortality that must be considered is bycatch in commercial fisheries, commonly referred to as incidental takes. This report summarizes interactions between the US west coast groundfish fishery (defined here as the U.S. Pacific coastal states of Washington, Oregon, and California) and marine mammals, seabirds, and sea turtles, and presents estimates of fleet-wide bycatch for these species based on data from federal observer programs and from the fishery as a whole from 2002 through 2009. Currently, there are three key environmental laws in the US that federally regulate actions concerning marine mammals, seabirds, and sea turtles: the Marine Mammal Protection Act (MMPA), the Endangered Species Act (ESA), and the Migratory Bird Treaty Act (MBTA). The MMPA explicitly protects marine mammals whereas the MBTA protects seabirds. The ESA is relevant to species identified as threatened or endangered and offers additional measures for protection of ESA-listed marine mammals and seabirds beyond the MMPA and MBTA. All sea turtles found in US waters are listed as threatened or endangered, and the ESA requires that bycatch of these species be minimized. Sea turtle bycatch is also addressed in the Magnuson-Stevens Fishery Conservation and Management Act (MSA), which governs federal commercial fisheries. Further details of the federal acts relating to marine mammal, seabird, and sea turtle bycatch are described below.
Marine Mammal Protection Act
The MMPA was passed in 1972 and amended in 1994. The Act states that marine mammal species and population stocks should not be permitted to diminish below their optimum sustainable population level and that measures must be taken to replenish depleted species or population stocks. Measures include reduction in the taking of marine mammals in US waters, by US citizens on the high seas, and through the importation of marine mammals and marine mammal products in the US. The MMPA contains specific provisions for reducing marine mammal bycatch in US commercial fisheries. Effects of US commercial fisheries on marine mammal populations are determined annually and reported in the List of Fisheries (LOF), which is published by the National Marine Fisheries Service (NMFS) as required by section 118 of the MMPA (16 USC 1387 (c) (1)). Each fishery is placed into one of three categories based on the level of marine mammal serious injury and mortality in the fishery; Category 1 has the highest injury/mortality level and Category III has the lowest injury/mortality level. The categorization process often relies on Marine Mammal Stock Assessment Reports (SAR) to provide the allowable biological removal of the stock that ensures a sustainable population is maintained. The categorization level of a fishery determines if compliance is required with particular provisions of the MMPA, including registration, observer coverage, and take reduction plans. Category I and Category II commercial fisheries are required to comply with MMPA provisions, while Category III commercial fisheries are not.
5
The US west coast groundfish fisheries included in this report are all classified as Category III commercial fisheries in the context of the MMPA, with the exception of the sablefish pot sector, which is designated as Category II (75 FR 68468).
Endangered Species Act
The ESA was passed in 1973 to protect and recover imperiled species and the ecosystems upon which they depend. Once a species is listed under the ESA, protective measures are authorized, which include restrictions on taking, transporting, or selling specimens. NOAA fisheries has jurisdiction over approximately 60 marine and anadromous species that are listed as either threatened or endangered under the ESA (www.nmfs.noaa.gov/pr/species/esa/). These include 9 marine mammal species and 4 sea turtle species known to occur along on the west coast. The US Fish and Wildlife Service (USFWS) manages the protection of seabird species listed under the ESA (www.fws.gov/endangered/). Table 1 presents a list of all marine mammal, sea turtle, and seabird species observed in the US west coast groundfish fishery, along with their ESA status as of December 2009.
Migratory Bird Treaty Act
The MBTA, passed in 1918, is the domestic law that affirms, or implements, the US’s commitment to four international conventions (with Canada, Japan, Mexico, and Russia) for the protection of a shared migratory bird resource. The MBTA decreed that all migratory birds and their parts (including eggs, nests, and feathers) are fully protected. Violation of the Act carries criminal penalties and to date, the Act has been applied to the area in US coastal waters extending 3 miles from shore.
West Coast Groundfish Fishery
The west coast groundfish fishery is a multi-species fishery that utilizes a variety of gear types. The fishery harvests species under the Pacific Coast Groundfish Fishery Management Plan (FMP) managed by the Pacific Fishery Management Council (2008). Over 80 species are designated as groundfish in the groundfish FMP, including a variety of rockfish, flatfish, roundfish, skates, and sharks (see Appendix A). These species are found in both federal and state waters. Groundfish are targeted and caught incidentally by trawl nets, hook-and-line gears, and fish pots. Sectors within the groundfish fishery can be defined based on gear type, target species, permits, or other regulatory factors. Under the FMP, the groundfish fishery is defined as consisting of four management components:
Limited Entry (LE) – The LE component includes all commercial fishers who hold a federal limited entry permit. The total number of limited entry permits available is capped and permitted vessels are allotted a larger portion of the total allowable catch for commercially desirable species than non-permitted vessels.

6
Open Access (OA) – The OA component includes commercial fishers who are not federally permitted. However, state agencies (California Department of Fish and Game and Oregon Department of Fish and Wildlife) have instituted permit programs for certain OA sectors.
Recreational – This component includes recreational anglers who target or catch
groundfish species. Tribal – This component includes native tribal commercial fishers in Washington state
that have treaty rights to fish groundfish. These four components can then be further subdivided into sectors based on gear type, target species, and various regulatory factors. Commercial LE and OA sectors have traditionally caught the largest quantities of groundfish and are observed by federal at-sea observer programs.
Groundfish Observer Programs
There are two federal observer programs that collect information aboard groundfish vessels on the US west coast. These are separate programs because they deal with distinctly different components of the groundfish fishery: the federally permitted sector targeting Pacific hake using mid-water trawl gear which processes catch at-sea, and federal and state permitted sectors targeting non-hake species that deliver shoreside. Observers were first deployed in the at-sea hake sector in the late 1970s under the management of the North Pacific Groundfish Observer Program at NOAA’s Alaska Fishery Science Center. The At-Sea Hake Observer Program (A-SHOP), now at NOAA’s Northwest Fisheries Science Center, places fishery observers on all vessels that process Pacific hake at-sea. The at-sea hake sector consists of eight to fourteen catcher-processor vessels and motherships that begin fishing in mid-May of each year and continue until the hake quota is reached or until bycatch caps are met. All at-sea hake vessels (catcher-processors and motherships) over 125 feet are required to carry two observers, while vessels under 125 feet carry only one. At-sea hake observers monitor and record catch data in accordance with protocols detailed in the A-SHOP manual (NWFSC 2008a). Non-hake groundfish sectors are observed by the West Coast Groundfish Observer Program (WCGOP), which was established in May 2001 by NOAA Fisheries (NMFS) in accordance with the Pacific Fishery Management Plan (50 CFR Part 660) (50 FR 20609). This regulation requires that all vessels that catch groundfish in the US EEZ from 3-200 miles offshore to carry an observer when notified to do so by NMFS or its designated agent. Subsequent state rule-making has extended NMFS’s ability to require that California and Oregon vessels, which only fish in the 0-3 mile state territorial zone, also carry observers. WCGOP observers are stationed along the US west coast from Bellingham, Washington to San Diego, California. The WCGOP’s goal is to improve estimates of total catch and discard by observing shoreside groundfish sectors along the US west coast. Originally, the WCGOP focused observer effort in the LE bottom trawl and LE fixed gear sectors. In 2002, the WCGOP began deploying observers in open access sectors while increasing its coverage of the LE bottom trawl sector. In 2005, the

7
WCGOP increased its coverage of the LE fixed gear sector, and in 2006, the WCGOP improved coverage of the nearshore sector. Currently, the WCGOP coverage goal is to maintain, at a minimum, 20% coverage in the LE bottom trawl and LE fixed gear fisheries by landings, while continuing to improve coverage in the open access sectors of the groundfish fishery. An observer coverage plan from the WCGOP is available at: www.nwfsc.noaa.gov/ research/divisions/fram/ observer/observersamplingplan.pdf. The A-SHOP and WCGOP programs provide coverage for the following fishery sectors:
At-sea Pacific hake catcher-processor At-sea Pacific hake mothership At-sea Pacific hake tribal Commercial LE non-midwater trawl Commercial LE non-midwater trawl – targeting California halibut Commercial OA non-midwater trawl – targeting California halibut Commercial fixed gear state-permitted nearshore (Oregon/California) Commercial fixed gear LE sablefish primary (tier endorsed) Commercial fixed gear LE non-primary sablefish (non-endorsed and daily trip limit
sectors) Commercial fixed gear OA daily trip limit Commercial state-permitted shrimp trawl
More information on each of these sectors is available in annual reports produced by the A-SHOP and WCGOP (www.nwfsc.noaa.gov/research/divisions/fram/observer/). For a list of groundfish sectors that are not covered by either program, see the description of observer coverage in the annual report on estimated total mortality of groundfish species (Bellman et al. 2010). The data collected by A-SHOP and WCGOP on marine mammals, seabirds and sea turtles is described in further detail in the Methods section below. Although interactions between the groundfish fleet and protected resource species appear to be infrequent, the data collected by observers represent the primary source of information available on fishery-induced marine mammal, seabird, and sea turtle mortality. Bycatch estimates derived from at-sea observations provide insight into the level of human-induced mortality that might be influencing marine mammal, seabird, and sea turtle populations. As such, they are important for both management and stock assessment purposes. The purpose of this report is to provide estimates of bycatch for marine mammals, seabirds, and sea turtles in the US west coast groundfish fishery from 2002 through 2009. In addition, it presents a summary of observed incidental takes by year and fishery, and attempts to demonstrate some of the temporal and spatial characteristics of the data. Two previous reports on the bycatch of marine mammals and seabirds in the groundfish fishery were published: one which utilized A-SHOP data from 2002-2006 and WCGOP data from 2002-2005 (NWFSC 2008b) and one which utilized A-SHOP and WCGOP data from 2002-2008 (Heery et al. 2010). This report updates the 2002-2008 report with 2009 data.
8
METHODS
We used a deterministic approach to estimate bycatch of marine mammals, seabirds, and sea turtles in all west coast groundfish fisheries for which observer data are available. Using this approach, the total number of observed takes for each species was stratified temporally and spatially, and then summarized in relation to observed catch. For fishery sectors in which there was less than 100% observer coverage or in which not all observed hauls were monitored for protected resources, observed takes were then expanded to the fleet-wide level based on total fleet catch or landings. Bycatch estimates were only provided when the coinciding strata-specific coefficient of variation (CV) was less than 80%. These techniques and the information used in their development and implementation are described in further detail below.
Designation of ‘take’ versus ‘non-take’ interactions
At-sea hake observer data from 2002-2009 recorded all seabird and marine mammal specimens as mortalities. However, WCGOP observers recorded a variety of fishery interactions with marine mammals, seabirds, and turtles. A standard system for recording interactions is used by both observer programs and includes the following interaction categories: a) killed by gear, b) killed by propeller, c) previously dead, d) lethal removal (trailing gear), e) lethal removal (not trailing gear), f) entangled in gear (trailing gear), g) entangled in gear (not trailing gear), h) feeding on catch, i) deterrence used, j) boarded vessel, k) other, and l) unknown. For all species, any specimen that was noted by the observer to have been killed by fishing gear (a), killed by propeller (b), or killed by means of a ‘lethal removal’ (d, e) was designated as a take. Lethal removals included any scenario in which the animal was killed by vessel personnel. For the remainder of these interactions (f-l) observer notes were consulted. For most interactions, the observer notes clearly indicated that the interaction resulted in the mortality of the animal and these interactions were designated as ‘takes’ prior to further analysis. In other cases, however, the outcome of the interaction was not as clear. To designate each of these interactions as a ‘take’ or ‘non-take’, we relied upon the legal definitions for a ‘take’ whenever possible. In some cases, further technical guidance was available to inform this designation. Although the protocol for designating a ‘take’ differed for different species, the most conservative possible scenario was assumed in all cases. Under the Marine Mammal Protection Act, a ‘take’ is defined as any act that harasses, hunts, captures, or kills, or attempts to harass, hunt, capture, or kill a marine mammal. While commercial fisheries are granted an exemption on the prohibition of ‘takes’ under the MMPA, the Act tasks NMFS with managing serious injuries and mortalities of marine mammals from bycatch in commercial fishing operations. We therefore defined ‘takes’ of marine mammals to include all interactions that resulted in a mortality or serious injury. Explicit detail of what constitutes a serious injury is not provided in the MMPA, but further guidance was developed by Andersen et al.(2008). Table 2 presents their recommendations for the designation of serious injuries for large cetaceans, small cetaceans, and pinnipeds under 33 different scenarios. These guidelines were applied directly to WCGOP data to resolve cases in which the animal was injured, but it was unclear whether the animal died as a result of its injury.
9
When the recommendations from Andersen et al. (2008) were applied, results included serious injury designations for 7 California sea lions, 2 stellar sea lions, 2 harbor seals, 1 sperm whale and 1 bottlenose dolphin. While events recorded by the observer were related to recommendations in Table 2 to the greatest extent possible, uncertainty remains for some of these designations. For seabirds, take designations differed for species listed under the ESA as threatened or endangered and for species that are not ESA listed. Section 3 of the ESA specifies the term ‘take’ to mean ‘harass, harm, pursue, hunt, shoot, wound, kill, trap, capture, or collect, or to attempt to engage in any such conduct’ (16 USC 1532). Any interaction encompassing the ESA definition with an ESA-listed seabird species (Table 1) was identified as a take. For seabirds that are not listed under the ESA, takes were designated for all interactions that were documented as a mortality or were anticipated to have resulted in a mortality. This process was admittedly subjective, but it was informed by specific details in the observer’s notes, which are recorded at the time of the interaction. Observers typically detail the nature of the injury and changes in the animal’s behavior following its release. Birds documented to have exhibited bleeding, broken bones, or lost feathers were identified as takes. Also, birds that did not fly away or return to normal behavior within a few minutes of the interaction were considered to be takes. During 2002-2009, only one sea turtle-fishery interaction has been documented by west coast observers. In this case, the turtle was killed by fishing gear and a more involved take designation was not required. Specific criteria for designating sea turtle takes will be defined in the future if additional sea turtles are encountered by observed west coast groundfish vessels.
Designation of strata
Stratification was determined for each species based on a qualitative evaluation of life history traits, population structure, and spatial and temporal differences in abundance. In the sections below, life history characteristics and the selected analyses stratification is provided for each species with observed ‘takes’. The introduction of strata is intended to reduce uncertainty in bycatch estimates, but changes in variability associated with different stratification schemes have not been formally tested, primarily due to insufficient sample size to produce informative results.
Marine mammals
Cetaceans Bottlenose dolphin (Tursiops truncates) – Bottlenose dolphins inhabit temperate and tropical waters around the world in latitudes from 45° N to 45° S. Bottlenose dolphin populations inhabit either coastal or pelagic areas, even within the same general region (Forney and Barlow 1998, Defran and Weller 1999, Fazioli et al. 2006, Carretta et al. 2009). For example, California coastal populations tend to remain within 1 km of shore (Hanson and Defran 1990, Defran et al. 1999, Carretta et al. 2009), whereas pelagic populations travel more than 1 km offshore (Fazioli et al. 2006, Carretta et al. 2009). Furthermore, coastal and pelagic populations along the U.S. west coast appear to represent genetically distinct groups (Lowther 2006). For these reasons, bottlenose dolphin populations are divided into two stocks along the US west coast: (1) California coastal stock and (2) California, Oregon, Washington offshore stock (Carretta et al.

10
2009). The majority of ecological studies on bottlenose behavior in the wild have focused on coastal populations (Harzen 1998, Defran et al. 1999, Hastie et al. 2004, Fazioli et al. 2006). Thus, little is known about the home range and seasonality of the west coast offshore bottlenose stock. However, limited data in southern California suggests that the offshore population likely ranges widely from Baja California possibly as far north as southern Washington and does not appear to exhibit seasonal regularity in distribution (Forney and Barlow 1998, Carretta et al. 2009). We did not stratify our estimates of bottlenose dolphin takes because: (1) coastal populations remain <1 km from shore; (2) the majority of WCGOP fishing activity occurs >1 km from shore (exception: state-permitted nearshore fisheries) and; (3) the single bottlenose dolphin take was observed >1 km from shore (~9 km). Thus, our estimate represents the impact of WCGOP fisheries on the California-Oregon-Washington offshore bottlenose population. Harbor porpoise (Phocoena phocoena) – Harbor porpoises inhabit temperate waters from Cape Flattery, WA to Point Conception, CA (Barlow 1988). Carretta et al. (2001) found that abundance of harbor porpoises declined considerably in depths greater than 60 meters, however, their use of deeper habitats varies from year to year (Forney 1999). Concentrations of toxins such as polychlorinated biphenyls (PCBs), dicholordiphenyldichloroethylene (DDE), and hexachlorobenzene (HCB) in blubber samples of harbor porpoises have been shown to differ regionally on the west coast, suggesting their movements are restricted (Calambokidis and Barlow 1991). Initially, stock assessments were conducted for four separate stocks: a Central California stock, Northern California – Southern Oregon stock, Washington - Oregon stock, and Washington Inland Waters stock (Carretta et al. 2009). However, subsequent findings from genetic studies and aerial surveys supported the revision of stock boundaries. Stock assessments are currently conducted for six different stocks on the west coast, including a Morro Bay stock, Monterey Bay stock, San Francisco – Russian River stock, Northern California - Southern Oregon stock, Oregon - Washington stock, and Washington Inland waters stock (Carretta et al. 2009). Unfortunately, the quantity of observer data in this analysis does not support such a fine level of stratification. Instead, we employed three latitudinal strata to estimate the bycatch of harbor porpoises in the west coast groundfish fishery: (1) north of Cape Blanco, OR (42˚ 50’ N latitude); (2) between Cape Blanco, OR and Point Arena, CA (38° 57.50’ N latitude); and (3) south of Point Arena, CA. Cape Blanco, Oregon is the latitudinal break used to separate the Oregon - Washington stock from the Northern California - Southern Oregon stock in stock assessments for this species. Point Arena California is used to separate the Northern California -Southern Oregon stock from more finely distributed harbor porpoise stocks in Central California (Carretta et al. 2009). Although the distribution of harbor porpoises does vary by depth (Green et al. 1992), there is no comprehensive information available regarding the depth distribution of the west coast groundfish fishery as a whole. Depth therefore could not be used as a means for stratification, as this variable was not available for data sources used in the expansion of observed bycatch to the fleet-wide level. Pacific white-sided dolphin (Lagenorhynchus obliquidens) – Pacific white-sided dolphins are found throughout the North Pacific Ocean and inhabit the continental shelf and slope areas on
11
the US west coast. Geographic distributions for this species are not well understood, and the population along the entire coast is managed as a single unit (Carretta et al. 2009). Pacific white-sided dolphins are thought to move seasonally in a north-south direction along the US west coast. Forney and Barlow (1998) found that this species was rare off of southern California in the summer, but was present in the winter. Aerial surveys conducted by Green et al. (1992) off the coast of Oregon and Washington indicate that Pacific white-sided dolphins are most abundant in these areas in late spring and early summer. Although these findings suggest seasonal movement, the exact timing of this movement is not clear and could vary from year to year depending on variable water temperatures along the coast or other factors (Forney and Barlow 1998). We employed latitudinal stratification to attempt to capture movements of Pacific white-sided dolphins. Two latitudinal strata were used: (1) north of 40˚ 10’ N latitude and (2) south of 40˚ 10’ N latitude. This latitudinal line is consistent with characteristics of the target species, regulatory characteristics, and fishing behavior observed in the groundfish fishery and corresponds with the areas surveyed by Green et al. (1992) and Forney and Barlow (1998). Risso’s dolphin (Grampus griseus) – Risso’s dolphins inhabit tropical and warmer temperate waters around the world. They generally favor deeper habitats over the continental shelf but move inshore in response to seasonal changes in water temperature (Leatherwood et al. 1980). On the US west coast, this species is most abundant off of southern California (Forney and Barlow 1998). Although Forney and Barlow (1998) found no significant differences in the latitudinal distribution of Risso’s dolphins by season, observation of this species off of Oregon and Washington in the late spring and summer suggest that they might move northward in response to warming water temperatures (Green et al. 1992). We used three latitudinal strata to estimate bycatch of Risso’s dolphins in the west coast groundfish fishery: (1) north of 40˚ 10’ N latitude; (2) 40˚ 10’ N latitude to Point Conception, CA (34˚ 27’ N latitude); and (3) south of Point Conception, CA. These strata were designated to be as consistent as possible with aerial and shipboard survey findings for this species. Forney and Barlow (1998) indicated that Risso’s dolphin abundance and density was highest in the southern California Bight, the area south of Point Conception. This additional latitudinal line is intended to address potential seasonal shifts in their distribution, while also coinciding well with logistical and regulatory characteristics in the groundfish fishery, as mentioned previously. Sperm whale (Physeter macrocephalus) – Sperm whales were the only large whale observed to have interacted with commercial groundfish vessels on the west coast. These animals are widely distributed in tropical and temperate waters of the Pacific Ocean. Sperm whales hunt in deep-water habitats and were encountered by observed vessels in deeper areas 50 km or more off-shore. Even though sperm whale distributions can fluctuate in relation to prey abundance (Jaquet and Gendron 2002, Jaquet et al. 2003), there are consistent patterns with respect to their seasonal abundance along the US west coast. For example, in California, sperm whales are found year round, but are most abundant in spring and fall. They appear to inhabit waters off of Oregon and Washington only in non-winter months, from April through November (Carretta et al. 2009).

12
To incorporate seasonal and spatial patterns into bycatch estimates for sperm whales, the data were stratified into two seasonal strata (winter [Dec – Mar], non-winter [Apr – Nov]), and two areas: (1) north and (2) south of 40˚10’ N latitude. This latitudinal line is consistent with differences in fishing activity and behavior noted previously. In addition, sperm whale abundance appears to be greater south of 40˚ N latitude (Carretta et al. 2009). Pinnipeds California sea lion (Zalophus californianus) – Stock assessments for California sea lions identify the population as consisting of three distinct stocks that breed at different locations in southern California and Mexico. The US stock, which breeds on islands in southern California and is distributed as far north as Canada, is genetically distinct from breeding populations in western Baja California and in the Gulf of California, Mexico (Carretta et al. 2009). Breeding takes place between May and August (Odell 1975, Garcia-Aguilar and Aurioles-Gamboa 2003). Following the breeding season, males and juveniles migrate north (Aurioles et al. 1983) while females remain in the area (Lowry et al. 1990). We employed seasonal stratification to estimate the bycatch of California sea lions, with the breeding season defined as May through August, and the non-breeding season defined as September through April. In addition, latitudinal strata north and south of 40˚ 10’ N latitude were also employed in the LE bottom trawl sector because this latitudinal line represented a clear break in the observed bycatch of California sea lions in this sector. In addition, fishing in the LE bottom trawl sector is generally considered to differ north and south of 40˚ 10’ N latitude with respect to target species, trip duration, and other factors. Harbor seal (Phoca vitulina) – Harbor seals are commonly found in estuarine and nearshore habitats along the west coast of North America (Brown and Mate 1983). Radio and satellite tagging studies of harbor seals have demonstrated strong site fidelity to haul-out locations (Pitcher and McAllister 1981, Brown and Mate 1983, Lowry et al. 2001). There is considerable evidence indicating geographic structuring among harbor seal populations on the west coast (Lamont et al. 1996). However, it is difficult to identify the exact strata that should be used to separate subpopulations most appropriately. Three separate stocks have been designated for the purposes of stock assessment: a California stock, an outer Oregon - Washington coast stock, and an inland Washington stock (Carretta et al. 2009). The stratification scheme we employed for estimating bycatch for this species was consistent with that designated for stock assessment, with a latitudinal break applied to the data at the Oregon - California border (42˚ N latitude). Since harbor seals are found in nearshore waters, and commercial nearshore fishing in Washington is prohibited, estimates produced for the area north of the Oregon - California border represents bycatch associated with Oregon nearshore fishing only. Carretta et al. (2009) note that the stock designations they employed were to some extent selected because of “political/jurisdictional convenience.” However, we observe clear differences in fishing behavior, target species, catch amounts, gear type, and seasonality between commercial nearshore vessels in Oregon and California, and employ a similar stratification scheme to estimate bycatch for a variety of species in the commercial nearshore sector.
13
Northern elephant seal (Mirounga angustirostris) – Northern elephant seals breed on peninsulas and islands from Baja California to Oregon, but can be found in coastal waters as far north as Alaska (Le Boeuf et al. 2000). The current population of Northern elephant seals is derived from a small group of individuals that survived a significant decline in population abundance due to hunting, and genetic distinctions within the population are not evident (Hoelzel et al. 1993). Breeding takes place during the winter months from December through March (Stewart and Huber 1993). During non-breeding months, Northern elephant seals undergo two annual migrations (Stewart and DeLong 1995). The first of these occurs in early spring, as Northern elephant seals travel north from breeding sites to forage. Considerable dimorphism in the migration route and foraging site of males and females has been observed, with males traveling longer distances to feeding grounds as far as the western Aleutian Islands (Le Boeuf et al. 2000). Males return to shore in the southern part of their range after approximately four months to molt. They then undertake a second migration in late summer to early fall to again reach northern foraging grounds, before returning to rookeries for the start of the next breeding season (Stewart and DeLong 1995, Le Boeuf et al. 2000). Although the migratory route of Northern elephant seals has been tracked using a number of techniques (Brillinger and Stewart 1998 , Le Boeuf et al. 2000), it is unclear whether there are specific periods during migratory periods when encounters with fishing gear are more probable. Only two temporal strata were applied to observer data: (1) the breeding period (December- May); and (2) the non-breeding period (April-November). Migratory routes of individual Northern elephant seals appear to vary considerably (Le Boeuf et al. 2000), complicating the designation of appropriate latitudinal strata for this species. Steller sea lion (Eumetopias jubatus) – This species is primarily found in the North Pacific region and is most abundant in Alaska and the Aleutian Islands. Steller sea lions congregate year-round at haul-out sites on land, and although individuals exhibit large-scale dispersal throughout their range, they are not known to migrate (Raum-Suryan et al. 2002, Carretta et al. 2009). Genetic evidence and other factors suggest that the Steller sea lion population in the North Pacific consists of two stocks: a western stock and an eastern stock (Loughlin 1997). The geographic boundary dividing these two stocks was identified by Loughlin (1997) as Cape Suckling, Alaska (144˚ W longitude). Raum-Suryan et al. (2002) documented a maximum individual dispersal distance for this species of 1,785 km and bycatch estimates for Steller sea lions on the west coast relate primarily to the eastern stock. Individuals disperse to a lesser extent during the breeding season, which takes place from May through July (Pitcher and Calkins 1981). We used two seasonal strata to estimate the bycatch of Steller sea lions in the west coast groundfish fishery: (1) the breeding season (May- July) and (2) the non-breeding season (August- April). Given their wide-ranging dispersal behavior, latitudinal stratification was not deemed appropriate for this species.
Seabirds
The US west coast supports a diversity of seabird species, which exhibit a wide range of life history characteristics. Seabirds for which takes were documented in the west coast groundfish fishery include species that breed locally such as Brandt’s cormorant, brown pelican, common

14
murre, Leach’s strom petrel and the western gull. Takes were also documented for seabird species that pass through the California Current system during migration or foraging periods, but breed elsewhere such as the black-footed albatross, northern fulmar and the sooty shearwater. All the California Current system seabirds (breeding or transitory) are highly mobile and require an abundant food source to support their high metabolic rates (Ainley et al. 2005). Because of these shared characteristics, the abundance of most seabird species along the US west coast is influenced by the same physical and biological factors, e.g., oceanic productivity and prey availability (Tyler et al. 1993, Ainley et al. 2005). Specifically, the seasonal and latitudinal distribution of seabirds is defined by the intensity of coastal upwelling, which delivers nutrient rich water and supports higher prey biomass in surface waters accessible to seabirds (Tyler et al. 1983). On the US west coast, upwelling is most intense south of Cape Blanco, OR (42˚ 50’ N latitude) (Bakun et al. 1974, Barth et al. 2000), which supports a large percentage of the nesting sites of locally breeding seabirds (Tyler et al. 1993). The location of stable nesting sites reflects oceanographic conditions that support long-term food availability (Tyler et al. 1993). Transient species to the California Current system are also most abundant in areas of strong upwelling intensity and high productivity (Briggs and Chu 1986, Hyrenbach et al. 2002). In addition to varying by latitude, both coastal upwelling and the distribution of seabirds also vary by season. Three distinct oceanic seasons have traditionally been defined for the US west coast: the Upwelling, Oceanic, and Davidson Current seasons (Ford et al. 2004). The Upwelling season coincides with late spring and summer, when northerly winds transport surface waters southward and away from the coast. The distribution of breeding species in summer largely reflects the location of nesting colonies, which are most prevalent adjacent to the central and northern portion of the California Current system (Tyler et al. 1993, Ford et al. 2004). However, during this time, breeders are outnumbered by visiting species, which are attracted by greater oceanic productivity and prey abundance associated with upwelling. Commonly observed visiting species in summer include the sooty shearwater (Puffinus griseus), Northern fulmar (Fulmarus glacialis), and black-footed albatross (Phoebastria nigripes) (Tyler et al. 1993). In the fall (Oceanic season), northerly winds and upwelling intensity decrease, and sea surface temperature reaches its annual maximum. Several species that nest further south in Mexico and southern California move northward, including the brown pelican (Pelecanus occidentalis) and storm-petrels. As winter approaches, these species again return south and breeders from boreal nesting colonies become more abundant, particularly off of California (Tyler et al. 1993). The winter months along the west coast are characterized by warmer water delivered by the Davidson current and reduced levels of primary production (Davidson Current season). Seabird abundance during this time is generally low (Tyler et al. 1993). We maintained a consistent stratification scheme for all seabird species based on findings from aerial and boat surveys synthesized by Tyler et al. (1993). Latitudinal strata were defined in accordance with the gradient in upwelling intensity north and south of Cape Blanco, OR (42˚ 50’ N latitude) (Bakun et al. 1974, Barth et al. 2000). Three seasonal strata were also defined to coincide with the seasonal trends in upwelling and seabird abundance: (1) winter (January- April); (2) summer (May- August); and (3) fall (September-December).
15
Sea turtles
Leatherback turtle (Dermochelys coriacea) – Leatherback turtles have an extensive geographic distribution, inhabiting tropical and temperate waters in all major oceans. Recent studies in the Atlantic Ocean have demonstrated that leatherbacks are highly migratory, with individuals traveling up to 1,000 km or greater in a single migration (Hays et al. 2004). Off the west coast of North America, leatherback sea turtles have been observed as far north as Alaska but are more common off of central California (Benson et al. 2007b). Genetic evidence presented by Dutton et al. (2001) indicates that specimens found on the west coast are actually part of a distinct population originating in the western Pacific. These animals nest on beaches in Indonesia, Papua New Guinea, and the Solomon Islands during the austral summer, and then migrate across the Pacific to forage in coastal waters off of North America (Benson et al. 2007a). Sightings data from Monterey Bay, California indicate that leatherback turtles are most abundant in late summer and early fall (Starbird et al. 1995). This finding was confirmed by aerial surveys along five transects on the California coast from 1990 to 2003 (Benson et al. 2007b). Benson et al. (2007b) showed a link between leatherback turtle density off of California and the average annual Northern Oscillation Index. Their findings suggest that leatherbacks are more abundant during periods of intense coastal upwelling, which could create favorable foraging conditions (Benson et al. 2007b). The methodology employed in this analysis did not allow for the incorporation of environmental indicators such as the Northern Oscillation Index. To capture the spatial and temporal variability noted in aerial surveys and sightings data, we employed both seasonal and spatial stratification. Two seasonal strata were specified to reflect periods of presence and absence of leatherback turtles on the US west coast. Summer-fall was defined as June through November, and represented the period during which leatherbacks were present and potentially vulnerable as bycatch in the west coast groundfish fishery. Winter-spring was defined as December through May, coinciding with the migration of leatherbacks returning to the western Pacific. Spatial strata were developed using two latitudinal breaks at Cape Blanco, Oregon (42˚ 50’ N latitude) and Point Conception, California (34˚ 27’ N latitude). These latitudinal strata were selected because of their relevance to coastal upwelling intensity. Upwelling associated with the California Current system is most intense north of Point Conception, CA (Bakun et al. 1974), but decreases considerably north of Cape Blanco, OR due to inconsistent wind patterns and changes in localized surface currents (Barth et al. 2000). While these strata were designed with the intention of representing variability in leatherback densities on the west coast most appropriately, the extent to which they achieve this goal is uncertain. A more comprehensive evaluation of the stratification appropriate for this species is inhibited by the paucity of data on leatherback turtles. During the time span of this report (2002-2009), only one leatherback turtle was recorded by west coast observers (2008). This data point alone would not be sufficient to support such an analysis. Given uncertainties in the effectiveness of stratification in isolating variability in leatherback bycatch, we re-computed base estimates of bycatch for this species in three different ways: (1) using seasonal strata only; (2) using latitudinal strata only; and (3) using both seasonal and latitudinal strata (Table 3). None of these approaches resulted in estimates with a strata-specific CV less than 80%.

16
Ratio estimator and bycatch estimates
Once the data had been stratified for each species as described above, a ratio estimator was used (Cochran 1977) to expand observed bycatch amounts to the fleet-wide level. This method has been widely used in discard estimation (Stratoudakis et al. 1999, Borges et al. 2005, Walmsley et al. 2007). It relies heavily on the assumption that bycatch is proportional to some metric or proxy of fishing effort, such as fishery landings (Rochet and Trenkel 2005). Rochet and Trenkel (2005) note that this assumption is often not supported by data and in some cases, bycatch might vary nonlinearly or even be unrelated to the ratio estimator denominator. The species of concern in this report are encountered so rarely by the groundfish fishery that it is difficult to assess whether the number of bycatch events is indeed linked to levels of fishing effort. The assumption that bycatch is proportional to fishing effort has not been tested and could bias results if invalid. For extremely rare species, particularly those that have been recorded only once across all years, bycatch estimates produced using ratio estimators should be considered with caution. When the CV for strata-specific bycatch estimates exceeded 80%, estimates were not included in final report tables. This threshold was designated based on the frequency distribution of CVs produced for all species under various stratification schemes. This evaluation revealed a definitive break in the distribution of bycatch estimate CVs at 80%. CVs between 10% and 80% are still extremely high and exceed the level of variance that is typically considered acceptable. CVs were large because of a variety of factors, including the excess of zero-valued observations in the data and observer coverage rates in some fishery sectors. Of the variables used to estimate bycatch, CVs were most closely tied to the level of variance in the number of observed takes, the numerator of bycatch ratios. For each species, bycatch ratios were computed by sector, year, and selected strata as the number of takes divided by the catch weight recorded in observer data. Bycatch ratios were then expanded to the fleet-wide level based on the total catch or landings from each sector. The denominator used in bycatch ratios differed considerably by fishery sector because of differences in target species and fishing behavior. In addition, variation in sampling protocols by the A-SHOP and WCGOP require that this general approach is applied in slightly different ways during bycatch estimation. The sections below provide more specific details regarding bycatch estimation methodology for each program and fishery sector.
At-sea hake sector bycatch estimates
Observers on at-sea hake vessels take a random sample of the total catch, including both the component that will be retained and that which will be discarded. With one or two observers on-board each vessel, nearly 100% of tows are sampled. However, because of the large volume of catch from each tow, it is only possible to sample 30 to 60% of the total tow catch. When a sample is collected, the various species within it are weighed and recorded (NWFSC 2008a). The resulting data are expanded to the tow level and used to summarize catch by species in the fleet as a whole. A-SHOP observers monitor for marine mammals and seabirds in two distinct ways. First, if a marine mammal or seabird was caught and is present in the observer’s species composition sample, the appropriate information (including weight, length, etc.) is documented. Secondly, observers monitor the dumping of catch from some tows to detect the presence of marine
17
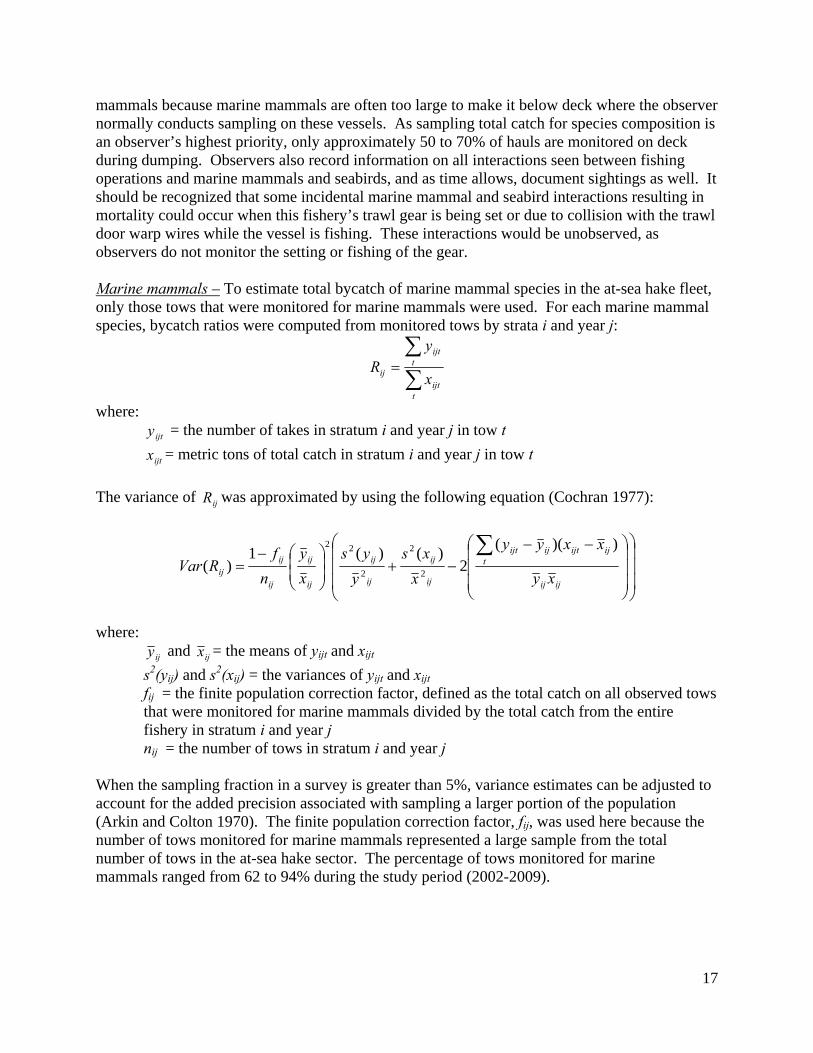
mammals because marine mammals are often too large to make it below deck where the observer normally conducts sampling on these vessels. As sampling total catch for species composition is an observer’s highest priority, only approximately 50 to 70% of hauls are monitored on deck during dumping. Observers also record information on all interactions seen between fishing operations and marine mammals and seabirds, and as time allows, document sightings as well. It should be recognized that some incidental marine mammal and seabird interactions resulting in mortality could occur when this fishery’s trawl gear is being set or due to collision with the trawl door warp wires while the vessel is fishing. These interactions would be unobserved, as observers do not monitor the setting or fishing of the gear. Marine mammals – To estimate total bycatch of marine mammal species in the at-sea hake fleet, only those tows that were monitored for marine mammals were used. For each marine mammal species, bycatch ratios were computed from monitored tows by strata i and year j:
tijt
tijt
ij x
yR
where:
ijty = the number of takes in stratum i and year j in tow t
ijtx = metric tons of total catch in stratum i and year j in tow t
The variance of ijR was approximated by using the following equation (Cochran 1977):
ijij
tijijtijijt
ij
ij
ij
ij
ij
ij
ij
ijij xy
xxyy
x
xs
y
ys
x
y
n
fRVar
))((2
)()(1)(
2
2
2
22
where:
ijy and ijx = the means of yijt and xijt
s2(yij) and s2(xij) = the variances of yijt and xijt
fij = the finite population correction factor, defined as the total catch on all observed tows that were monitored for marine mammals divided by the total catch from the entire fishery in stratum i and year j nij = the number of tows in stratum i and year j
When the sampling fraction in a survey is greater than 5%, variance estimates can be adjusted to account for the added precision associated with sampling a larger portion of the population (Arkin and Colton 1970). The finite population correction factor, fij, was used here because the number of tows monitored for marine mammals represented a large sample from the total number of tows in the at-sea hake sector. The percentage of tows monitored for marine mammals ranged from 62 to 94% during the study period (2002-2009).
18
Note that Var(Rij) could not be calculated when ijy = 0 or ijx = 0 for all tows and should be used
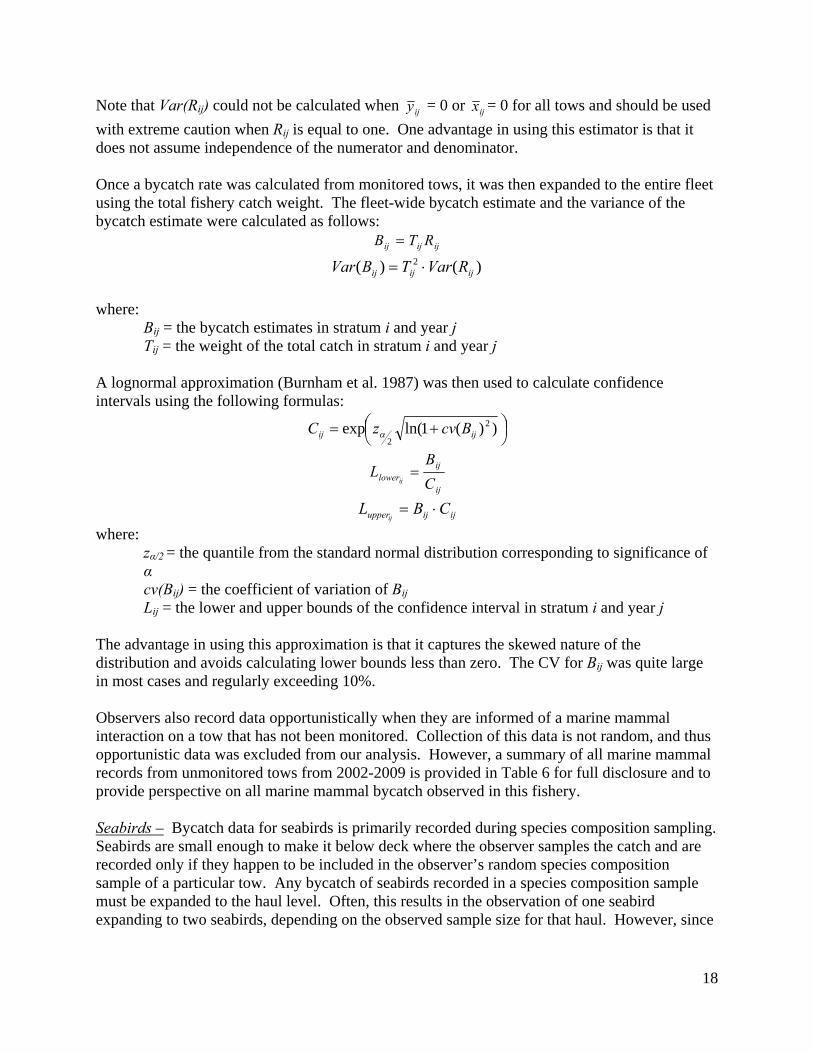
with extreme caution when Rij is equal to one. One advantage in using this estimator is that it does not assume independence of the numerator and denominator. Once a bycatch rate was calculated from monitored tows, it was then expanded to the entire fleet using the total fishery catch weight. The fleet-wide bycatch estimate and the variance of the bycatch estimate were calculated as follows:
ijijij RTB
)()( 2ijijij RVarTBVar
where:
Bij = the bycatch estimates in stratum i and year j Tij = the weight of the total catch in stratum i and year j
A lognormal approximation (Burnham et al. 1987) was then used to calculate confidence intervals using the following formulas:
))(1ln(exp 2
2ijij BcvzC
ij
ijlower C
BL
ij
ijijupper CBLij
where: zα/2 = the quantile from the standard normal distribution corresponding to significance of α cv(Bij) = the coefficient of variation of Bij
Lij = the lower and upper bounds of the confidence interval in stratum i and year j The advantage in using this approximation is that it captures the skewed nature of the distribution and avoids calculating lower bounds less than zero. The CV for Bij was quite large in most cases and regularly exceeding 10%. Observers also record data opportunistically when they are informed of a marine mammal interaction on a tow that has not been monitored. Collection of this data is not random, and thus opportunistic data was excluded from our analysis. However, a summary of all marine mammal records from unmonitored tows from 2002-2009 is provided in Table 6 for full disclosure and to provide perspective on all marine mammal bycatch observed in this fishery. Seabirds – Bycatch data for seabirds is primarily recorded during species composition sampling. Seabirds are small enough to make it below deck where the observer samples the catch and are recorded only if they happen to be included in the observer’s random species composition sample of a particular tow. Any bycatch of seabirds recorded in a species composition sample must be expanded to the haul level. Often, this results in the observation of one seabird expanding to two seabirds, depending on the observed sample size for that haul. However, since

19
every vessel is observed and close to 100% of the fleet’s tows are sampled, the bycatch expansion to the entire at-sea sector is quite small. To estimate total seabird bycatch in the at-sea hake fishery, all of the sampled tows were used in our analysis. Once the bycatch estimate of seabirds was expanded within each sampled tow, the estimate was then expanded to the entire fleet. This method for calculating seabird bycatch is the same as the method used to calculate fish bycatch in the at-sea hake sector. For each seabird species, the total number of takes during each tow was calculated using the following formula:
t
ttt w
WyY
where: Yt = the total number of takes in tow t yt = the number of observed takes in the species composition sample of tow t Wt = the weight of the total catch in tow t wt = the weight of the sampled catch in tow t
The total number of takes of each seabird species in the at-sea hake fleet was then calculated using the following formula:
t obs
totalt C
CYB
where: B = the total estimated bycatch for that species Ctotal = the total catch from all tows in the at-sea hake sector Cobs = the catch from the observed tows in the at-sea hake sector
Seabird bycatch data do not contain the necessary replicates for calculating within tow variation. The only source of uncertainty that could have been evaluated for fleet-wide seabird bycatch estimates was that associated with the variance between tows. Since nearly 100% of tows were sampled, this variation was quite small and not useful for uncertainty. In addition to seabird data compiled during species composition sampling, observers also record opportunistic data on seabird interactions whenever possible. These are essentially records of seabird takes that were noted by the observer on occasions when they were either informed of an interaction by the crew or happened to observe an interaction while on deck These data are excluded from the analysis because they are not randomly sampled. However, a summary of opportunistic seabird data from 2007-2009 is presented in Table 6 for full disclosure and to provide perspective on all seabird bycatch observed in this fishery. Additional years of observer data were not provided because the information is currently only available in paper form.
Non-hake sector bycatch estimates
Observer coverage in the non-hake fishery sectors differs considerably than that in the at-sea hake sector. Permits are selected for observation by the WCGOP using a random sampling design without replacement. First, the WCGOP determines the amount of time (based on
20
available resources) it will take to observe the entire fleet; this is termed the selection cycle. Next, the WCGOP aggregates locations along the US west coast into port groups. The permits/vessels in each fishery sector are assigned to a port group based on the location of their previous year’s landings. Within each port group, the permits/vessels are randomly selected for coverage. The LE bottom trawl, LE sablefish fixed gear non-endorsed (non-primary), OA fixed gear, Oregon/California nearshore, California halibut, and pink shrimp sectors are selected for one or two month periods, which coincide with cumulative trip limit periods used in management. LE fixed gear sablefish endorsed (primary) permits are selected for the entire sablefish season (April 1 through October 31) until their quota is caught. This selection process is designed to produce a logistically feasible sampling plan with a distribution of observations throughout the entire geographic and temporal range of each fishery sector. Once a permit/vessel has been selected for coverage, the WCGOP attempts to observe all trips and tows/sets that vessel makes during the coverage time period. The annual rate of observer coverage in non-hake fishery sectors ranges from 0 to 30%, as defined by the proportion of fishery landings that are observed. These rates vary from one sector to the next, with higher priority sectors receiving the highest observer coverage. A list of fishery sectors in order of coverage priority can be found in the WCGOP manual (NWFSC 2010). Fisheries observers monitor and record catch data on commercial fishing vessels by following protocols in the WCGOP manual (NWFSC 2010). Observer sampling focuses on discarded catch and supplements existing fish ticket landing receipt data to inform weights of retained catch. Observers generally sample 100% of tows/sets made during a trip. On trawlers, the total weight of discarded catch is estimated, and the discarded catch is then sampled for species composition. The species composition sample could represent either a census or a subsample of all discarded catch. On fixed gear vessels (hook-and-line and pot gears), observers sample total catch (similar to at-sea hake observer sampling methodology) and sample anywhere from 30 to 100% of the catch from each set. The only available proxy of total fishing effort in the non-hake fishery sectors is landed catch. Logbooks are only available in the LE bottom trawl fleet and only record retained (landed) catch, not total catch. Bycatch rates are therefore computed as the number of observed takes divided by the total weight of retained catch in metric tons. Bycatch rates are computed from all observed tows/sets, and this rate is then expanded to the fleet-wide level using landed catch weight from fish tickets. Because marine mammals and sea turtles are large and unlikely to be missed by the observer, the number of takes recorded for these species on each tow/set is used directly to produce the numerator of the bycatch ratio. Seabirds, on the other hand, are smaller and blend more easily with fish catch. Seabirds are often encountered while the observer is conducting species composition sampling, and thus might not be fully accounted for in the sampled portion of the catch alone. It is therefore necessary to expand the bycatch of seabirds within a tow/set prior to computing bycatch rates. For data from trawl trips, the seabird bycatch is expanded to the tow level using the following equations. First, the total weight of the subsample is computed as:
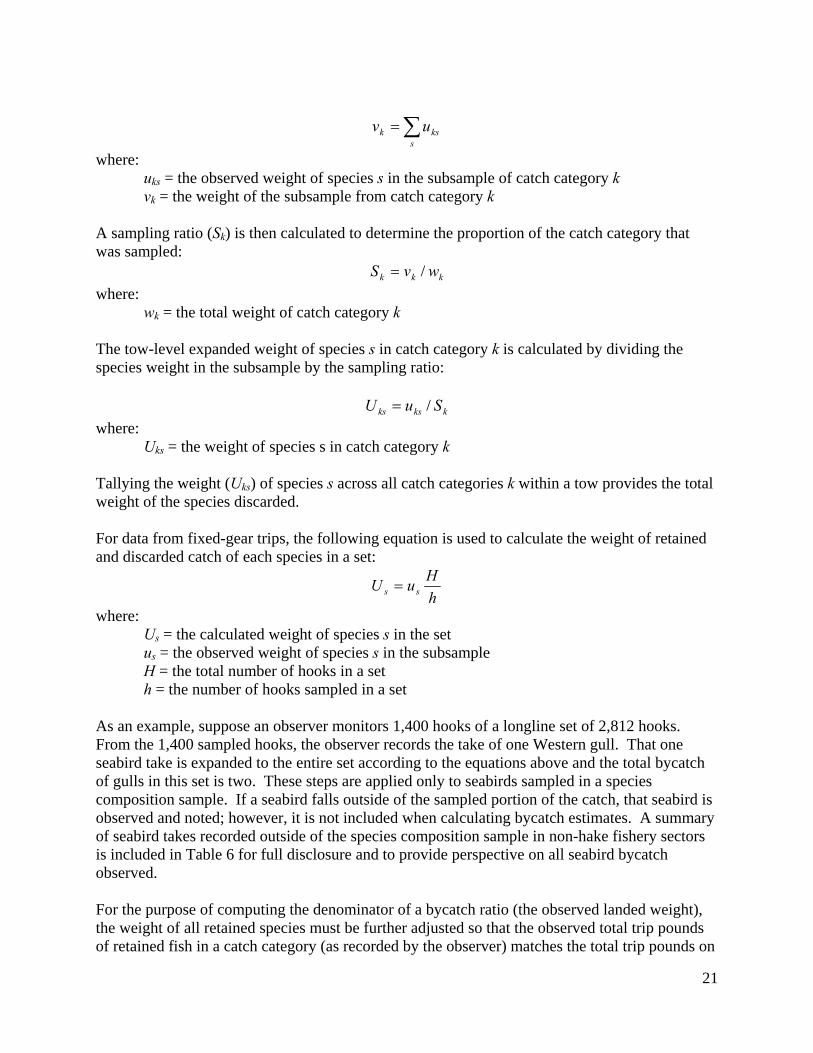
21
s
ksk uv
where: uks = the observed weight of species s in the subsample of catch category k vk = the weight of the subsample from catch category k
A sampling ratio (Sk) is then calculated to determine the proportion of the catch category that was sampled:
kkk wvS /
where: wk = the total weight of catch category k
The tow-level expanded weight of species s in catch category k is calculated by dividing the species weight in the subsample by the sampling ratio:
kksks SuU /
where: Uks = the weight of species s in catch category k
Tallying the weight (Uks) of species s across all catch categories k within a tow provides the total weight of the species discarded. For data from fixed-gear trips, the following equation is used to calculate the weight of retained and discarded catch of each species in a set:
h
HuU ss
where: Us = the calculated weight of species s in the set us = the observed weight of species s in the subsample H = the total number of hooks in a set h = the number of hooks sampled in a set
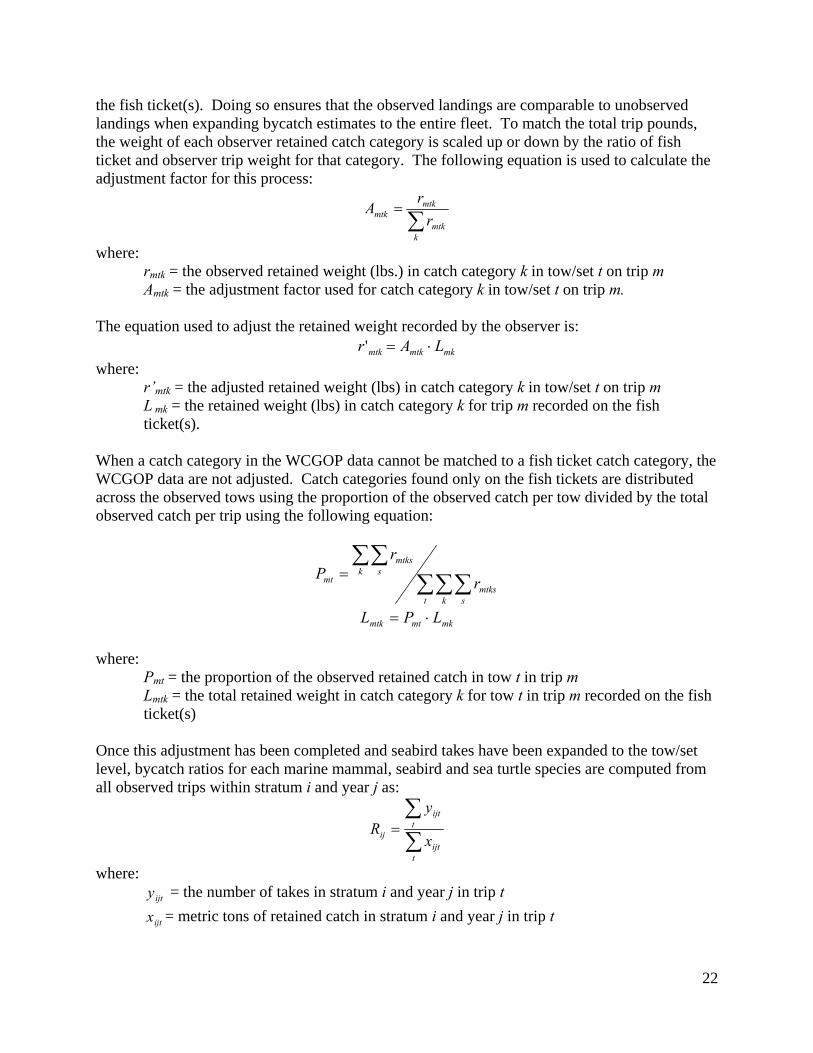
As an example, suppose an observer monitors 1,400 hooks of a longline set of 2,812 hooks. From the 1,400 sampled hooks, the observer records the take of one Western gull. That one seabird take is expanded to the entire set according to the equations above and the total bycatch of gulls in this set is two. These steps are applied only to seabirds sampled in a species composition sample. If a seabird falls outside of the sampled portion of the catch, that seabird is observed and noted; however, it is not included when calculating bycatch estimates. A summary of seabird takes recorded outside of the species composition sample in non-hake fishery sectors is included in Table 6 for full disclosure and to provide perspective on all seabird bycatch observed. For the purpose of computing the denominator of a bycatch ratio (the observed landed weight), the weight of all retained species must be further adjusted so that the observed total trip pounds of retained fish in a catch category (as recorded by the observer) matches the total trip pounds on
22
the fish ticket(s). Doing so ensures that the observed landings are comparable to unobserved landings when expanding bycatch estimates to the entire fleet. To match the total trip pounds, the weight of each observer retained catch category is scaled up or down by the ratio of fish ticket and observer trip weight for that category. The following equation is used to calculate the adjustment factor for this process:
kmtk
mtkmtk r
rA
where: rmtk = the observed retained weight (lbs.) in catch category k in tow/set t on trip m Amtk = the adjustment factor used for catch category k in tow/set t on trip m.
The equation used to adjust the retained weight recorded by the observer is:
mkmtkmtk LAr '
where: r’mtk = the adjusted retained weight (lbs) in catch category k in tow/set t on trip m L mk = the retained weight (lbs) in catch category k for trip m recorded on the fish ticket(s).
When a catch category in the WCGOP data cannot be matched to a fish ticket catch category, the WCGOP data are not adjusted. Catch categories found only on the fish tickets are distributed across the observed tows using the proportion of the observed catch per tow divided by the total observed catch per trip using the following equation:
t k smtks
k smtks
mt r
rP
mkmtmtk LPL
where:
Pmt = the proportion of the observed retained catch in tow t in trip m Lmtk = the total retained weight in catch category k for tow t in trip m recorded on the fish ticket(s)
Once this adjustment has been completed and seabird takes have been expanded to the tow/set level, bycatch ratios for each marine mammal, seabird and sea turtle species are computed from all observed trips within stratum i and year j as:
tijt
tijt
ij x
yR
where:
ijty = the number of takes in stratum i and year j in trip t
ijtx = metric tons of retained catch in stratum i and year j in trip t
23
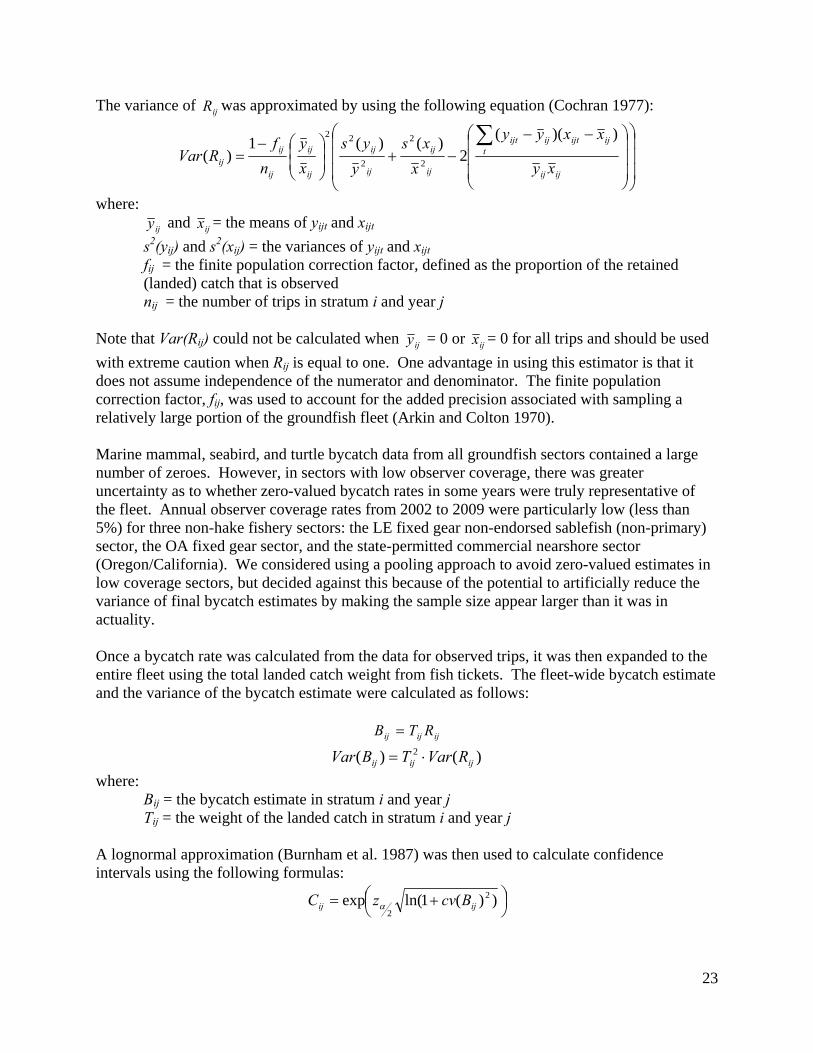
The variance of ijR was approximated by using the following equation (Cochran 1977):
ijij
tijijtijijt
ij
ij
ij
ij
ij
ij
ij
ijij xy
xxyy
x
xs
y
ys
x
y
n
fRVar
))((2
)()(1)(
2
2
2
22
where:
ijy and ijx = the means of yijt and xijt
s2(yij) and s2(xij) = the variances of yijt and xijt
fij = the finite population correction factor, defined as the proportion of the retained (landed) catch that is observed nij = the number of trips in stratum i and year j
Note that Var(Rij) could not be calculated when ijy = 0 or ijx = 0 for all trips and should be used
with extreme caution when Rij is equal to one. One advantage in using this estimator is that it does not assume independence of the numerator and denominator. The finite population correction factor, fij, was used to account for the added precision associated with sampling a relatively large portion of the groundfish fleet (Arkin and Colton 1970). Marine mammal, seabird, and turtle bycatch data from all groundfish sectors contained a large number of zeroes. However, in sectors with low observer coverage, there was greater uncertainty as to whether zero-valued bycatch rates in some years were truly representative of the fleet. Annual observer coverage rates from 2002 to 2009 were particularly low (less than 5%) for three non-hake fishery sectors: the LE fixed gear non-endorsed sablefish (non-primary) sector, the OA fixed gear sector, and the state-permitted commercial nearshore sector (Oregon/California). We considered using a pooling approach to avoid zero-valued estimates in low coverage sectors, but decided against this because of the potential to artificially reduce the variance of final bycatch estimates by making the sample size appear larger than it was in actuality. Once a bycatch rate was calculated from the data for observed trips, it was then expanded to the entire fleet using the total landed catch weight from fish tickets. The fleet-wide bycatch estimate and the variance of the bycatch estimate were calculated as follows:
ijijij RTB
)()( 2ijijij RVarTBVar
where: Bij = the bycatch estimate in stratum i and year j Tij = the weight of the landed catch in stratum i and year j
A lognormal approximation (Burnham et al. 1987) was then used to calculate confidence intervals using the following formulas:
))(1ln(exp 2
2ijij BcvzC
24
ij
ijlower C
BL
ij
ijijupper CBLij
where: zα/2 = the quantile from the standard normal distribution corresponding to significance of α cv(Bij) = the coefficient of variation of Bij
Lij = the lower and upper bounds of the confidence interval in stratum i and year j The advantage in using this approximation is that it captures the skewed nature of the distribution and avoids calculating lower bounds less than zero. The CV for Bij was quite large in most cases and regularly exceeded 10%. Strata-specific bycatch estimates with a CV of more than 80% were excluded from our evaluation and are not provided in report tables. Uncertainty in these estimates was too great to be considered useful in bycatch quantification. All other summary information is included for these estimates, including the level of observer coverage, number of takes, bycatch ratio, and bycatch ratio standard error (Table 7-9 and Appendix F-H). CVs between 10 and 80% are still considered to be extremely large and underscore that bycatch estimates produced using the current methodology should be considered with caution. For each species, the total number of takes in each year was calculated by summing bycatch estimates from all strata with a CV of less than 80%. The variance for each year was also calculated by summing the variance estimates from all strata with a CV less than 80%. This assumed independence of strata-specific bycatch and variance estimates. The specific species included in landed catch weight used in the bycatch ratio denominator and fleet-wide expansion factor differed depending on the targeting behavior in each sector. For the limited entry trawl fleet, this auxiliary variable was defined as the weight of all groundfish listed in the FMP except for Pacific hake (see Appendix B). Pacific hake was excluded because it is inappropriate to include retained hake as a metric of effort in the LE bottom trawl fishery. Vessels that land this species are considered to be targeting Pacific hake exclusively and are thus part of the hake fishery. For the LE and OA fixed gear sectors, retained sablefish weight was used as the auxiliary variable. Retained weights of California halibut and pink shrimp were used in analyses of the California halibut and pink shrimp sectors, respectively. For the state-permitted commercial nearshore sector, bycatch rates and bycatch estimates were computed using the retained weight of nearshore target species as a proxy of fishing effort. A list of species included as target species in the nearshore fishery is provided in Appendix C. In all cases where multiple species where included in the auxiliary variable, any retained weights that were recorded by the observer but that did not appear on fish tickets were excluded when computing the bycatch ratio. This was necessary to prevent double-counting associated with differences in the species codes used by observers and processors. For instance, observers typically record rockfish catch at the species level; however, processors often group, weigh, and record multiple species of rockfish under a grouped species code such as NUSP – northern unspecified slope rockfish. In some cases, this difference in species coding prevents observer and fish ticket weights from matching and adjusting properly. Species coding on fish tickets

25
varies considerably between processors and over time, and it is not possible to make assumptions regarding which individual observer-recorded species likely coincide with species grouping codes on fish tickets. Instead, by using only the retained groundfish weight from fish tickets in bycatch ratio denominators, we prevent double-counting of retained weights. This is not a factor when using a single species in the denominator, such as sablefish in the fixed gear sectors, as any retained weights in observer and fish ticket data that share the same species code will match and adjust properly.
Sensitivity Analyses
Once base estimates had been computed, a sensitivity analysis was conducted to evaluate how bycatch might differ from base estimates if the observed bycatch rate from the observer data were smaller than the actual rate in the unobserved or unmonitored fleet. In other words, if bycatch of marine mammals, seabirds and sea turtles was somehow minimized while the observer was onboard and monitoring the vessel, to what extent would our bycatch estimates have been underestimated? To evaluate this question, we considered four sensitivity alternatives in which bycatch rates applied to the unobserved portion of the fleet were increased by 10, 50, 100 and 300%. For the WCGOP data, this meant increasing bycatch rates applied to landings from entire trips that were not observed but not to tows or samples within a trip, as all marine mammal, seabird, and sea turtle interactions were assumed known from observed trips. For the A-SHOP data, sensitivities were only conducted for marine mammals and it involved increasing the observed marine mammal bycatch rate that was applied to hauls that were not monitored for marine mammals. Sensitivity analyses were only conducted for species and strata for which base bycatch estimates were already provided. When CVs in base strata-specific bycatch estimates exceeded 80%, neither base estimates nor the results from sensitivity runs were summarized, as they were considered to be too uncertain to be useful. A similar analysis was not conducted for seabirds in the at-sea hake sector because there are no obvious reasons why the unsampled portion of the catch would contain a disproportionately larger quantity of seabirds, given that the acquisition of a random sample is the responsibility of the observer.
RESULTS & DISCUSSION
Overall, 22 marine mammal, seabird, and sea turtle species were caught incidentally, killed, or seriously injured through interactions with fishing vessels, gear, or vessel personnel in the US west coast groundfish fishery. Of these, we produced bycatch estimates for all species for which randomly collected observer data were available (Tables 7, 8, and 9). This included 10 marine mammal species, 11 seabird species, and 1 species of sea turtle. Bycatch estimates with a strata-specific CV greater than 80% were not provided in tables, as these were too uncertain to be considered useful for the evaluation of fleet-wide bycatch. In addition, bycatch estimates were not produced for species that were recorded opportunistically (i.e., outside of standard observer sampling protocols, see NWFSC manuals (2008a, 2010)), however, these data are provided in Table 6. Bycatch events observed in the at-sea hake fishery sector were all situations in which marine mammals and seabirds were killed by gear. In the non-hake fishery sectors, recorded takes of marine mammals, seabirds, and turtles resulted from a variety of different interaction types, including gear entanglement and lethal removals (Table 1).
26
From 2002-2009, incidental takes of marine mammals, seabirds, and turtles occurred on less than 2% of observed trips. Although bycatch events for marine mammals, seabirds, and turtles are rare, they remain important from a population dynamics standpoint, particularly for longer-lived species and for highly endangered species, whose populations might be heavily impacted by human-induced sources of mortality. A sea turtle take was first observed in the US west coast groundfish fishery in 2008. This was a leatherback turtle observed on an open access vessel fishing with pot gear off California in late September 2008. The leatherback turtle was found just below the surface with its flippers entangled in a buoy line, which was connected to a sablefish fish-pot. Although leatherback turtles are known to inhabit waters off of Oregon and California in summer and fall, they have been sighted only twice by west coast observers since September 2001. Leatherbacks travel to North America from their breeding grounds in the western Pacific (Dutton et al. 2000), and are most abundant in this area from June through November (Starbird et al. 1995). Benson et al. (2007b) suggest that leatherback density might be positively correlated with the intensity of coastal upwelling. Although upwelling began earlier than usual in 2008, its intensity was not particularly strong. The lack of atypical findings in environmental data from that year suggests that this rare event was not necessarily driven by a greater abundance of leatherback turtles in the area. With only one data point, it is not possible to evaluate which environmental or fishing-related factors might be most closely linked to leatherback turtle bycatch in the west coast groundfish fishery. It was also not possible to provide bycatch estimates for this species, as CVs surrounding these estimates exceeded 98% regardless of the method of stratification employed. With so much uncertainty, bycatch estimates for leatherback turtles were not considered to be reliable. Takes were recorded for five different cetacean species during the study period. During 2007, a potentially harmful interaction was recorded with a sperm whale. In this interaction, the vessel collided with the animal while moving at idle speed. The collision took place in August of 2007, near the northern limit of the US EEZ, off the coast of Washington. The vessel was a limited entry fixed gear vessel, fishing with longline gear participating in the sablefish primary fishery. The observer reported that the whale did not appear injured, nor did it exhibit unusual behavior. Andersen et al. (2008) recommended that a collision with a vessel should be considered a serious injury if the vessel is above a certain size and traveling above a certain speed. However, workshop participants did not specify values for these two thresholds, noting that they should be determined based on further veterinary and technical input (Andersen et al. 2008). This interaction was therefore designated to be a take, but it remains uncertain whether it in fact resulted in a serious injury. In 2009, a bottlenose dolphin had a potentially harmful interaction with a vessel in the limited entry fixed gear sablefish (non-endorsed) fishery. A buoy line became tangled around the animal’s caudal peduncle and tail flukes. A crew member freed the animal which then swam away. The observer noted that the line caused several wounds on the animal. We designated this as a take because wraps of gear around the peduncle is considered a serious injury for small cetaceans (Criterion 14, Table 2). A bycatch estimate could not be provided for bottlenose dolphin because of the large coinciding CV (Appendix F).
27
All other cetacean species recorded by groundfish observers had been killed by fishing gear, and therefore did not require further evaluation to be designated as takes. This included one Pacific white-sided dolphin, which was caught in April 2003 by a limited entry bottom trawl vessel fishing at a mean depth of 300 fathoms off California. In 2008, a harbor porpoise was caught by a federally-permitted California halibut trawl vessel fishing off California at a mean depth of 8 fathoms. A Risso’s dolphin was also caught by a federally-permitted bottom trawler fishing in this vicinity in 2008, but at a mean depth of approximately 160 fathoms, where the vessel was targeting thornyheads and flatfish. Bycatch estimates could not be provided for any of these species because of excessively high estimated CVs (Appendix F). The remaining two cetacean specimens recorded by observers were a Pacific white-sided dolphin and a Dall’s porpoise caught by at-sea hake vessels off of Washington in 2002. These takes occurred during tows that were not monitored for marine mammals. Because data for these two specimens were collected opportunistically, they were not included in bycatch estimation and are instead summarized in Table 6. For species with only one non-zero data point available, it is quite difficult to provide an accurate and precise estimate of bycatch. Although considerable effort has gone into developing methods that accommodate an excess of zero-valued observations, even the most advanced modeling techniques have limited predictive capacity with only one non-zero data record, as is the case for leatherback turtles and cetaceans. In this analysis, we employed a ratio estimator (Cochran 1977), which assumes that the bycatch of each species is proportional to some proxy of effort (Rochet and Trenkel 2005), in this case fishery landings. For these particularly rare events, it is not possible to test this assumption, as there are not sufficient data. However, it seems quite plausible that any relationship between these events and the amount of landings retained by the fishery would be poor, or even absent entirely. The 80% CV threshold we applied to determine which strata-specific bycatch estimates to report was based on an evaluation of the distribution of estimated CVs for all marine mammal, seabird, and turtle species observed. CVs were plotted and their distribution exhibited a definitive break around 80%. CVs greater than 80% tended to occur when the data included only one non-zero observation and when the observer coverage rate was low. Although we do not provide bycatch estimates in these cases, all other observer data on rare species bycatch events, including the number of takes, observer coverage rate, observed bycatch ratio and bycatch ratio standard error, are provided in Appendices D-H. In sectors where observer coverage was extremely low, it was difficult to evaluate bycatch even qualitatively. For instance, the leatherback turtle recorded in 2008 was observed in the open access fixed gear sector on a vessel fishing pot gear. The open access fixed gear sector has an annual coverage rate of between 1 and 3% (Table 5) and observer data from open access pot vessels are particularly sparse. We have no information regarding leatherback turtle bycatch in the unobserved portion of the open access fixed gear sector. No such bycatch events have occurred in other fixed gear sablefish sectors that receive a much greater level of observer coverage and fish with the same gear type. It is unclear whether the bycatch ratio presented for leatherback turtles in Appendix H accurately reflects patterns in the open access sector rather than just the small subset of that sector that happened to be observed.

28
When observer coverage rates are relatively large (greater than 20%), systematic errors in bycatch rates are not anticipated as a result of small sample size, but could occur if observer coverage was not representative of the fleet. This concern is not relevant for the at-sea hake sector, which receives 100% coverage by the A-SHOP. The WCGOP, which observes up to 40% of target species landings depending on the sector, conducts regular evaluations of its sampling design to ensure that observer coverage is representative of the fleet. This includes annual analyses of spatial coverage in relation to fishery logbook information, comparisons of observed and unobserved landings by port, and external reviews to identify sources of bias. To date, these evaluations have not shown significant deviations between the observed and unobserved portions of the non-hake fleet. Higher observer coverage rates and a higher number of non-zero observations resulted in lower variance estimates for other marine mammal species and several seabirds. Among marine mammals, the highest estimates of bycatch in this study were those generated for the California sea lion. The majority of California sea lions observed in the groundfish fishery were caught by the limited entry bottom trawl and California halibut bottom trawl sectors. Bycatch rates during the breeding and non-breeding season were comparable (Appendix F), indicating that this species is susceptible to bycatch throughout the year. Observed bycatch was greatest south of 40˚ 10’ N latitude, which is consistent with their southerly distribution, particularly during the breeding season (Carretta et al. 2009). Bycatch estimates for this species were highest in 2003, even though bycatch estimates in several strata from that year could not be reported because of high CV values (Table 7 and Appendix F). Other pinnipeds taken incidentally in the US west coast groundfish fishery included harbor seals, Northern elephant seals, and Steller sea lions. Most of these takes were the result of interactions between pinnipeds and bottom trawl nets, however, there were some instances in which observers recorded California sea lions and harbor seals being hooked or entangled by longline gear. Pinnipeds that were not killed by fishing gear were often released alive and were considered unharmed if they showed no obvious sign of injury and if they were not entangled in fishing gear (see previous section on designation of ‘takes’). In two cases, California sea lions were killed by means of lethal removal while an observer was onboard the vessel. These events occurred on limited entry bottom trawl vessels where the animals had been caught and brought onboard alive in the trawl net. Vessel captains cited safety as their reason for shooting these animals. In 2009, northern fulmars comprised the largest seabird bycatch (Table 8), followed by unspecified tubenoses and unspecified alcids. Bycatch estimates in 2009 could not be provided for cormorants, gulls, or murres because strata-specific CVs exceeded 80% (Table 8). Shearwaters, gulls, and cormorants were commonly observed seabird bycatch from 2002-2008 (Table 8). Seabird bycatch was most common from April through October, which coincides with the limited entry fixed gear sablefish endorsed season. Although bycatch rates for most seabird species were highest in association with longline gear, common murres, cormorants, and storm-petrels were also caught by trawl gear. In 2009, there were no observed takes of black-footed albatross, which is in marked contrast to the 2002-2008 period. There was a single opportunistic take of black-footed albatross in the at-
29
sea hake fishery in 2009. During 2002-2008, seabird bycatch estimates were greatest for the black-footed albatross, which was primarily caught by longlines in the limited entry sablefish endorsed (primary) sector from May through October. Black-footed albatross bycatch ratios exhibited an increasing trend from 2002 to 2007, followed by a slight reduction in 2008 (Appendix G). Takes for this species occur on approximately 2.6% of observed sablefish longline trips, with 1-2 birds typically caught at a time. Bycatch estimates could not be provided for several strata in 2006 and 2007 because of high CV values. Annual coverage in the limited entry sablefish primary sector was close to 24% in both of these years (Table 5) and the total number of takes in this sector was 13 and 48, respectively (Table 8). However, bycatch events of black-footed albatross in 2006 and 2007 were unusual in that they were concentrated on consecutive sets within the same trip. For instance, one observed vessel caught 32 individuals across several sets off the coast of southern Oregon, representing 2/3 of the total number of observed takes for that year. This resulted in high variance among takes from one trip to the next and produced bycatch estimates with CVs as high as 96% in some strata. The ESA listing status of black-footed albatrosses is currently under review by the US Fish and Wildlife Service. This species is caught as bycatch in a variety of different longline fisheries and projections indicate a decreasing population trend (Hyrenbach and Dotson 2003). Some longline vessels in the groundfish fishery use streamer lines and other seabird avoidance gear voluntarily. WCGOP observers began documenting the use and characteristics of seabird avoidance gear on fixed gear vessels in 2009, and this information should be available for analyses of bycatch for black footed albatross and other seabird species in future years. None of the seabird species caught incidentally in the US west coast groundfish fishery are currently listed as endangered or threatened under the ESA. Although the brown pelican was listed for many years following population declines associated with DDT, this species was delisted in November 2009. One brown pelican take was observed in the groundfish fishery during our study period. This specimen was caught in the limited entry non-sablefish endorsed (non-primary) sector, which has a low level of observer coverage. The specimen was caught off of southern California by a longline vessel targeting shortspine thornyheads at a depth of about 300 fathoms. The bycatch estimate produced by expanding this single event to the fleet-wide level had a strata-specific CV of 111% (Appendix G). An estimate for brown pelican bycatch was therefore not reported. With respect to results for seabirds, it is important to emphasize that bycatch estimates were only produced from seabirds that were recorded during species composition sampling. In accordance with the WCGOP sampling protocol, all seabirds that are killed by gear and pulled on deck during gear retrieval are included in species composition sampling of that tow or set. Similarly, A-SHOP observers only include seabirds in their species composition sample if the birds are carried below deck with the rest of the catch. In both programs, data on seabirds are collected during regular catch processing procedures to ensure that they are sampled randomly, as some individuals could be missed because of their small size using census sampling. Seabirds that are injured but that are not included in the catch are excluded from this sampling process and recorded opportunistically. Opportunistic data from seabirds are presented in Table 6.
30
Results from the sensitivity analysis are included adjacent to base bycatch estimates in the summary tables provided for each species (Tables 7, 8, and 9). The sensitivity analysis was intended to evaluate how mean bycatch estimates might be affected if the bycatch ratios in the observed portion of the fleet were negatively biased. Although the WCGOP and A-SHOP programs have found no evidence to suggest that bycatch of marine mammals, seabirds, and turtles is reduced when an observer is onboard, negatively biased bycatch rates might be anticipated if fishermen are able to alter fishing practices when they are observed in a way that reduces the probability of encountering these species. The sensitivity analysis was performed for marine mammals in all sectors, and in the non-hake sectors for seabirds only. Because nearly 100% of tows are observed in the at-sea hake sector, and seabirds in that sector are sampled in the species composition sample, there was no comparable unobserved portion of the fleet to which the application of higher bycatch ratios would be appropriate. Results of the sensitivity analysis indicate that bycatch of marine mammals and seabirds on unobserved vessels would have to be considerably larger than that on observed vessels (typically by more than 300%) for the actual bycatch amount to fall outside of estimated 90% confidence intervals. We would like to emphasize that estimates of uncertainty provided in this report relate to variation in observer data only. Several sources of uncertainty were not accounted for in this analysis that could influence final bycatch estimates. These include uncertainty in fishery landings, the appropriateness of ‘take’ designations, the assignment of fish ticket landings to latitudinal and temporal strata, and others. Currently, it is not possible to quantify the variability in bycatch estimates that are associated with these types of uncertainty.
SUMMARY AND CONCLUSIONS
In this report, we summarized bycatch data for marine mammals, seabirds, and sea turtles provided by onboard federal fisheries observers in the 2002-2009 US west coast groundfish fishery. Bycatch estimates were computed for all fishery sectors with available observer data. However, bycatch estimates were only provided when coinciding strata-specific coefficient of variation (CV) values were less than 80%.
Incidental takes were recorded for 5 cetacean species 5 pinniped species, 11 seabird species, and 1 sea turtle species.
Among marine mammals, bycatch estimates were highest for California and Stellar sea
lions, which were caught primarily in trawl nets in the limited entry trawl and California halibut trawl sectors.
The first recorded take of a bottlenose dolphin occurred in 2009.
Among seabirds, bycatch estimates in 2009 were highest for northern fulmars. In previous years (2002-2008) the black-footed albatross had the largest bycatch estimates. In contrast, a single black-footed albatross was recorded opportunistically in 2009.
31
One leatherback turtle was killed by gear on an observed open access vessel fishing pot gear in 2008. A bycatch estimate based on this data point was extremely uncertain and was excluded from final results due to strata-specific CV values of greater than 98%.
Bycatch estimates for all species included in this report were highly uncertain because of
the excess number of zero-valued observations in the data and should be considered cautiously.
ACKNOWLEDGMENTS
We would like to thank John Cusick for providing valuable comments which significantly improved earlier versions of this report.
32
REFERENCES
Ainley, D., L. Spear, C. Tynan, J. Barth, S. Pierce, R. Glenn Ford, and T. Cowles. 2005. Physical and biological variables affecting seabird distributions during the upwelling season of the northern California Current. Deep Sea Research Part II: Topical Studies in Oceanography 52:123-143.
Andersen, M., K. Forney, T. Cole, T. Eagle, R. Angliss, K. Long, L. Barre, L. Van Atta, D. Borggaard, and T. Rowles. 2008. Differentiating Serious and Non-Serious Injury of Marine Mammals: Report of the Serious Injury Technical Workshop.NOAA Technical Memorandum NMFS-OPR-39, US Department of Commerce. http://swfsc.noaa.gov/uploadedFiles/Divisions/PRD/Programs/Coastal_Marine_Mammal/serious_injury_techmemo2008.pdf
Arkin, H. and R. Colton. 1970. Statistical Methods. Barnes and Noble Inc. New York, NY. Aurioles, D., F. Sinsel, C. Fox, E. Alvarado, and O. Maravilla. 1983. Winter migration of
subadult male California sea lions (Zalophus californianus) in the southern part of Baja California. Journal of Mammalogy 64:513-518.
Bakun, A., D. McLain, and F. Mayo. 1974. The mean annual cycle of coastal upwelling off western North America as observed from surface measurements. Fishery Bulletin 72:843-844.
Barlow, J. 1988. Harbor porpoise, Phocoena phocoena, abundance estimation for California, Oregon, and Washington: 1. Ship surveys. Fishery Bulletin 86:417-432.
Barth, J., S. Pierce, and R. Smith. 2000. A separating coastal upwelling jet at Cape Blanco, Oregon and its connection to the California Current System. Deep Sea Research Part II: Topical Studies in Oceanography 47:783-810.
Bellman, M., E. Heery, J. Jannot, and J. Majewski. 2010. Estimated discard and total catch of selected groundfish species in the 2009 U.S. west coast fisheries. West Coast Groundfish Observer Program, NWFSC, 2725 Montlake Blvd E., Seattle, WA 98112. http://www.nwfsc.noaa.gov/research/divisions/fram/observer/datareport/docs/total_mortality_2009.pdf
Benson, S., P. Dutton, C. Hitipeuw, B. Samber, J. Bakarbessy, and D. Parker. 2007a. Post-nesting migrations of leatherback turtles (Dermochelys coriacea) from Jamursba-Medi, Bird's Head Peninsula, Indonesia. Chelonian Conservation and Biology 6:150-154.
Benson, S., K. Forney, J. Harvey, J. Carretta, and P. Dutton. 2007b. Abundance, distribution, and habitat of leatherback turtles (Dermochelys coriacea) off California, 1990-2003. Fishery Bulletin 105:337-347.
Borges, L., A. R. Zuur, E. Rogan, and R. Officer. 2005. Choosing the best sampling unit and auxiliary variable for discards estimations. Fisheries Research 75:29-39.
Briggs, K. and E. Chu. 1986. Sooty shearwaters off California: distribution, abundance and habitat use. Condor 88:355-364.
Brillinger, D. and B. Stewart. 1998. Elephant seal movements: Modelling migration. Canadian Journal of Statistics 26:431-443.
Brown, R. and B. Mate. 1983. Abundance, movements, and feeding habits of harbor seals, Phoca vitulina, at Netarts and Tillamook bays, Oregon. Fishery Bulletin 81:291-301.

33
Burnham, K., D. Anderson, G. White, C. Brownie, and K. Pollock. 1987. Design and analysis methods for fish survival experiments based on release-recapture. American Fisheries Society Monograph 5. American Fisheries Society, Bethesda Maryland. 1987. 737.
Calambokidis, J. and J. Barlow. 1991. Chlorinated hydrocarbon concentrations and their use for describing population discreteness in harbor porpoises from Washington, Oregon, and California. in: J.E. Reynolds II & D.K.Odell, Marine mammal strandings in the United States. NOAA Technical Report 98, http://www.nmfs.noaa.gov/pr/pdfs/health/ marine_mammal_strandings.pdf
Carretta, J., K. A. Forney, M. S. Lowry, J. Barlow, J. Baker, D. Johnston, B. Hanson, R. L. Brownell Jr., J. Robbins, D. K. Mattila, K. Ralls, M. M. Muto, D. Lynch, and L. Carswell. 2009. US Pacific marine mammal stock assessments: 2009.NOAA Technical Memorandum NMFS NOAA-TM-NMFS-SAFSC-453, http://www.nmfs.noaa.gov/pr/ pdfs/sars/po2009.pdf
Carretta, J., B. Taylor, and S. Chivers. 2001. Abundance and depth distribution of harbor porpoise (Phocoena phocoena) in northern California determined from a 1995 ship survey. Fishery Bulletin 99:29-39.
Cochran, W. G. 1977. Sampling Techniques. John Wiley & Sons, New York. Defran, R. H. and D. W. Weller. 1999. Occurrence, distribution, site fidelity, and school size of
bottlenose dolphins (Tursiops truncatus) off San Diego, California. Marine Mammal Science 15:366-380.
Defran, R. H., D. W. Weller, D. L. Kelly, and M. A. Espinosa. 1999. Range characteristics of Pacific coast bottlenose dolphins (Tursiops truncatus) in the southern California bight. Marine Mammal Science 15:318-383.
Dutton, P., A. Frey, R. Leroux, and G. Balazs. 2001. Molecular ecology of leatherback turtles in the Pacific.in N. Pilcher, G. Ismail, and U. Sarawak, editors. Sea Turtles of the Indo-Pacific: Research Management & Conservation. ASEAN Academic Press.
Fazioli, K., S. Hofmann, and R. Wells. 2006. Use of Gulf of Mexico coastal waters by distinct assemblages of bottlenose dolphins (Tursiops truncatus). Aquatic Mammals 32:212-222.
Ford, R., D. Ainley, J. Casey, C. Keiper, L. Spear, and L. Ballance. 2004. The biogeographic patterns of seabirds in the central portion of the California Current. Marine Ornithology 32:77-96.
Forney, K. 1999. Trends in harbour porpoise abundance off central California, 1986-95: evidence for interannual changes in distribution? Journal of Cetacean Research and Management 1:73-80.
Forney, K. A. and J. Barlow. 1998. Seasonal patterns in the abundance and distribution of California cetaceans, 1991-1992. Marine Mammal Science 14:460-489.
Garcia-Aguilar, M. and D. Aurioles-Gamboa. 2003. Breeding season of the California sea lion (Zalophus californianus) in the Gulf of California, Mexico. Aquatic Mammals 29:67-76.
Green, G., J. Brueggeman, R. Grotefendt, C. Bowlby, M. Bonnell, and K. Balcomb III. 1992. Chapter 1 Cetacean distribution and abundance off Oregon and Washington, 1989-1990. Pages 1-100 in J. J. Brueggeman editor. Oregon and Washington Marine Mammal and Seabird Survey. Minerals Management Service, Los Angeles.
Hanson, M. T. and R. H. Defran. 1990. The behavior and feeding ecology of the Pacific coast bottlenose dolphin, Tursiops truncatus. Aquatic Mammals 19:127-142.
Harzen, S. 1998. Habitat use by the bottlenose dolphin (Tursiops trucatus) in teh Sado estuary, Portugal. Aquatic Mammals 24:117-128.
34
Hastie, G. D., B. Wilson, L. J. Wilson, K. M. Parsons, and P. M. Thompson. 2004. Functional mechanisms underlying cetacean distribution patterns: hotspots for bottlenose dolphins are linked to foraging. Marine Biology 144:397-403.
Hays, G., J. Houghton, and A. Myers. 2004. Endangered species: pan-Atlantic leatherback turtle movements. Nature 429:522.
Heery, E., M. Bellman, and J. Majewski. 2010. Estimated bycatch of marine mammals, seabirds, and sea turtles in the 2002-2008 U.S. west coast commercial groundfish fishery. West Coast Groundfish Observer Program, NWFSC, 2725 Montlake Blvd E., Seattle, WA.
Hoelzel, A. R., J. Halley, S. J. O'Brien, C. Campagna, T. Arnborm, B. Le Boeuf, K. Ralls, and G. A. Dover. 1993. Elephant Seal Genetic Variation and the Use of Simulation Models to Investigate Historical Population Bottlenecks. Journal of Heredity 84:443-449.
Hyrenbach, K. and R. Dotson. 2003. Assessing the susceptibility of female black-footed albatross (Phoebastria nigripes) to longline fisheries during their post-breeding dispersal: an integrated approach. Biological Conservation 112:391-404.
Hyrenbach, K., P. Fernandez, and D. J. Anderson. 2002. Oceanographic habitats of two sympatiric North Pacific albatross. Marine Ecology Progress Series 233:283-301.
Jaquet, N. and D. Gendron. 2002. Distribution and relative abundance of sperm whales in relation to key environmental features, squid landings and the distribution of other cetacean species in the Gulf of California, Mexico. Marine Biology 141:591-601.
Jaquet, N., D. Gendron, and A. Coakes. 2003. Sperm whales in the Gulf of California: Residency, movements, behavior, and the possible influence of variation in food supply. Marine Mammal Science 19:545-562.
Lamont, M., J. Vida, J. Harvey, S. Jeffries, R. Brown, H. Huber, R. Delong, and W. Thomas. 1996. Genetic substructure of the Pacific harbor seal (Phoca vitulina richardsi) off Washington, Oregon, and California. Marine Mammal Science 12:402-413.
Le Boeuf, B., D. Crocker, D. Costa, S. Blackwell, P. Webb, and D. Houser. 2000. Foraging ecology of northern elephant seals. Ecological Monographs 70:353-382.
Leatherwood, S., W. Perrin, V. Kirby, C. Hubbs, and M. Dahlheim. 1980. Distribution and movements of Risso's dolphin, Grampus griseus, in the eastern North Pacific. Fishery Bulletin 77:951-963.
Loughlin, T. 1997. Using the phylogeographic method to identify Stellar sea lion stocks. Pages 159-171 in A. Dizon, S. Chivers, and W. Perrin, editors. Molecular genetics of marine mammals, incorporating the proceedings of a workshop on the analysis of genetic data to address problems of stock identity as related to management of marine mammals. Society for Marine Mammology.
Lowry, L., K. Frost, J. Hoep, and R. Delong. 2001. Movements of satellite tagged subadult and adult harbor seals in Prince William Sound, Alaska. Marine Mammal Science 17:835-861.
Lowry, M., C. Oliver, C. Macky, and J. Wexler. 1990. Food habits of California sea lions Zalophus californianus at San Clemente Island, California, 1981-86. Fishery Bulletin 88:509-521.
Lowther, J. 2006. Genetic variation of coastal and offshore bottlenose dolphins, Tursiops truncatus, in the eastern North Pacific Ocean. M.S. Thesis. University of San Diego, San Diego.
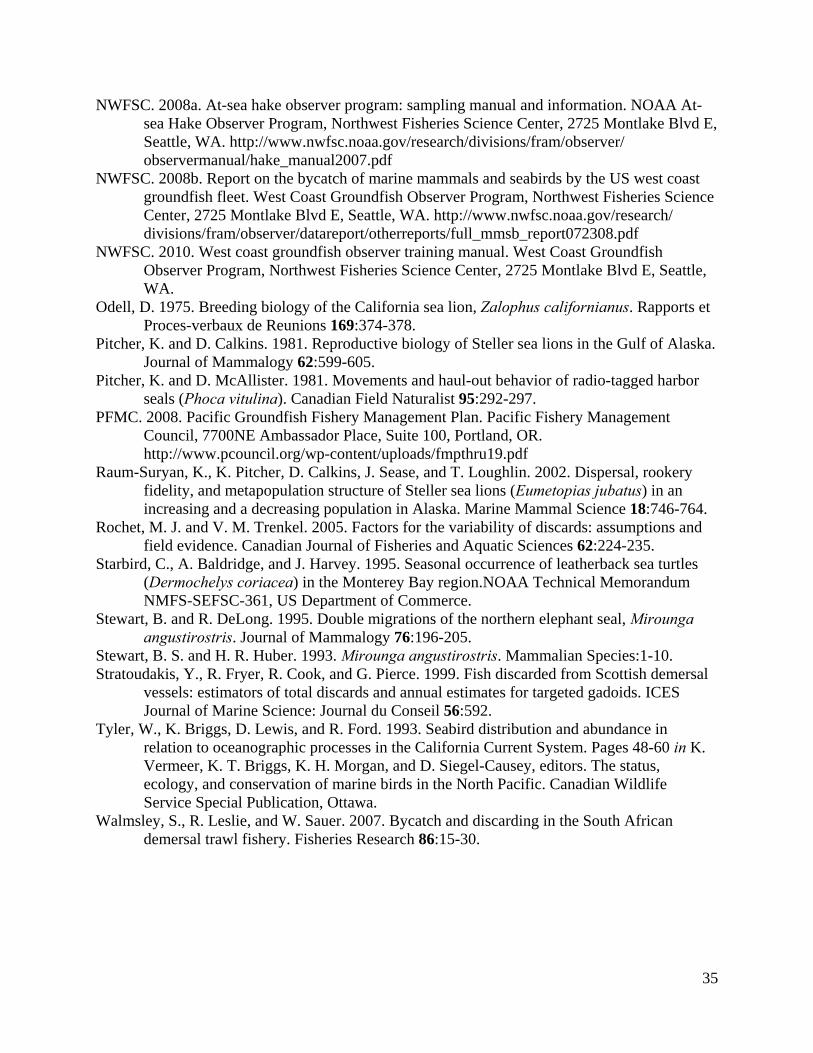
35
NWFSC. 2008a. At-sea hake observer program: sampling manual and information. NOAA At-sea Hake Observer Program, Northwest Fisheries Science Center, 2725 Montlake Blvd E, Seattle, WA. http://www.nwfsc.noaa.gov/research/divisions/fram/observer/ observermanual/hake_manual2007.pdf
NWFSC. 2008b. Report on the bycatch of marine mammals and seabirds by the US west coast groundfish fleet. West Coast Groundfish Observer Program, Northwest Fisheries Science Center, 2725 Montlake Blvd E, Seattle, WA. http://www.nwfsc.noaa.gov/research/ divisions/fram/observer/datareport/otherreports/full_mmsb_report072308.pdf
NWFSC. 2010. West coast groundfish observer training manual. West Coast Groundfish Observer Program, Northwest Fisheries Science Center, 2725 Montlake Blvd E, Seattle, WA.
Odell, D. 1975. Breeding biology of the California sea lion, Zalophus californianus. Rapports et Proces-verbaux de Reunions 169:374-378.
Pitcher, K. and D. Calkins. 1981. Reproductive biology of Steller sea lions in the Gulf of Alaska. Journal of Mammalogy 62:599-605.
Pitcher, K. and D. McAllister. 1981. Movements and haul-out behavior of radio-tagged harbor seals (Phoca vitulina). Canadian Field Naturalist 95:292-297.
PFMC. 2008. Pacific Groundfish Fishery Management Plan. Pacific Fishery Management Council, 7700NE Ambassador Place, Suite 100, Portland, OR. http://www.pcouncil.org/wp-content/uploads/fmpthru19.pdf
Raum-Suryan, K., K. Pitcher, D. Calkins, J. Sease, and T. Loughlin. 2002. Dispersal, rookery fidelity, and metapopulation structure of Steller sea lions (Eumetopias jubatus) in an increasing and a decreasing population in Alaska. Marine Mammal Science 18:746-764.
Rochet, M. J. and V. M. Trenkel. 2005. Factors for the variability of discards: assumptions and field evidence. Canadian Journal of Fisheries and Aquatic Sciences 62:224-235.
Starbird, C., A. Baldridge, and J. Harvey. 1995. Seasonal occurrence of leatherback sea turtles (Dermochelys coriacea) in the Monterey Bay region.NOAA Technical Memorandum NMFS-SEFSC-361, US Department of Commerce.
Stewart, B. and R. DeLong. 1995. Double migrations of the northern elephant seal, Mirounga angustirostris. Journal of Mammalogy 76:196-205.
Stewart, B. S. and H. R. Huber. 1993. Mirounga angustirostris. Mammalian Species:1-10. Stratoudakis, Y., R. Fryer, R. Cook, and G. Pierce. 1999. Fish discarded from Scottish demersal
vessels: estimators of total discards and annual estimates for targeted gadoids. ICES Journal of Marine Science: Journal du Conseil 56:592.
Tyler, W., K. Briggs, D. Lewis, and R. Ford. 1993. Seabird distribution and abundance in relation to oceanographic processes in the California Current System. Pages 48-60 in K. Vermeer, K. T. Briggs, K. H. Morgan, and D. Siegel-Causey, editors. The status, ecology, and conservation of marine birds in the North Pacific. Canadian Wildlife Service Special Publication, Ottawa.
Walmsley, S., R. Leslie, and W. Sauer. 2007. Bycatch and discarding in the South African demersal trawl fishery. Fisheries Research 86:15-30.

36
FIGURES Figure 1. Geographic distribution of both observed and opportunistic seabird takes by the West Coast Groundfish Observer Program and the At-Sea Hake Observer Program from 2002-2009.
(M. Bellman, Projection: WGS_1984_UTM_Zone_10N, 12/10).
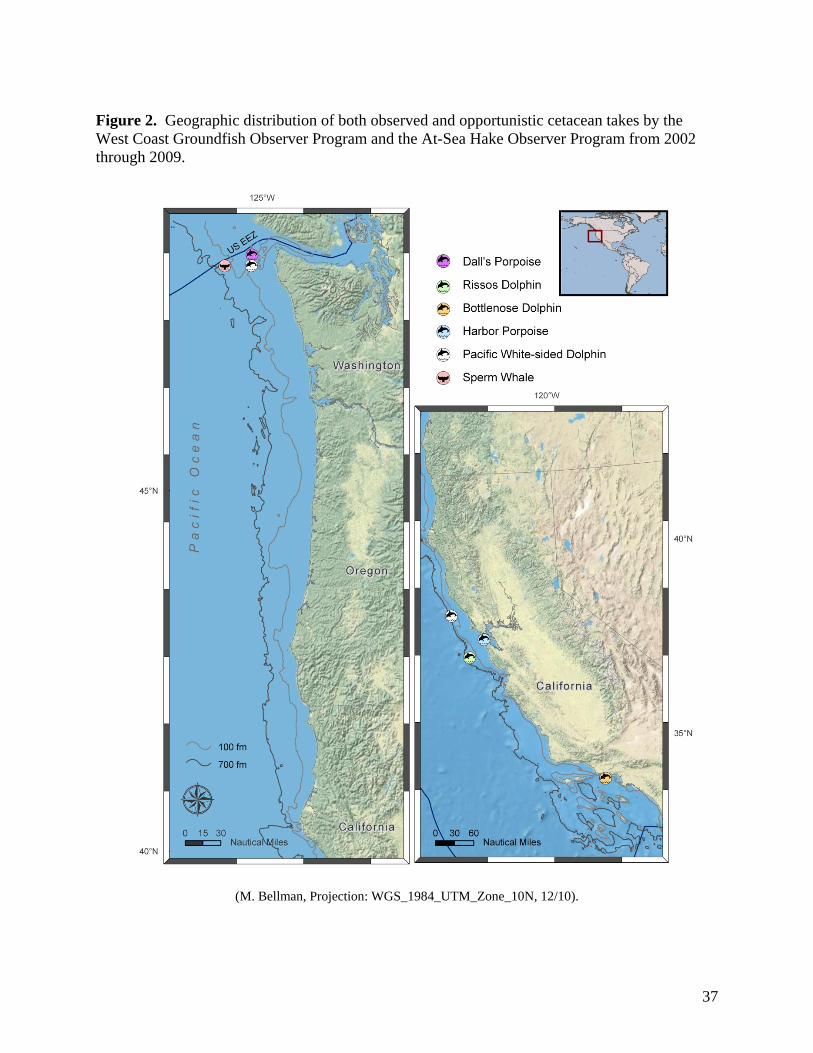
37
Figure 2. Geographic distribution of both observed and opportunistic cetacean takes by the West Coast Groundfish Observer Program and the At-Sea Hake Observer Program from 2002 through 2009.
(M. Bellman, Projection: WGS_1984_UTM_Zone_10N, 12/10).

38
Figure 3. Geographic distribution of both observed and opportunistic pinniped takes by the West Coast Groundfish Observer Program and the At-Sea Hake Observer Program from 2002 through 2009.
(M. Bellman, Projection: WGS_1984_UTM_Zone_10N, 12/10).
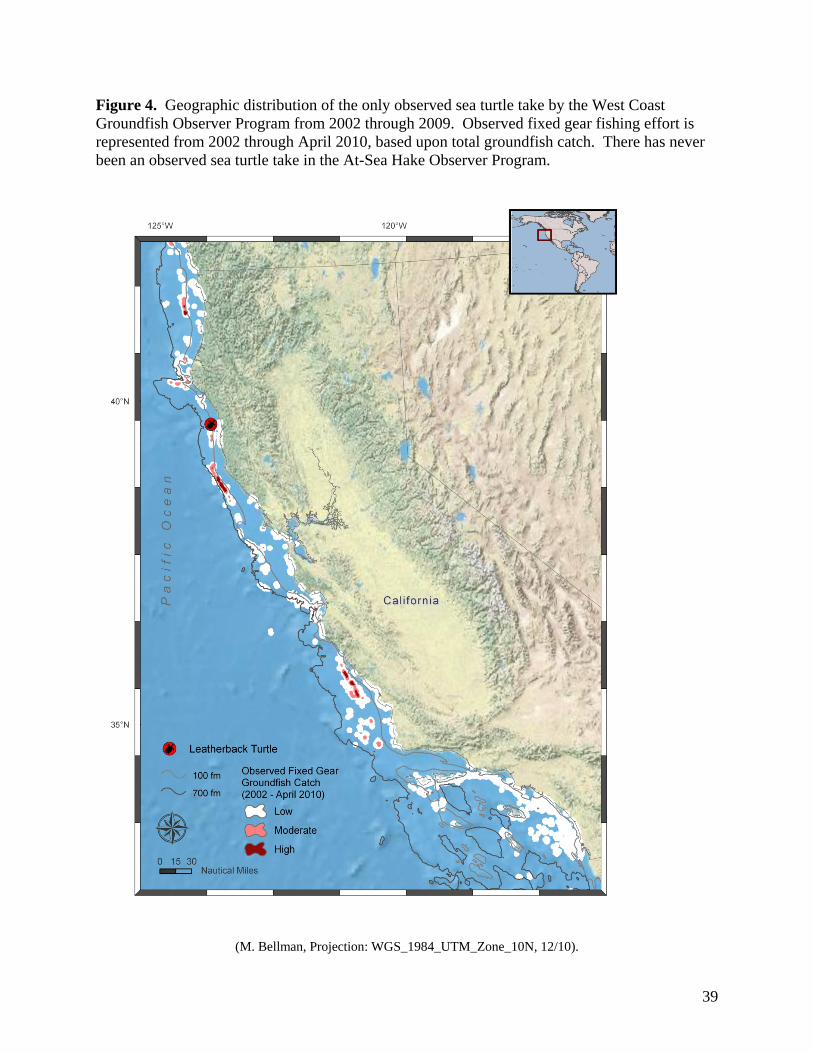
39
Figure 4. Geographic distribution of the only observed sea turtle take by the West Coast Groundfish Observer Program from 2002 through 2009. Observed fixed gear fishing effort is represented from 2002 through April 2010, based upon total groundfish catch. There has never been an observed sea turtle take in the At-Sea Hake Observer Program.
(M. Bellman, Projection: WGS_1984_UTM_Zone_10N, 12/10).

40
Common Name Scientific name ESA statusYears
observedInteraction
typeMarine mammalsCetaceans Bottlenose dolphin Tursiops truncatus 2009 2
Harbor porpoise Phocoena phocoena 2004 1Pacific white-sided dolphin Lagenorhynchus obliquidens 2002 - 03 1Risso's dolphin Grampus griseus 2008 1Sperm whale Physeter macrocephalus Endangered 2007 4
PinnipedsCalifornia sea lion Zalophus californianus 2002 - 08 1, 2, 3Harbor seal Phoca vitulina 2004 - 08 1, 2Northern elephant seal Mirounga angustirostris 2004, 2007-08 1Stellar sea lion Eumetopias jubatus Threatened 2002 - 2008 1, 2
SeabirdsBlack-footed albatross Phoebastria nigripes Under review 2002 - 08 1, 2Brandt's cormorant Phalacrocorax penicillatus 2003 1Brown pelican Pelecanus occidentalis Delisted 2004 - 06 1, 2Common murre Uria aalge 2003 - 04, 2009 1,2Cormorant unidentified Phalacrocorax sp. 2009 1Leach's storm petrel Oceanodroma leucorhoa 2002, 2007 1Northern fulmar Fulmarus glacialis 2002, 2004-05,
2007-09 1Sooty shearwater Puffinus griseus 2005 1
Western gull Larus occidentalis 2002-03, 2008-091, 2
Alcids, unidentified Alcidae 2009 1Tubenoses, unidentified Procellariiformes 2009 1Seabird, unidentified Aves 2009 1
Sea turtlesLeatherback turtle Dermochelys coriacea Endangered 2007 1
Species recorded opportunistically
Marine mammalsDall's porpoise Phocoenoides dalli 2002 1California sea lion Zalophus californianus 2009 1
SeabirdsBlack-footed albatross Phoebastria nigripes Under review 2009 4Cassin's auklet Ptychoramphus aleuticus 2004 5Marbled murrelet Brachyramphus marmoratus Threatened 2002 5
Northern fulmar Fulmarus glacialis 2009 4Short-tailed albatross Phoebastria albatrus Endangered 2002 6
Interaction types1 = Killed by gear 4 = Vessel collision2 = Gear entanglement 5 = Boarded vessel only3 = Lethal removal 6 = Feeding on catch only
TABLES Table 1. Species and taxonomic groups for which takes were observed in US west coast groundfish fisheries. Takes are either randomly observed (i.e., contribute to bycatch estimates), recorded opportunistically (i.e., non-random, do not contribute to bycatch estimate), or both. A list of all species observed opportunistically can be found in Table 6.
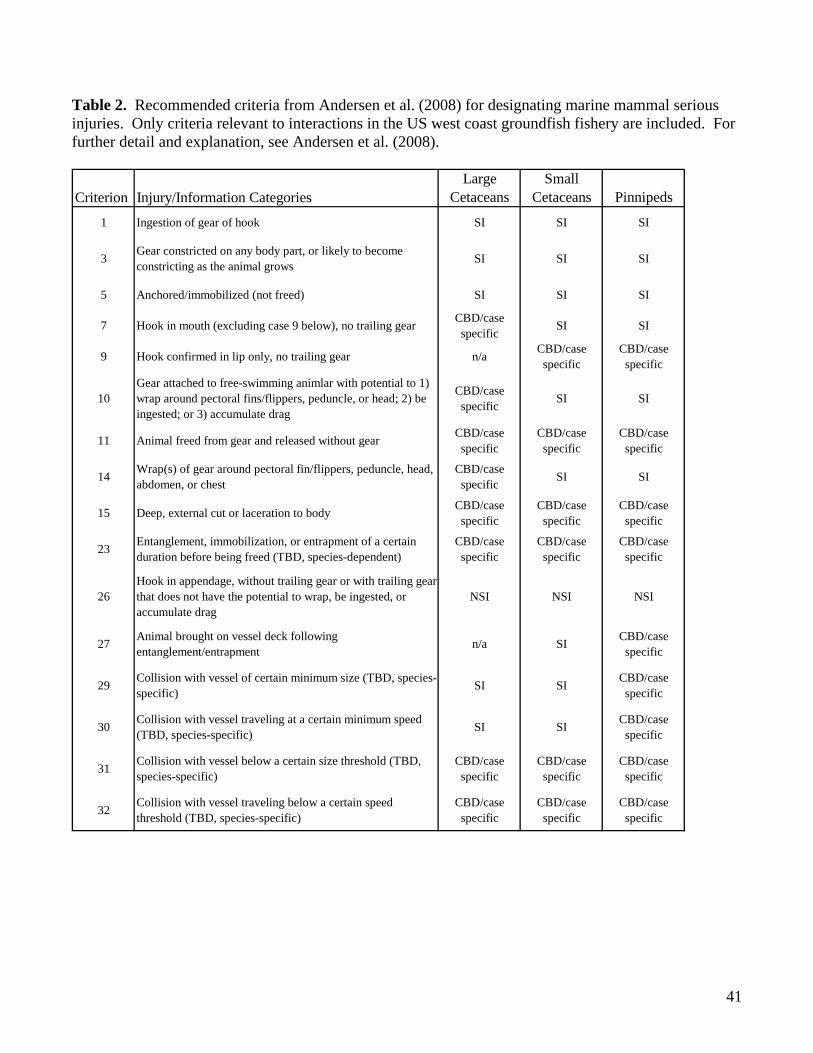
41
Table 2. Recommended criteria from Andersen et al. (2008) for designating marine mammal serious injuries. Only criteria relevant to interactions in the US west coast groundfish fishery are included. For further detail and explanation, see Andersen et al. (2008).
Criterion Injury/Information CategoriesLarge
CetaceansSmall
Cetaceans Pinnipeds
1 Ingestion of gear of hook SI SI SI
3Gear constricted on any body part, or likely to become constricting as the animal grows
SI SI SI
5 Anchored/immobilized (not freed) SI SI SI
7 Hook in mouth (excluding case 9 below), no trailing gearCBD/case specific
SI SI
9 Hook confirmed in lip only, no trailing gear n/aCBD/case specific
CBD/case specific
10Gear attached to free-swimming animlar with potential to 1) wrap around pectoral fins/flippers, peduncle, or head; 2) be ingested; or 3) accumulate drag
CBD/case specific
SI SI
11 Animal freed from gear and released without gearCBD/case specific
CBD/case specific
CBD/case specific
14Wrap(s) of gear around pectoral fin/flippers, peduncle, head, abdomen, or chest
CBD/case specific
SI SI
15 Deep, external cut or laceration to bodyCBD/case specific
CBD/case specific
CBD/case specific
23Entanglement, immobilization, or entrapment of a certain duration before being freed (TBD, species-dependent)
CBD/case specific
CBD/case specific
CBD/case specific
26Hook in appendage, without trailing gear or with trailing gear that does not have the potential to wrap, be ingested, or accumulate drag
NSI NSI NSI
27Animal brought on vessel deck following entanglement/entrapment
n/a SICBD/case specific
29Collision with vessel of certain minimum size (TBD, species-specific)
SI SICBD/case specific
30Collision with vessel traveling at a certain minimum speed (TBD, species-specific)
SI SICBD/case specific
31Collision with vessel below a certain size threshold (TBD, species-specific)
CBD/case specific
CBD/case specific
CBD/case specific
32Collision with vessel traveling below a certain speed threshold (TBD, species-specific)
CBD/case specific
CBD/case specific
CBD/case specific

42
Table 3. Stratification system used to estimate bycatch for marine mammal, seabird, and turtle species. Strata were selected based on the population structure, geographic distribution, and seasonal abundance of each species, and incorporated certain latitudinal lines relating to the fishery when appropriate. Primary literature used as the foundation for selecting strata is noted on the far right, with a more comprehensive explanation detailed in the Methods.
Latitudinal breaks SeasonsMarine mammalsCetaceans
Bottlenose Dolphin (Tursiops truncatus)No stratification Carretta et al. 2009, Defran et al. 1999,
Fazioli et al. 2006, Forney et al. 1998, Hanson et al. 1990, Hastie et al. 2004, Lowther 2006
Harbor porpoise (Phocoena phocoena)Latitudinal strata only Cape Blanco, OR
42° 50' NPt Conception, CA 34° 27' N
-- Barlow 1988, Carretta et al. 2009, Calambokidis and Barlow 1991, Forney 1999, Green et al. 1992
Pacific white-sided dolphin (Lagenorhynchus obliquidens )Latitudinal strata only 40?10' N -- Carretta et al. 2008, Forney and Barlow
1998, Green et al. 1992 Risso's dolphin (Grampus griseus )
Latitudinal strata only 40?10' N Pt Conception, CA34° 27' N
-- Forney and Barlow 1998, Green et al. 1992, Leatherwood et al. 1980
Sperm whale (Physeter macrocephalus )Latitudinal & seasonal strata 40?10' N winter (Dec-Mar)
non-winter (Apr-Nov)Carretta et al. 2009, Jaquet et al. 2002, Jaquet et al. 2003
PinnipedsCalifornia sea lion (Zalophus californianus )
Seasonal strata; latitudinal strata for LE bottom trawl only
40?10' N - LE bottom trawl only
breeding (May-Aug)non-breeding (Sep-Apr)
Aurioles et al. 1983, Carretta et al. 2009, Garcia-Aguilar and Aurioles-Gamboa 2003, Lowry et al. 1990, Odell 1975
Harbor seal (Phoca vitulina )Latitudinal strata only OR/CA border
42? N -- Brown and Mate 1983, Carretta et al.
2009, LaMont et al. 1996, Lowry et al. 2001, Pitcher and McAllister 1981
Northern elephant seal (Mirounga angustirostris )Seasonal strata only -- breeding (Dec-Mar)
non-breeding (Apr-Nov)Brillinger and Stewart 1998, Le Boeuf et al. 2000, Hoelzel et al. 1993, Stewart and DeLong 1995 Stewart and Huber 1993
Steller sea lion (Eumetopias jubatus )Seasonal strata only -- breeding (May-Jul)
non-breeding (Aug-Apr)Carretta et al. 2009, Loughlin 1997, Pitcher and Calkins 1981, Raum-Suryan et al. 2002
SeabirdsAll species
Latitudinal & seasonal strata Cape Blanco, OR42° 50' N
winter (Jan-Apr)summer (May-Aug)fall (Sep-Dec)
Ainley et al. 2005, Bakun et al. 1974, Barth et al. 2000, Briggs and Chu 1986, Ford et al. 2004, Hyrenbach et al. 2002, Tyler et al. 1993
Sea turtlesLeatherback turtle (Dermochelys coriacea )
Applied 3 approaches: (1) Seasonal strata only (2) Latitudinal strata only (3) Seasonal & latitudinal strata
Cape Blanco, OR 42° 50' NPt Conception, CA 34° 27' N
winter/spring (Dec-May)summer/fall (Jun-Nov)
Bakun et al. 1974, Barth et al. 2000, Benson et al. 2007a, Benson et al. 2007b, Dutton et al. 2000, Forney et al. 2007, Hays et al. 2004, Starbird et al. 1995
Stratification schemeSpecies Supporting references

43
Table 4. Summary of observer coverage in the at-sea hake fishery sector by the At-Sea Hake Observer Program (A-SHOP). The total catch (mt), number of cruises, number of vessels, and number of tows for the entire at-sea sector is summarized on the far left. Columns to the right present the number and percentage of tows that were observed, followed by the average sampled weight (mt) and total catch weight (mt) on sampled tows, as well as the average percent of total catch on sampled tows.
YearTotal catch
(mt)Number of
cruisesNumber of
vesselsNumber of
towsNumber of
sampled tows % of tows observed
Avg sampled catch weight per tow (mt)
Avg total catch weight per tow (mt)
Avg % of catch sampled per
tow2002 86,408 10 9 1,766 1,754 99% 17.5 48.9 37%2003 88,157 11 10 1,844 1,825 99% 18.2 47.8 38%2004 122,738 17 10 2,700 2,689 100% 16.7 45.5 38%2005 152,857 18 12 3,007 2,999 100% 23.8 50.8 46%2006 141,184 22 15 2,938 2,883 98% 23.2 48.1 49%2007 127,564 23 15 2,880 2,857 99% 22.5 44.3 53%2008 184,631 28 13 3,617 3,590 99% 24.5 51.1 49%2009 76,899 13 11 1,872 1,863 100% 19.2 41.1 47%
Observer samplingTotal fleet Observed hauls

44
Table 5. Summary of observer coverage in non-hake groundfish sectors by the West Coast Groundfish Observer Program. Total fleet landings (mt) are summarized in the left-hand column, followed by a general description of the geographic area in which the fleet operates, and the geographic area that has been included in observer sampling from 2002 through 2009. In the columns to the right, the observed number of trips, tows/sets, and vessels are reported along with total observed landings of target species (mt) and the percentage of target species landings that was observed in each year and fishery sector. The target species for each sector is listed in italics below the name of that fishery sector.
Total fleet
Landings of target
species (mt)
General range of fleet
Range observed
Number of observed
trips
Number of observed tows/sets
Number of observed vessels
Observed landings of
target species (mt)
Total % observed
Limited Entry Trawl
Target species : All FMP groundfish except Pacific hake (see Appendix B)2002 20,418 585 3416 135 2,952 14.5%2003 18,830 475 2474 127 2,826 15.0%2004 17,977 623 3733 103 4,751 26.4%2005 19,593 527 3674 105 4,534 23.1%2006 18,040 494 3316 88 3,901 21.6%2007 20,586 378 2736 89 3,715 18.0%2008 24,287 493 3638 104 5,433 22.4%2009 26,159 588 4381 101 6,045 23.1%
California halibut trawl fishery
Target species : California halibutLimited Entry Sector
2002 112 21 57 8 4 3.2%2003 112 73 219 12 20 18.2%2004 140 46 185 8 35 25.2%2005 194 74 239 10 31 15.9%2006 123 78 230 9 15 11.9%2007 42 40 81 5 5 12.8%2008 39 53 149 6 14 35.0%2009 48 13 29 3 3 6.0%
Open Access Sector2002 90 -- 0 0 0 - 0.0%2003 46 18 110 5 2 4.3%2004 80 54 251 5 5 6.4%2005 77 60 370 7 8 10.2%2006 61 -- 0 0 0 - 0.0%2007 39 49 229 8 3 6.9%2008 50 49 199 7 3 5.2%2009 85 9 30 3 0.6 0.7%
Pink shrimp fishery
Target species : Pink shrimp2002 25,375 -- 0 0 0 - 0.0%2003 13,887 -- 0 0 0 - 0.0%2004 8,974 57 1180 22 634 7.1%2005 10,862 38 638 23 472 4.3%2006 8,400 -- 0 0 0 - 0.0%2007 10,935 66 1109 30 749 6.9%2008 15,375 56 911 31 901 5.9%2009 14,412 58 695 36 867 6.0%
Spatial distribution Observed fleet
Cape Mendicino
to Pt Lopez, CA
South of Pt Lopez, CA
South of Pt Lopez, CA
Cape Mendicino
to Pt Lopez, CA
South of Pt Lopez, CA
Coastwide Coastwide
Northern California,
Oregon, Washington
California & Oregon
California & Oregon
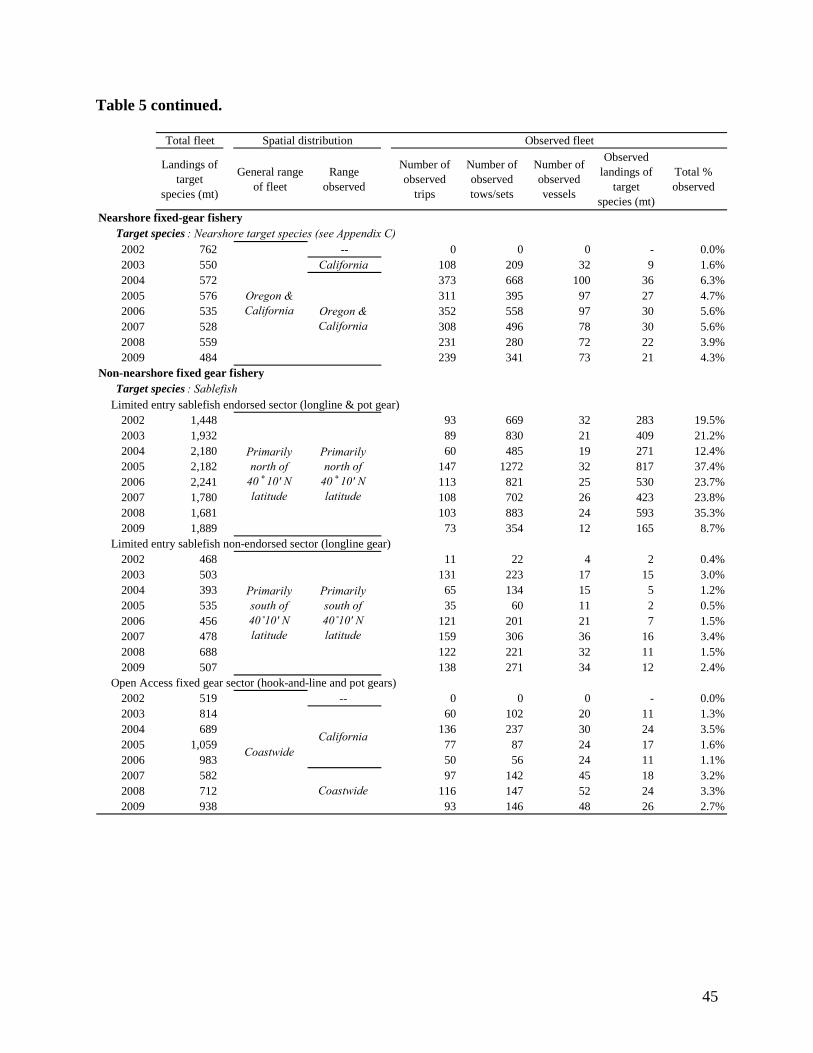
45
Table 5 continued.
Total fleet
Landings of target
species (mt)
General range of fleet
Range observed
Number of observed
trips
Number of observed tows/sets
Number of observed vessels
Observed landings of
target species (mt)
Total % observed
Nearshore fixed-gear fisheryTarget species : Nearshore target species (see Appendix C)2002 762 -- 0 0 0 - 0.0%2003 550 California 108 209 32 9 1.6%2004 572 373 668 100 36 6.3%2005 576 311 395 97 27 4.7%2006 535 352 558 97 30 5.6%2007 528 308 496 78 30 5.6%2008 559 231 280 72 22 3.9%2009 484 239 341 73 21 4.3%
Non-nearshore fixed gear fisheryTarget species : Sablefish
Limited entry sablefish endorsed sector (longline & pot gear)2002 1,448 93 669 32 283 19.5%2003 1,932 89 830 21 409 21.2%2004 2,180 60 485 19 271 12.4%2005 2,182 147 1272 32 817 37.4%2006 2,241 113 821 25 530 23.7%2007 1,780 108 702 26 423 23.8%2008 1,681 103 883 24 593 35.3%2009 1,889 73 354 12 165 8.7%
Limited entry sablefish non-endorsed sector (longline gear)2002 468 11 22 4 2 0.4%2003 503 131 223 17 15 3.0%2004 393 65 134 15 5 1.2%2005 535 35 60 11 2 0.5%2006 456 121 201 21 7 1.5%2007 478 159 306 36 16 3.4%2008 688 122 221 32 11 1.5%2009 507 138 271 34 12 2.4%
Open Access fixed gear sector (hook-and-line and pot gears)2002 519 -- 0 0 0 - 0.0%2003 814 60 102 20 11 1.3%2004 689 136 237 30 24 3.5%2005 1,059 77 87 24 17 1.6%2006 983 50 56 24 11 1.1%2007 582 97 142 45 18 3.2%2008 712 116 147 52 24 3.3%2009 938 93 146 48 26 2.7%
CoastwideCalifornia
Coastwide
Primarily north of
40 ˚ 10' N latitude
Primarily north of
40 ˚ 10' N latitude
Primarily south of 40˚10' N latitude
Primarily south of 40˚10' N latitude
Oregon & California Oregon &
California
Spatial distribution Observed fleet

46
Table 6. Summary of opportunistic (non-randomly collected) data recorded by A-SHOP and WCGOP observers on marine mammal, seabird and sea turtle interactions, which are not included in bycatch estimation. A-SHOP opportunistic data for mammals result when the observer is alerted to a marine mammal take from an at-sea hake tow that was not monitored for marine mammals. WCGOP observers achieve a complete census of marine mammal takes and interactions on non-hake vessels, and all observed data records for marine mammals from WCGOP are included in bycatch estimation. The few rare opportunistic observations of mammal takes in WCGOP fisheries occurred when an observer was aboard a vessel fishing under highly specialized circumstances (e.g., an exempted fishing permit or contracted for research) and therefore were not subject to normal WCGOP protocols. Seabirds are normally observed as part of the species composition sample in both the A-SHOP and WCGOP programs. Opportunistic data on seabirds were collected outside of regular species composition sampling, and thus in a non-random fashion. On at-sea hake vessels, this occurs when the observer notes an interaction that took place on deck. On non-hake vessels, this occurs when there is an interaction that does not result in an immediate mortality and the seabird either departs injured or unharmed. Seabirds that are killed by fishing interactions on observed non-hake vessels are always sampled as part of the discarded catch under WCGOP protocols.
Number recorded Years
Number recorded Years
Marine mammalsCetaceans
Dall's porpoise 1 2002Pacific white-sided dolphin 1 2002
PinnipedsCalifornia sea lion 2 2002, 2008 3 2009
Seabirds
Black-footed albatross 3 2007, 2009 82002, 2004-2006, 2008
Brown pelican -- 1 2006Cassin's auklet -- 1 2004Leach's storm petrel -- 1 2007Northern fulmar 13 2007-2008 2 2008, 2009Marbled murrelet -- 1 2002Western gull -- 1 2008Gull, unidentified 15 2007 2 2005Shearwater, unidentified 1 2007 -- Seabird, unidentified -- 19 2002, 2005
Only 2007-2009 available All records 2002 - 2009
All records 2002 - 2009
At-Sea Hake Observer Program(at-sea hake sector)
West Coast Groundfish Observer Program(non-hake sectors)
All records 2002 - 2009

47
Table 7. Summary of observed and estimated bycatch for marine mammals. The ‘Observed bycatch’ table presents the number of takes observed in each fishery sector and the total number of observed takes by year, followed by the number of takes that contributed to final bycatch estimates (produced a strata-specific CV of 80% or less) and the number that did not contribute to final bycatch estimates (produced a strata-specific CV greater than 80%). When it was possible to report bycatch estimates, an ‘Estimated bycatch’ table was also included below to present (1) base bycatch estimates and 90% confidence intervals summed from all strata with a CV less than 80% (left), and (2) bycatch estimates from sensitivity analyses in which the bycatch ratio applied to the unobserved portion of the fleet was increased by X% (values defined in table). Cetaceans are reported first, followed by pinnipeds. 7a. Bottlenose dolphin (Tursiops truncatus)
LE sector OA sector LE PrimaryLE Non-Primary
OA
2002 0 0 0 0 0 0 0 0 0 0 0 02003 0 0 0 0 0 0 0 0 0 0 0 02004 0 0 0 0 0 0 0 0 0 0 0 02005 0 0 0 0 0 0 0 0 0 0 0 02006 0 0 0 0 0 0 0 0 0 0 0 02007 0 0 0 0 0 0 0 0 0 0 0 02008 0 0 0 0 0 0 0 0 0 0 0 02009 0 0 0 0 0 1* 0 0 0 1 0 1
# excluded in estimation
* Includes observations that produced bycatch estimates with a coefficient of variation greater than 80%.
Observed bycatch(number of animals )
LE TrawlCA Halibut trawl Pink
shrimp
Non-nearshore fixed gearNearshore fixed gear
At-sea hake Total# included in
estimation

48
7b. Harbor porpoise (Phocoena phocoena)
LE sector OA sector LE PrimaryLE Non-Primary
OA
2002 0 0 0 0 0 0 0 0 0 0 0 02003 0 0 0 0 0 0 0 0 0 0 0 02004 0 1* 0 0 0 0 0 0 0 1 0 12005 0 0 0 0 0 0 0 0 0 0 0 02006 0 0 0 0 0 0 0 0 0 0 0 02007 0 0 0 0 0 0 0 0 0 0 0 02008 0 0 0 0 0 0 0 0 0 0 0 02009 0 0 0 0 0 0 0 0 0 0 0 0
# excluded in estimation
* Includes observations that produced bycatch estimates with a coefficient of variation greater than 80%.
LE TrawlCA Halibut trawl Pink
shrimp
Non-nearshore fixed gearNearshore fixed gear
At-sea hake
Observed bycatch(number of animals )
Total# included in
estimation
7c. Pacific white-sided dolphin (Lagenorhynchus obliquidens)
LE sector OA sector LE PrimaryLE Non-Primary
OA
2002 0 0 0 0 0 0 0 0 0 0 0 02003 1* 0 0 0 0 0 0 0 0 1 0 12004 0 0 0 0 0 0 0 0 0 0 0 02005 0 0 0 0 0 0 0 0 0 0 0 02006 0 0 0 0 0 0 0 0 0 0 0 02007 0 0 0 0 0 0 0 0 0 0 0 02008 0 0 0 0 0 0 0 0 0 0 0 02009 0 0 0 0 0 0 0 0 0 0 0 0
# excluded in estimation
* Includes observations that produced bycatch estimates with a coefficient of variation greater than 80%.
Total# included in
estimation
Observed bycatch(number of animals )
LE TrawlCA Halibut trawl Pink
shrimp
Non-nearshore fixed gearNearshore fixed gear
At-sea hake

49
7d. Risso’s dolphin (Grampus griseus)
LE sector OA sector LE PrimaryLE Non-Primary
OA
2002 0 0 0 0 0 0 0 0 0 0 0 02003 0 0 0 0 0 0 0 0 0 0 0 02004 0 0 0 0 0 0 0 0 0 0 0 02005 0 0 0 0 0 0 0 0 0 0 0 02006 0 0 0 0 0 0 0 0 0 0 0 02007 0 0 0 0 0 0 0 0 0 0 0 02008 1* 0 0 0 0 0 0 0 0 1 0 12009 0 0 0 0 0 0 0 0 0 0 0 0
# excluded in estimation
LE TrawlCA Halibut trawl Pink
shrimp
Non-nearshore fixed gearNearshore fixed gear
At-sea hake
Observed bycatch(number of animals )
Total# included in
estimation
* Includes observations that produced bycatch estimates with a coefficient of variation greater than 80%. 7e. Sperm whale (Physeter macrocephalus)
LE sector OA sector LE PrimaryLE Non-Primary
OA
2002 0 0 0 0 0 0 0 0 0 0 0 02003 0 0 0 0 0 0 0 0 0 0 0 02004 0 0 0 0 0 0 0 0 0 0 0 02005 0 0 0 0 0 0 0 0 0 0 0 02006 0 0 0 0 0 0 0 0 0 0 0 02007 0 0 0 0 1* 0 0 0 0 1 0 12008 0 0 0 0 0 0 0 0 0 0 0 02009 0 0 0 0 0 0 0 0 0 0 0 0
Nearshore fixed gear
At-sea hake Total# included in
estimationLE Trawl
CA Halibut trawl Pink shrimp
Non-nearshore fixed gear # excluded in estimation
Observed bycatch(number of animals )
* Includes observations that produced bycatch estimates with a coefficient of variation greater than 80%.

50
7f. California sea lions (Zalophus californianus)
LE sector OA sector LE PrimaryLE Non-Primary
OA
2002 3* 2 0 0 0 0 0 0 0 5 2 32003 14* 14 0 0 1* 0 0 0 2 31 21 102004 1* 2 1* 0 1* 1* 0 0 2 8 4 42005 4* 1* 4* 0 5 0 0 0 0 14 7 72006 4* 14* 0 0 0 0 0 1* 2 21 16 52007 3* 4 0 0 0 1* 0 0 0 8 4 42008 1* 5 1* 0 0 0 0 0 0 7 5 22009 4* 0 0 0 0 0 0 0 0 4 3 1
Y90% CI lower
90% CI upper X = 10% X = 50% X = 100% X = 300%
2002 46 17 119 50 68 90 1792003 116 57 249 125 163 211 4012004 13 5 35 14 18 23 422005 21 10 47 23 29 36 662006 95 41 223 103 135 175 3342007 31 10 98 34 45 58 1132008 13 6 25 14 17 21 382009 10 4 21 10 13 17 31
(number of animals)
Base estimateSensitivity analyses
Unobserved discard ratio increased by X%
* Includes observations that produced bycatch estimates with a coefficient of variation greater than 80%.
Estimated bycatch
At-sea hake Total# included in
estimation# excluded in
estimation
Observed bycatch(number of animals )
LE TrawlCA Halibut trawl Pink
shrimp
Non-nearshore fixed gearNearshore fixed gear

51
7g. Harbor seal (Phoca vitulina)
LE sector OA sector LE PrimaryLE Non-Primary
OA
2002 0 0 0 0 0 0 0 0 0 0 0 02003 0 0 0 0 0 0 0 0 0 0 0 02004 0 0 0 0 0 0 0 0 1 1 1 02005 0 0 0 0 0 0 0 0 1 1 1 02006 0 1* 0 0 0 0 0 1* 1 3 1 22007 0 0 0 0 0 0 0 0 0 0 0 02008 0 0 0 0 0 0 0 2 2 4 4 02009 0 0 0 0 0 1* 0 0 0 1 0 1
Y90% CI lower
90% CI upper X = 10% X = 50% X = 100% X = 300%
2002 0 0 0 0 0 0 02003 0 0 0 0 0 0 02004 1 0 1 1 1 1 12005 1 0 3 1 1 1 22006 1 0 2 1 1 1 12007 0 0 0 0 0 0 02008 29 11 78 32 42 54 1052009 -- -- -- -- -- -- --
Base estimateSensitivity analyses
Unobserved discard ratio increased by X%
# excluded in estimation
* Includes observations that produced bycatch estimates with a coefficient of variation greater than 80%.
Estimated bycatch(number of animals)
Observed bycatch(number of animals )
LE TrawlCA Halibut trawl Pink
shrimp
Non-nearshore fixed gearNearshore fixed gear
At-sea hake Total# included in
estimation
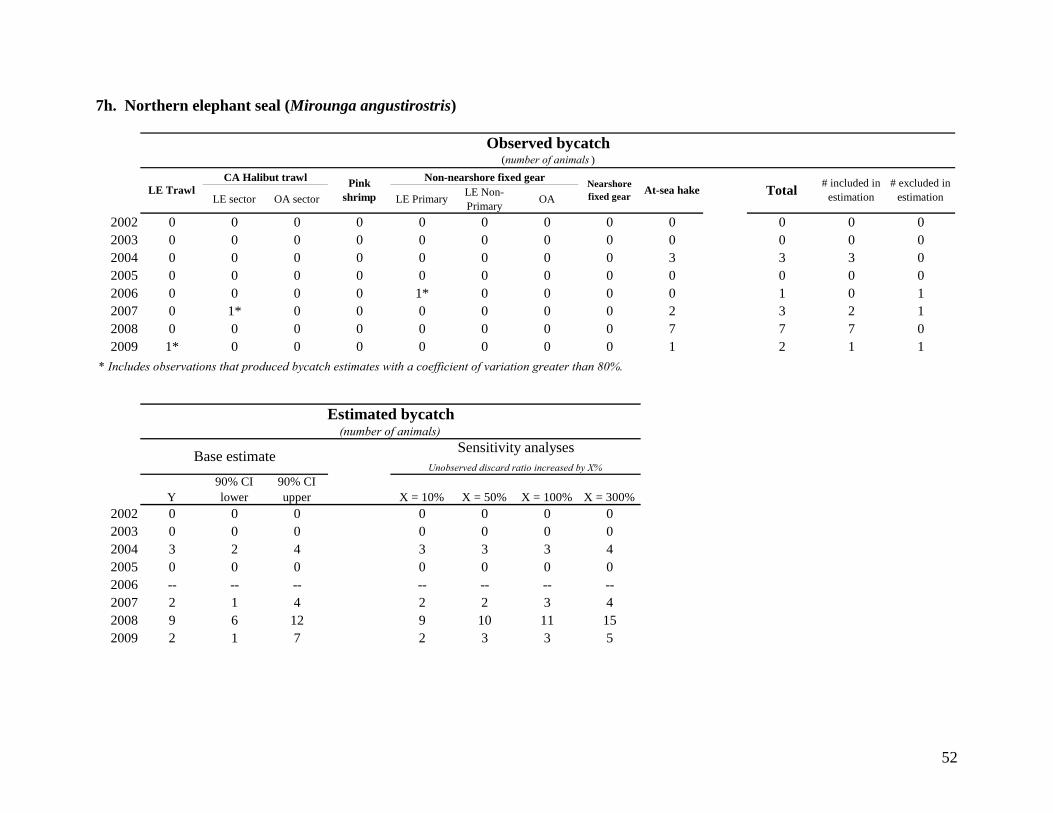
52
7h. Northern elephant seal (Mirounga angustirostris)
LE sector OA sector LE PrimaryLE Non-Primary
OA
2002 0 0 0 0 0 0 0 0 0 0 0 02003 0 0 0 0 0 0 0 0 0 0 0 02004 0 0 0 0 0 0 0 0 3 3 3 02005 0 0 0 0 0 0 0 0 0 0 0 02006 0 0 0 0 1* 0 0 0 0 1 0 12007 0 1* 0 0 0 0 0 0 2 3 2 12008 0 0 0 0 0 0 0 0 7 7 7 02009 1* 0 0 0 0 0 0 0 1 2 1 1
Y90% CI lower
90% CI upper X = 10% X = 50% X = 100% X = 300%
2002 0 0 0 0 0 0 02003 0 0 0 0 0 0 02004 3 2 4 3 3 3 42005 0 0 0 0 0 0 02006 -- -- -- -- -- -- --2007 2 1 4 2 2 3 42008 9 6 12 9 10 11 152009 2 1 7 2 3 3 5
* Includes observations that produced bycatch estimates with a coefficient of variation greater than 80%.
Estimated bycatch(number of animals)
Base estimateSensitivity analyses
Unobserved discard ratio increased by X%
At-sea hake Total# included in
estimation# excluded in
estimation
Observed bycatch(number of animals )
LE TrawlCA Halibut trawl Pink
shrimp
Non-nearshore fixed gearNearshore fixed gear

53
7i. Steller sea lion (Eumetopias jubatus)
LE sector OA sector LE PrimaryLE Non-Primary
OA
2002 2 0 0 0 0 0 0 0 1 3 3 02003 0 0 0 0 0 0 0 0 1 1 1 02004 0 0 0 0 0 0 0 0 0 0 0 02005 0 0 0 0 0 0 0 0 2 2 2 02006 0 0 0 0 0 0 0 0 3 3 3 02007 0 1* 0 0 0 0 0 0 3 4 3 12008 0 1 0 0 0 0 0 0 1 2 2 02009 4* 0 0 0 0 0 0 0 0 4 3 1
Y90% CI lower
90% CI upper X = 10% X = 50% X = 100% X = 300%
2002 14 5 37 15 20 25 482003 1 0 2 1 1 1 12004 0 0 0 0 0 0 02005 2 1 5 3 3 3 52006 3 2 5 3 4 4 62007 4 2 6 4 4 5 72008 3 1 11 4 4 5 92009 17 7 45 12 16 20 37
(number of animals )
LE TrawlCA Halibut trawl Pink
shrimp
* Includes observations that produced bycatch estimates with a coefficient of variation greater than 80%.
Estimated bycatch(number of animals)
Base estimateSensitivity analyses
Unobserved discard ratio increased by X%
Non-nearshore fixed gearNearshore fixed gear
At-sea hake Total# included in
estimation# excluded in
estimation
Observed bycatch

54
7j. Unspecified sea lions
LE sector OA sector LE PrimaryLE Non-Primary
OA
2002 1* 0 0 0 0 0 0 0 0 1 0 12003 0 0 0 0 0 0 0 0 0 0 0 02004 0 0 0 0 0 0 0 0 0 0 0 02005 0 0 0 0 0 0 0 0 0 0 0 02006 0 0 0 0 0 0 0 0 0 0 0 02007 0 0 0 0 0 1* 0 0 0 1 0 12008 0 0 0 0 0 0 0 0 0 0 0 02009 0 0 0 0 0 0 0 0 0 0 0 0
# included in estimation
# excluded in estimation
(number of animals )
LE TrawlCA Halibut trawl Pink
shrimp
Non-nearshore fixed gearNearshore fixed gear
At-sea hake Total
Observed bycatch
* Includes observations that produced bycatch estimates with a coefficient of variation greater than 80%.
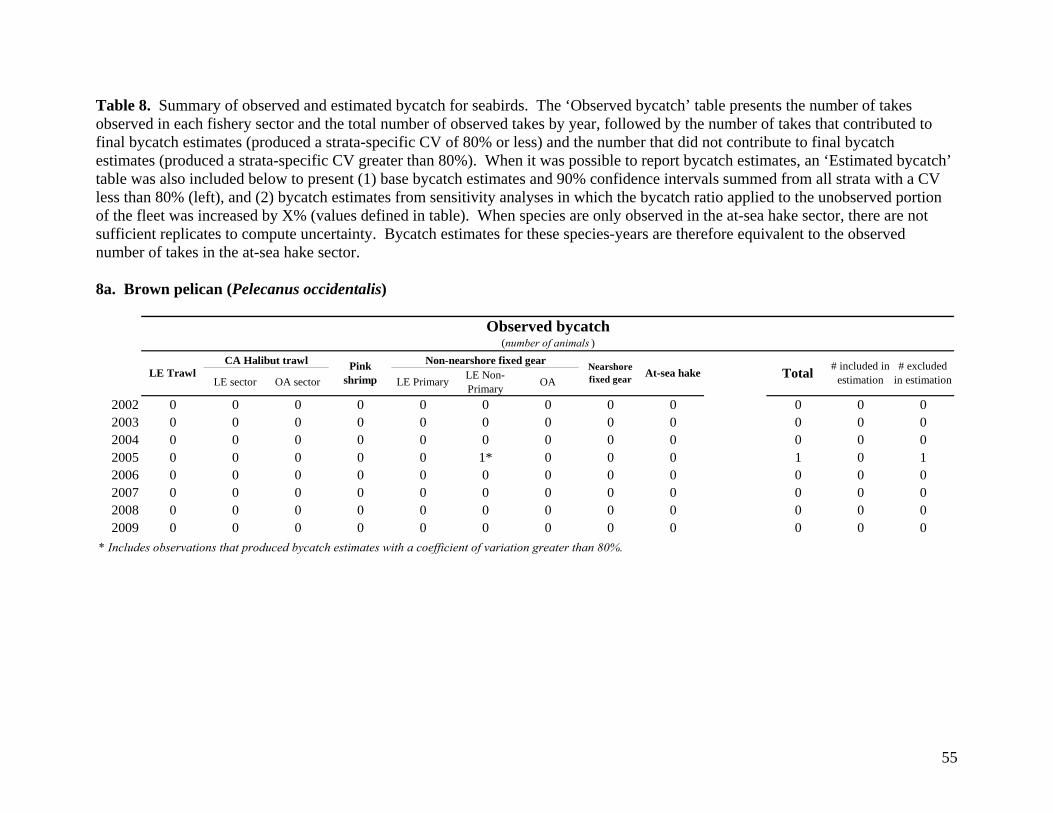
55
Table 8. Summary of observed and estimated bycatch for seabirds. The ‘Observed bycatch’ table presents the number of takes observed in each fishery sector and the total number of observed takes by year, followed by the number of takes that contributed to final bycatch estimates (produced a strata-specific CV of 80% or less) and the number that did not contribute to final bycatch estimates (produced a strata-specific CV greater than 80%). When it was possible to report bycatch estimates, an ‘Estimated bycatch’ table was also included below to present (1) base bycatch estimates and 90% confidence intervals summed from all strata with a CV less than 80% (left), and (2) bycatch estimates from sensitivity analyses in which the bycatch ratio applied to the unobserved portion of the fleet was increased by X% (values defined in table). When species are only observed in the at-sea hake sector, there are not sufficient replicates to compute uncertainty. Bycatch estimates for these species-years are therefore equivalent to the observed number of takes in the at-sea hake sector. 8a. Brown pelican (Pelecanus occidentalis)
LE sector OA sector LE PrimaryLE Non-Primary
OA
2002 0 0 0 0 0 0 0 0 0 0 0 02003 0 0 0 0 0 0 0 0 0 0 0 02004 0 0 0 0 0 0 0 0 0 0 0 02005 0 0 0 0 0 1* 0 0 0 1 0 12006 0 0 0 0 0 0 0 0 0 0 0 02007 0 0 0 0 0 0 0 0 0 0 0 02008 0 0 0 0 0 0 0 0 0 0 0 02009 0 0 0 0 0 0 0 0 0 0 0 0
* Includes observations that produced bycatch estimates with a coefficient of variation greater than 80%.
At-sea hake Total# included in
estimation# excluded
in estimation
Observed bycatch(number of animals )
LE TrawlCA Halibut trawl Pink
shrimp
Non-nearshore fixed gearNearshore fixed gear
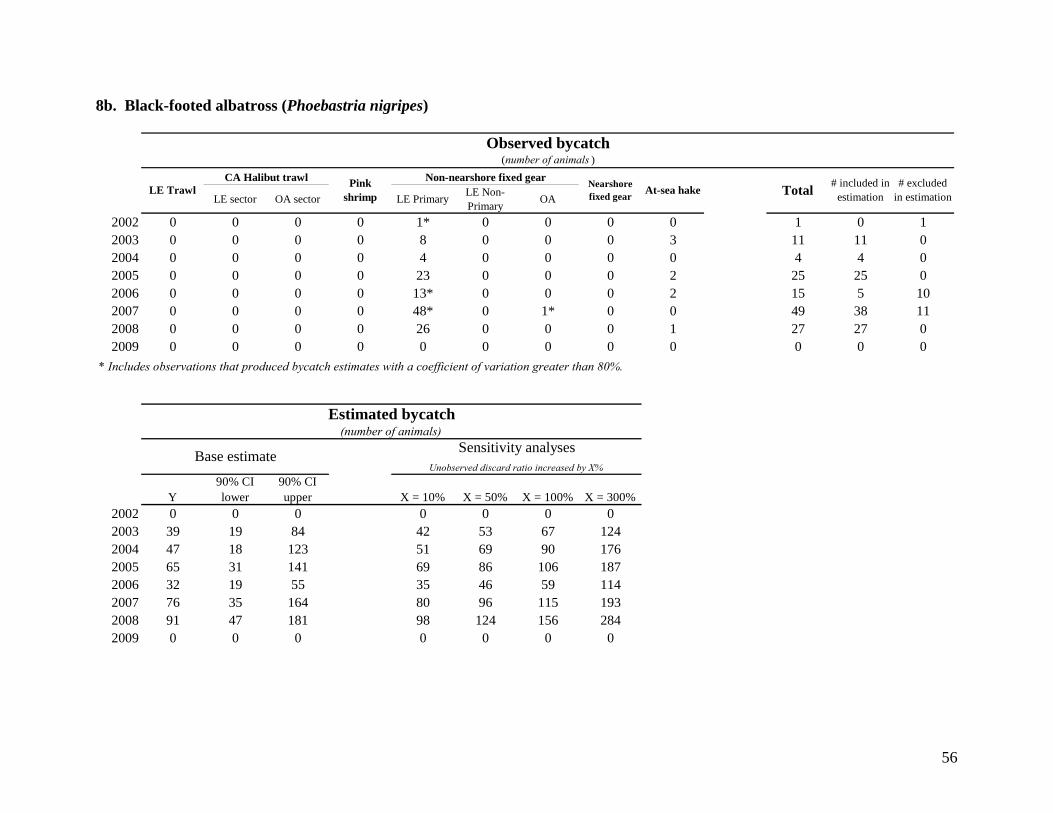
56
8b. Black-footed albatross (Phoebastria nigripes)
LE sector OA sector LE PrimaryLE Non-Primary
OA
2002 0 0 0 0 1* 0 0 0 0 1 0 12003 0 0 0 0 8 0 0 0 3 11 11 02004 0 0 0 0 4 0 0 0 0 4 4 02005 0 0 0 0 23 0 0 0 2 25 25 02006 0 0 0 0 13* 0 0 0 2 15 5 102007 0 0 0 0 48* 0 1* 0 0 49 38 112008 0 0 0 0 26 0 0 0 1 27 27 02009 0 0 0 0 0 0 0 0 0 0 0 0
Y90% CI lower
90% CI upper X = 10% X = 50% X = 100% X = 300%
2002 0 0 0 0 0 0 02003 39 19 84 42 53 67 1242004 47 18 123 51 69 90 1762005 65 31 141 69 86 106 1872006 32 19 55 35 46 59 1142007 76 35 164 80 96 115 1932008 91 47 181 98 124 156 2842009 0 0 0 0 0 0 0
Base estimateSensitivity analyses
Unobserved discard ratio increased by X%
# excluded in estimation
* Includes observations that produced bycatch estimates with a coefficient of variation greater than 80%.
Estimated bycatch(number of animals)
Total# included in
estimation
Observed bycatch(number of animals )
LE TrawlCA Halibut trawl Pink
shrimp
Non-nearshore fixed gearNearshore fixed gear
At-sea hake

57
8c. Brandt's cormorant (Phalacrocorax penicillatus) and unspecified cormorant species
LE sector OA sector LE PrimaryLE Non-Primary
OA
2002 0 0 0 0 1 0 0 0 0 1 1 02003 0 3* 0 0 0 1* 0 0 0 4 2 22004 0 2 0 0 0 0 0 0 0 2 2 02005 0 0 1* 0 0 0 0 0 0 1 0 12006 0 0 0 0 0 0 0 0 0 0 0 02007 0 0 1* 0 0 0 0 1* 0 2 0 22008 0 0 0 0 0 0 0 0 0 0 0 02009 0 0 0 0 0 0 0 1* 0 1 0 1
Y90% CI lower
90% CI upper X = 10% X = 50% X = 100% X = 300%
2002 6 2 18 6 9 11 222003 9 3 25 10 13 17 322004 5 2 11 5 6 8 142005 -- -- -- -- -- -- --2006 0 0 0 0 0 0 02007 -- -- -- -- -- -- --2008 0 0 0 0 0 0 02009 -- -- -- -- -- -- --
(number of animals)
Base estimateSensitivity analyses
Unobserved discard ratio increased by X%
# included in estimation
# excluded in estimation
* Includes observations that produced bycatch estimates with a coefficient of variation greater than 80%.
Estimated bycatch
Observed bycatch(number of animals )
LE TrawlCA Halibut trawl Pink
shrimp
Non-nearshore fixed gearNearshore fixed gear
At-sea hake Total

58
8d. Common murre (Uria aalge)
LE sector OA sector LE PrimaryLE Non-Primary
OA
2002 0 0 0 0 0 0 0 0 0 0 0 02003 0 36* 1* 0 0 0 0 0 0 37 0 372004 1* 5 0 0 0 0 0 1* 3 10 8 22005 0 0 0 0 0 0 0 0 2 2 2 02006 0 0 0 0 0 0 0 1* 0 1 0 12007 0 0 0 0 0 0 0 0 0 0 0 02008 0 0 0 0 0 0 0 0 0 0 0 02009 0 0 0 0 0 0 0 1* 0 1 0 1
Y90% CI lower
90% CI upper X = 10% X = 50% X = 100% X = 300%
2002 0 0 0 0 0 0 02003 -- -- -- -- -- -- --2004 15 10 26 16 19 23 392005 2 2 2 2 2 2 22006 -- -- -- -- -- -- --2007 0 0 0 0 0 0 02008 0 0 0 0 0 0 02009 -- -- -- -- -- -- --
Estimated bycatch(number of animals)
Base estimateSensitivity analyses
Unobserved discard ratio increased by X%
* Includes observations that produced bycatch estimates with a coefficient of variation greater than 80%.
LE TrawlCA Halibut trawl Pink
shrimp
Non-nearshore fixed gearNearshore fixed gear
At-sea hake
Observed bycatch(number of animals )
Total# included in
estimation# excluded
in estimation

59
8e. Leach's storm petrel (Oceanodroma leucorhoa) and unspecified storm petrel species
LE sector OA sector LE PrimaryLE Non-Primary
OA
2002 6* 0 0 0 0 0 0 0 0 6 0 62003 1* 0 0 0 0 0 0 0 0 1 0 12004 1 0 0 0 0 0 0 0 0 1 1 02005 0 0 0 0 0 0 0 0 0 0 0 02006 0 0 0 0 0 0 0 0 0 0 0 02007 0 0 0 0 0 0 0 0 0 0 0 02008 0 0 0 0 0 0 0 0 0 0 0 02009 0 0 0 0 0 0 0 0 0 0 0 0
Y90% CI lower
90% CI upper X = 10% X = 50% X = 100% X = 300%
2002 -- -- -- -- -- -- --2003 -- -- -- -- -- -- --2004 2 0 7 2 3 3 62005 0 0 0 0 0 0 02006 0 0 0 0 0 0 02007 0 0 0 0 0 0 02008 0 0 0 0 0 0 02009 0 0 0 0 0 0 0
* Includes observations that produced bycatch estimates with a coefficient of variation greater than 80%.
Estimated bycatch(number of animals)
Base estimateSensitivity analyses
Unobserved discard ratio increased by X%
At-sea hake Total# included in
estimation# excluded
in estimation
Observed bycatch(number of animals )
LE TrawlCA Halibut trawl Pink
shrimp
Non-nearshore fixed gearNearshore fixed gear
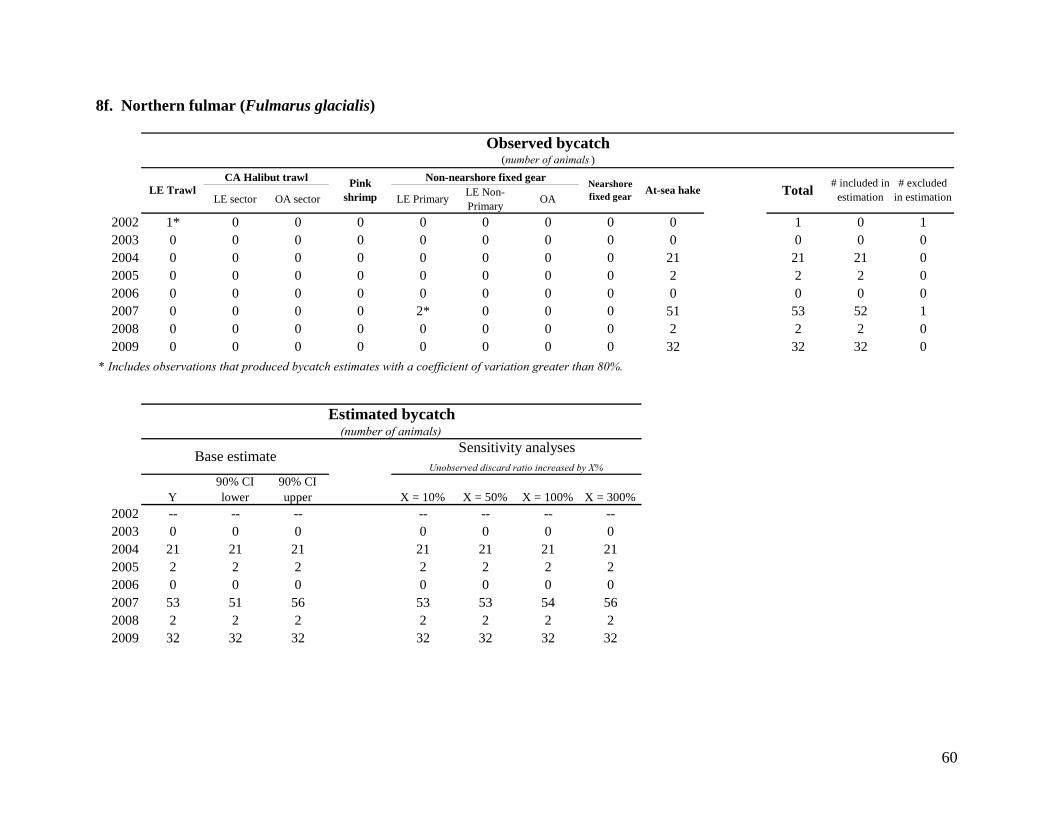
60
8f. Northern fulmar (Fulmarus glacialis)
LE sector OA sector LE PrimaryLE Non-Primary
OA
2002 1* 0 0 0 0 0 0 0 0 1 0 12003 0 0 0 0 0 0 0 0 0 0 0 02004 0 0 0 0 0 0 0 0 21 21 21 02005 0 0 0 0 0 0 0 0 2 2 2 02006 0 0 0 0 0 0 0 0 0 0 0 02007 0 0 0 0 2* 0 0 0 51 53 52 12008 0 0 0 0 0 0 0 0 2 2 2 02009 0 0 0 0 0 0 0 0 32 32 32 0
Y90% CI lower
90% CI upper X = 10% X = 50% X = 100% X = 300%
2002 -- -- -- -- -- -- --2003 0 0 0 0 0 0 02004 21 21 21 21 21 21 212005 2 2 2 2 2 2 22006 0 0 0 0 0 0 02007 53 51 56 53 53 54 562008 2 2 2 2 2 2 22009 32 32 32 32 32 32 32
Base estimateSensitivity analyses
Unobserved discard ratio increased by X%
# excluded in estimation
* Includes observations that produced bycatch estimates with a coefficient of variation greater than 80%.
Estimated bycatch(number of animals)
Observed bycatch(number of animals )
LE TrawlCA Halibut trawl Pink
shrimp
Non-nearshore fixed gearNearshore fixed gear
At-sea hake Total# included in
estimation
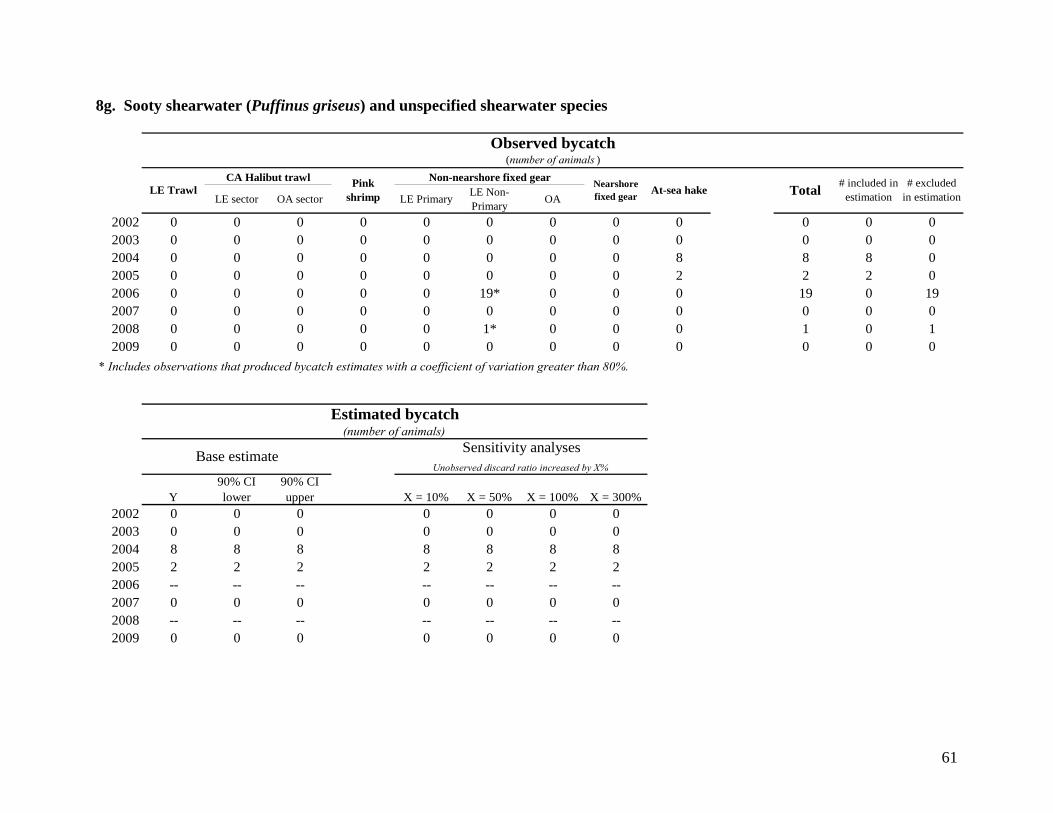
61
8g. Sooty shearwater (Puffinus griseus) and unspecified shearwater species
LE sector OA sector LE PrimaryLE Non-Primary
OA
2002 0 0 0 0 0 0 0 0 0 0 0 02003 0 0 0 0 0 0 0 0 0 0 0 02004 0 0 0 0 0 0 0 0 8 8 8 02005 0 0 0 0 0 0 0 0 2 2 2 02006 0 0 0 0 0 19* 0 0 0 19 0 192007 0 0 0 0 0 0 0 0 0 0 0 02008 0 0 0 0 0 1* 0 0 0 1 0 12009 0 0 0 0 0 0 0 0 0 0 0 0
Y90% CI lower
90% CI upper X = 10% X = 50% X = 100% X = 300%
2002 0 0 0 0 0 0 02003 0 0 0 0 0 0 02004 8 8 8 8 8 8 82005 2 2 2 2 2 2 22006 -- -- -- -- -- -- --2007 0 0 0 0 0 0 02008 -- -- -- -- -- -- --2009 0 0 0 0 0 0 0
Base estimateSensitivity analyses
Unobserved discard ratio increased by X%
# excluded in estimation
* Includes observations that produced bycatch estimates with a coefficient of variation greater than 80%.
Estimated bycatch(number of animals)
Observed bycatch(number of animals )
LE TrawlCA Halibut trawl Pink
shrimp
Non-nearshore fixed gearNearshore fixed gear
At-sea hake Total# included in
estimation
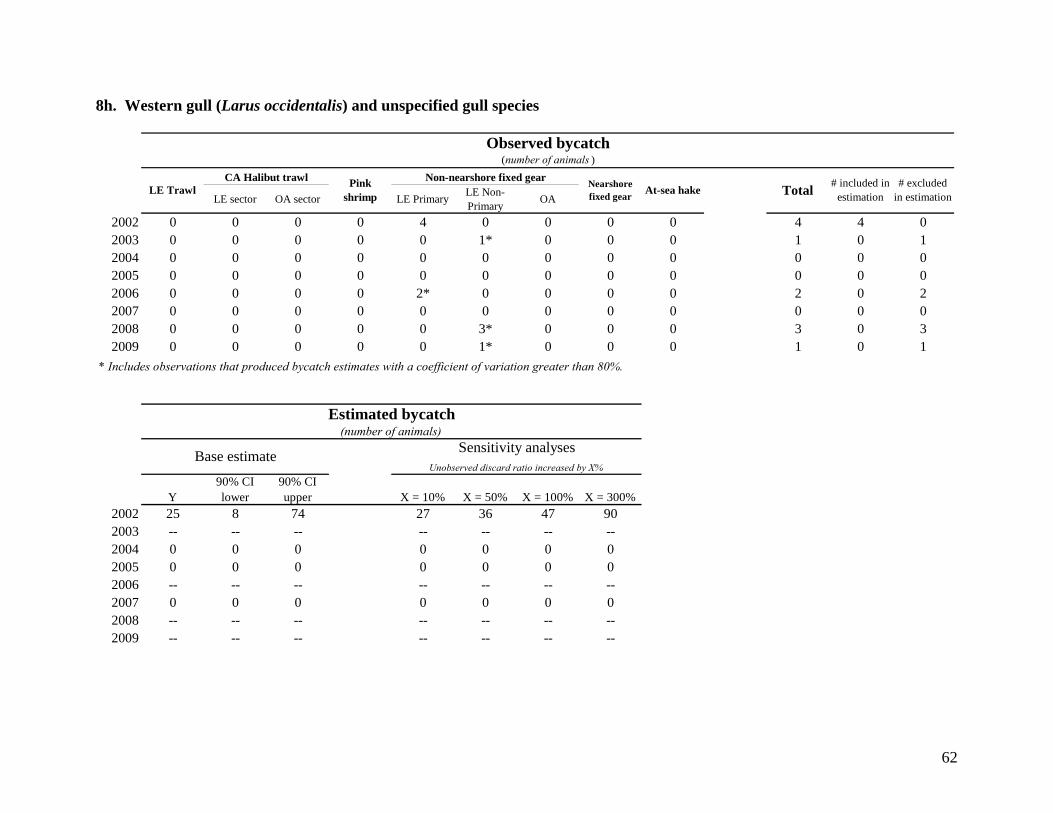
62
8h. Western gull (Larus occidentalis) and unspecified gull species
LE sector OA sector LE PrimaryLE Non-Primary
OA
2002 0 0 0 0 4 0 0 0 0 4 4 02003 0 0 0 0 0 1* 0 0 0 1 0 12004 0 0 0 0 0 0 0 0 0 0 0 02005 0 0 0 0 0 0 0 0 0 0 0 02006 0 0 0 0 2* 0 0 0 0 2 0 22007 0 0 0 0 0 0 0 0 0 0 0 02008 0 0 0 0 0 3* 0 0 0 3 0 32009 0 0 0 0 0 1* 0 0 0 1 0 1
Y90% CI lower
90% CI upper X = 10% X = 50% X = 100% X = 300%
2002 25 8 74 27 36 47 902003 -- -- -- -- -- -- --2004 0 0 0 0 0 0 02005 0 0 0 0 0 0 02006 -- -- -- -- -- -- --2007 0 0 0 0 0 0 02008 -- -- -- -- -- -- --2009 -- -- -- -- -- -- --
* Includes observations that produced bycatch estimates with a coefficient of variation greater than 80%.
Estimated bycatch(number of animals)
Base estimateSensitivity analyses
Unobserved discard ratio increased by X%
(number of animals )
LE TrawlCA Halibut trawl Pink
shrimp
Non-nearshore fixed gearNearshore fixed gear
At-sea hake Total# included in
estimation# excluded
in estimation
Observed bycatch
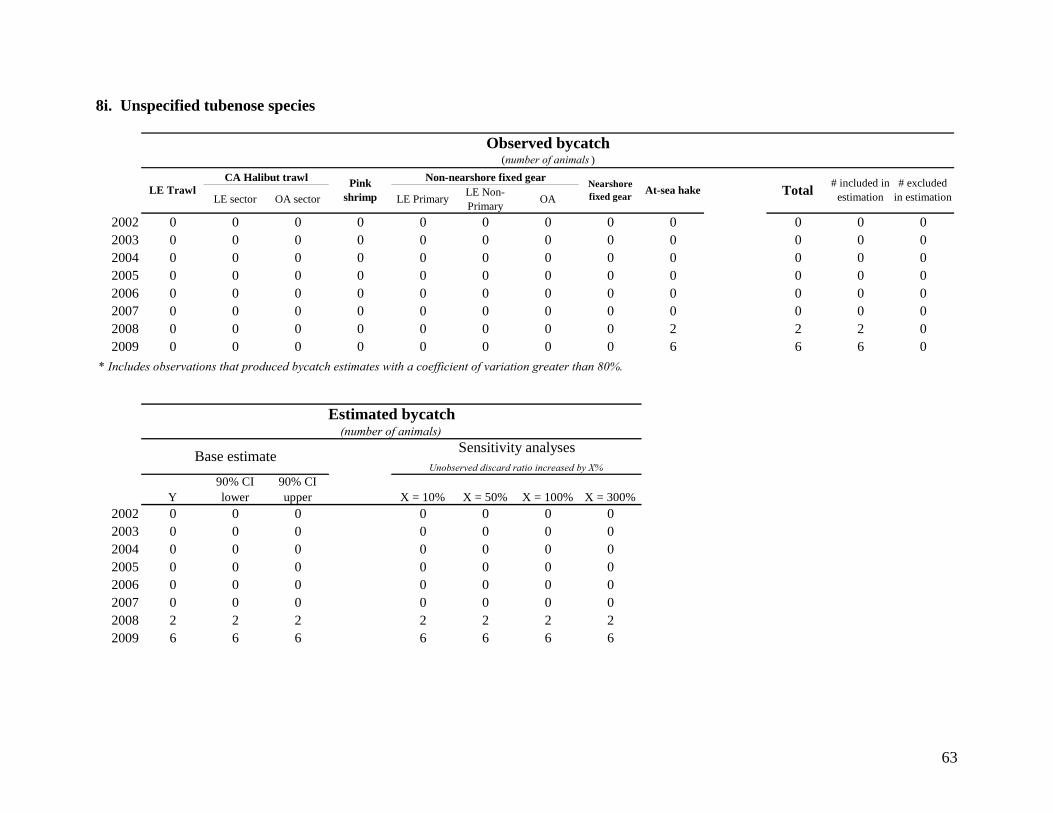
63
8i. Unspecified tubenose species
LE sector OA sector LE PrimaryLE Non-Primary
OA
2002 0 0 0 0 0 0 0 0 0 0 0 02003 0 0 0 0 0 0 0 0 0 0 0 02004 0 0 0 0 0 0 0 0 0 0 0 02005 0 0 0 0 0 0 0 0 0 0 0 02006 0 0 0 0 0 0 0 0 0 0 0 02007 0 0 0 0 0 0 0 0 0 0 0 02008 0 0 0 0 0 0 0 0 2 2 2 02009 0 0 0 0 0 0 0 0 6 6 6 0
Y90% CI lower
90% CI upper X = 10% X = 50% X = 100% X = 300%
2002 0 0 0 0 0 0 02003 0 0 0 0 0 0 02004 0 0 0 0 0 0 02005 0 0 0 0 0 0 02006 0 0 0 0 0 0 02007 0 0 0 0 0 0 02008 2 2 2 2 2 2 22009 6 6 6 6 6 6 6
* Includes observations that produced bycatch estimates with a coefficient of variation greater than 80%.
Estimated bycatch(number of animals)
Base estimateSensitivity analyses
Unobserved discard ratio increased by X%
At-sea hake Total# included in
estimation# excluded
in estimation
Observed bycatch(number of animals )
LE TrawlCA Halibut trawl Pink
shrimp
Non-nearshore fixed gearNearshore fixed gear

64
8j. Unspecified alcid species
LE sector OA sector LE PrimaryLE Non-Primary
OA
2002 0 0 0 0 0 0 0 0 0 0 0 02003 0 0 0 0 0 0 0 0 0 0 0 02004 0 0 0 0 0 0 0 0 3 3 3 02005 0 0 0 0 0 0 0 0 0 0 0 02006 0 0 0 0 0 0 0 0 0 0 0 02007 0 0 0 0 0 0 0 0 0 0 0 02008 0 0 0 0 0 0 0 0 2 2 2 0
Y90% CI lower
90% CI upper X = 10% X = 50% X = 100% X = 300%
2002 0 0 0 0 0 0 02003 0 0 0 0 0 0 02004 3 3 3 3 3 3 32005 0 0 0 0 0 0 02006 0 0 0 0 0 0 02007 0 0 0 0 0 0 02008 2 2 2 2 2 2 2
Base estimateSensitivity analyses
Unobserved discard ratio increased by X%
# excluded in estimation
* Includes observations that produced bycatch estimates with a coefficient of variation greater than 80%.
Estimated bycatch(number of animals)
Observed bycatch(number of animals )
LE TrawlCA Halibut trawl Pink
shrimp
Non-nearshore fixed gearNearshore fixed gear
At-sea hake Total# included in
estimation

65
8k. Unidentified seabird
LE sector OA sector LE PrimaryLE Non-Primary
OA
2002 0 0 0 0 0 0 0 0 0 0 0 02003 0 0 0 0 1* 0 0 0 0 1 0 12004 0 0 0 0 0 0 0 0 0 0 0 02005 0 0 0 0 0 0 0 0 2 2 2 02006 0 0 0 0 0 0 0 0 0 0 0 02007 0 0 0 0 0 0 0 0 0 0 0 02008 0 0 0 0 0 0 0 0 4 4 4 02009 0 0 0 0 0 0 0 2 0 2 0 2
Y90% CI lower
90% CI upper X = 10% X = 50% X = 100% X = 300%
2002 0 0 0 0 0 0 02003 -- -- -- -- -- -- --2004 0 0 0 0 0 0 02005 2 2 2 2 2 2 22006 0 0 0 0 0 0 02007 0 0 0 0 0 0 02008 4 4 4 4 4 4 42009 -- -- -- -- -- -- --
* Includes observations that produced bycatch estimates with a coefficient of variation greater than 80%.
Estimated bycatch(number of animals)
Base estimateSensitivity analyses
Unobserved discard ratio increased by X%
At-sea hake Total# included in
estimation# excluded
in estimation
Observed bycatch(number of animals )
LE TrawlCA Halibut trawl Pink
shrimp
Non-nearshore fixed gearNearshore fixed gear

66
Table 9. Summary of observed bycatch for the leatherback turtle (Dermochelys coriacea). The ‘Observed bycatch’ table presents the number of takes observed in each fishery sector and the total number of observed takes by year, followed by the number of takes that contributed to final bycatch estimates (produced a strata-specific CV of 80% or less) and the number that did not contribute to final bycatch estimates (produced a strata-specific CV greater than 80%).
LE sector OA sector LE PrimaryLE Non-Primary
OA
2002 0 0 0 0 0 0 0 0 0 0 0 02003 0 0 0 0 0 0 0 0 0 0 0 02004 0 0 0 0 0 0 0 0 0 0 0 02005 0 0 0 0 0 0 0 0 0 0 0 02006 0 0 0 0 0 0 0 0 0 0 0 02007 0 0 0 0 0 0 0 0 0 0 0 02008 0 0 0 0 0 0 1* 0 0 1 0 12009 0 0 0 0 0 0 0 0 0 0 0 0
# excluded in estimation
* Includes observations that produced bycatch estimates with a coefficient of variation greater than 80%.
Observed bycatch(number of animals )
LE TrawlCA Halibut trawl Pink
shrimp
Non-nearshore fixed gearNearshore fixed gear
At-sea hake Total# included in
estimation

67
APPENDIX A
Common and scientific names of species included in the Pacific Coast Groundfish Fishery Man-agement Plan, as amended through Amendment 19 (PFMC 2008).
SHARKS Big skate, Raja binoculata California skate, R. inornata Leopard shark, Triakis semifasciata Longnose skate, R. rhina Soupfin shark, Galeorhinus zyopterus Spiny dogfish, Squalus acanthias RATFISH Ratfish, Hydrolagus colliei MORIDS Finescale codling, Antimora microlepis GRENADIERS Pacific rattail, Coryphaenoides acrolepis ROUNDFISH Cabezon, Scorpaenichthys marmoratus Kelp greenling, Hexagrammos decagrammus Lingcod, Ophiodon elongatus Pacific cod, Gadus macrocephalus Pacific whiting, (hake) Merluccius productus Sablefish, Anoplopoma fimbria FLATFISH Arrowtooth flounder, (turbot) Atheresthes stomias Butter sole, Isopsetta isolepis Curlfin sole, Pleuronichthys decurrens Dover sole, Microstomus pacificus English sole, Parophrys vetulus Flathead sole, Hippoglossoides elassodon Pacific sanddab, Citharichthys sordidus Petrale sole, Eopsetta jordani Rex sole, Glyptocephalus zachirus Rock sole, Lepidopsetta bilineata Sand sole, Psettichthys melanostictus Starry flounder, Platichthys stellatus
68
Appendix A (continued) ROCKFISH Includes all genera and species of the family Scopaenidae, even if not listed, that occur in the Washington, Oregon, and California area. The Scopaenidae genera are Sebastes, Scorpaena, Sebastolobus, and Scorpaenodes. Aurora, Sebastes. aurora Bank, S. rufus Black, S. melanops Black-and-yellow, S. chrysolmelas. Blackgill, S. melanostomus Blue, S. mystinus Bocaccio, S. paucispinis Bronzespotted, S. gilli Brown, S. auriculatus Calico, S. dalli California scorpionfish, Scorpaena guttata Canary, Sebastes pinniger Chameleon, S. phillipsi Chilipepper, S. goodei China, S. nebulosus Copper, S. caurinus Cowcod, S. levis Darkblotched, S. crameri Dusky, S. ciliatus Dwarf-red, S. rufianus Flag, S. rubrivinctus Freckled, S. lentiginosus Gopher, S. carnatus Grass, S. rastrelliger Greenblotched, S. rosenblatti Greenspotted, S. chlorostictus Greenstriped, S. elongatus Halfbanded, S. semicinctus Harlequin, S. variegatus Honeycomb, S. umbrosus Kelp, S. atrovirens Longspine thornyhead, Sebastolobus altivelis Mexican, Sebastes. macdonaldi Olive, S. serranoides Pink, S. eos Pinkrose, S. simulator Pygmy, S. wilsoni Pacific ocean perch, S. alutus Quillback, S. maliger Redbanded, S. babcocki Redstripe, S. proriger Rosethorn, S. helvomaculatus Rosy, S. rosaceus
69
Appendix A (continued) Rougheye, S. aleutianus Sharpchin, S. zacentrus Shortbelly, S. jordani Shortraker, S. borealis Shortspine thornyhead, Sebastolobus alascanus Silvergray, Sebastes. brevispinus Speckled, S. ovalis Splitnose rockfish, S. diploproa Squarespot, S. hopkinsi Starry, S. constellatus Stripetail, S. saxicola Swordspine, S. ensifer Tiger, S. nigorcinctus Treefish, S. serriceps Vermilion, S. miniatus Widow, S. entomelas Yelloweye, S. ruberrimus Yellowmouth, S. reedi Yellowtail, S. flavidus

70
APPENDIX B
Species indentification codes used in the Pacific Coast Fisheries Information Network (PacFIN) database and
assigned to WCGOP observer data, with aggregated species groups used in this report for the non-nearshore sectors
of the groundfish fishery.
PacFIN Species
ID PacFIN Common Name Species Group - North of 40˚ 10' N latitude
Species Group - South of 40˚ 10' N latitude FMP
ALBC ALBACORE Other nongroundfish Other nongroundfish AKSK ALASKA SKATE Other non-FMP skate Other non-FMP skate AMCK ATKA MACKEREL Other nongroundfish Other nongroundfish APLC ALASKA PLAICE Other non-FMP flatfish Other non-FMP flatfish ARR1 NOM. AURORA ROCKFISH Other slope rockfish Other slope rockfish yes ARRA AURORA ROCKFISH Other slope rockfish Other slope rockfish yes ART1 NOM. ARROWTOOTH FLOUNDER Arrowtooth flounder Arrowtooth flounder yes ARTH ARROWTOOTH FLOUNDER Arrowtooth flounder Arrowtooth flounder yes ASKT ALEUTIAN SKATE Other non-FMP skate Other non-FMP skate ASRK PACIFIC ANGEL SHARK Other nongroundfish Other nongroundfish BABL BLACK ABALONE Other nongroundfish Other nongroundfish
BANK BANK ROCKFISH Other slope rockfish Bank rockfish (Remaining rockfish) yes
BCAC BOCACCIO Bocaccio (Remaining rockfish) Bocaccio yes BCC1 NOM. BOCACCIO Bocaccio (Remaining rockfish) Bocaccio yes BCLM BUTTER CLAM Other nongroundfish Other nongroundfish BGL1 NOM. BLACKGILL ROCKFISH Other slope rockfish Blackgill (Remaining rockfish) yes BHAG BLACK HAGFISH Other nongroundfish Other nongroundfish BISC BROWN IRISH LORD Other nongroundfish Other nongroundfish BKCR BLUE KING CRAB Other nongroundfish Other nongroundfish BLCK BLACK ROCKFISH Black rockfish Black rockfish yes BLGL BLACKGILL ROCKFISH Other slope rockfish Blackgill (Remaining rockfish) yes BLK1 NOM. BLACK ROCKFISH Black rockfish Black rockfish yes BLPT BLACK EELPOUT Other nongroundfish Other nongroundfish BLSK BLACK SKATE Other non-FMP skate Other non-FMP skate BLU1 NOM. BLUE ROCKFISH Blue rockfish Blue rockfish yes BLUR BLUE ROCKFISH Blue rockfish Blue rockfish yes BMCK BULLET MACKEREL Other nongroundfish Other nongroundfish BMRL BLUE MARLIN Other nongroundfish Other nongroundfish BMSL BLUE OR BAY MUSSEL Other nongroundfish Other nongroundfish
BNK1 NOM. BANK ROCKFISH Other slope rockfish Bank rockfish (Remaining rockfish) yes
BRNZ BRONZESPOTTED ROCKFISH Other shelf rockfish Other shelf rockfish yes BRW1 NOM. BROWN ROCKFISH Other nearshore rockfish Other nearshore rockfish yes BRWN BROWN ROCKFISH Other nearshore rockfish Other nearshore rockfish yes
BRZ1 NOM. BRONZESPOTTED ROCKFISH Other shelf rockfish Other shelf rockfish yes
BSCL BUFFALO SCULPIN Other nongroundfish Other nongroundfish BSJK BLACK SKIPJACK Other nongroundfish Other nongroundfish BSKT BIG SKATE Big skate Big skate yes BSOL BUTTER SOLE Other flatfish Other flatfish yes BSRK BLUE SHARK Other nongroundfish Other nongroundfish BSRM UNSP. BAIT SHRIMP Other nongroundfish Other nongroundfish BTCR BAIRDI TANNER CRAB Tanner crab Tanner crab BTNA BLUEFIN TUNA Other nongroundfish Other nongroundfish BTRY BAT RAY Other nongroundfish Other nongroundfish BYEL BLACK-AND-YELLOW ROCKFISH Other nearshore rockfish Other nearshore rockfish yes
BYL1 NOM. BLACK-AND-YELLOW ROCKFISH Other nearshore rockfish Other nearshore rockfish yes
CBZ1 NOM. CABEZON Other groundfish Cabezon yes CBZN CABEZON Other groundfish Cabezon yes CEEL SPOTTED CUSK-EEL Other nongroundfish Other nongroundfish CHL1 NOM. CALIFORNIA HALIBUT California halibut California halibut CHLB CALIFORNIA HALIBUT California halibut California halibut
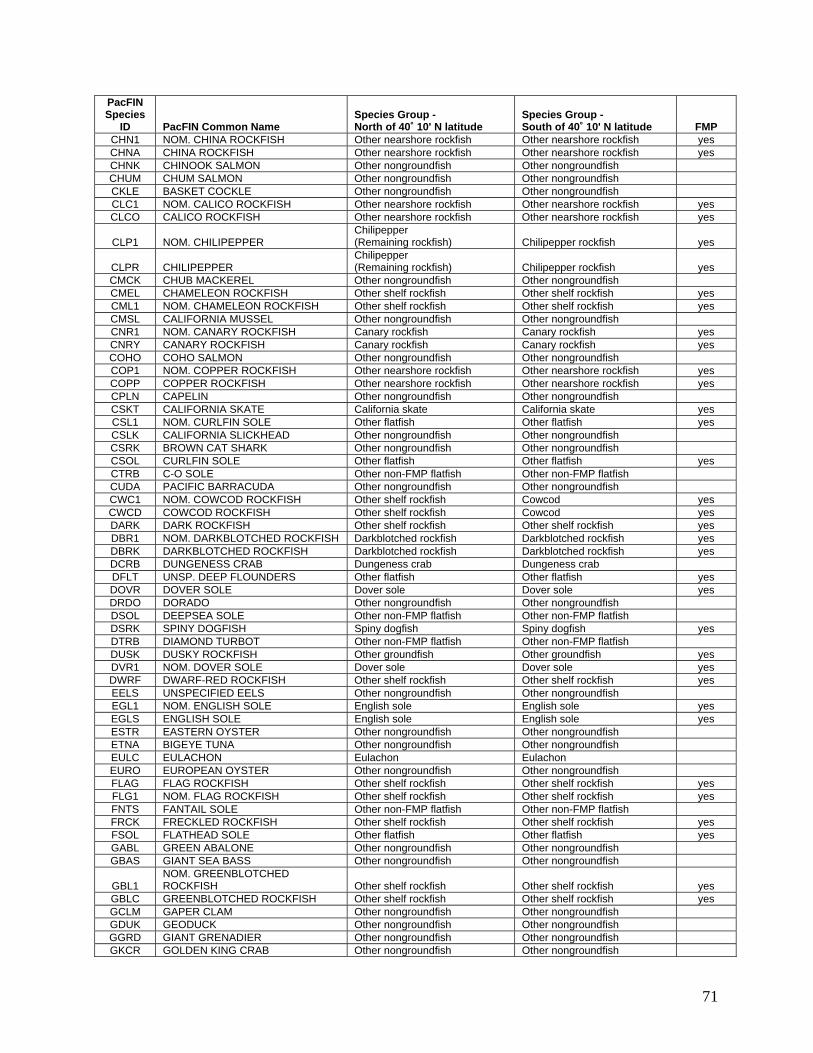
71
PacFIN Species
ID PacFIN Common Name Species Group - North of 40˚ 10' N latitude
Species Group - South of 40˚ 10' N latitude FMP
CHN1 NOM. CHINA ROCKFISH Other nearshore rockfish Other nearshore rockfish yes CHNA CHINA ROCKFISH Other nearshore rockfish Other nearshore rockfish yes CHNK CHINOOK SALMON Other nongroundfish Other nongroundfish CHUM CHUM SALMON Other nongroundfish Other nongroundfish CKLE BASKET COCKLE Other nongroundfish Other nongroundfish CLC1 NOM. CALICO ROCKFISH Other nearshore rockfish Other nearshore rockfish yes CLCO CALICO ROCKFISH Other nearshore rockfish Other nearshore rockfish yes
CLP1 NOM. CHILIPEPPER Chilipepper (Remaining rockfish) Chilipepper rockfish yes
CLPR CHILIPEPPER Chilipepper (Remaining rockfish) Chilipepper rockfish yes
CMCK CHUB MACKEREL Other nongroundfish Other nongroundfish CMEL CHAMELEON ROCKFISH Other shelf rockfish Other shelf rockfish yes CML1 NOM. CHAMELEON ROCKFISH Other shelf rockfish Other shelf rockfish yes CMSL CALIFORNIA MUSSEL Other nongroundfish Other nongroundfish CNR1 NOM. CANARY ROCKFISH Canary rockfish Canary rockfish yes CNRY CANARY ROCKFISH Canary rockfish Canary rockfish yes COHO COHO SALMON Other nongroundfish Other nongroundfish COP1 NOM. COPPER ROCKFISH Other nearshore rockfish Other nearshore rockfish yes COPP COPPER ROCKFISH Other nearshore rockfish Other nearshore rockfish yes CPLN CAPELIN Other nongroundfish Other nongroundfish CSKT CALIFORNIA SKATE California skate California skate yes CSL1 NOM. CURLFIN SOLE Other flatfish Other flatfish yes CSLK CALIFORNIA SLICKHEAD Other nongroundfish Other nongroundfish CSRK BROWN CAT SHARK Other nongroundfish Other nongroundfish CSOL CURLFIN SOLE Other flatfish Other flatfish yes CTRB C-O SOLE Other non-FMP flatfish Other non-FMP flatfish CUDA PACIFIC BARRACUDA Other nongroundfish Other nongroundfish CWC1 NOM. COWCOD ROCKFISH Other shelf rockfish Cowcod yes CWCD COWCOD ROCKFISH Other shelf rockfish Cowcod yes DARK DARK ROCKFISH Other shelf rockfish Other shelf rockfish yes DBR1 NOM. DARKBLOTCHED ROCKFISH Darkblotched rockfish Darkblotched rockfish yes DBRK DARKBLOTCHED ROCKFISH Darkblotched rockfish Darkblotched rockfish yes DCRB DUNGENESS CRAB Dungeness crab Dungeness crab DFLT UNSP. DEEP FLOUNDERS Other flatfish Other flatfish yes DOVR DOVER SOLE Dover sole Dover sole yes DRDO DORADO Other nongroundfish Other nongroundfish DSOL DEEPSEA SOLE Other non-FMP flatfish Other non-FMP flatfish DSRK SPINY DOGFISH Spiny dogfish Spiny dogfish yes DTRB DIAMOND TURBOT Other non-FMP flatfish Other non-FMP flatfish DUSK DUSKY ROCKFISH Other groundfish Other groundfish yes DVR1 NOM. DOVER SOLE Dover sole Dover sole yes DWRF DWARF-RED ROCKFISH Other shelf rockfish Other shelf rockfish yes EELS UNSPECIFIED EELS Other nongroundfish Other nongroundfish EGL1 NOM. ENGLISH SOLE English sole English sole yes EGLS ENGLISH SOLE English sole English sole yes ESTR EASTERN OYSTER Other nongroundfish Other nongroundfish ETNA BIGEYE TUNA Other nongroundfish Other nongroundfish EULC EULACHON Eulachon Eulachon EURO EUROPEAN OYSTER Other nongroundfish Other nongroundfish FLAG FLAG ROCKFISH Other shelf rockfish Other shelf rockfish yes FLG1 NOM. FLAG ROCKFISH Other shelf rockfish Other shelf rockfish yes FNTS FANTAIL SOLE Other non-FMP flatfish Other non-FMP flatfish FRCK FRECKLED ROCKFISH Other shelf rockfish Other shelf rockfish yes FSOL FLATHEAD SOLE Other flatfish Other flatfish yes GABL GREEN ABALONE Other nongroundfish Other nongroundfish GBAS GIANT SEA BASS Other nongroundfish Other nongroundfish
GBL1 NOM. GREENBLOTCHED ROCKFISH Other shelf rockfish Other shelf rockfish yes
GBLC GREENBLOTCHED ROCKFISH Other shelf rockfish Other shelf rockfish yes GCLM GAPER CLAM Other nongroundfish Other nongroundfish GDUK GEODUCK Other nongroundfish Other nongroundfish GGRD GIANT GRENADIER Other nongroundfish Other nongroundfish GKCR GOLDEN KING CRAB Other nongroundfish Other nongroundfish
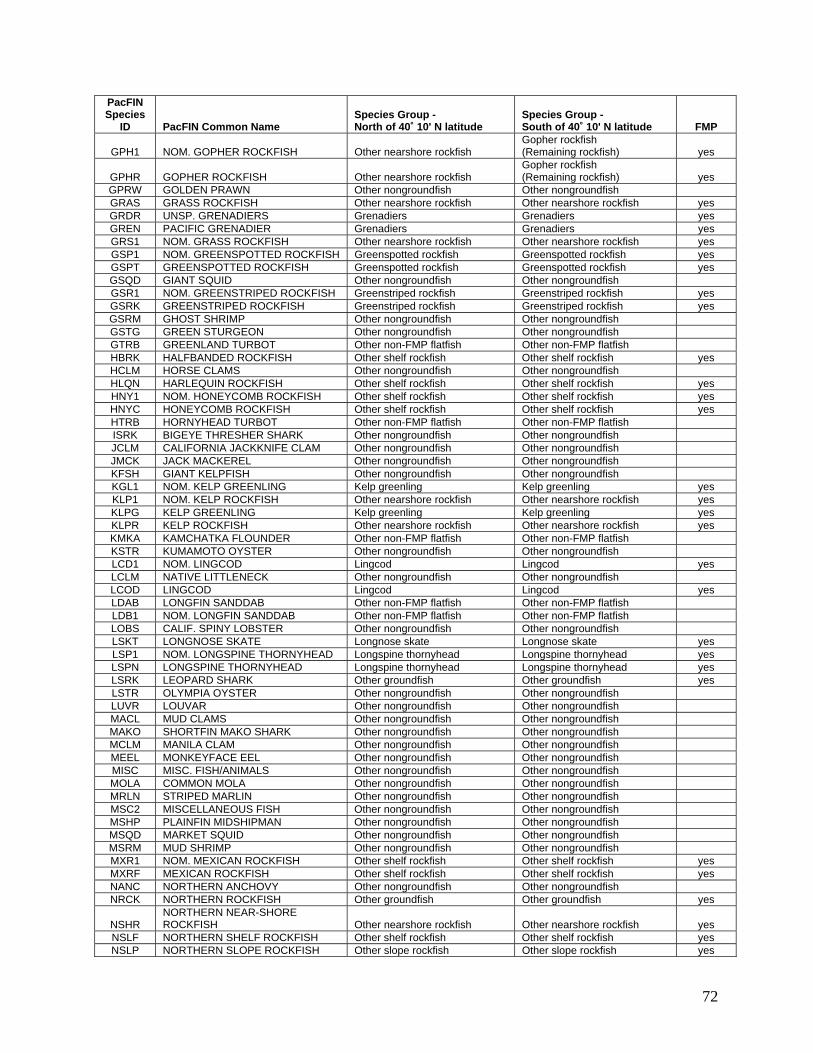
72
PacFIN Species
ID PacFIN Common Name Species Group - North of 40˚ 10' N latitude
Species Group - South of 40˚ 10' N latitude FMP
GPH1 NOM. GOPHER ROCKFISH Other nearshore rockfish Gopher rockfish (Remaining rockfish) yes
GPHR GOPHER ROCKFISH Other nearshore rockfish Gopher rockfish (Remaining rockfish) yes
GPRW GOLDEN PRAWN Other nongroundfish Other nongroundfish GRAS GRASS ROCKFISH Other nearshore rockfish Other nearshore rockfish yes GRDR UNSP. GRENADIERS Grenadiers Grenadiers yes GREN PACIFIC GRENADIER Grenadiers Grenadiers yes GRS1 NOM. GRASS ROCKFISH Other nearshore rockfish Other nearshore rockfish yes GSP1 NOM. GREENSPOTTED ROCKFISH Greenspotted rockfish Greenspotted rockfish yes GSPT GREENSPOTTED ROCKFISH Greenspotted rockfish Greenspotted rockfish yes GSQD GIANT SQUID Other nongroundfish Other nongroundfish GSR1 NOM. GREENSTRIPED ROCKFISH Greenstriped rockfish Greenstriped rockfish yes GSRK GREENSTRIPED ROCKFISH Greenstriped rockfish Greenstriped rockfish yes GSRM GHOST SHRIMP Other nongroundfish Other nongroundfish GSTG GREEN STURGEON Other nongroundfish Other nongroundfish GTRB GREENLAND TURBOT Other non-FMP flatfish Other non-FMP flatfish HBRK HALFBANDED ROCKFISH Other shelf rockfish Other shelf rockfish yes HCLM HORSE CLAMS Other nongroundfish Other nongroundfish HLQN HARLEQUIN ROCKFISH Other shelf rockfish Other shelf rockfish yes HNY1 NOM. HONEYCOMB ROCKFISH Other shelf rockfish Other shelf rockfish yes HNYC HONEYCOMB ROCKFISH Other shelf rockfish Other shelf rockfish yes HTRB HORNYHEAD TURBOT Other non-FMP flatfish Other non-FMP flatfish ISRK BIGEYE THRESHER SHARK Other nongroundfish Other nongroundfish JCLM CALIFORNIA JACKKNIFE CLAM Other nongroundfish Other nongroundfish JMCK JACK MACKEREL Other nongroundfish Other nongroundfish KFSH GIANT KELPFISH Other nongroundfish Other nongroundfish KGL1 NOM. KELP GREENLING Kelp greenling Kelp greenling yes KLP1 NOM. KELP ROCKFISH Other nearshore rockfish Other nearshore rockfish yes KLPG KELP GREENLING Kelp greenling Kelp greenling yes KLPR KELP ROCKFISH Other nearshore rockfish Other nearshore rockfish yes KMKA KAMCHATKA FLOUNDER Other non-FMP flatfish Other non-FMP flatfish KSTR KUMAMOTO OYSTER Other nongroundfish Other nongroundfish LCD1 NOM. LINGCOD Lingcod Lingcod yes LCLM NATIVE LITTLENECK Other nongroundfish Other nongroundfish LCOD LINGCOD Lingcod Lingcod yes LDAB LONGFIN SANDDAB Other non-FMP flatfish Other non-FMP flatfish LDB1 NOM. LONGFIN SANDDAB Other non-FMP flatfish Other non-FMP flatfish LOBS CALIF. SPINY LOBSTER Other nongroundfish Other nongroundfish LSKT LONGNOSE SKATE Longnose skate Longnose skate yes LSP1 NOM. LONGSPINE THORNYHEAD Longspine thornyhead Longspine thornyhead yes LSPN LONGSPINE THORNYHEAD Longspine thornyhead Longspine thornyhead yes LSRK LEOPARD SHARK Other groundfish Other groundfish yes LSTR OLYMPIA OYSTER Other nongroundfish Other nongroundfish LUVR LOUVAR Other nongroundfish Other nongroundfish MACL MUD CLAMS Other nongroundfish Other nongroundfish MAKO SHORTFIN MAKO SHARK Other nongroundfish Other nongroundfish MCLM MANILA CLAM Other nongroundfish Other nongroundfish MEEL MONKEYFACE EEL Other nongroundfish Other nongroundfish MISC MISC. FISH/ANIMALS Other nongroundfish Other nongroundfish MOLA COMMON MOLA Other nongroundfish Other nongroundfish MRLN STRIPED MARLIN Other nongroundfish Other nongroundfish MSC2 MISCELLANEOUS FISH Other nongroundfish Other nongroundfish MSHP PLAINFIN MIDSHIPMAN Other nongroundfish Other nongroundfish MSQD MARKET SQUID Other nongroundfish Other nongroundfish MSRM MUD SHRIMP Other nongroundfish Other nongroundfish MXR1 NOM. MEXICAN ROCKFISH Other shelf rockfish Other shelf rockfish yes MXRF MEXICAN ROCKFISH Other shelf rockfish Other shelf rockfish yes NANC NORTHERN ANCHOVY Other nongroundfish Other nongroundfish NRCK NORTHERN ROCKFISH Other groundfish Other groundfish yes
NSHR NORTHERN NEAR-SHORE ROCKFISH Other nearshore rockfish Other nearshore rockfish yes
NSLF NORTHERN SHELF ROCKFISH Other shelf rockfish Other shelf rockfish yes NSLP NORTHERN SLOPE ROCKFISH Other slope rockfish Other slope rockfish yes
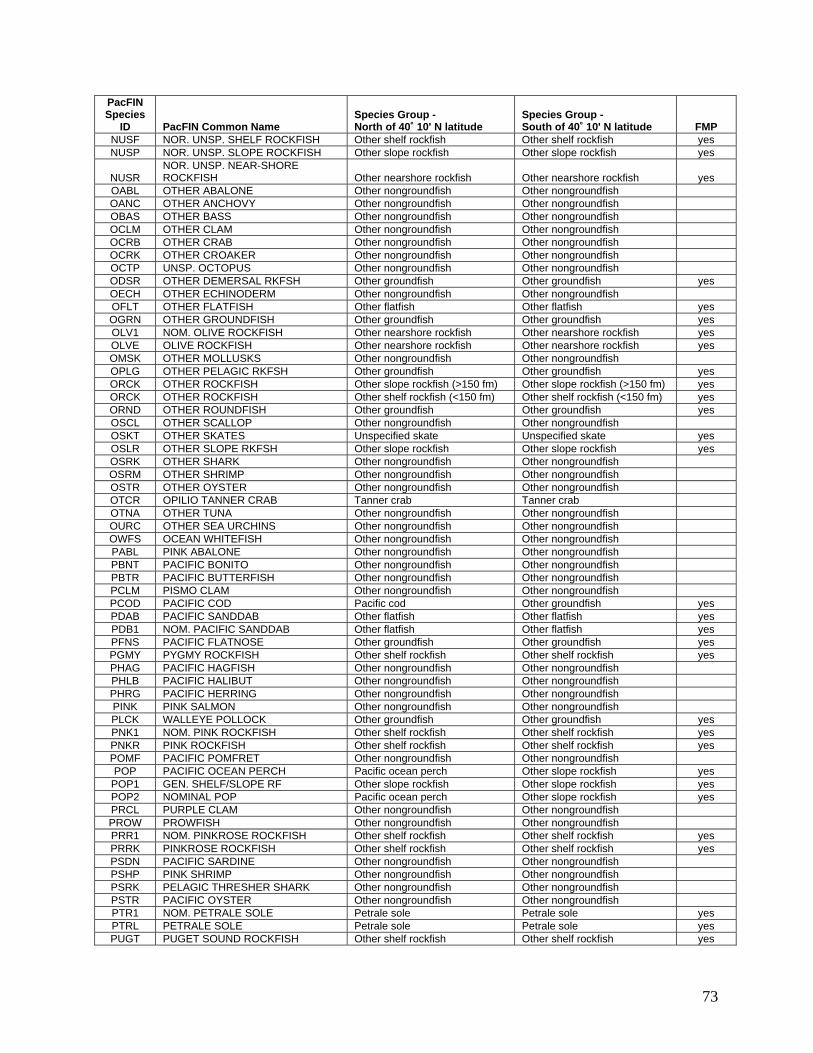
73
PacFIN Species
ID PacFIN Common Name Species Group - North of 40˚ 10' N latitude
Species Group - South of 40˚ 10' N latitude FMP
NUSF NOR. UNSP. SHELF ROCKFISH Other shelf rockfish Other shelf rockfish yes NUSP NOR. UNSP. SLOPE ROCKFISH Other slope rockfish Other slope rockfish yes
NUSR NOR. UNSP. NEAR-SHORE ROCKFISH Other nearshore rockfish Other nearshore rockfish yes
OABL OTHER ABALONE Other nongroundfish Other nongroundfish OANC OTHER ANCHOVY Other nongroundfish Other nongroundfish OBAS OTHER BASS Other nongroundfish Other nongroundfish OCLM OTHER CLAM Other nongroundfish Other nongroundfish OCRB OTHER CRAB Other nongroundfish Other nongroundfish OCRK OTHER CROAKER Other nongroundfish Other nongroundfish OCTP UNSP. OCTOPUS Other nongroundfish Other nongroundfish ODSR OTHER DEMERSAL RKFSH Other groundfish Other groundfish yes OECH OTHER ECHINODERM Other nongroundfish Other nongroundfish OFLT OTHER FLATFISH Other flatfish Other flatfish yes OGRN OTHER GROUNDFISH Other groundfish Other groundfish yes OLV1 NOM. OLIVE ROCKFISH Other nearshore rockfish Other nearshore rockfish yes OLVE OLIVE ROCKFISH Other nearshore rockfish Other nearshore rockfish yes OMSK OTHER MOLLUSKS Other nongroundfish Other nongroundfish OPLG OTHER PELAGIC RKFSH Other groundfish Other groundfish yes ORCK OTHER ROCKFISH Other slope rockfish (>150 fm) Other slope rockfish (>150 fm) yes ORCK OTHER ROCKFISH Other shelf rockfish (<150 fm) Other shelf rockfish (<150 fm) yes ORND OTHER ROUNDFISH Other groundfish Other groundfish yes OSCL OTHER SCALLOP Other nongroundfish Other nongroundfish OSKT OTHER SKATES Unspecified skate Unspecified skate yes OSLR OTHER SLOPE RKFSH Other slope rockfish Other slope rockfish yes OSRK OTHER SHARK Other nongroundfish Other nongroundfish OSRM OTHER SHRIMP Other nongroundfish Other nongroundfish OSTR OTHER OYSTER Other nongroundfish Other nongroundfish OTCR OPILIO TANNER CRAB Tanner crab Tanner crab OTNA OTHER TUNA Other nongroundfish Other nongroundfish OURC OTHER SEA URCHINS Other nongroundfish Other nongroundfish OWFS OCEAN WHITEFISH Other nongroundfish Other nongroundfish PABL PINK ABALONE Other nongroundfish Other nongroundfish PBNT PACIFIC BONITO Other nongroundfish Other nongroundfish PBTR PACIFIC BUTTERFISH Other nongroundfish Other nongroundfish PCLM PISMO CLAM Other nongroundfish Other nongroundfish PCOD PACIFIC COD Pacific cod Other groundfish yes PDAB PACIFIC SANDDAB Other flatfish Other flatfish yes PDB1 NOM. PACIFIC SANDDAB Other flatfish Other flatfish yes PFNS PACIFIC FLATNOSE Other groundfish Other groundfish yes PGMY PYGMY ROCKFISH Other shelf rockfish Other shelf rockfish yes PHAG PACIFIC HAGFISH Other nongroundfish Other nongroundfish PHLB PACIFIC HALIBUT Other nongroundfish Other nongroundfish PHRG PACIFIC HERRING Other nongroundfish Other nongroundfish PINK PINK SALMON Other nongroundfish Other nongroundfish PLCK WALLEYE POLLOCK Other groundfish Other groundfish yes PNK1 NOM. PINK ROCKFISH Other shelf rockfish Other shelf rockfish yes PNKR PINK ROCKFISH Other shelf rockfish Other shelf rockfish yes POMF PACIFIC POMFRET Other nongroundfish Other nongroundfish POP PACIFIC OCEAN PERCH Pacific ocean perch Other slope rockfish yes
POP1 GEN. SHELF/SLOPE RF Other slope rockfish Other slope rockfish yes POP2 NOMINAL POP Pacific ocean perch Other slope rockfish yes PRCL PURPLE CLAM Other nongroundfish Other nongroundfish PROW PROWFISH Other nongroundfish Other nongroundfish PRR1 NOM. PINKROSE ROCKFISH Other shelf rockfish Other shelf rockfish yes PRRK PINKROSE ROCKFISH Other shelf rockfish Other shelf rockfish yes PSDN PACIFIC SARDINE Other nongroundfish Other nongroundfish PSHP PINK SHRIMP Other nongroundfish Other nongroundfish PSRK PELAGIC THRESHER SHARK Other nongroundfish Other nongroundfish PSTR PACIFIC OYSTER Other nongroundfish Other nongroundfish PTR1 NOM. PETRALE SOLE Petrale sole Petrale sole yes PTRL PETRALE SOLE Petrale sole Petrale sole yes PUGT PUGET SOUND ROCKFISH Other shelf rockfish Other shelf rockfish yes
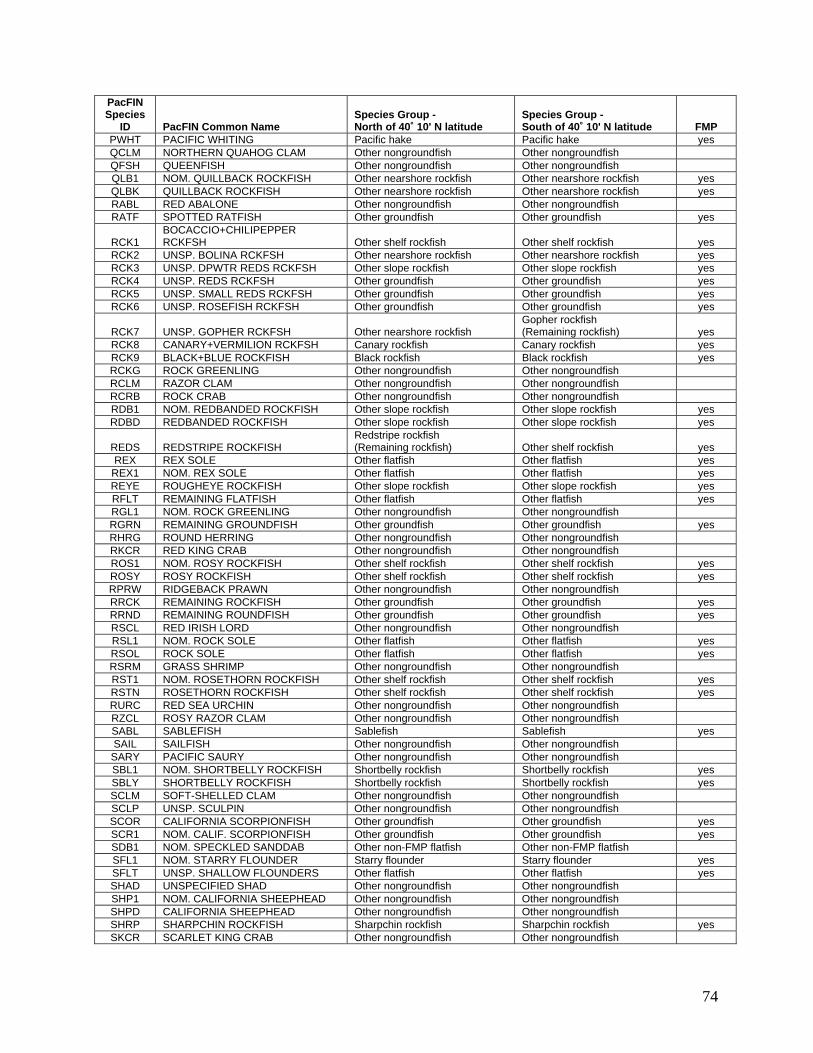
74
PacFIN Species
ID PacFIN Common Name Species Group - North of 40˚ 10' N latitude
Species Group - South of 40˚ 10' N latitude FMP
PWHT PACIFIC WHITING Pacific hake Pacific hake yes QCLM NORTHERN QUAHOG CLAM Other nongroundfish Other nongroundfish QFSH QUEENFISH Other nongroundfish Other nongroundfish QLB1 NOM. QUILLBACK ROCKFISH Other nearshore rockfish Other nearshore rockfish yes QLBK QUILLBACK ROCKFISH Other nearshore rockfish Other nearshore rockfish yes RABL RED ABALONE Other nongroundfish Other nongroundfish RATF SPOTTED RATFISH Other groundfish Other groundfish yes
RCK1 BOCACCIO+CHILIPEPPER RCKFSH Other shelf rockfish Other shelf rockfish yes
RCK2 UNSP. BOLINA RCKFSH Other nearshore rockfish Other nearshore rockfish yes RCK3 UNSP. DPWTR REDS RCKFSH Other slope rockfish Other slope rockfish yes RCK4 UNSP. REDS RCKFSH Other groundfish Other groundfish yes RCK5 UNSP. SMALL REDS RCKFSH Other groundfish Other groundfish yes RCK6 UNSP. ROSEFISH RCKFSH Other groundfish Other groundfish yes
RCK7 UNSP. GOPHER RCKFSH Other nearshore rockfish Gopher rockfish (Remaining rockfish) yes
RCK8 CANARY+VERMILION RCKFSH Canary rockfish Canary rockfish yes RCK9 BLACK+BLUE ROCKFISH Black rockfish Black rockfish yes RCKG ROCK GREENLING Other nongroundfish Other nongroundfish RCLM RAZOR CLAM Other nongroundfish Other nongroundfish RCRB ROCK CRAB Other nongroundfish Other nongroundfish RDB1 NOM. REDBANDED ROCKFISH Other slope rockfish Other slope rockfish yes RDBD REDBANDED ROCKFISH Other slope rockfish Other slope rockfish yes
REDS REDSTRIPE ROCKFISH Redstripe rockfish (Remaining rockfish) Other shelf rockfish yes
REX REX SOLE Other flatfish Other flatfish yes REX1 NOM. REX SOLE Other flatfish Other flatfish yes REYE ROUGHEYE ROCKFISH Other slope rockfish Other slope rockfish yes RFLT REMAINING FLATFISH Other flatfish Other flatfish yes RGL1 NOM. ROCK GREENLING Other nongroundfish Other nongroundfish RGRN REMAINING GROUNDFISH Other groundfish Other groundfish yes RHRG ROUND HERRING Other nongroundfish Other nongroundfish RKCR RED KING CRAB Other nongroundfish Other nongroundfish ROS1 NOM. ROSY ROCKFISH Other shelf rockfish Other shelf rockfish yes ROSY ROSY ROCKFISH Other shelf rockfish Other shelf rockfish yes RPRW RIDGEBACK PRAWN Other nongroundfish Other nongroundfish RRCK REMAINING ROCKFISH Other groundfish Other groundfish yes RRND REMAINING ROUNDFISH Other groundfish Other groundfish yes RSCL RED IRISH LORD Other nongroundfish Other nongroundfish RSL1 NOM. ROCK SOLE Other flatfish Other flatfish yes RSOL ROCK SOLE Other flatfish Other flatfish yes RSRM GRASS SHRIMP Other nongroundfish Other nongroundfish RST1 NOM. ROSETHORN ROCKFISH Other shelf rockfish Other shelf rockfish yes RSTN ROSETHORN ROCKFISH Other shelf rockfish Other shelf rockfish yes RURC RED SEA URCHIN Other nongroundfish Other nongroundfish RZCL ROSY RAZOR CLAM Other nongroundfish Other nongroundfish SABL SABLEFISH Sablefish Sablefish yes SAIL SAILFISH Other nongroundfish Other nongroundfish SARY PACIFIC SAURY Other nongroundfish Other nongroundfish SBL1 NOM. SHORTBELLY ROCKFISH Shortbelly rockfish Shortbelly rockfish yes SBLY SHORTBELLY ROCKFISH Shortbelly rockfish Shortbelly rockfish yes SCLM SOFT-SHELLED CLAM Other nongroundfish Other nongroundfish SCLP UNSP. SCULPIN Other nongroundfish Other nongroundfish SCOR CALIFORNIA SCORPIONFISH Other groundfish Other groundfish yes SCR1 NOM. CALIF. SCORPIONFISH Other groundfish Other groundfish yes SDB1 NOM. SPECKLED SANDDAB Other non-FMP flatfish Other non-FMP flatfish SFL1 NOM. STARRY FLOUNDER Starry flounder Starry flounder yes SFLT UNSP. SHALLOW FLOUNDERS Other flatfish Other flatfish yes SHAD UNSPECIFIED SHAD Other nongroundfish Other nongroundfish SHP1 NOM. CALIFORNIA SHEEPHEAD Other nongroundfish Other nongroundfish SHPD CALIFORNIA SHEEPHEAD Other nongroundfish Other nongroundfish SHRP SHARPCHIN ROCKFISH Sharpchin rockfish Sharpchin rockfish yes SKCR SCARLET KING CRAB Other nongroundfish Other nongroundfish
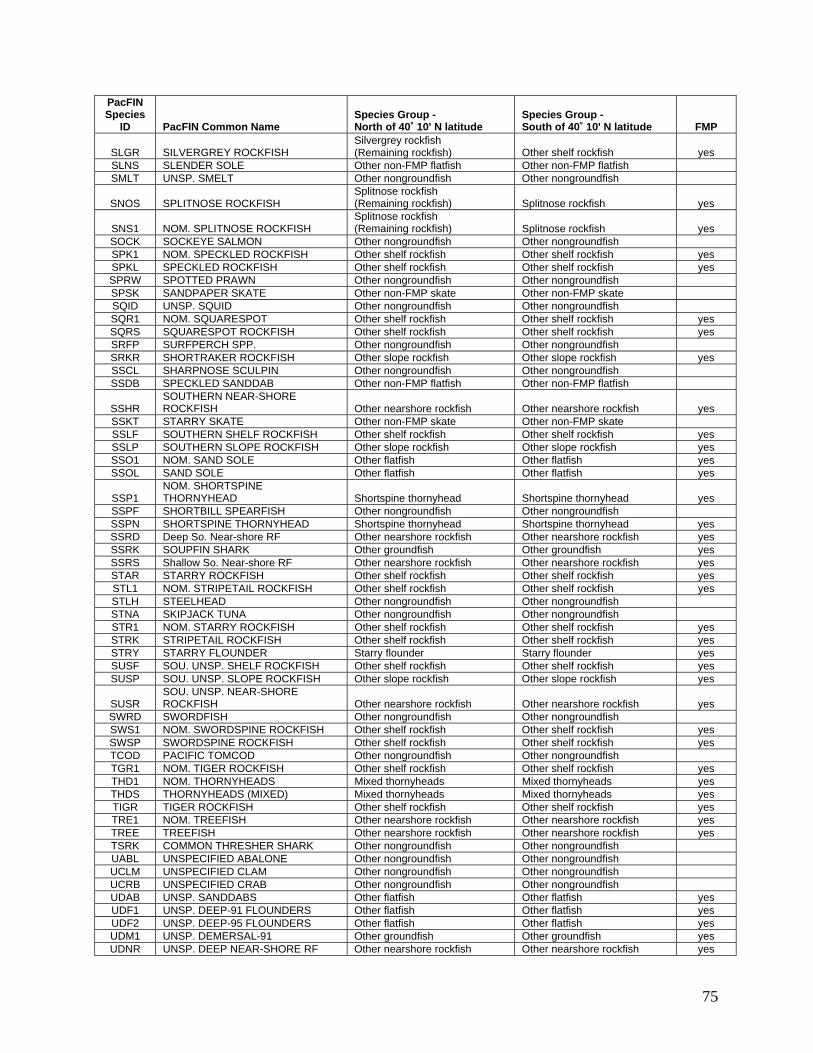
75
PacFIN Species
ID PacFIN Common Name Species Group - North of 40˚ 10' N latitude
Species Group - South of 40˚ 10' N latitude FMP
SLGR SILVERGREY ROCKFISH Silvergrey rockfish (Remaining rockfish) Other shelf rockfish yes
SLNS SLENDER SOLE Other non-FMP flatfish Other non-FMP flatfish SMLT UNSP. SMELT Other nongroundfish Other nongroundfish
SNOS SPLITNOSE ROCKFISH Splitnose rockfish (Remaining rockfish) Splitnose rockfish yes
SNS1 NOM. SPLITNOSE ROCKFISH Splitnose rockfish (Remaining rockfish) Splitnose rockfish yes
SOCK SOCKEYE SALMON Other nongroundfish Other nongroundfish SPK1 NOM. SPECKLED ROCKFISH Other shelf rockfish Other shelf rockfish yes SPKL SPECKLED ROCKFISH Other shelf rockfish Other shelf rockfish yes SPRW SPOTTED PRAWN Other nongroundfish Other nongroundfish SPSK SANDPAPER SKATE Other non-FMP skate Other non-FMP skate SQID UNSP. SQUID Other nongroundfish Other nongroundfish SQR1 NOM. SQUARESPOT Other shelf rockfish Other shelf rockfish yes SQRS SQUARESPOT ROCKFISH Other shelf rockfish Other shelf rockfish yes SRFP SURFPERCH SPP. Other nongroundfish Other nongroundfish SRKR SHORTRAKER ROCKFISH Other slope rockfish Other slope rockfish yes SSCL SHARPNOSE SCULPIN Other nongroundfish Other nongroundfish SSDB SPECKLED SANDDAB Other non-FMP flatfish Other non-FMP flatfish
SSHR SOUTHERN NEAR-SHORE ROCKFISH Other nearshore rockfish Other nearshore rockfish yes
SSKT STARRY SKATE Other non-FMP skate Other non-FMP skate SSLF SOUTHERN SHELF ROCKFISH Other shelf rockfish Other shelf rockfish yes SSLP SOUTHERN SLOPE ROCKFISH Other slope rockfish Other slope rockfish yes SSO1 NOM. SAND SOLE Other flatfish Other flatfish yes SSOL SAND SOLE Other flatfish Other flatfish yes
SSP1 NOM. SHORTSPINE THORNYHEAD Shortspine thornyhead Shortspine thornyhead yes
SSPF SHORTBILL SPEARFISH Other nongroundfish Other nongroundfish SSPN SHORTSPINE THORNYHEAD Shortspine thornyhead Shortspine thornyhead yes SSRD Deep So. Near-shore RF Other nearshore rockfish Other nearshore rockfish yes SSRK SOUPFIN SHARK Other groundfish Other groundfish yes SSRS Shallow So. Near-shore RF Other nearshore rockfish Other nearshore rockfish yes STAR STARRY ROCKFISH Other shelf rockfish Other shelf rockfish yes STL1 NOM. STRIPETAIL ROCKFISH Other shelf rockfish Other shelf rockfish yes STLH STEELHEAD Other nongroundfish Other nongroundfish STNA SKIPJACK TUNA Other nongroundfish Other nongroundfish STR1 NOM. STARRY ROCKFISH Other shelf rockfish Other shelf rockfish yes STRK STRIPETAIL ROCKFISH Other shelf rockfish Other shelf rockfish yes STRY STARRY FLOUNDER Starry flounder Starry flounder yes SUSF SOU. UNSP. SHELF ROCKFISH Other shelf rockfish Other shelf rockfish yes SUSP SOU. UNSP. SLOPE ROCKFISH Other slope rockfish Other slope rockfish yes
SUSR SOU. UNSP. NEAR-SHORE ROCKFISH Other nearshore rockfish Other nearshore rockfish yes
SWRD SWORDFISH Other nongroundfish Other nongroundfish SWS1 NOM. SWORDSPINE ROCKFISH Other shelf rockfish Other shelf rockfish yes SWSP SWORDSPINE ROCKFISH Other shelf rockfish Other shelf rockfish yes TCOD PACIFIC TOMCOD Other nongroundfish Other nongroundfish TGR1 NOM. TIGER ROCKFISH Other shelf rockfish Other shelf rockfish yes THD1 NOM. THORNYHEADS Mixed thornyheads Mixed thornyheads yes THDS THORNYHEADS (MIXED) Mixed thornyheads Mixed thornyheads yes TIGR TIGER ROCKFISH Other shelf rockfish Other shelf rockfish yes TRE1 NOM. TREEFISH Other nearshore rockfish Other nearshore rockfish yes TREE TREEFISH Other nearshore rockfish Other nearshore rockfish yes TSRK COMMON THRESHER SHARK Other nongroundfish Other nongroundfish UABL UNSPECIFIED ABALONE Other nongroundfish Other nongroundfish UCLM UNSPECIFIED CLAM Other nongroundfish Other nongroundfish UCRB UNSPECIFIED CRAB Other nongroundfish Other nongroundfish UDAB UNSP. SANDDABS Other flatfish Other flatfish yes UDF1 UNSP. DEEP-91 FLOUNDERS Other flatfish Other flatfish yes UDF2 UNSP. DEEP-95 FLOUNDERS Other flatfish Other flatfish yes UDM1 UNSP. DEMERSAL-91 Other groundfish Other groundfish yes UDNR UNSP. DEEP NEAR-SHORE RF Other nearshore rockfish Other nearshore rockfish yes
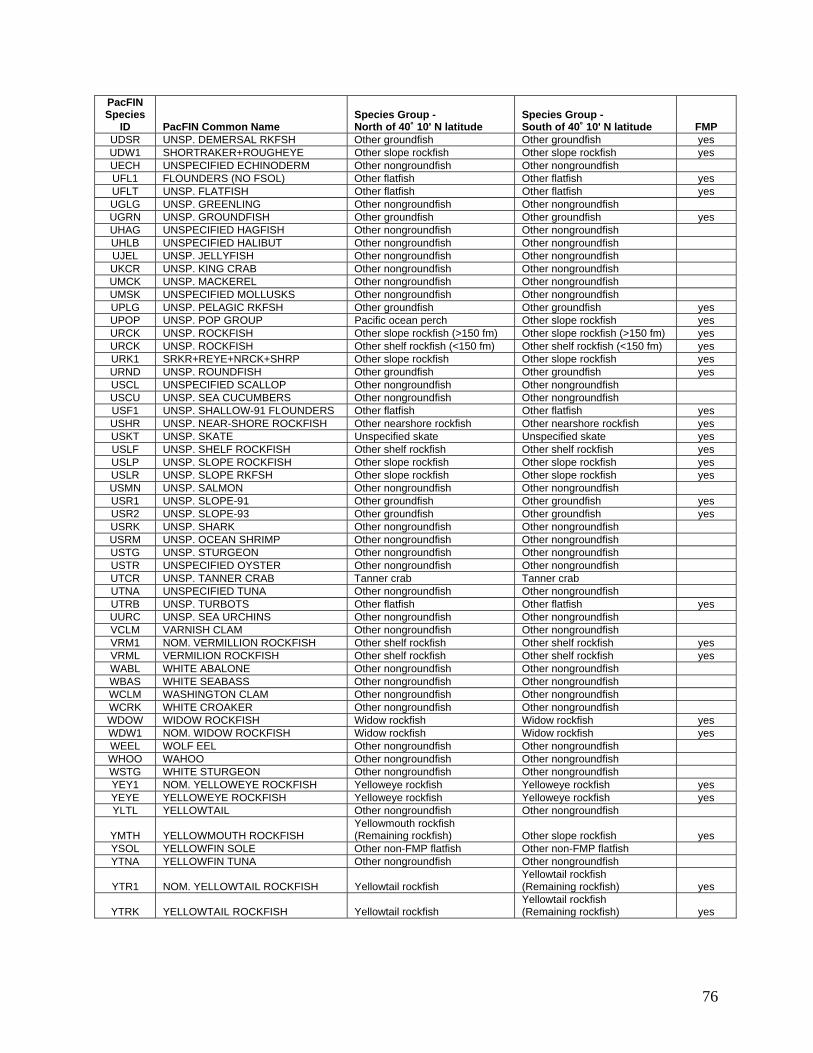
76
PacFIN Species
ID PacFIN Common Name Species Group - North of 40˚ 10' N latitude
Species Group - South of 40˚ 10' N latitude FMP
UDSR UNSP. DEMERSAL RKFSH Other groundfish Other groundfish yes UDW1 SHORTRAKER+ROUGHEYE Other slope rockfish Other slope rockfish yes UECH UNSPECIFIED ECHINODERM Other nongroundfish Other nongroundfish UFL1 FLOUNDERS (NO FSOL) Other flatfish Other flatfish yes UFLT UNSP. FLATFISH Other flatfish Other flatfish yes UGLG UNSP. GREENLING Other nongroundfish Other nongroundfish UGRN UNSP. GROUNDFISH Other groundfish Other groundfish yes UHAG UNSPECIFIED HAGFISH Other nongroundfish Other nongroundfish UHLB UNSPECIFIED HALIBUT Other nongroundfish Other nongroundfish UJEL UNSP. JELLYFISH Other nongroundfish Other nongroundfish UKCR UNSP. KING CRAB Other nongroundfish Other nongroundfish UMCK UNSP. MACKEREL Other nongroundfish Other nongroundfish UMSK UNSPECIFIED MOLLUSKS Other nongroundfish Other nongroundfish UPLG UNSP. PELAGIC RKFSH Other groundfish Other groundfish yes UPOP UNSP. POP GROUP Pacific ocean perch Other slope rockfish yes URCK UNSP. ROCKFISH Other slope rockfish (>150 fm) Other slope rockfish (>150 fm) yes URCK UNSP. ROCKFISH Other shelf rockfish (<150 fm) Other shelf rockfish (<150 fm) yes URK1 SRKR+REYE+NRCK+SHRP Other slope rockfish Other slope rockfish yes URND UNSP. ROUNDFISH Other groundfish Other groundfish yes USCL UNSPECIFIED SCALLOP Other nongroundfish Other nongroundfish USCU UNSP. SEA CUCUMBERS Other nongroundfish Other nongroundfish USF1 UNSP. SHALLOW-91 FLOUNDERS Other flatfish Other flatfish yes USHR UNSP. NEAR-SHORE ROCKFISH Other nearshore rockfish Other nearshore rockfish yes USKT UNSP. SKATE Unspecified skate Unspecified skate yes USLF UNSP. SHELF ROCKFISH Other shelf rockfish Other shelf rockfish yes USLP UNSP. SLOPE ROCKFISH Other slope rockfish Other slope rockfish yes USLR UNSP. SLOPE RKFSH Other slope rockfish Other slope rockfish yes USMN UNSP. SALMON Other nongroundfish Other nongroundfish USR1 UNSP. SLOPE-91 Other groundfish Other groundfish yes USR2 UNSP. SLOPE-93 Other groundfish Other groundfish yes USRK UNSP. SHARK Other nongroundfish Other nongroundfish USRM UNSP. OCEAN SHRIMP Other nongroundfish Other nongroundfish USTG UNSP. STURGEON Other nongroundfish Other nongroundfish USTR UNSPECIFIED OYSTER Other nongroundfish Other nongroundfish UTCR UNSP. TANNER CRAB Tanner crab Tanner crab UTNA UNSPECIFIED TUNA Other nongroundfish Other nongroundfish UTRB UNSP. TURBOTS Other flatfish Other flatfish yes UURC UNSP. SEA URCHINS Other nongroundfish Other nongroundfish VCLM VARNISH CLAM Other nongroundfish Other nongroundfish VRM1 NOM. VERMILLION ROCKFISH Other shelf rockfish Other shelf rockfish yes VRML VERMILION ROCKFISH Other shelf rockfish Other shelf rockfish yes WABL WHITE ABALONE Other nongroundfish Other nongroundfish WBAS WHITE SEABASS Other nongroundfish Other nongroundfish WCLM WASHINGTON CLAM Other nongroundfish Other nongroundfish WCRK WHITE CROAKER Other nongroundfish Other nongroundfish WDOW WIDOW ROCKFISH Widow rockfish Widow rockfish yes WDW1 NOM. WIDOW ROCKFISH Widow rockfish Widow rockfish yes WEEL WOLF EEL Other nongroundfish Other nongroundfish WHOO WAHOO Other nongroundfish Other nongroundfish WSTG WHITE STURGEON Other nongroundfish Other nongroundfish YEY1 NOM. YELLOWEYE ROCKFISH Yelloweye rockfish Yelloweye rockfish yes YEYE YELLOWEYE ROCKFISH Yelloweye rockfish Yelloweye rockfish yes YLTL YELLOWTAIL Other nongroundfish Other nongroundfish
YMTH YELLOWMOUTH ROCKFISH Yellowmouth rockfish (Remaining rockfish) Other slope rockfish yes
YSOL YELLOWFIN SOLE Other non-FMP flatfish Other non-FMP flatfish YTNA YELLOWFIN TUNA Other nongroundfish Other nongroundfish
YTR1 NOM. YELLOWTAIL ROCKFISH Yellowtail rockfish Yellowtail rockfish (Remaining rockfish) yes
YTRK YELLOWTAIL ROCKFISH Yellowtail rockfish Yellowtail rockfish (Remaining rockfish) yes
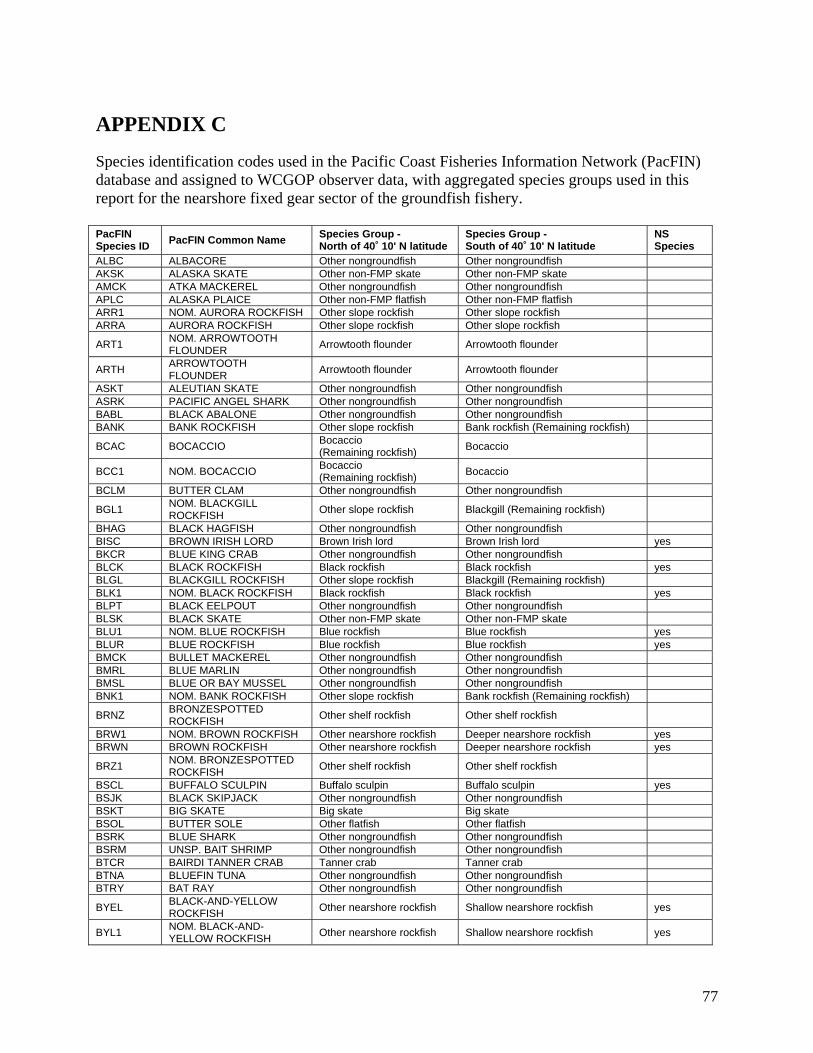
77
APPENDIX C
Species identification codes used in the Pacific Coast Fisheries Information Network (PacFIN) database and assigned to WCGOP observer data, with aggregated species groups used in this report for the nearshore fixed gear sector of the groundfish fishery. PacFIN Species ID
PacFIN Common Name Species Group - North of 40˚ 10' N latitude
Species Group - South of 40˚ 10' N latitude
NS Species
ALBC ALBACORE Other nongroundfish Other nongroundfish AKSK ALASKA SKATE Other non-FMP skate Other non-FMP skate AMCK ATKA MACKEREL Other nongroundfish Other nongroundfish APLC ALASKA PLAICE Other non-FMP flatfish Other non-FMP flatfish ARR1 NOM. AURORA ROCKFISH Other slope rockfish Other slope rockfish ARRA AURORA ROCKFISH Other slope rockfish Other slope rockfish
ART1 NOM. ARROWTOOTH FLOUNDER
Arrowtooth flounder Arrowtooth flounder
ARTH ARROWTOOTH FLOUNDER
Arrowtooth flounder Arrowtooth flounder
ASKT ALEUTIAN SKATE Other nongroundfish Other nongroundfish ASRK PACIFIC ANGEL SHARK Other nongroundfish Other nongroundfish BABL BLACK ABALONE Other nongroundfish Other nongroundfish BANK BANK ROCKFISH Other slope rockfish Bank rockfish (Remaining rockfish)
BCAC BOCACCIO Bocaccio (Remaining rockfish)
Bocaccio
BCC1 NOM. BOCACCIO Bocaccio (Remaining rockfish)
Bocaccio
BCLM BUTTER CLAM Other nongroundfish Other nongroundfish
BGL1 NOM. BLACKGILL ROCKFISH
Other slope rockfish Blackgill (Remaining rockfish)
BHAG BLACK HAGFISH Other nongroundfish Other nongroundfish BISC BROWN IRISH LORD Brown Irish lord Brown Irish lord yes BKCR BLUE KING CRAB Other nongroundfish Other nongroundfish BLCK BLACK ROCKFISH Black rockfish Black rockfish yes BLGL BLACKGILL ROCKFISH Other slope rockfish Blackgill (Remaining rockfish) BLK1 NOM. BLACK ROCKFISH Black rockfish Black rockfish yes BLPT BLACK EELPOUT Other nongroundfish Other nongroundfish BLSK BLACK SKATE Other non-FMP skate Other non-FMP skate BLU1 NOM. BLUE ROCKFISH Blue rockfish Blue rockfish yes BLUR BLUE ROCKFISH Blue rockfish Blue rockfish yes BMCK BULLET MACKEREL Other nongroundfish Other nongroundfish BMRL BLUE MARLIN Other nongroundfish Other nongroundfish BMSL BLUE OR BAY MUSSEL Other nongroundfish Other nongroundfish BNK1 NOM. BANK ROCKFISH Other slope rockfish Bank rockfish (Remaining rockfish)
BRNZ BRONZESPOTTED ROCKFISH
Other shelf rockfish Other shelf rockfish
BRW1 NOM. BROWN ROCKFISH Other nearshore rockfish Deeper nearshore rockfish yes BRWN BROWN ROCKFISH Other nearshore rockfish Deeper nearshore rockfish yes
BRZ1 NOM. BRONZESPOTTED ROCKFISH
Other shelf rockfish Other shelf rockfish
BSCL BUFFALO SCULPIN Buffalo sculpin Buffalo sculpin yes BSJK BLACK SKIPJACK Other nongroundfish Other nongroundfish BSKT BIG SKATE Big skate Big skate BSOL BUTTER SOLE Other flatfish Other flatfish BSRK BLUE SHARK Other nongroundfish Other nongroundfish BSRM UNSP. BAIT SHRIMP Other nongroundfish Other nongroundfish BTCR BAIRDI TANNER CRAB Tanner crab Tanner crab BTNA BLUEFIN TUNA Other nongroundfish Other nongroundfish BTRY BAT RAY Other nongroundfish Other nongroundfish
BYEL BLACK-AND-YELLOW ROCKFISH
Other nearshore rockfish Shallow nearshore rockfish yes
BYL1 NOM. BLACK-AND-YELLOW ROCKFISH
Other nearshore rockfish Shallow nearshore rockfish yes
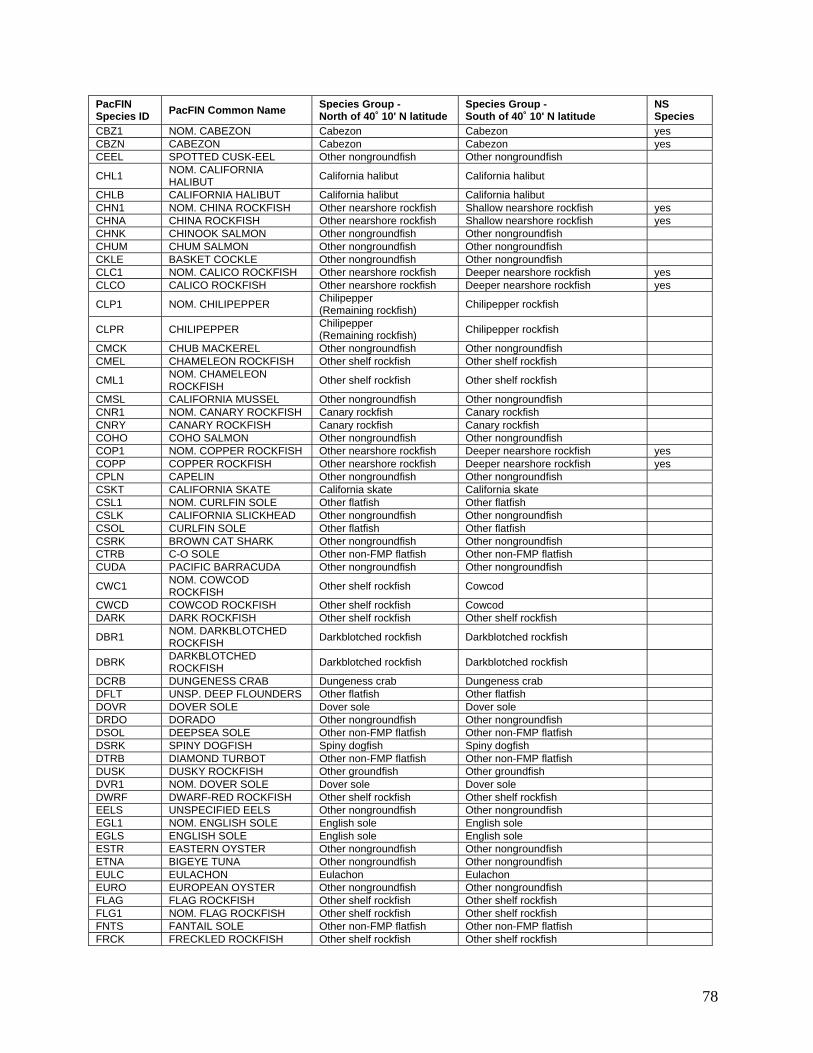
78
PacFIN Species ID
PacFIN Common Name Species Group - North of 40˚ 10' N latitude
Species Group - South of 40˚ 10' N latitude
NS Species
CBZ1 NOM. CABEZON Cabezon Cabezon yes CBZN CABEZON Cabezon Cabezon yes CEEL SPOTTED CUSK-EEL Other nongroundfish Other nongroundfish
CHL1 NOM. CALIFORNIA HALIBUT
California halibut California halibut
CHLB CALIFORNIA HALIBUT California halibut California halibut CHN1 NOM. CHINA ROCKFISH Other nearshore rockfish Shallow nearshore rockfish yes CHNA CHINA ROCKFISH Other nearshore rockfish Shallow nearshore rockfish yes CHNK CHINOOK SALMON Other nongroundfish Other nongroundfish CHUM CHUM SALMON Other nongroundfish Other nongroundfish CKLE BASKET COCKLE Other nongroundfish Other nongroundfish CLC1 NOM. CALICO ROCKFISH Other nearshore rockfish Deeper nearshore rockfish yes CLCO CALICO ROCKFISH Other nearshore rockfish Deeper nearshore rockfish yes
CLP1 NOM. CHILIPEPPER Chilipepper (Remaining rockfish)
Chilipepper rockfish
CLPR CHILIPEPPER Chilipepper (Remaining rockfish)
Chilipepper rockfish
CMCK CHUB MACKEREL Other nongroundfish Other nongroundfish CMEL CHAMELEON ROCKFISH Other shelf rockfish Other shelf rockfish
CML1 NOM. CHAMELEON ROCKFISH
Other shelf rockfish Other shelf rockfish
CMSL CALIFORNIA MUSSEL Other nongroundfish Other nongroundfish CNR1 NOM. CANARY ROCKFISH Canary rockfish Canary rockfish CNRY CANARY ROCKFISH Canary rockfish Canary rockfish COHO COHO SALMON Other nongroundfish Other nongroundfish COP1 NOM. COPPER ROCKFISH Other nearshore rockfish Deeper nearshore rockfish yes COPP COPPER ROCKFISH Other nearshore rockfish Deeper nearshore rockfish yes CPLN CAPELIN Other nongroundfish Other nongroundfish CSKT CALIFORNIA SKATE California skate California skate CSL1 NOM. CURLFIN SOLE Other flatfish Other flatfish CSLK CALIFORNIA SLICKHEAD Other nongroundfish Other nongroundfish CSOL CURLFIN SOLE Other flatfish Other flatfish CSRK BROWN CAT SHARK Other nongroundfish Other nongroundfish CTRB C-O SOLE Other non-FMP flatfish Other non-FMP flatfish CUDA PACIFIC BARRACUDA Other nongroundfish Other nongroundfish
CWC1 NOM. COWCOD ROCKFISH
Other shelf rockfish Cowcod
CWCD COWCOD ROCKFISH Other shelf rockfish Cowcod DARK DARK ROCKFISH Other shelf rockfish Other shelf rockfish
DBR1 NOM. DARKBLOTCHED ROCKFISH
Darkblotched rockfish Darkblotched rockfish
DBRK DARKBLOTCHED ROCKFISH
Darkblotched rockfish Darkblotched rockfish
DCRB DUNGENESS CRAB Dungeness crab Dungeness crab DFLT UNSP. DEEP FLOUNDERS Other flatfish Other flatfish DOVR DOVER SOLE Dover sole Dover sole DRDO DORADO Other nongroundfish Other nongroundfish DSOL DEEPSEA SOLE Other non-FMP flatfish Other non-FMP flatfish DSRK SPINY DOGFISH Spiny dogfish Spiny dogfish DTRB DIAMOND TURBOT Other non-FMP flatfish Other non-FMP flatfish DUSK DUSKY ROCKFISH Other groundfish Other groundfish DVR1 NOM. DOVER SOLE Dover sole Dover sole DWRF DWARF-RED ROCKFISH Other shelf rockfish Other shelf rockfish EELS UNSPECIFIED EELS Other nongroundfish Other nongroundfish EGL1 NOM. ENGLISH SOLE English sole English sole EGLS ENGLISH SOLE English sole English sole ESTR EASTERN OYSTER Other nongroundfish Other nongroundfish ETNA BIGEYE TUNA Other nongroundfish Other nongroundfish EULC EULACHON Eulachon Eulachon EURO EUROPEAN OYSTER Other nongroundfish Other nongroundfish FLAG FLAG ROCKFISH Other shelf rockfish Other shelf rockfish FLG1 NOM. FLAG ROCKFISH Other shelf rockfish Other shelf rockfish FNTS FANTAIL SOLE Other non-FMP flatfish Other non-FMP flatfish FRCK FRECKLED ROCKFISH Other shelf rockfish Other shelf rockfish

79
PacFIN Species ID
PacFIN Common Name Species Group - North of 40˚ 10' N latitude
Species Group - South of 40˚ 10' N latitude
NS Species
FSOL FLATHEAD SOLE Other flatfish Other flatfish GABL GREEN ABALONE Other nongroundfish Other nongroundfish GBAS GIANT SEA BASS Other nongroundfish Other nongroundfish
GBL1 NOM. GREENBLOTCHED ROCKFISH
Other shelf rockfish Other shelf rockfish
GBLC GREENBLOTCHED ROCKFISH
Other shelf rockfish Other shelf rockfish
GCLM GAPER CLAM Other nongroundfish Other nongroundfish GDUK GEODUCK Other nongroundfish Other nongroundfish GGRD GIANT GRENADIER Other nongroundfish Other nongroundfish GKCR GOLDEN KING CRAB Other nongroundfish Other nongroundfish
GPH1 NOM. GOPHER ROCKFISH Other nearshore rockfish Gopher rockfish (Remaining rockfish)
yes
GPHR GOPHER ROCKFISH Other nearshore rockfish Gopher rockfish (Remaining rockfish)
yes
GPRW GOLDEN PRAWN Other nongroundfish Other nongroundfish GRAS GRASS ROCKFISH Other nearshore rockfish Shallow nearshore rockfish yes GRDR UNSP. GRENADIERS Grenadiers Grenadiers GREN PACIFIC GRENADIER Grenadiers Grenadiers GRS1 NOM. GRASS ROCKFISH Other nearshore rockfish Shallow nearshore rockfish yes
GSP1 NOM. GREENSPOTTED ROCKFISH
Greenspotted rockfish Greenspotted rockfish
GSPT GREENSPOTTED ROCKFISH
Greenspotted rockfish Greenspotted rockfish
GSQD GIANT SQUID Other nongroundfish Other nongroundfish
GSR1 NOM. GREENSTRIPED ROCKFISH
Greenstriped rockfish Greenstriped rockfish
GSRK GREENSTRIPED ROCKFISH
Greenstriped rockfish Greenstriped rockfish
GSRM GHOST SHRIMP Other nongroundfish Other nongroundfish GSTG GREEN STURGEON Other nongroundfish Other nongroundfish GTRB GREENLAND TURBOT Other non-FMP flatfish Other non-FMP flatfish HBRK HALFBANDED ROCKFISH Other shelf rockfish Other shelf rockfish HCLM HORSE CLAMS Other nongroundfish Other nongroundfish HLQN HARLEQUIN ROCKFISH Other shelf rockfish Other shelf rockfish
HNY1 NOM. HONEYCOMB ROCKFISH
Other shelf rockfish Other shelf rockfish
HNYC HONEYCOMB ROCKFISH Other shelf rockfish Other shelf rockfish HTRB HORNYHEAD TURBOT Other non-FMP flatfish Other non-FMP flatfish
ISRK BIGEYE THRESHER SHARK
Other nongroundfish Other nongroundfish
JCLM CALIFORNIA JACKKNIFE CLAM
Other nongroundfish Other nongroundfish
JMCK JACK MACKEREL Other nongroundfish Other nongroundfish KFSH GIANT KELPFISH Other nongroundfish Other nongroundfish KGL1 NOM. KELP GREENLING Kelp greenling Kelp greenling yes KLP1 NOM. KELP ROCKFISH Other nearshore rockfish Shallow nearshore rockfish yes KLPG KELP GREENLING Kelp greenling Kelp greenling yes KLPR KELP ROCKFISH Other nearshore rockfish Shallow nearshore rockfish yes KMKA KAMCHATKA FLOUNDER Other non-FMP flatfish Other non-FMP flatfish KSTR KUMAMOTO OYSTER Other nongroundfish Other nongroundfish LCD1 NOM. LINGCOD Lingcod Lingcod yes LCLM NATIVE LITTLENECK Other nongroundfish Other nongroundfish LCOD LINGCOD Lingcod Lingcod yes LDAB LONGFIN SANDDAB Other non-FMP flatfish Other non-FMP flatfish LDB1 NOM. LONGFIN SANDDAB Other non-FMP flatfish Other non-FMP flatfish LOBS CALIF. SPINY LOBSTER Other nongroundfish Other nongroundfish LSKT LONGNOSE SKATE Longnose skate Longnose skate
LSP1 NOM. LONGSPINE THORNYHEAD
Longspine thornyhead Longspine thornyhead
LSPN LONGSPINE THORNYHEAD
Longspine thornyhead Longspine thornyhead
LSRK LEOPARD SHARK Other groundfish Other groundfish LSTR OLYMPIA OYSTER Other nongroundfish Other nongroundfish LUVR LOUVAR Other nongroundfish Other nongroundfish
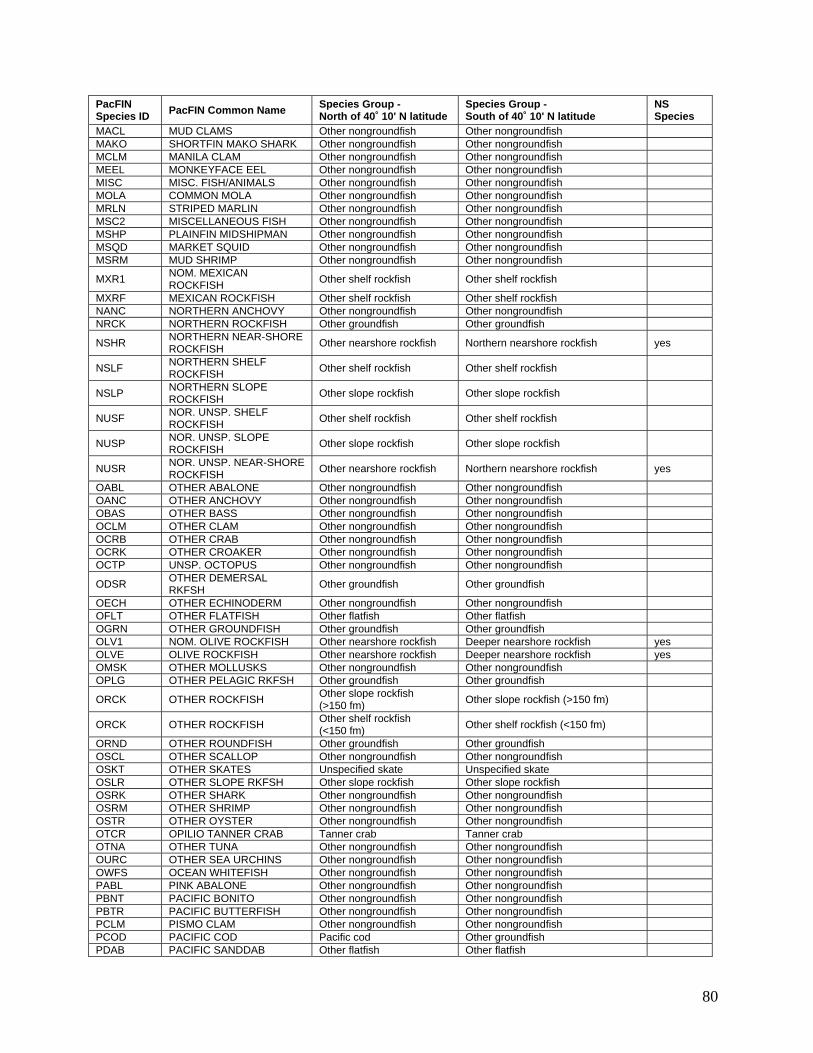
80
PacFIN Species ID
PacFIN Common Name Species Group - North of 40˚ 10' N latitude
Species Group - South of 40˚ 10' N latitude
NS Species
MACL MUD CLAMS Other nongroundfish Other nongroundfish MAKO SHORTFIN MAKO SHARK Other nongroundfish Other nongroundfish MCLM MANILA CLAM Other nongroundfish Other nongroundfish MEEL MONKEYFACE EEL Other nongroundfish Other nongroundfish MISC MISC. FISH/ANIMALS Other nongroundfish Other nongroundfish MOLA COMMON MOLA Other nongroundfish Other nongroundfish MRLN STRIPED MARLIN Other nongroundfish Other nongroundfish MSC2 MISCELLANEOUS FISH Other nongroundfish Other nongroundfish MSHP PLAINFIN MIDSHIPMAN Other nongroundfish Other nongroundfish MSQD MARKET SQUID Other nongroundfish Other nongroundfish MSRM MUD SHRIMP Other nongroundfish Other nongroundfish
MXR1 NOM. MEXICAN ROCKFISH
Other shelf rockfish Other shelf rockfish
MXRF MEXICAN ROCKFISH Other shelf rockfish Other shelf rockfish NANC NORTHERN ANCHOVY Other nongroundfish Other nongroundfish NRCK NORTHERN ROCKFISH Other groundfish Other groundfish
NSHR NORTHERN NEAR-SHORE ROCKFISH
Other nearshore rockfish Northern nearshore rockfish yes
NSLF NORTHERN SHELF ROCKFISH
Other shelf rockfish Other shelf rockfish
NSLP NORTHERN SLOPE ROCKFISH
Other slope rockfish Other slope rockfish
NUSF NOR. UNSP. SHELF ROCKFISH
Other shelf rockfish Other shelf rockfish
NUSP NOR. UNSP. SLOPE ROCKFISH
Other slope rockfish Other slope rockfish
NUSR NOR. UNSP. NEAR-SHORE ROCKFISH
Other nearshore rockfish Northern nearshore rockfish yes
OABL OTHER ABALONE Other nongroundfish Other nongroundfish OANC OTHER ANCHOVY Other nongroundfish Other nongroundfish OBAS OTHER BASS Other nongroundfish Other nongroundfish OCLM OTHER CLAM Other nongroundfish Other nongroundfish OCRB OTHER CRAB Other nongroundfish Other nongroundfish OCRK OTHER CROAKER Other nongroundfish Other nongroundfish OCTP UNSP. OCTOPUS Other nongroundfish Other nongroundfish
ODSR OTHER DEMERSAL RKFSH
Other groundfish Other groundfish
OECH OTHER ECHINODERM Other nongroundfish Other nongroundfish OFLT OTHER FLATFISH Other flatfish Other flatfish OGRN OTHER GROUNDFISH Other groundfish Other groundfish OLV1 NOM. OLIVE ROCKFISH Other nearshore rockfish Deeper nearshore rockfish yes OLVE OLIVE ROCKFISH Other nearshore rockfish Deeper nearshore rockfish yes OMSK OTHER MOLLUSKS Other nongroundfish Other nongroundfish OPLG OTHER PELAGIC RKFSH Other groundfish Other groundfish
ORCK OTHER ROCKFISH Other slope rockfish (>150 fm)
Other slope rockfish (>150 fm)
ORCK OTHER ROCKFISH Other shelf rockfish (<150 fm)
Other shelf rockfish (<150 fm)
ORND OTHER ROUNDFISH Other groundfish Other groundfish OSCL OTHER SCALLOP Other nongroundfish Other nongroundfish OSKT OTHER SKATES Unspecified skate Unspecified skate OSLR OTHER SLOPE RKFSH Other slope rockfish Other slope rockfish OSRK OTHER SHARK Other nongroundfish Other nongroundfish OSRM OTHER SHRIMP Other nongroundfish Other nongroundfish OSTR OTHER OYSTER Other nongroundfish Other nongroundfish OTCR OPILIO TANNER CRAB Tanner crab Tanner crab OTNA OTHER TUNA Other nongroundfish Other nongroundfish OURC OTHER SEA URCHINS Other nongroundfish Other nongroundfish OWFS OCEAN WHITEFISH Other nongroundfish Other nongroundfish PABL PINK ABALONE Other nongroundfish Other nongroundfish PBNT PACIFIC BONITO Other nongroundfish Other nongroundfish PBTR PACIFIC BUTTERFISH Other nongroundfish Other nongroundfish PCLM PISMO CLAM Other nongroundfish Other nongroundfish PCOD PACIFIC COD Pacific cod Other groundfish PDAB PACIFIC SANDDAB Other flatfish Other flatfish

81
PacFIN Species ID
PacFIN Common Name Species Group - North of 40˚ 10' N latitude
Species Group - South of 40˚ 10' N latitude
NS Species
PDB1 NOM. PACIFIC SANDDAB Other flatfish Other flatfish PFNS PACIFIC FLATNOSE Other groundfish Other groundfish PGMY PYGMY ROCKFISH Other shelf rockfish Other shelf rockfish PHAG PACIFIC HAGFISH Other nongroundfish Other nongroundfish PHLB PACIFIC HALIBUT Other nongroundfish Other nongroundfish PHRG PACIFIC HERRING Other nongroundfish Other nongroundfish PINK PINK SALMON Other nongroundfish Other nongroundfish PLCK WALLEYE POLLOCK Other groundfish Other groundfish PNK1 NOM. PINK ROCKFISH Other shelf rockfish Other shelf rockfish PNKR PINK ROCKFISH Other shelf rockfish Other shelf rockfish POMF PACIFIC POMFRET Other nongroundfish Other nongroundfish POP PACIFIC OCEAN PERCH Pacific ocean perch Other slope rockfish POP1 GEN. SHELF/SLOPE RF Other slope rockfish Other slope rockfish POP2 NOMINAL POP Pacific ocean perch Other slope rockfish PRCL PURPLE CLAM Other nongroundfish Other nongroundfish PROW PROWFISH Other nongroundfish Other nongroundfish
PRR1 NOM. PINKROSE ROCKFISH
Other shelf rockfish Other shelf rockfish
PRRK PINKROSE ROCKFISH Other shelf rockfish Other shelf rockfish PSDN PACIFIC SARDINE Other nongroundfish Other nongroundfish PSHP PINK SHRIMP Other nongroundfish Other nongroundfish
PSRK PELAGIC THRESHER SHARK
Other nongroundfish Other nongroundfish
PSTR PACIFIC OYSTER Other nongroundfish Other nongroundfish PTR1 NOM. PETRALE SOLE Petrale sole Petrale sole PTRL PETRALE SOLE Petrale sole Petrale sole PUGT PUGET SOUND ROCKFISH Other shelf rockfish Other shelf rockfish PWHT PACIFIC WHITING Pacific hake Pacific hake
QCLM NORTHERN QUAHOG CLAM
Other nongroundfish Other nongroundfish
QFSH QUEENFISH Other nongroundfish Other nongroundfish
QLB1 NOM. QUILLBACK ROCKFISH
Other nearshore rockfish Deeper nearshore rockfish yes
QLBK QUILLBACK ROCKFISH Other nearshore rockfish Deeper nearshore rockfish yes RABL RED ABALONE Other nongroundfish Other nongroundfish RATF SPOTTED RATFISH Other groundfish Other groundfish
RCK1 BOCACCIO+CHILIPEPPER RCKFSH
Other shelf rockfish Other shelf rockfish
RCK2 UNSP. BOLINA RCKFSH Other nearshore rockfish Deeper nearshore rockfish yes
RCK3 UNSP. DPWTR REDS RCKFSH
Other slope rockfish Other slope rockfish
RCK4 UNSP. REDS RCKFSH Other groundfish Other groundfish
RCK5 UNSP. SMALL REDS RCKFSH
Other groundfish Other groundfish
RCK6 UNSP. ROSEFISH RCKFSH
Other groundfish Other groundfish
RCK7 UNSP. GOPHER RCKFSH Other nearshore rockfish Gopher rockfish (Remaining rockfish)
yes
RCK8 CANARY+VERMILION RCKFSH
Canary rockfish Canary rockfish
RCK9 BLACK+BLUE ROCKFISH Black rockfish Black rockfish yes RCKG ROCK GREENLING Other greenling Other greenling RCLM RAZOR CLAM Other nongroundfish Other nongroundfish RCRB ROCK CRAB Other nongroundfish Other nongroundfish
RDB1 NOM. REDBANDED ROCKFISH
Other slope rockfish Other slope rockfish
RDBD REDBANDED ROCKFISH Other slope rockfish Other slope rockfish
REDS REDSTRIPE ROCKFISH Redstripe rockfish (Remaining rockfish)
Other slope rockfish
REX REX SOLE Other flatfish Other flatfish REX1 NOM. REX SOLE Other flatfish Other flatfish REYE ROUGHEYE ROCKFISH Other slope rockfish Other slope rockfish RFLT REMAINING FLATFISH Other flatfish Other flatfish RGL1 NOM. ROCK GREENLING Other greenling Other greenling RGRN REMAINING GROUNDFISH Other groundfish Other groundfish
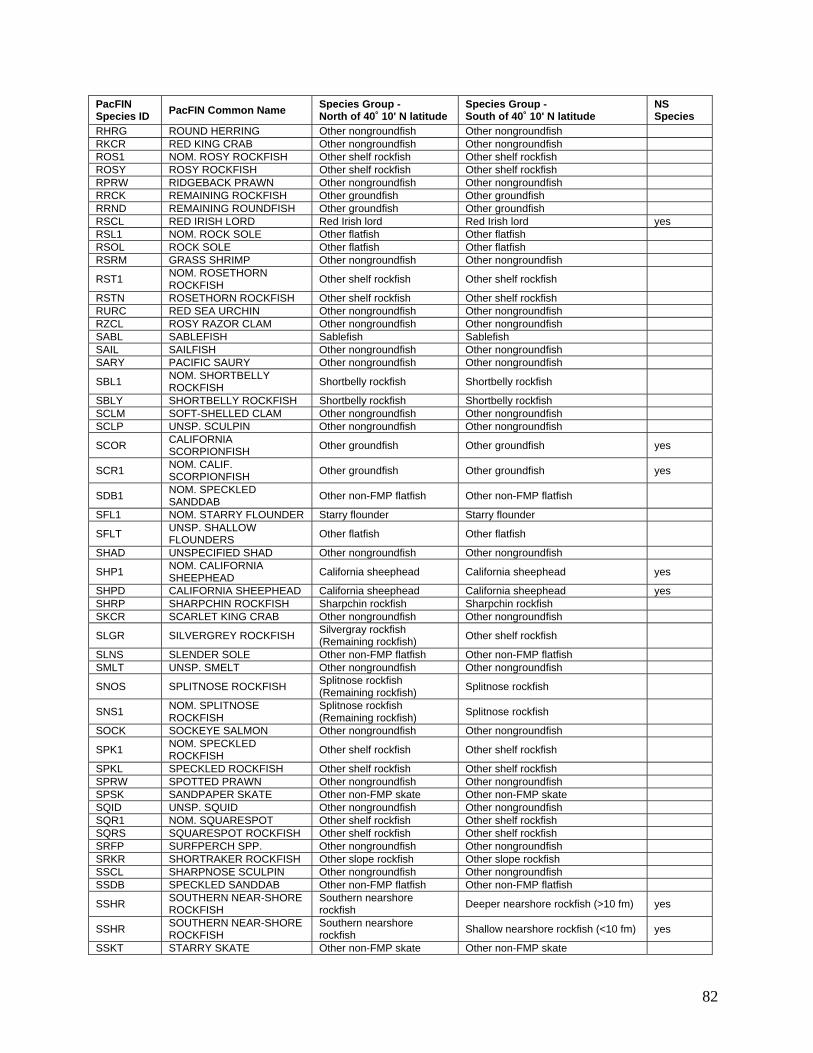
82
PacFIN Species ID
PacFIN Common Name Species Group - North of 40˚ 10' N latitude
Species Group - South of 40˚ 10' N latitude
NS Species
RHRG ROUND HERRING Other nongroundfish Other nongroundfish RKCR RED KING CRAB Other nongroundfish Other nongroundfish ROS1 NOM. ROSY ROCKFISH Other shelf rockfish Other shelf rockfish ROSY ROSY ROCKFISH Other shelf rockfish Other shelf rockfish RPRW RIDGEBACK PRAWN Other nongroundfish Other nongroundfish RRCK REMAINING ROCKFISH Other groundfish Other groundfish RRND REMAINING ROUNDFISH Other groundfish Other groundfish RSCL RED IRISH LORD Red Irish lord Red Irish lord yes RSL1 NOM. ROCK SOLE Other flatfish Other flatfish RSOL ROCK SOLE Other flatfish Other flatfish RSRM GRASS SHRIMP Other nongroundfish Other nongroundfish
RST1 NOM. ROSETHORN ROCKFISH
Other shelf rockfish Other shelf rockfish
RSTN ROSETHORN ROCKFISH Other shelf rockfish Other shelf rockfish RURC RED SEA URCHIN Other nongroundfish Other nongroundfish RZCL ROSY RAZOR CLAM Other nongroundfish Other nongroundfish SABL SABLEFISH Sablefish Sablefish SAIL SAILFISH Other nongroundfish Other nongroundfish SARY PACIFIC SAURY Other nongroundfish Other nongroundfish
SBL1 NOM. SHORTBELLY ROCKFISH
Shortbelly rockfish Shortbelly rockfish
SBLY SHORTBELLY ROCKFISH Shortbelly rockfish Shortbelly rockfish SCLM SOFT-SHELLED CLAM Other nongroundfish Other nongroundfish SCLP UNSP. SCULPIN Other nongroundfish Other nongroundfish
SCOR CALIFORNIA SCORPIONFISH
Other groundfish Other groundfish yes
SCR1 NOM. CALIF. SCORPIONFISH
Other groundfish Other groundfish yes
SDB1 NOM. SPECKLED SANDDAB
Other non-FMP flatfish Other non-FMP flatfish
SFL1 NOM. STARRY FLOUNDER Starry flounder Starry flounder
SFLT UNSP. SHALLOW FLOUNDERS
Other flatfish Other flatfish
SHAD UNSPECIFIED SHAD Other nongroundfish Other nongroundfish
SHP1 NOM. CALIFORNIA SHEEPHEAD
California sheephead California sheephead yes
SHPD CALIFORNIA SHEEPHEAD California sheephead California sheephead yes SHRP SHARPCHIN ROCKFISH Sharpchin rockfish Sharpchin rockfish SKCR SCARLET KING CRAB Other nongroundfish Other nongroundfish
SLGR SILVERGREY ROCKFISH Silvergray rockfish (Remaining rockfish)
Other shelf rockfish
SLNS SLENDER SOLE Other non-FMP flatfish Other non-FMP flatfish SMLT UNSP. SMELT Other nongroundfish Other nongroundfish
SNOS SPLITNOSE ROCKFISH Splitnose rockfish (Remaining rockfish)
Splitnose rockfish
SNS1 NOM. SPLITNOSE ROCKFISH
Splitnose rockfish (Remaining rockfish)
Splitnose rockfish
SOCK SOCKEYE SALMON Other nongroundfish Other nongroundfish
SPK1 NOM. SPECKLED ROCKFISH
Other shelf rockfish Other shelf rockfish
SPKL SPECKLED ROCKFISH Other shelf rockfish Other shelf rockfish SPRW SPOTTED PRAWN Other nongroundfish Other nongroundfish SPSK SANDPAPER SKATE Other non-FMP skate Other non-FMP skate SQID UNSP. SQUID Other nongroundfish Other nongroundfish SQR1 NOM. SQUARESPOT Other shelf rockfish Other shelf rockfish SQRS SQUARESPOT ROCKFISH Other shelf rockfish Other shelf rockfish SRFP SURFPERCH SPP. Other nongroundfish Other nongroundfish SRKR SHORTRAKER ROCKFISH Other slope rockfish Other slope rockfish SSCL SHARPNOSE SCULPIN Other nongroundfish Other nongroundfish SSDB SPECKLED SANDDAB Other non-FMP flatfish Other non-FMP flatfish
SSHR SOUTHERN NEAR-SHORE ROCKFISH
Southern nearshore rockfish
Deeper nearshore rockfish (>10 fm) yes
SSHR SOUTHERN NEAR-SHORE ROCKFISH
Southern nearshore rockfish
Shallow nearshore rockfish (<10 fm) yes
SSKT STARRY SKATE Other non-FMP skate Other non-FMP skate
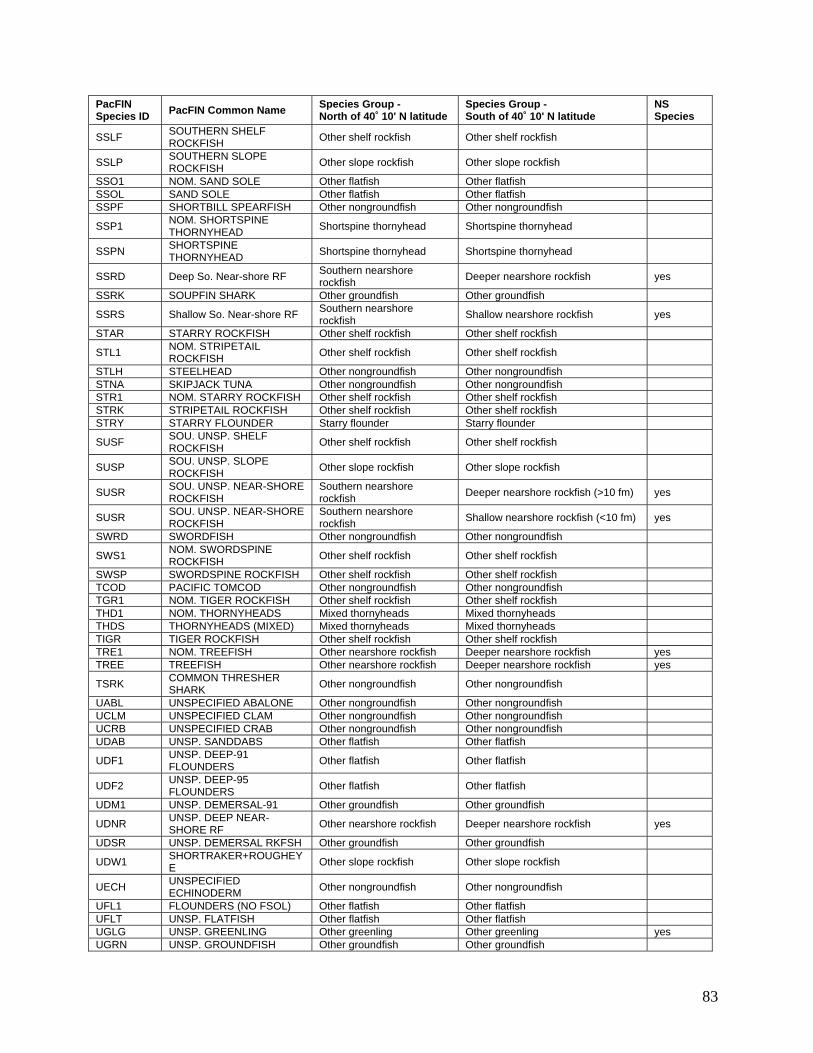
83
PacFIN Species ID
PacFIN Common Name Species Group - North of 40˚ 10' N latitude
Species Group - South of 40˚ 10' N latitude
NS Species
SSLF SOUTHERN SHELF ROCKFISH
Other shelf rockfish Other shelf rockfish
SSLP SOUTHERN SLOPE ROCKFISH
Other slope rockfish Other slope rockfish
SSO1 NOM. SAND SOLE Other flatfish Other flatfish SSOL SAND SOLE Other flatfish Other flatfish SSPF SHORTBILL SPEARFISH Other nongroundfish Other nongroundfish
SSP1 NOM. SHORTSPINE THORNYHEAD
Shortspine thornyhead Shortspine thornyhead
SSPN SHORTSPINE THORNYHEAD
Shortspine thornyhead Shortspine thornyhead
SSRD Deep So. Near-shore RF Southern nearshore rockfish
Deeper nearshore rockfish yes
SSRK SOUPFIN SHARK Other groundfish Other groundfish
SSRS Shallow So. Near-shore RF Southern nearshore rockfish
Shallow nearshore rockfish yes
STAR STARRY ROCKFISH Other shelf rockfish Other shelf rockfish
STL1 NOM. STRIPETAIL ROCKFISH
Other shelf rockfish Other shelf rockfish
STLH STEELHEAD Other nongroundfish Other nongroundfish STNA SKIPJACK TUNA Other nongroundfish Other nongroundfish STR1 NOM. STARRY ROCKFISH Other shelf rockfish Other shelf rockfish STRK STRIPETAIL ROCKFISH Other shelf rockfish Other shelf rockfish STRY STARRY FLOUNDER Starry flounder Starry flounder
SUSF SOU. UNSP. SHELF ROCKFISH
Other shelf rockfish Other shelf rockfish
SUSP SOU. UNSP. SLOPE ROCKFISH
Other slope rockfish Other slope rockfish
SUSR SOU. UNSP. NEAR-SHORE ROCKFISH
Southern nearshore rockfish
Deeper nearshore rockfish (>10 fm) yes
SUSR SOU. UNSP. NEAR-SHORE ROCKFISH
Southern nearshore rockfish
Shallow nearshore rockfish (<10 fm) yes
SWRD SWORDFISH Other nongroundfish Other nongroundfish
SWS1 NOM. SWORDSPINE ROCKFISH
Other shelf rockfish Other shelf rockfish
SWSP SWORDSPINE ROCKFISH Other shelf rockfish Other shelf rockfish TCOD PACIFIC TOMCOD Other nongroundfish Other nongroundfish TGR1 NOM. TIGER ROCKFISH Other shelf rockfish Other shelf rockfish THD1 NOM. THORNYHEADS Mixed thornyheads Mixed thornyheads THDS THORNYHEADS (MIXED) Mixed thornyheads Mixed thornyheads TIGR TIGER ROCKFISH Other shelf rockfish Other shelf rockfish TRE1 NOM. TREEFISH Other nearshore rockfish Deeper nearshore rockfish yes TREE TREEFISH Other nearshore rockfish Deeper nearshore rockfish yes
TSRK COMMON THRESHER SHARK
Other nongroundfish Other nongroundfish
UABL UNSPECIFIED ABALONE Other nongroundfish Other nongroundfish UCLM UNSPECIFIED CLAM Other nongroundfish Other nongroundfish UCRB UNSPECIFIED CRAB Other nongroundfish Other nongroundfish UDAB UNSP. SANDDABS Other flatfish Other flatfish
UDF1 UNSP. DEEP-91 FLOUNDERS
Other flatfish Other flatfish
UDF2 UNSP. DEEP-95 FLOUNDERS
Other flatfish Other flatfish
UDM1 UNSP. DEMERSAL-91 Other groundfish Other groundfish
UDNR UNSP. DEEP NEAR-SHORE RF
Other nearshore rockfish Deeper nearshore rockfish yes
UDSR UNSP. DEMERSAL RKFSH Other groundfish Other groundfish
UDW1 SHORTRAKER+ROUGHEYE
Other slope rockfish Other slope rockfish
UECH UNSPECIFIED ECHINODERM
Other nongroundfish Other nongroundfish
UFL1 FLOUNDERS (NO FSOL) Other flatfish Other flatfish UFLT UNSP. FLATFISH Other flatfish Other flatfish UGLG UNSP. GREENLING Other greenling Other greenling yes UGRN UNSP. GROUNDFISH Other groundfish Other groundfish
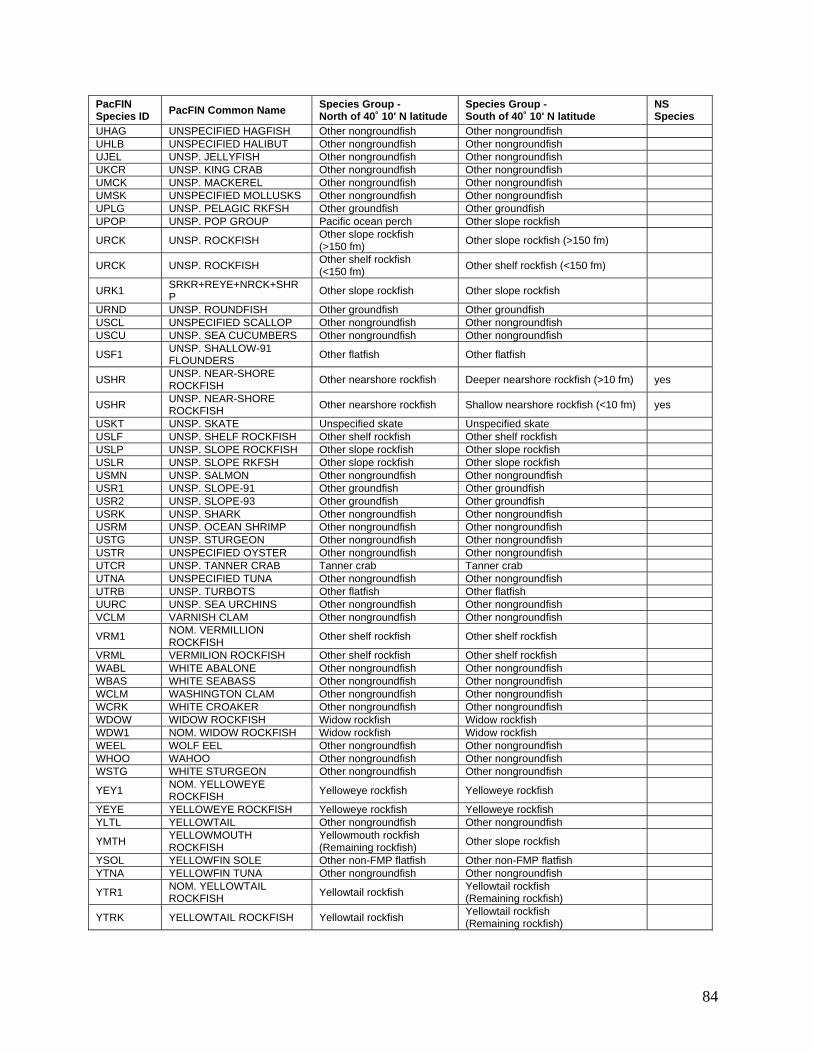
84
PacFIN Species ID
PacFIN Common Name Species Group - North of 40˚ 10' N latitude
Species Group - South of 40˚ 10' N latitude
NS Species
UHAG UNSPECIFIED HAGFISH Other nongroundfish Other nongroundfish UHLB UNSPECIFIED HALIBUT Other nongroundfish Other nongroundfish UJEL UNSP. JELLYFISH Other nongroundfish Other nongroundfish UKCR UNSP. KING CRAB Other nongroundfish Other nongroundfish UMCK UNSP. MACKEREL Other nongroundfish Other nongroundfish UMSK UNSPECIFIED MOLLUSKS Other nongroundfish Other nongroundfish UPLG UNSP. PELAGIC RKFSH Other groundfish Other groundfish UPOP UNSP. POP GROUP Pacific ocean perch Other slope rockfish
URCK UNSP. ROCKFISH Other slope rockfish (>150 fm)
Other slope rockfish (>150 fm)
URCK UNSP. ROCKFISH Other shelf rockfish (<150 fm)
Other shelf rockfish (<150 fm)
URK1 SRKR+REYE+NRCK+SHRP
Other slope rockfish Other slope rockfish
URND UNSP. ROUNDFISH Other groundfish Other groundfish USCL UNSPECIFIED SCALLOP Other nongroundfish Other nongroundfish USCU UNSP. SEA CUCUMBERS Other nongroundfish Other nongroundfish
USF1 UNSP. SHALLOW-91 FLOUNDERS
Other flatfish Other flatfish
USHR UNSP. NEAR-SHORE ROCKFISH
Other nearshore rockfish Deeper nearshore rockfish (>10 fm) yes
USHR UNSP. NEAR-SHORE ROCKFISH
Other nearshore rockfish Shallow nearshore rockfish (<10 fm) yes
USKT UNSP. SKATE Unspecified skate Unspecified skate USLF UNSP. SHELF ROCKFISH Other shelf rockfish Other shelf rockfish USLP UNSP. SLOPE ROCKFISH Other slope rockfish Other slope rockfish USLR UNSP. SLOPE RKFSH Other slope rockfish Other slope rockfish USMN UNSP. SALMON Other nongroundfish Other nongroundfish USR1 UNSP. SLOPE-91 Other groundfish Other groundfish USR2 UNSP. SLOPE-93 Other groundfish Other groundfish USRK UNSP. SHARK Other nongroundfish Other nongroundfish USRM UNSP. OCEAN SHRIMP Other nongroundfish Other nongroundfish USTG UNSP. STURGEON Other nongroundfish Other nongroundfish USTR UNSPECIFIED OYSTER Other nongroundfish Other nongroundfish UTCR UNSP. TANNER CRAB Tanner crab Tanner crab UTNA UNSPECIFIED TUNA Other nongroundfish Other nongroundfish UTRB UNSP. TURBOTS Other flatfish Other flatfish UURC UNSP. SEA URCHINS Other nongroundfish Other nongroundfish VCLM VARNISH CLAM Other nongroundfish Other nongroundfish
VRM1 NOM. VERMILLION ROCKFISH
Other shelf rockfish Other shelf rockfish
VRML VERMILION ROCKFISH Other shelf rockfish Other shelf rockfish WABL WHITE ABALONE Other nongroundfish Other nongroundfish WBAS WHITE SEABASS Other nongroundfish Other nongroundfish WCLM WASHINGTON CLAM Other nongroundfish Other nongroundfish WCRK WHITE CROAKER Other nongroundfish Other nongroundfish WDOW WIDOW ROCKFISH Widow rockfish Widow rockfish WDW1 NOM. WIDOW ROCKFISH Widow rockfish Widow rockfish WEEL WOLF EEL Other nongroundfish Other nongroundfish WHOO WAHOO Other nongroundfish Other nongroundfish WSTG WHITE STURGEON Other nongroundfish Other nongroundfish
YEY1 NOM. YELLOWEYE ROCKFISH
Yelloweye rockfish Yelloweye rockfish
YEYE YELLOWEYE ROCKFISH Yelloweye rockfish Yelloweye rockfish YLTL YELLOWTAIL Other nongroundfish Other nongroundfish
YMTH YELLOWMOUTH ROCKFISH
Yellowmouth rockfish (Remaining rockfish)
Other slope rockfish
YSOL YELLOWFIN SOLE Other non-FMP flatfish Other non-FMP flatfish YTNA YELLOWFIN TUNA Other nongroundfish Other nongroundfish
YTR1 NOM. YELLOWTAIL ROCKFISH
Yellowtail rockfish Yellowtail rockfish (Remaining rockfish)
YTRK YELLOWTAIL ROCKFISH Yellowtail rockfish Yellowtail rockfish (Remaining rockfish)
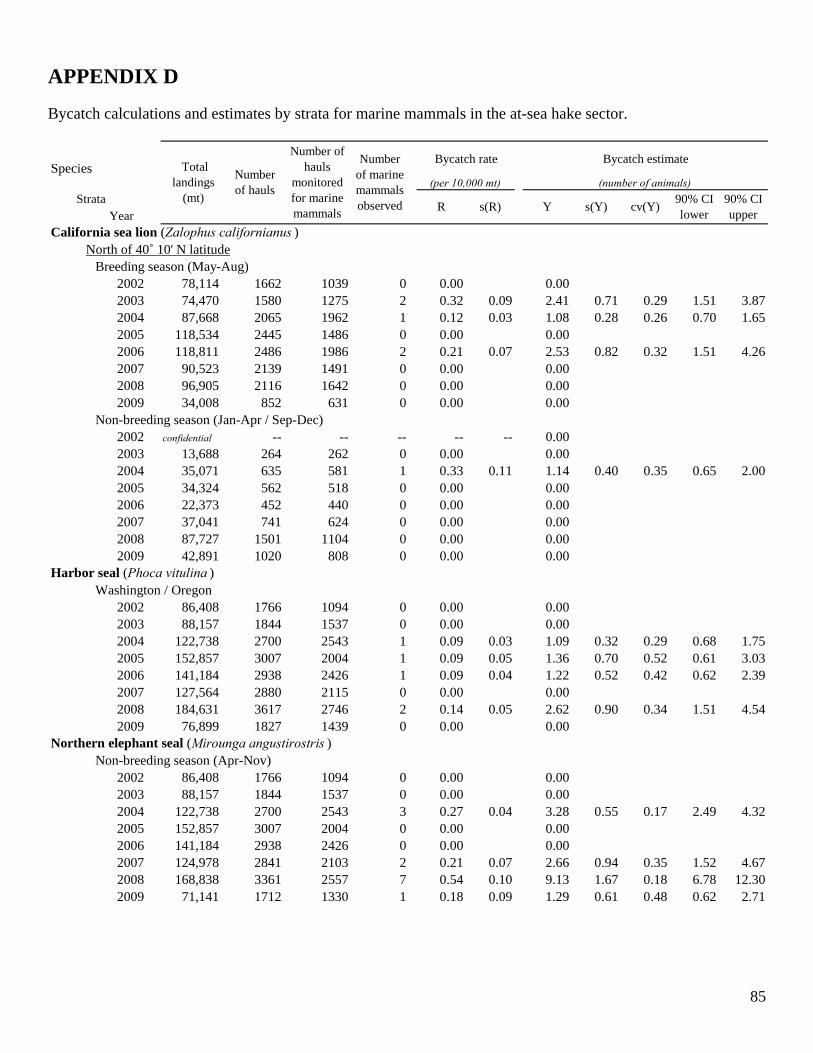
85
APPENDIX D
Bycatch calculations and estimates by strata for marine mammals in the at-sea hake sector.
Species
StrataYear
California sea lion (Zalophus californianus )North of 40˚ 10' N latitude
Breeding season (May-Aug)2002 78,114 1662 1039 0 0.00 0.00 2003 74,470 1580 1275 2 0.32 0.09 2.41 0.71 0.29 1.51 3.872004 87,668 2065 1962 1 0.12 0.03 1.08 0.28 0.26 0.70 1.652005 118,534 2445 1486 0 0.00 0.00 2006 118,811 2486 1986 2 0.21 0.07 2.53 0.82 0.32 1.51 4.262007 90,523 2139 1491 0 0.00 0.00 2008 96,905 2116 1642 0 0.00 0.00 2009 34,008 852 631 0 0.00 0.00
Non-breeding season (Jan-Apr / Sep-Dec)2002 confidential -- -- -- -- -- 0.00 2003 13,688 264 262 0 0.00 0.00 2004 35,071 635 581 1 0.33 0.11 1.14 0.40 0.35 0.65 2.002005 34,324 562 518 0 0.00 0.00 2006 22,373 452 440 0 0.00 0.00 2007 37,041 741 624 0 0.00 0.00 2008 87,727 1501 1104 0 0.00 0.00 2009 42,891 1020 808 0 0.00 0.00
Harbor seal (Phoca vitulina )Washington / Oregon
2002 86,408 1766 1094 0 0.00 0.00 2003 88,157 1844 1537 0 0.00 0.00 2004 122,738 2700 2543 1 0.09 0.03 1.09 0.32 0.29 0.68 1.752005 152,857 3007 2004 1 0.09 0.05 1.36 0.70 0.52 0.61 3.032006 141,184 2938 2426 1 0.09 0.04 1.22 0.52 0.42 0.62 2.392007 127,564 2880 2115 0 0.00 0.00 2008 184,631 3617 2746 2 0.14 0.05 2.62 0.90 0.34 1.51 4.542009 76,899 1827 1439 0 0.00 0.00
Northern elephant seal (Mirounga angustirostris )Non-breeding season (Apr-Nov)
2002 86,408 1766 1094 0 0.00 0.00 2003 88,157 1844 1537 0 0.00 0.00 2004 122,738 2700 2543 3 0.27 0.04 3.28 0.55 0.17 2.49 4.322005 152,857 3007 2004 0 0.00 0.00 2006 141,184 2938 2426 0 0.00 0.00 2007 124,978 2841 2103 2 0.21 0.07 2.66 0.94 0.35 1.52 4.672008 168,838 3361 2557 7 0.54 0.10 9.13 1.67 0.18 6.78 12.302009 71,141 1712 1330 1 0.18 0.09 1.29 0.61 0.48 0.62 2.71
cv(Y)90% CI lower
90% CI upper
R s(R) Y s(Y)
Total landings
(mt)
Number of hauls
Number of hauls
monitored for marine mammals
Number of marine mammals observed
Bycatch rate Bycatch estimate
(per 10,000 mt) (number of animals)
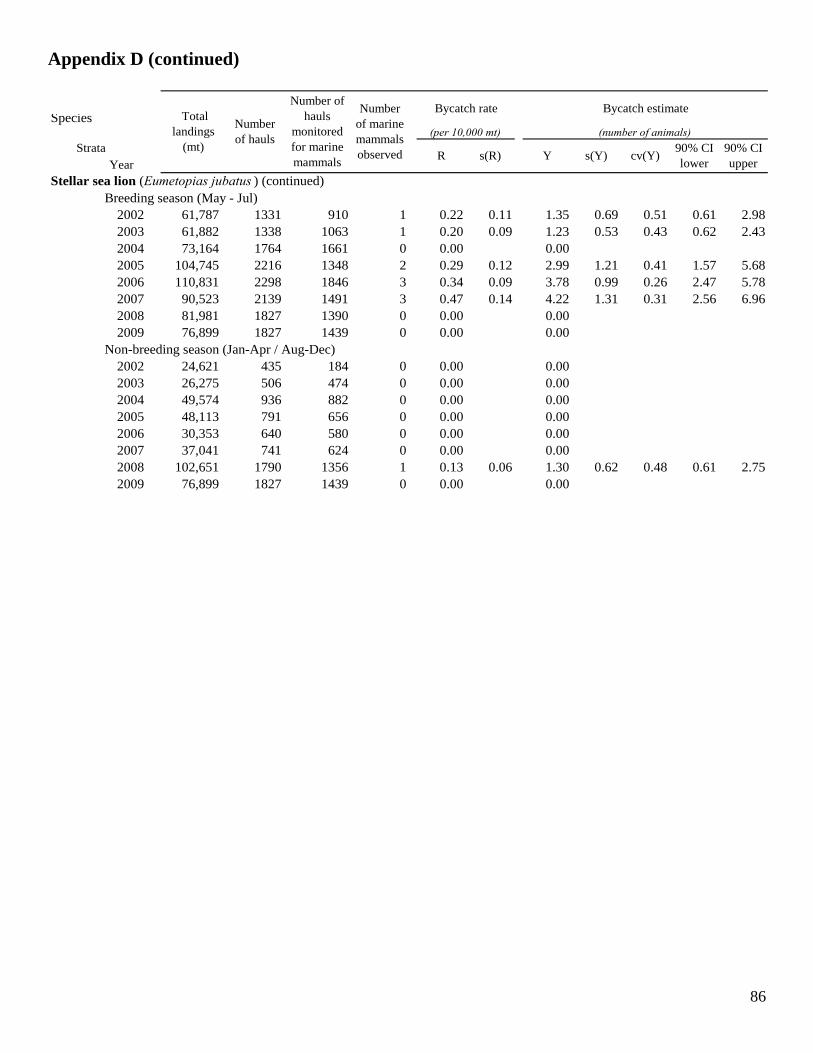
86
Appendix D (continued)
Species
StrataYear
Stellar sea lion (Eumetopias jubatus ) (continued)Breeding season (May - Jul)
2002 61,787 1331 910 1 0.22 0.11 1.35 0.69 0.51 0.61 2.982003 61,882 1338 1063 1 0.20 0.09 1.23 0.53 0.43 0.62 2.432004 73,164 1764 1661 0 0.00 0.00 2005 104,745 2216 1348 2 0.29 0.12 2.99 1.21 0.41 1.57 5.682006 110,831 2298 1846 3 0.34 0.09 3.78 0.99 0.26 2.47 5.782007 90,523 2139 1491 3 0.47 0.14 4.22 1.31 0.31 2.56 6.962008 81,981 1827 1390 0 0.00 0.002009 76,899 1827 1439 0 0.00 0.00
Non-breeding season (Jan-Apr / Aug-Dec)2002 24,621 435 184 0 0.00 0.00 2003 26,275 506 474 0 0.00 0.00 2004 49,574 936 882 0 0.00 0.00 2005 48,113 791 656 0 0.00 0.00 2006 30,353 640 580 0 0.00 0.00 2007 37,041 741 624 0 0.00 0.00 2008 102,651 1790 1356 1 0.13 0.06 1.30 0.62 0.48 0.61 2.752009 76,899 1827 1439 0 0.00 0.00
s(Y)
(per 10,000 mt) (number of animals)
cv(Y)90% CI lower
90% CI upper
R
Total landings
(mt)
Number of hauls
Number of hauls
monitored for marine mammals
Number of marine mammals observed s(R) Y
Bycatch rate Bycatch estimate
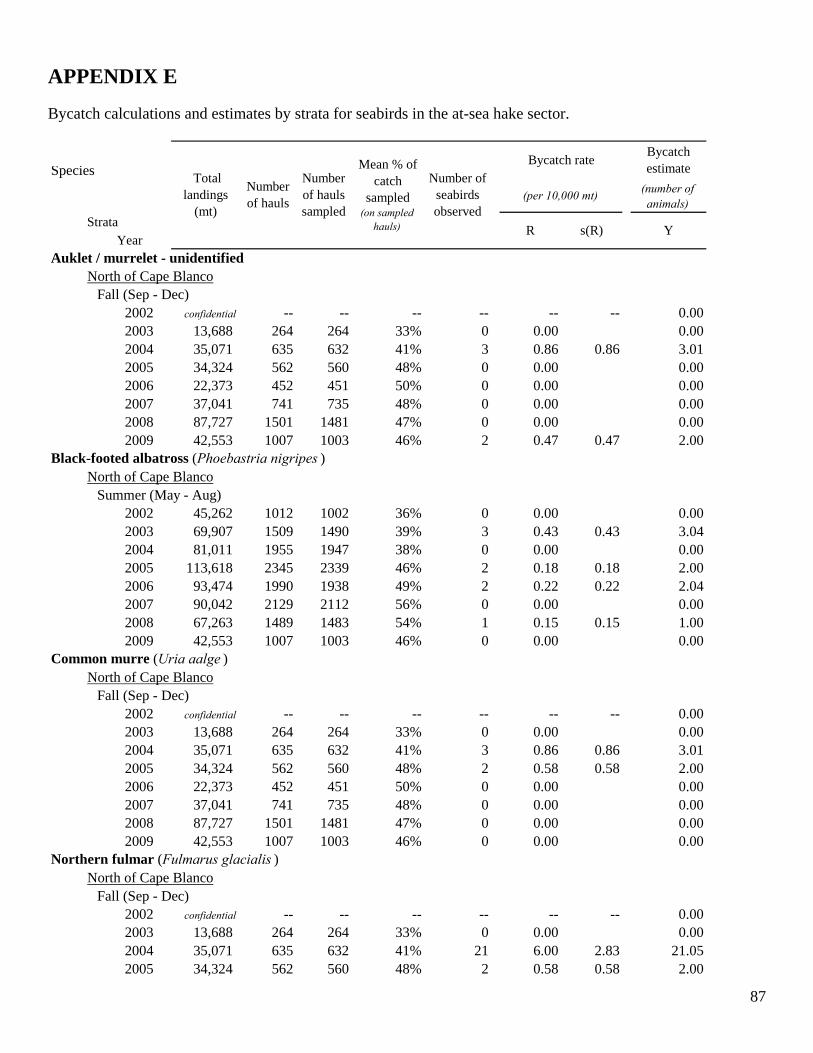
87
APPENDIX E
Bycatch calculations and estimates by strata for seabirds in the at-sea hake sector.
Species(number of animals)
Strata
YearAuklet / murrelet - unidentified
North of Cape BlancoFall (Sep - Dec)
2002 confidential -- -- -- -- -- -- 0.002003 13,688 264 264 33% 0 0.00 0.002004 35,071 635 632 41% 3 0.86 0.86 3.012005 34,324 562 560 48% 0 0.00 0.002006 22,373 452 451 50% 0 0.00 0.002007 37,041 741 735 48% 0 0.00 0.002008 87,727 1501 1481 47% 0 0.00 0.002009 42,553 1007 1003 46% 2 0.47 0.47 2.00
Black-footed albatross (Phoebastria nigripes )North of Cape Blanco
Summer (May - Aug)2002 45,262 1012 1002 36% 0 0.00 0.002003 69,907 1509 1490 39% 3 0.43 0.43 3.042004 81,011 1955 1947 38% 0 0.00 0.002005 113,618 2345 2339 46% 2 0.18 0.18 2.002006 93,474 1990 1938 49% 2 0.22 0.22 2.042007 90,042 2129 2112 56% 0 0.00 0.002008 67,263 1489 1483 54% 1 0.15 0.15 1.002009 42,553 1007 1003 46% 0 0.00 0.00
Common murre (Uria aalge )North of Cape Blanco
Fall (Sep - Dec)2002 confidential -- -- -- -- -- -- 0.002003 13,688 264 264 33% 0 0.00 0.002004 35,071 635 632 41% 3 0.86 0.86 3.012005 34,324 562 560 48% 2 0.58 0.58 2.002006 22,373 452 451 50% 0 0.00 0.002007 37,041 741 735 48% 0 0.00 0.002008 87,727 1501 1481 47% 0 0.00 0.002009 42,553 1007 1003 46% 0 0.00 0.00
Northern fulmar (Fulmarus glacialis )North of Cape Blanco
Fall (Sep - Dec)2002 confidential -- -- -- -- -- -- 0.002003 13,688 264 264 33% 0 0.00 0.002004 35,071 635 632 41% 21 6.00 2.83 21.052005 34,324 562 560 48% 2 0.58 0.58 2.00
Bycatch estimate
(per 10,000 mt)
R s(R) Y
Number of seabirds observed
Bycatch rate Total
landings (mt)
Number of hauls
Number of hauls sampled
Mean % of catch
sampled (on sampled
hauls)
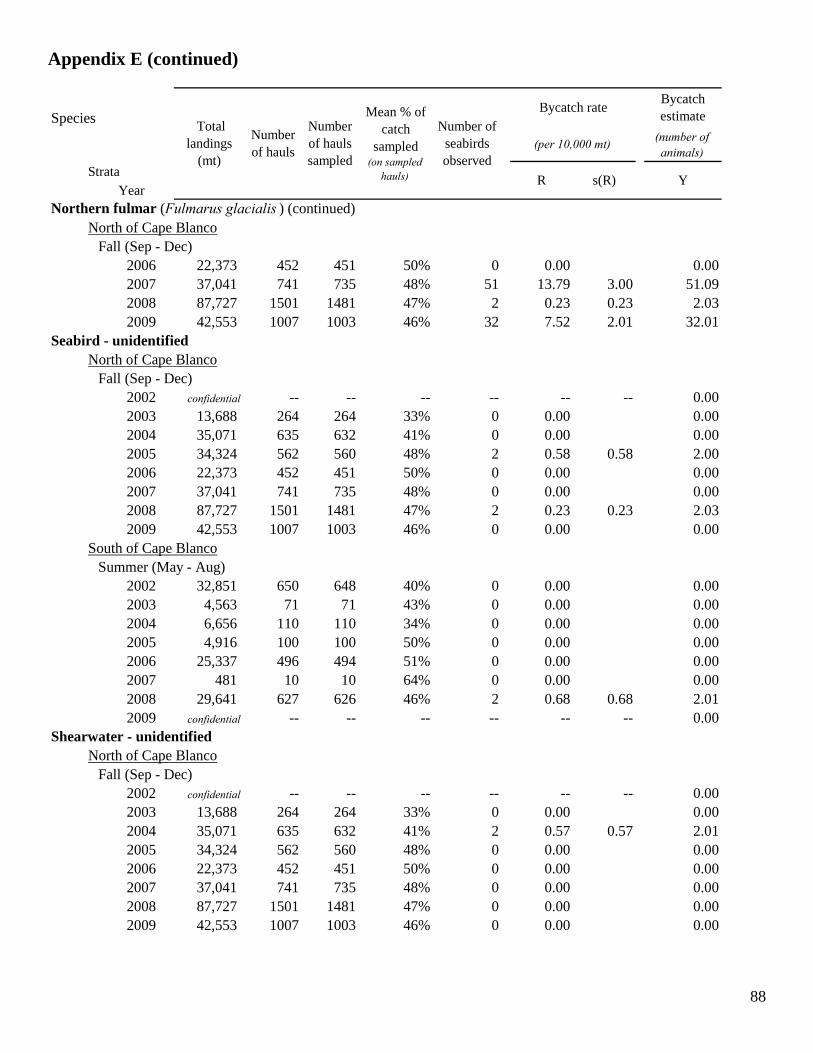
88
Appendix E (continued)
Species(number of animals)
StrataYear
Northern fulmar (Fulmarus glacialis ) (continued)North of Cape Blanco
Fall (Sep - Dec)2006 22,373 452 451 50% 0 0.00 0.002007 37,041 741 735 48% 51 13.79 3.00 51.092008 87,727 1501 1481 47% 2 0.23 0.23 2.032009 42,553 1007 1003 46% 32 7.52 2.01 32.01
Seabird - unidentifiedNorth of Cape Blanco
Fall (Sep - Dec)2002 confidential -- -- -- -- -- -- 0.002003 13,688 264 264 33% 0 0.00 0.002004 35,071 635 632 41% 0 0.00 0.002005 34,324 562 560 48% 2 0.58 0.58 2.002006 22,373 452 451 50% 0 0.00 0.002007 37,041 741 735 48% 0 0.00 0.002008 87,727 1501 1481 47% 2 0.23 0.23 2.032009 42,553 1007 1003 46% 0 0.00 0.00
South of Cape BlancoSummer (May - Aug)
2002 32,851 650 648 40% 0 0.00 0.002003 4,563 71 71 43% 0 0.00 0.002004 6,656 110 110 34% 0 0.00 0.002005 4,916 100 100 50% 0 0.00 0.002006 25,337 496 494 51% 0 0.00 0.002007 481 10 10 64% 0 0.00 0.002008 29,641 627 626 46% 2 0.68 0.68 2.012009 confidential -- -- -- -- -- -- 0.00
Shearwater - unidentifiedNorth of Cape Blanco
Fall (Sep - Dec)2002 confidential -- -- -- -- -- -- 0.002003 13,688 264 264 33% 0 0.00 0.002004 35,071 635 632 41% 2 0.57 0.57 2.012005 34,324 562 560 48% 0 0.00 0.002006 22,373 452 451 50% 0 0.00 0.002007 37,041 741 735 48% 0 0.00 0.002008 87,727 1501 1481 47% 0 0.00 0.002009 42,553 1007 1003 46% 0 0.00 0.00
(per 10,000 mt)
R s(R)
Total landings
(mt)
Number of hauls
Number of hauls sampled
Mean % of catch
sampled (on sampled
hauls)
Bycatch estimate
Number of seabirds observed
Bycatch rate
Y

89
Appendix E (continued)
Species(number of animals)
StrataYear
Shearwater - unidentified (continued)North of Cape Blanco
Summer (May - Aug)2002 45,262 1012 1002 36% 0 0.00 0.002003 69,907 1509 1490 39% 0 0.00 0.002004 81,011 1955 1947 38% 6 0.74 0.52 6.012005 113,618 2345 2339 46% 0 0.00 0.002006 93,474 1990 1938 49% 0 0.00 0.002007 90,042 2129 2112 56% 0 0.00 0.002008 67,263 1489 1483 54% 0 0.00 0.002009 42,553 1007 1003 46% 0 0.00 0.00
Sooty shearwater (Puffinus griseus )North of Cape Blanco
Summer (May - Aug)2002 45,262 1012 1002 36% 0 0.00 0.002003 69,907 1509 1490 39% 0 0.00 0.002004 81,011 1955 1947 38% 0 0.00 0.002005 113,618 2345 2339 46% 2 0.18 0.18 2.002006 93,474 1990 1938 49% 0 0.00 0.002007 90,042 2129 2112 56% 0 0.00 0.002008 67,263 1489 1483 54% 0 0.00 0.002009 42,553 1007 1003 46% 0 0.00 0.00
Tubenoses - unidentifiedNorth of Cape Blanco
Fall (Sep - Dec)2002 confidential -- -- -- -- -- -- 0.002003 13,688 264 264 33% 0 0.00 0.002004 35,071 635 632 41% 0 0.00 0.002005 34,324 562 560 48% 0 0.00 0.002006 22,373 452 451 50% 0 0.00 0.002007 37,041 741 735 48% 0 0.00 0.002008 87,727 1501 1481 47% 2 0.23 0.23 2.032009 42,553 1007 1003 46% 6 1.41 1.05 6.00
Bycatch estimate
(per 10,000 mt)
R s(R) Y
Number of seabirds observed
Bycatch rate Total
landings (mt)
Number of hauls
Number of hauls sampled
Mean % of catch
sampled (on sampled
hauls)
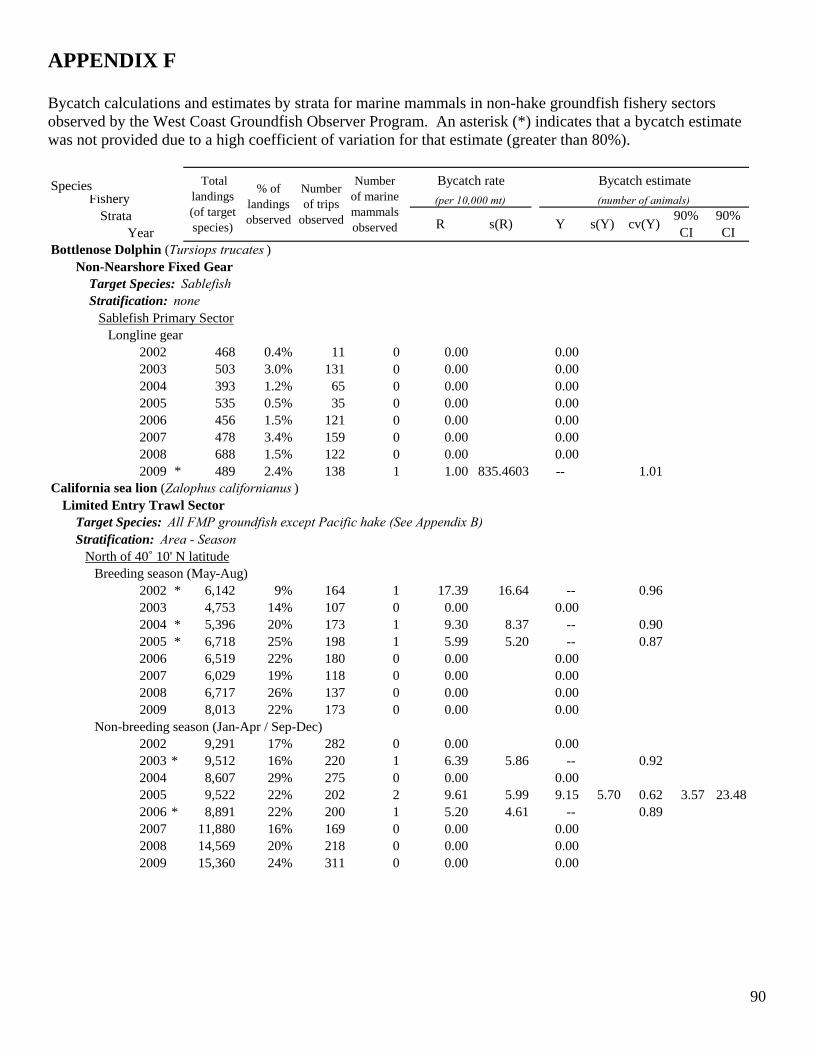
90
APPENDIX F Bycatch calculations and estimates by strata for marine mammals in non-hake groundfish fishery sectors observed by the West Coast Groundfish Observer Program. An asterisk (*) indicates that a bycatch estimate was not provided due to a high coefficient of variation for that estimate (greater than 80%).
SpeciesFishery
StrataYear
Bottlenose Dolphin (Tursiops trucates )Non-Nearshore Fixed Gear
Target Species: SablefishStratification: none
Sablefish Primary SectorLongline gear
2002 468 0.4% 11 0 0.00 0.002003 503 3.0% 131 0 0.00 0.002004 393 1.2% 65 0 0.00 0.002005 535 0.5% 35 0 0.00 0.002006 456 1.5% 121 0 0.00 0.002007 478 3.4% 159 0 0.00 0.002008 688 1.5% 122 0 0.00 0.002009 * 489 2.4% 138 1 1.00 835.4603 -- 1.01
California sea lion (Zalophus californianus )Limited Entry Trawl Sector
Target Species: All FMP groundfish except Pacific hake (See Appendix B)
North of 40˚ 10' N latitudeBreeding season (May-Aug)
2002 * 6,142 9% 164 1 17.39 16.64 -- 0.962003 4,753 14% 107 0 0.00 0.00 2004 * 5,396 20% 173 1 9.30 8.37 -- 0.902005 * 6,718 25% 198 1 5.99 5.20 -- 0.872006 6,519 22% 180 0 0.00 0.00 2007 6,029 19% 118 0 0.00 0.00 2008 6,717 26% 137 0 0.00 0.00 2009 8,013 22% 173 0 0.00 0.00
Non-breeding season (Jan-Apr / Sep-Dec)2002 9,291 17% 282 0 0.00 0.00 2003 * 9,512 16% 220 1 6.39 5.86 -- 0.922004 8,607 29% 275 0 0.00 0.00 2005 9,522 22% 202 2 9.61 5.99 9.15 5.70 0.62 3.57 23.482006 * 8,891 22% 200 1 5.20 4.61 -- 0.892007 11,880 16% 169 0 0.00 0.00 2008 14,569 20% 218 0 0.00 0.00 2009 15,360 24% 311 0 0.00 0.00
Stratification: Area - Season
R s(R) Y
Total landings(of target species)
% of landings observed
Number of trips
observed
Number of marine mammals observed
Bycatch rate Bycatch estimate
(per 10,000 mt) (number of animals)
cv(Y)90% CI
90% CI
s(Y)
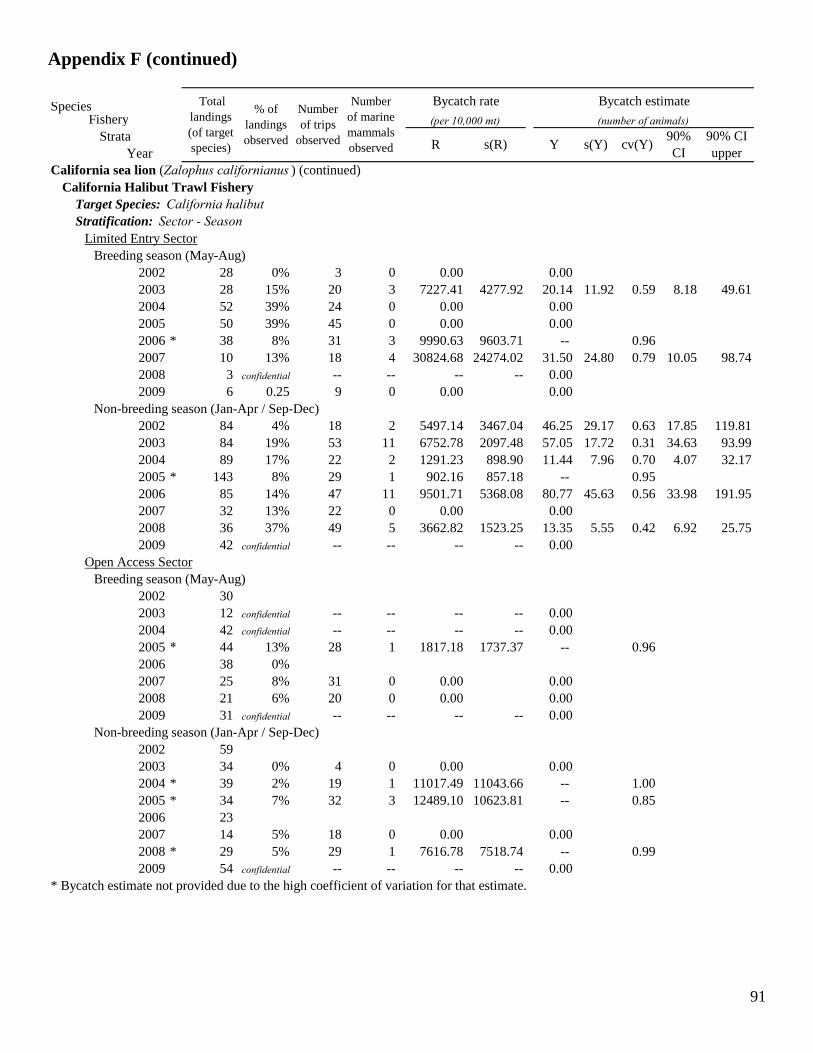
91
Appendix F (continued)
SpeciesFishery
StrataYear
California sea lion (Zalophus californianus ) (continued)California Halibut Trawl Fishery
Target Species: California halibutStratification: Sector - Season
Limited Entry SectorBreeding season (May-Aug)
2002 28 0% 3 0 0.00 0.00 2003 28 15% 20 3 7227.41 4277.92 20.14 11.92 0.59 8.18 49.612004 52 39% 24 0 0.00 0.00 2005 50 39% 45 0 0.00 0.00 2006 * 38 8% 31 3 9990.63 9603.71 -- 0.962007 10 13% 18 4 30824.68 24274.02 31.50 24.80 0.79 10.05 98.742008 3 confidential -- -- -- -- 0.00 2009 6 0.25 9 0 0.00 0.00
Non-breeding season (Jan-Apr / Sep-Dec)2002 84 4% 18 2 5497.14 3467.04 46.25 29.17 0.63 17.85 119.812003 84 19% 53 11 6752.78 2097.48 57.05 17.72 0.31 34.63 93.992004 89 17% 22 2 1291.23 898.90 11.44 7.96 0.70 4.07 32.172005 * 143 8% 29 1 902.16 857.18 -- 0.952006 85 14% 47 11 9501.71 5368.08 80.77 45.63 0.56 33.98 191.952007 32 13% 22 0 0.00 0.00 2008 36 37% 49 5 3662.82 1523.25 13.35 5.55 0.42 6.92 25.752009 42 confidential -- -- -- -- 0.00
Open Access SectorBreeding season (May-Aug)
2002 30 2003 12 confidential -- -- -- -- 0.00 2004 42 confidential -- -- -- -- 0.00 2005 * 44 13% 28 1 1817.18 1737.37 -- 0.962006 38 0% 2007 25 8% 31 0 0.00 0.00 2008 21 6% 20 0 0.00 0.00 2009 31 confidential -- -- -- -- 0.00
Non-breeding season (Jan-Apr / Sep-Dec)2002 59 2003 34 0% 4 0 0.00 0.00 2004 * 39 2% 19 1 11017.49 11043.66 -- 1.002005 * 34 7% 32 3 12489.10 10623.81 -- 0.852006 23 2007 14 5% 18 0 0.00 0.00 2008 * 29 5% 29 1 7616.78 7518.74 -- 0.992009 54 confidential -- -- -- -- 0.00
* Bycatch estimate not provided due to the high coefficient of variation for that estimate.
s(R) Y cv(Y)90% CI
90% CI upper
s(Y)
Total landings(of target species)
% of landings observed
Number of trips
observed
Number of marine mammals observed
Bycatch rate Bycatch estimate
(per 10,000 mt) (number of animals)
R
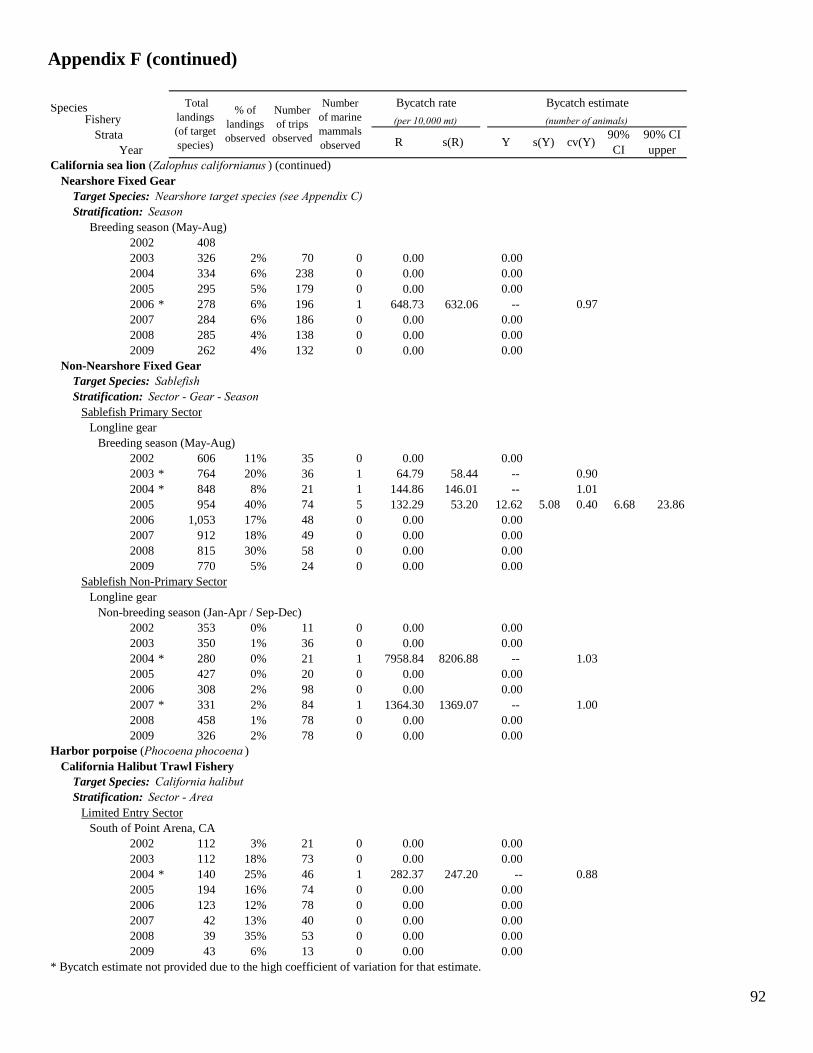
92
Appendix F (continued) Species
FisheryStrata
YearCalifornia sea lion (Zalophus californianus ) (continued)
Nearshore Fixed GearTarget Species: Nearshore target species (see Appendix C)Stratification: Season
Breeding season (May-Aug)2002 408 2003 326 2% 70 0 0.00 0.00 2004 334 6% 238 0 0.00 0.00 2005 295 5% 179 0 0.00 0.00 2006 * 278 6% 196 1 648.73 632.06 -- 0.972007 284 6% 186 0 0.00 0.00 2008 285 4% 138 0 0.00 0.00 2009 262 4% 132 0 0.00 0.00
Non-Nearshore Fixed GearTarget Species: SablefishStratification: Sector - Gear - Season
Sablefish Primary SectorLongline gear
Breeding season (May-Aug)2002 606 11% 35 0 0.00 0.00 2003 * 764 20% 36 1 64.79 58.44 -- 0.902004 * 848 8% 21 1 144.86 146.01 -- 1.012005 954 40% 74 5 132.29 53.20 12.62 5.08 0.40 6.68 23.862006 1,053 17% 48 0 0.00 0.00 2007 912 18% 49 0 0.00 0.00 2008 815 30% 58 0 0.00 0.00 2009 770 5% 24 0 0.00 0.00
Sablefish Non-Primary SectorLongline gear
Non-breeding season (Jan-Apr / Sep-Dec)2002 353 0% 11 0 0.00 0.00 2003 350 1% 36 0 0.00 0.00 2004 * 280 0% 21 1 7958.84 8206.88 -- 1.032005 427 0% 20 0 0.00 0.00 2006 308 2% 98 0 0.00 0.00 2007 * 331 2% 84 1 1364.30 1369.07 -- 1.002008 458 1% 78 0 0.00 0.00 2009 326 2% 78 0 0.00 0.00
Harbor porpoise (Phocoena phocoena )California Halibut Trawl Fishery
Target Species: California halibutStratification: Sector - Area
Limited Entry SectorSouth of Point Arena, CA
2002 112 3% 21 0 0.00 0.00 2003 112 18% 73 0 0.00 0.00 2004 * 140 25% 46 1 282.37 247.20 -- 0.882005 194 16% 74 0 0.00 0.00 2006 123 12% 78 0 0.00 0.00 2007 42 13% 40 0 0.00 0.00 2008 39 35% 53 0 0.00 0.00 2009 43 6% 13 0 0.00 0.00
* Bycatch estimate not provided due to the high coefficient of variation for that estimate.
cv(Y)
Bycatch estimate Total landings(of target species)
% of landings observed
Number of trips
observed
Number of marine mammals observed
90% CI
90% CI upper
(number of animals)
Y s(Y)
Bycatch rate
R s(R)
(per 10,000 mt)

93
Appendix F (continued) Species
FisheryStrata
YearHarbor seal (Phoca vitulina )
California Halibut Trawl FisheryTarget Species: California halibutStratification: Sector - Area
Limited Entry SectorCalifornia
2002 112 3% 21 0 0.00 0.00 2003 112 18% 73 0 0.00 0.00 2004 140 25% 46 0 0.00 0.00 2005 194 16% 74 0 0.00 0.00 2006 * 123 12% 78 1 685.89 638.02 -- 0.932007 42 13% 40 0 0.00 0.00 2008 39 35% 53 0 0.00 0.00 2009 43 6% 13 0 0.00 0.00
Nearshore Fixed GearTarget Species: Nearshore target species (see Appendix C)Stratification: Area
Washington / Oregon2002 307 0% 2003 242 0% 2004 225 5% 113 0 0.00 0.00 2005 228 5% 138 0 0.00 0.00 2006 * 180 11% 249 1 498.60 470.78 -- 0.942007 188 9% 165 0 0.00 0.00 2008 196 7% 153 2 1372.09 938.27 26.86 18.37 0.68 9.70 74.392009 484 4% 239 0 0.00 0.00
Northern elephant seal (Mirounga angustirostris )Limited Entry Trawl Fishery
Target Species: California halibutStratification: Sector - Season
Limited Entry SectorBreeding season (May-July)
2002 14,236 13% 432 0 0.00 0.00 2003 13,705 16% 378 0 0.00 0.00 2004 12,909 24% 465 0 0.00 0.00 2005 13,469 22% 375 0 0.00 0.00 2006 13,682 21% 392 0 0.00 0.00 2007 15,256 18% 304 0 0.00 0.002008 16,347 24% 383 0 0.00 0.00 2009 * 9,035 23% 227 1 4.91 4.30 -- 0.88
California Halibut Trawl FisheryTarget Species: California halibutStratification: Sector - Season
Limited Entry SectorNon-breeding season (Apr-Nov)
2002 51 2% 10 0 0.00 0.00 2003 56 14% 46 0 0.00 0.00 2004 69 30% 30 0 0.00 0.00 2005 76 28% 54 0 0.00 0.00 2006 61 19% 65 0 0.00 0.00 2007 * 17 16% 28 1 3664.47 3524.30 -- 0.96 2008 11 23% 20 0 0.00 0.00 2009 42 confidential -- -- -- -- 0.00
* Bycatch estimate not provided due to the high coefficient of variation for that estimate.
Total landings(of target species)
% of landings observed
Number of trips
observed
Number of marine mammals observed s(Y) cv(Y)
90% CI
Bycatch estimate
(per 10,000 mt) (number of animals)
R s(R) Y90% CI upper
Bycatch rate
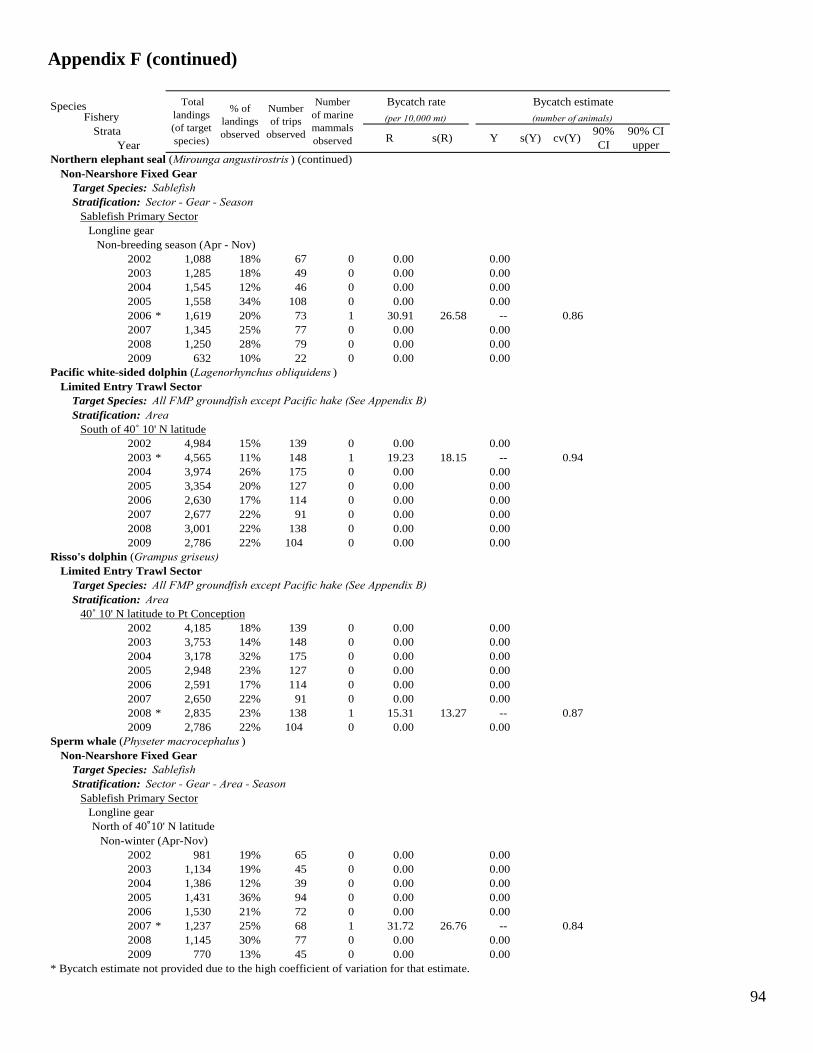
94
Appendix F (continued) Species
FisheryStrata
YearNorthern elephant seal (Mirounga angustirostris ) (continued)
Non-Nearshore Fixed Gear Target Species: SablefishStratification: Sector - Gear - Season
Sablefish Primary SectorLongline gear
Non-breeding season (Apr - Nov)2002 1,088 18% 67 0 0.00 0.002003 1,285 18% 49 0 0.00 0.002004 1,545 12% 46 0 0.00 0.002005 1,558 34% 108 0 0.00 0.002006 * 1,619 20% 73 1 30.91 26.58 -- 0.862007 1,345 25% 77 0 0.00 0.00 2008 1,250 28% 79 0 0.00 0.00 2009 632 10% 22 0 0.00 0.00
Pacific white-sided dolphin (Lagenorhynchus obliquidens )Limited Entry Trawl Sector
Target Species: All FMP groundfish except Pacific hake (See Appendix B)
South of 40˚ 10' N latitude2002 4,984 15% 139 0 0.00 0.00 2003 * 4,565 11% 148 1 19.23 18.15 -- 0.942004 3,974 26% 175 0 0.00 0.00 2005 3,354 20% 127 0 0.00 0.00 2006 2,630 17% 114 0 0.00 0.00 2007 2,677 22% 91 0 0.00 0.00 2008 3,001 22% 138 0 0.00 0.00 2009 2,786 22% 104 0 0.00 0.00
Risso's dolphin (Grampus griseus)Limited Entry Trawl Sector
Target Species: All FMP groundfish except Pacific hake (See Appendix B)
40˚ 10' N latitude to Pt Conception2002 4,185 18% 139 0 0.00 0.00 2003 3,753 14% 148 0 0.00 0.00 2004 3,178 32% 175 0 0.00 0.00 2005 2,948 23% 127 0 0.00 0.00 2006 2,591 17% 114 0 0.00 0.00 2007 2,650 22% 91 0 0.00 0.00 2008 * 2,835 23% 138 1 15.31 13.27 -- 0.872009 2,786 22% 104 0 0.00 0.00
Sperm whale (Physeter macrocephalus )Non-Nearshore Fixed Gear
Target Species: SablefishStratification: Sector - Gear - Area - Season
Sablefish Primary SectorLongline gearNorth of 40˚10' N latitude
Non-winter (Apr-Nov)2002 981 19% 65 0 0.00 0.00 2003 1,134 19% 45 0 0.00 0.00 2004 1,386 12% 39 0 0.00 0.00 2005 1,431 36% 94 0 0.00 0.00 2006 1,530 21% 72 0 0.00 0.00 2007 * 1,237 25% 68 1 31.72 26.76 -- 0.842008 1,145 30% 77 0 0.00 0.00 2009 770 13% 45 0 0.00 0.00
* Bycatch estimate not provided due to the high coefficient of variation for that estimate.
Bycatch estimate
(per 10,000 mt) (number of animals)
Y s(Y) cv(Y)90% CI
90% CI upper
Stratification: Area
Stratification: Area
Total landings(of target species)
% of landings observed
Number of trips
observed
Number of marine mammals observed
Bycatch rate
R s(R)

95
Appendix F (continued) Species
FisheryStrata
YearStellar sea lion (Eumetopias jubatus )
Limited Entry Trawl SectorTarget Species: All FMP groundfish except Pacific hake (See Appendix B)
Breeding season (May-July)2002 7,935 6% 446 0 0.00 0.002003 6,359 5% 327 0 0.00 0.002004 7,044 6% 448 0 0.00 0.002005 7,979 5% 400 0 0.00 0.002006 7,611 5% 380 0 0.00 0.002007 7,142 4% 287 0 0.00 0.002008 7,782 5% 355 0 0.00 0.002009 * 9,035 5% 184 1 6.24 5.68 -- 0.91
Non-breeding season (Jan-Apr / Aug-Dec)2002 14,280 15% 426 2 9.12 5.94 13.03 8.49 0.65 4.90 34.662003 13,936 15% 341 0 0.00 0.00 2004 12,784 28% 446 0 0.00 0.00 2005 13,922 22% 338 0 0.00 0.00 2006 12,599 21% 309 0 0.00 0.00 2007 15,326 18% 260 0 0.00 0.00 2008 18,205 20% 346 0 0.00 0.00 2009 17,124 26% 404 3 6.75 3.35 11.56 5.73 0.50 5.35 25.01
California Halibut Trawl FisheryTarget Species: California halibutStratification: Sector - Season
Limited Entry SectorNon-breeding season (Jan-Apr / Aug-Dec)
2002 95 4% 18 0 0.00 0.00 2003 96 18% 61 0 0.00 0.00 2004 113 25% 36 0 0.00 0.00 2005 158 10% 51 0 0.00 0.00 2006 102 13% 70 0 0.00 0.00 2007 * 35 12% 22 1 2426.28 2288.00 -- 0.942008 37 37% 49 1 732.56 582.30 2.68 2.13 0.79 0.85 8.472009 84 confidential -- -- -- -- 0.00
Unidentified sea lionLimited Entry Trawl Sector
Target Species: All FMP groundfish except Pacific hake (See Appendix B)
2002 * 20,418 14% 585 1 3.50 3.25 -- 0.932003 18,830 15% 475 0 0.00 0.00 2004 17,977 26% 623 0 0.00 0.00 2005 19,593 23% 527 0 0.00 0.00 2006 18,040 21% 494 0 0.00 0.00 2007 20,586 18% 378 0 0.00 0.00 2008 24,287 22% 493 0 0.00 0.00 2009 26,159 23% 588 0 0.00 0.00
Non-Nearshore Fixed GearTarget Species: SablefishStratification: Sector - Gear
Sablefish Non-Primary SectorLongline gear
2002 462 0% 11 0 0.00 0.00 2003 494 3% 131 0 0.00 0.00 2004 387 1% 65 0 0.00 0.00 2005 531 0% 35 0 0.00 0.00 2006 455 2% 121 0 0.00 0.00 2007 * 474 3% 159 1 607.22 603.63 -- 0.992008 673 2% 122 0 0.00 0.00 2009 489 2% 138 0 0.00 0.00
* Bycatch estimate not provided due to the high coefficient of variation for that estimate.
Number of marine mammals observed s(R) Y s(Y)
(per 10,000 mt) (number of animals)
cv(Y)90% CI
90% CI upper
R
Bycatch rate Bycatch estimate
Stratification: None
Stratification: Season
Total landings(of target species)
% of landings observed
Number of trips
observed

96
APPENDIX G Bycatch calculations and estimates by strata for seabirds in non-hake groundfish fishery sectors observed by the West Coast Groundfish Observer Program. Species
FisheryStrata
YearBlack footed albatross (Phoebastria nigripes )
Non-Nearshore Fixed GearTarget Species: SablefishStratification: Sector - Gear - Area - Season
Sablefish Primary SectorLongline gear
North of Cape Blanco, ORSummer (May - Aug)
2002 515 12% 28 0 0.00 0.00 2003 624 22% 30 8 583.73 306.19 36.40 19.09 0.52 16.18 81.902004 729 9% 21 5 651.86 413.19 47.53 30.13 0.63 18.27 123.632005 794 37% 52 20 665.92 307.35 52.87 24.40 0.46 25.66 108.922006 * 860 16% 41 6 436.06 414.79 -- 0.952007 * 718 20% 35 9 657.00 581.98 -- 0.892008 636 30% 45 16 822.40 366.21 52.27 23.28 0.45 25.97 105.222009 535 5% 9 0 0.00 0.00
Fall (Sep - Dec)2002 256 43% 26 0 0.00 0.00 2003 254 25% 5 0 0.00 0.00 2004 501 18% 14 0 0.00 0.00 2005 393 29% 12 2 172.93 114.04 6.80 4.49 0.66 2.53 18.282006 * 405 31% 17 4 313.32 266.49 -- 0.852007 314 49% 17 38 2450.72 1197.24 76.87 37.55 0.49 35.91 164.522008 314 29% 13 6 644.54 196.52 20.23 6.17 0.30 12.39 33.032009 336 13% 9 0 0.00 0.00
South of Cape Blanco, ORSummer (May - Aug)
2002 91 confidential -- -- -- -- 0.00 2003 140 confidential -- -- -- -- 0.00 2004 119 2005 160 48% 22 2 262.88 191.52 4.21 3.07 0.73 1.44 12.322006 193 confidential -- -- -- -- 30.76 10.51 0.34 17.81 53.132007 * 195 10% 14 1 509.66 489.43 -- 0.962008 179 27% 13 5 1028.02 548.02 18.44 9.83 0.53 8.10 41.982009 235 4% 15 0 0.00 0.00
Fall (Sep - Dec)2002 * 116 16% 6 1 551.55 603.26 -- 1.092003 189 3% 5 0 0.00 0.00 2004 157 12% 9 0 0.00 0.00 2005 143 17% 11 0 0.00 0.00 2006 137 confidential -- -- -- -- 0.00 2007 71 confidential -- -- -- -- 0.00 2008 33 2009 82 confidential -- -- -- -- 0.00
Open Access SectorHook-and-line gears
South of Cape Blanco, ORSummer (May - Aug)
2002 58 2003 103 1% 4 0 0.00 0.00 2004 56 confidential -- -- -- -- 0.00 2005 75 confidential -- -- -- -- 0.00 2006 104 confidential -- -- -- -- 0.00 2007 * 56 3% 8 1 5205.67 5274.40 -- 1.012008 113 2% 17 0 0.00 0.00 2009 160 3% 21 0 0.00 0.00
* Bycatch estimate not provided due to the high coefficient of variation for that estimate.
Bycatch estimate(per 10,000 mt) (number of animals)
cv(Y)R
Total landings(target
species)
% of landings observed
Number of trips
observed
Number of
seabirds observed
Bycatch rate
s(R) Y s(Y)90% CI lower
90% CI upper

97
APPENDIX G (continued)
SpeciesFishery
StrataYear
Brandt's cormorant (Phalacrocorax penicillatus )California Halibut Trawl Fishery
Target Species: California halibutStratification: Sector - Area - Season
Limited Entry SectorSouth of Cape Blanco, OR
Winter (Jan - Apr)2002 56 7% 18 0 0.00 0.00 2003 * 62 21% 30 1 781.03 725.73 -- 0.932004 63 25% 21 0 0.00 0.00 2005 130 7% 19 0 0.00 0.00 2006 78 12% 39 0 0.00 0.00 2007 27 11% 13 0 0.00 0.00 2008 27 41% 38 0 0.00 0.00 2009 32
Brown Pelican (Pelecanus occidentalis )Non-Nearshore Fixed Gear
Target Species: SablefishStratification: Sector - Gear - Area - Season
Sablefish Non-Primary SectorLongline gear
South of Cape Blanco, ORWinter (Jan - Apr)
2002 114 confidential -- -- -- -- 0.00 2003 148 1% 31 0 0.00 0.00 2004 123 confidential -- -- -- -- 0.00 2005 * 105 1% 6 1 13935.52 15514.11 -- 1.112006 99 1% 33 0 0.00 0.00 2007 114 2% 45 0 0.00 0.00 2008 125 1% 38 0 0.00 0.00 2009 88 4% 26 0 0.00 0.00
Common Murre (Uria aalge )Limited Entry Trawl Sector
Target Species: All FMP groundfish except Pacific hake (See Appendix B)
North of Cape Blanco, ORSummer (May - Aug)
2002 5,104 9% 122 0 0.00 0.00 2003 3,292 11% 51 0 0.00 0.00 2004 * 4,245 20% 145 1 11.72 10.55 -- 0.902005 5,590 26% 164 0 0.00 0.00 2006 5,255 23% 154 0 0.00 0.00 2007 4,596 18% 88 0 0.00 0.00 2008 5,342 25% 103 0 0.00 0.00 2009 6,235 24% 142 0 0.00 0.00
California Halibut Trawl FisheryTarget Species: California halibutStratification: Sector - Area - Season
Limited Entry SectorSouth of Cape Blanco, OR
Winter (Jan - Apr)2002 56 7% 18 0 0.00 0.00 2003 * 62 21% 30 36 28116.91 24010.58 -- 0.852004 63 25% 21 0 0.00 0.00 2005 130 7% 19 0 0.00 0.00 2006 78 12% 39 0 0.00 0.00 2007 27 11% 13 0 0.00 0.00 2008 27 41% 38 0 0.00 0.00 2009 32
* Bycatch estimate not provided due to the high coefficient of variation for that estimate.
Total landings(target
species)
% of landings observed
Number of trips
observed
Number of
seabirds observed
(per 10,000 mt)
R s(R)
Bycatch estimateBycatch rate
Stratification: Area - Season
(number of animals)
Y s(Y) cv(Y)90% CI lower
90% CI upper

98
APPENDIX G (continued)
SpeciesFishery
StrataYear
Common Murre (Uria aalge ) (continued)California Halibut Trawl Fishery
Target Species: California halibutStratification: Sector - Area - Season
Limited Entry SectorSouth of Cape Blanco, OR
Summer (May - Aug)2002 28 0% 3 0 0.00 0.00 2003 28 15% 20 0 0.00 0.00 2004 52 39% 24 5 2509.37 960.17 12.97 4.96 0.38 7.06 23.822005 50 39% 45 0 0.00 0.00 2006 38 8% 31 0 0.00 0.00 2007 10 13% 18 0 0.00 0.00 2008 3 confidential -- -- -- -- 0.00 2009 6 25% 9 0 0.00 0.00
Open Access SectorSouth of Cape Blanco, OR
Winter (Jan - Apr)2002 31 2003 * 28 0% 3 1 77626.76 73178.61 -- 0.942004 24 confidential -- -- -- -- 0.00 2005 25 7% 30 0 0.00 0.00 2006 21 2007 3 14% 11 0 0.00 0.00 2008 14 confidential -- -- -- -- 0.00 2009 27 confidential -- -- -- -- 0.00
Common Murre (Uria aalge ) (continued)Nearshore Fixed Gear
Target Species: Nearshore target species (see Appendix C)Stratification: Area - Season
North of Cape Blanco, ORFall (Sep-Dec)
2002 11 2003 10 2004 11 confidential -- -- -- -- 0.002005 29 confidential -- -- -- -- 0.002006 15 18% 28 0 0.00 0.002007 10 confidential -- -- -- -- 0.002008 8 confidential -- -- -- -- 0.002009 * 8 8% 10 1 16010.17 16441.09 -- 1.03
South of Cape Blanco, ORWinter (Jan - Apr)
2002 203 2003 97 1% 13 0 0.00 0.00 2004 * 96 7% 69 1 1506.07 1478.60 -- 0.982005 89 5% 48 0 0.00 0.00 2006 62 3% 39 0 0.00 0.00 2007 88 6% 56 0 0.00 0.00 2008 108 5% 50 0 0.00 0.00 2009 102 4% 56 0 0.00 0.00
Summer (May - Aug)2002 365 2003 283 3% 70 0 0.00 0.00 2004 300 6% 210 0 0.00 0.00 2005 250 5% 153 0 0.00 0.00 2006 * 251 5% 153 1 791.80 760.77 -- 0.962007 255 5% 127 0 0.00 0.00 2008 259 4% 111 0 0.00 0.00 2009 232 3% 96 0 0.00 0.00
* Bycatch estimate not provided due to the high coefficient of variation for that estimate.
(per 10,000 mt)
R s(R)
(number of animals)
Y s(Y)
Total landings(target
species)
Bycatch estimate
cv(Y)90% CI lower
90% CI upper
% of landings observed
Number of trips
observed
Number of
seabirds observed
Bycatch rate
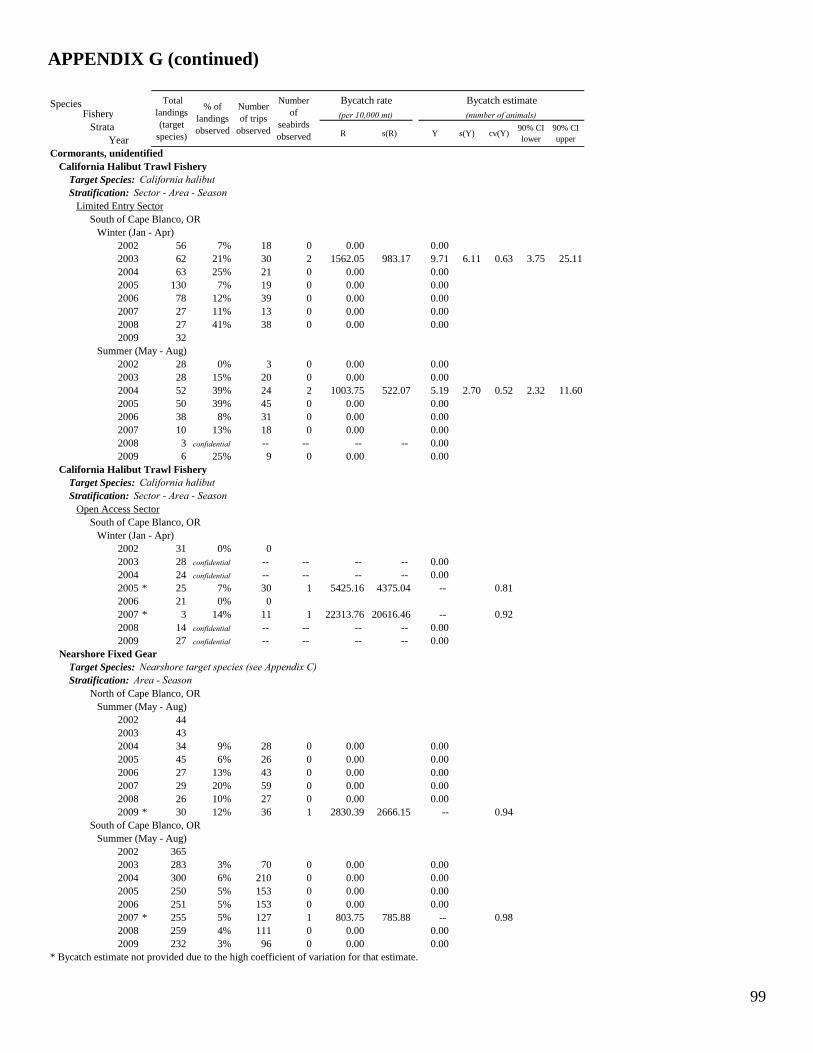
99
APPENDIX G (continued) Species
FisheryStrata
YearCormorants, unidentified
California Halibut Trawl FisheryTarget Species: California halibutStratification: Sector - Area - Season
Limited Entry SectorSouth of Cape Blanco, OR
Winter (Jan - Apr)2002 56 7% 18 0 0.00 0.00 2003 62 21% 30 2 1562.05 983.17 9.71 6.11 0.63 3.75 25.112004 63 25% 21 0 0.00 0.00 2005 130 7% 19 0 0.00 0.00 2006 78 12% 39 0 0.00 0.00 2007 27 11% 13 0 0.00 0.00 2008 27 41% 38 0 0.00 0.00 2009 32
Summer (May - Aug)2002 28 0% 3 0 0.00 0.00 2003 28 15% 20 0 0.00 0.00 2004 52 39% 24 2 1003.75 522.07 5.19 2.70 0.52 2.32 11.602005 50 39% 45 0 0.00 0.00 2006 38 8% 31 0 0.00 0.00 2007 10 13% 18 0 0.00 0.00 2008 3 confidential -- -- -- -- 0.00 2009 6 25% 9 0 0.00 0.00
California Halibut Trawl FisheryTarget Species: California halibutStratification: Sector - Area - Season
Open Access SectorSouth of Cape Blanco, OR
Winter (Jan - Apr)2002 31 0% 0 2003 28 confidential -- -- -- -- 0.00 2004 24 confidential -- -- -- -- 0.00 2005 * 25 7% 30 1 5425.16 4375.04 -- 0.812006 21 0% 0 2007 * 3 14% 11 1 22313.76 20616.46 -- 0.922008 14 confidential -- -- -- -- 0.00 2009 27 confidential -- -- -- -- 0.00
Nearshore Fixed GearTarget Species: Nearshore target species (see Appendix C)Stratification: Area - Season
North of Cape Blanco, ORSummer (May - Aug)
2002 44 2003 43 2004 34 9% 28 0 0.00 0.002005 45 6% 26 0 0.00 0.002006 27 13% 43 0 0.00 0.002007 29 20% 59 0 0.00 0.002008 26 10% 27 0 0.00 0.002009 * 30 12% 36 1 2830.39 2666.15 -- 0.94
South of Cape Blanco, ORSummer (May - Aug)
2002 365 2003 283 3% 70 0 0.00 0.00 2004 300 6% 210 0 0.00 0.00 2005 250 5% 153 0 0.00 0.00 2006 251 5% 153 0 0.00 0.00 2007 * 255 5% 127 1 803.75 785.88 -- 0.982008 259 4% 111 0 0.00 0.00 2009 232 3% 96 0 0.00 0.00
* Bycatch estimate not provided due to the high coefficient of variation for that estimate.
Total landings(target
species)
% of landings observed
(per 10,000 mt)
R s(R)
Number of trips
observed
Number of
seabirds observed
Bycatch rate
90% CI upper
Bycatch estimate(number of animals)
Y s(Y) cv(Y)90% CI lower
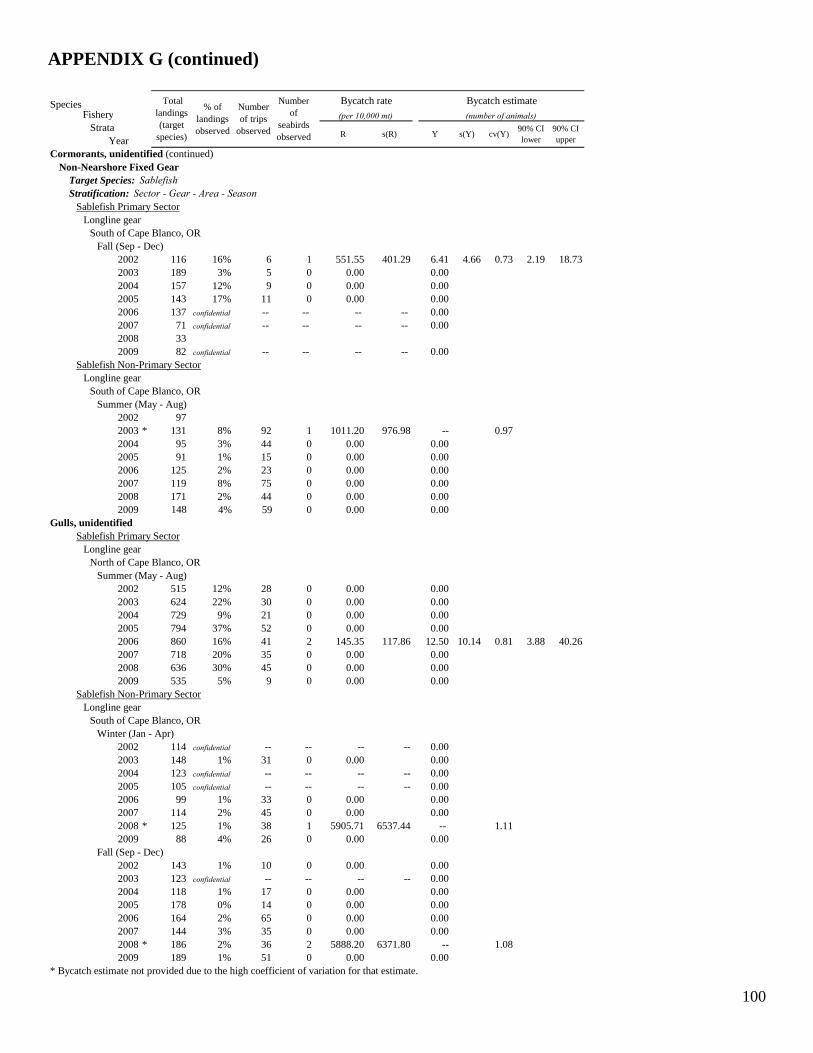
100
APPENDIX G (continued) Species
FisheryStrata
YearCormorants, unidentified (continued)
Non-Nearshore Fixed GearTarget Species: SablefishStratification: Sector - Gear - Area - Season
Sablefish Primary SectorLongline gear
South of Cape Blanco, ORFall (Sep - Dec)
2002 116 16% 6 1 551.55 401.29 6.41 4.66 0.73 2.19 18.732003 189 3% 5 0 0.00 0.00 2004 157 12% 9 0 0.00 0.00 2005 143 17% 11 0 0.00 0.00 2006 137 confidential -- -- -- -- 0.00 2007 71 confidential -- -- -- -- 0.00 2008 33 2009 82 confidential -- -- -- -- 0.00
Sablefish Non-Primary SectorLongline gear
South of Cape Blanco, ORSummer (May - Aug)
2002 97 2003 * 131 8% 92 1 1011.20 976.98 -- 0.972004 95 3% 44 0 0.00 0.00 2005 91 1% 15 0 0.00 0.00 2006 125 2% 23 0 0.00 0.00 2007 119 8% 75 0 0.00 0.00 2008 171 2% 44 0 0.00 0.00 2009 148 4% 59 0 0.00 0.00
Gulls, unidentifiedSablefish Primary Sector
Longline gearNorth of Cape Blanco, OR
Summer (May - Aug)2002 515 12% 28 0 0.00 0.00 2003 624 22% 30 0 0.00 0.00 2004 729 9% 21 0 0.00 0.00 2005 794 37% 52 0 0.00 0.00 2006 860 16% 41 2 145.35 117.86 12.50 10.14 0.81 3.88 40.262007 718 20% 35 0 0.00 0.00 2008 636 30% 45 0 0.00 0.00 2009 535 5% 9 0 0.00 0.00
Sablefish Non-Primary SectorLongline gear
South of Cape Blanco, ORWinter (Jan - Apr)
2002 114 confidential -- -- -- -- 0.00 2003 148 1% 31 0 0.00 0.00 2004 123 confidential -- -- -- -- 0.00 2005 105 confidential -- -- -- -- 0.00 2006 99 1% 33 0 0.00 0.00 2007 114 2% 45 0 0.00 0.00 2008 * 125 1% 38 1 5905.71 6537.44 -- 1.112009 88 4% 26 0 0.00 0.00
Fall (Sep - Dec)2002 143 1% 10 0 0.00 0.00 2003 123 confidential -- -- -- -- 0.00 2004 118 1% 17 0 0.00 0.00 2005 178 0% 14 0 0.00 0.00 2006 164 2% 65 0 0.00 0.00 2007 144 3% 35 0 0.00 0.00 2008 * 186 2% 36 2 5888.20 6371.80 -- 1.082009 189 1% 51 0 0.00 0.00
* Bycatch estimate not provided due to the high coefficient of variation for that estimate.
Bycatch rate Bycatch estimate
(per 10,000 mt) (number of animals)
R s(R) Y s(Y) cv(Y)90% CI lower
90% CI upper
% of landings observed
Number of trips
observed
Number of
seabirds observed
Total landings(target
species)
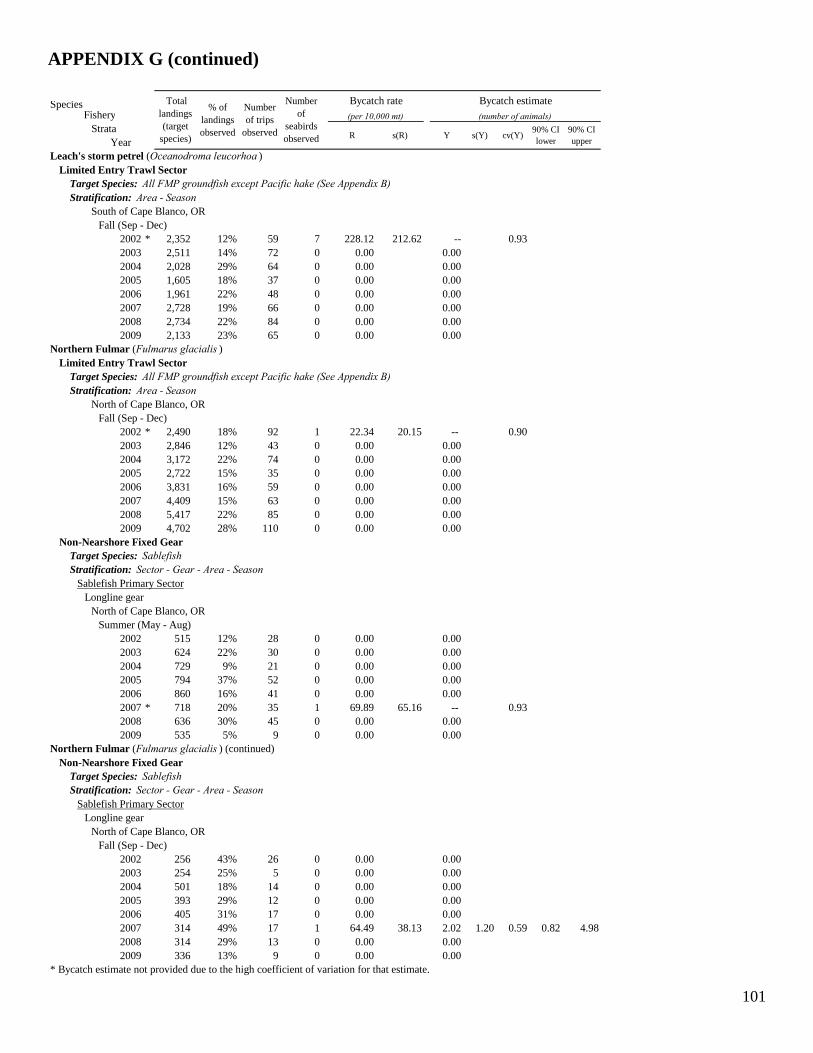
101
APPENDIX G (continued) Species
FisheryStrata
YearLeach's storm petrel (Oceanodroma leucorhoa )
Limited Entry Trawl SectorTarget Species: All FMP groundfish except Pacific hake (See Appendix B)
South of Cape Blanco, ORFall (Sep - Dec)
2002 * 2,352 12% 59 7 228.12 212.62 -- 0.932003 2,511 14% 72 0 0.00 0.00 2004 2,028 29% 64 0 0.00 0.00 2005 1,605 18% 37 0 0.00 0.00 2006 1,961 22% 48 0 0.00 0.00 2007 2,728 19% 66 0 0.00 0.00 2008 2,734 22% 84 0 0.00 0.00 2009 2,133 23% 65 0 0.00 0.00
Northern Fulmar (Fulmarus glacialis )Limited Entry Trawl Sector
Target Species: All FMP groundfish except Pacific hake (See Appendix B)
North of Cape Blanco, ORFall (Sep - Dec)
2002 * 2,490 18% 92 1 22.34 20.15 -- 0.902003 2,846 12% 43 0 0.00 0.00 2004 3,172 22% 74 0 0.00 0.00 2005 2,722 15% 35 0 0.00 0.00 2006 3,831 16% 59 0 0.00 0.00 2007 4,409 15% 63 0 0.00 0.00 2008 5,417 22% 85 0 0.00 0.00 2009 4,702 28% 110 0 0.00 0.00
Non-Nearshore Fixed GearTarget Species: SablefishStratification: Sector - Gear - Area - Season
Sablefish Primary SectorLongline gear
North of Cape Blanco, ORSummer (May - Aug)
2002 515 12% 28 0 0.00 0.00 2003 624 22% 30 0 0.00 0.00 2004 729 9% 21 0 0.00 0.00 2005 794 37% 52 0 0.00 0.00 2006 860 16% 41 0 0.00 0.00 2007 * 718 20% 35 1 69.89 65.16 -- 0.932008 636 30% 45 0 0.00 0.00 2009 535 5% 9 0 0.00 0.00
Northern Fulmar (Fulmarus glacialis ) (continued)Non-Nearshore Fixed Gear
Target Species: SablefishStratification: Sector - Gear - Area - Season
Sablefish Primary SectorLongline gear
North of Cape Blanco, ORFall (Sep - Dec)
2002 256 43% 26 0 0.00 0.00 2003 254 25% 5 0 0.00 0.00 2004 501 18% 14 0 0.00 0.00 2005 393 29% 12 0 0.00 0.00 2006 405 31% 17 0 0.00 0.00 2007 314 49% 17 1 64.49 38.13 2.02 1.20 0.59 0.82 4.982008 314 29% 13 0 0.00 0.00 2009 336 13% 9 0 0.00 0.00
* Bycatch estimate not provided due to the high coefficient of variation for that estimate.
Stratification: Area - Season
Total landings(target
species)
% of landings observed
Number of trips
observed
Bycatch rate
Stratification: Area - Season
Number of
seabirds observed s(Y)
(per 10,000 mt) (number of animals)
R s(R) Y cv(Y)90% CI lower
90% CI upper
Bycatch estimate
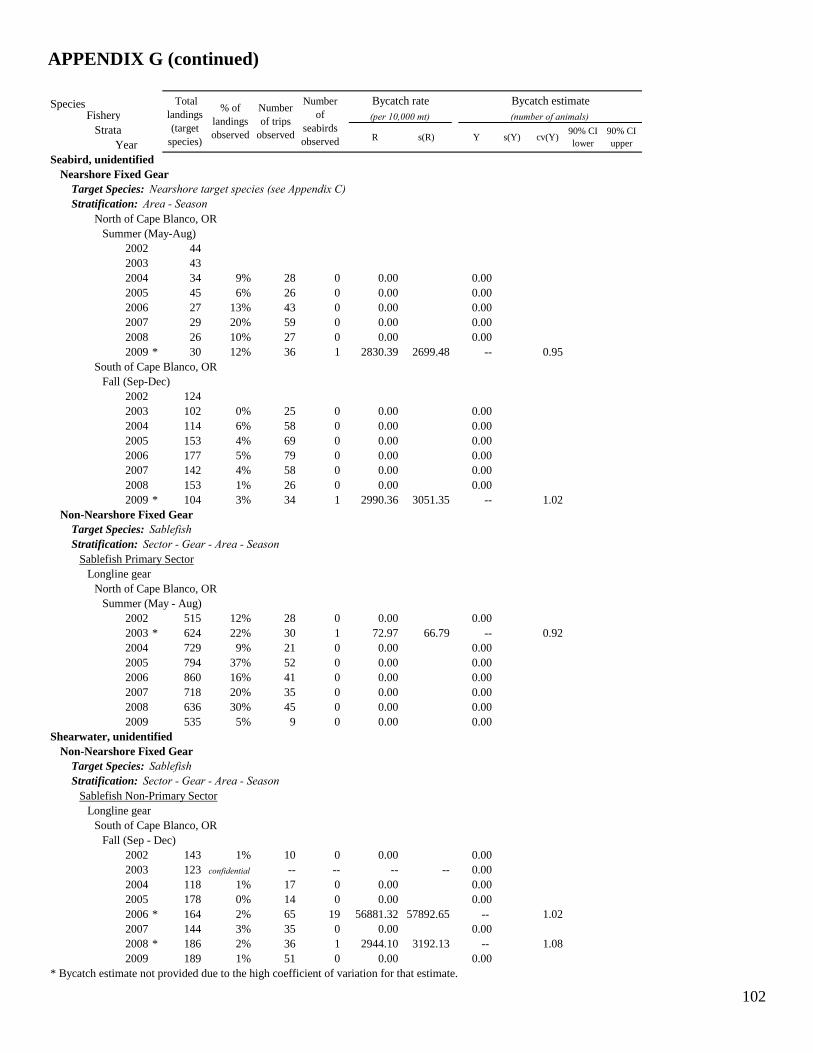
102
APPENDIX G (continued) Species
FisheryStrata
YearSeabird, unidentified
Nearshore Fixed GearTarget Species: Nearshore target species (see Appendix C)Stratification: Area - Season
North of Cape Blanco, ORSummer (May-Aug)
2002 44 2003 43 2004 34 9% 28 0 0.00 0.002005 45 6% 26 0 0.00 0.00 2006 27 13% 43 0 0.00 0.00 2007 29 20% 59 0 0.00 0.00 2008 26 10% 27 0 0.00 0.00 2009 * 30 12% 36 1 2830.39 2699.48 -- 0.95
South of Cape Blanco, ORFall (Sep-Dec)
2002 124 2003 102 0% 25 0 0.00 0.00 2004 114 6% 58 0 0.00 0.00 2005 153 4% 69 0 0.00 0.00 2006 177 5% 79 0 0.00 0.002007 142 4% 58 0 0.00 0.00 2008 153 1% 26 0 0.00 0.00 2009 * 104 3% 34 1 2990.36 3051.35 -- 1.02
Non-Nearshore Fixed GearTarget Species: SablefishStratification: Sector - Gear - Area - Season
Sablefish Primary SectorLongline gear
North of Cape Blanco, ORSummer (May - Aug)
2002 515 12% 28 0 0.00 0.00 2003 * 624 22% 30 1 72.97 66.79 -- 0.922004 729 9% 21 0 0.00 0.00 2005 794 37% 52 0 0.00 0.00 2006 860 16% 41 0 0.00 0.00 2007 718 20% 35 0 0.00 0.00 2008 636 30% 45 0 0.00 0.00 2009 535 5% 9 0 0.00 0.00
Shearwater, unidentifiedNon-Nearshore Fixed Gear
Target Species: SablefishStratification: Sector - Gear - Area - Season
Sablefish Non-Primary SectorLongline gear
South of Cape Blanco, ORFall (Sep - Dec)
2002 143 1% 10 0 0.00 0.00 2003 123 confidential -- -- -- -- 0.00 2004 118 1% 17 0 0.00 0.00 2005 178 0% 14 0 0.00 0.00 2006 * 164 2% 65 19 56881.32 57892.65 -- 1.022007 144 3% 35 0 0.00 0.00 2008 * 186 2% 36 1 2944.10 3192.13 -- 1.082009 189 1% 51 0 0.00 0.00
* Bycatch estimate not provided due to the high coefficient of variation for that estimate.
Bycatch rate Total landings(target
species)
% of landings observed
Number of trips
observed
Number of
seabirds observed Y s(Y) cv(Y)
90% CI lower
90% CI upper
(per 10,000 mt) (number of animals)
R s(R)
Bycatch estimate
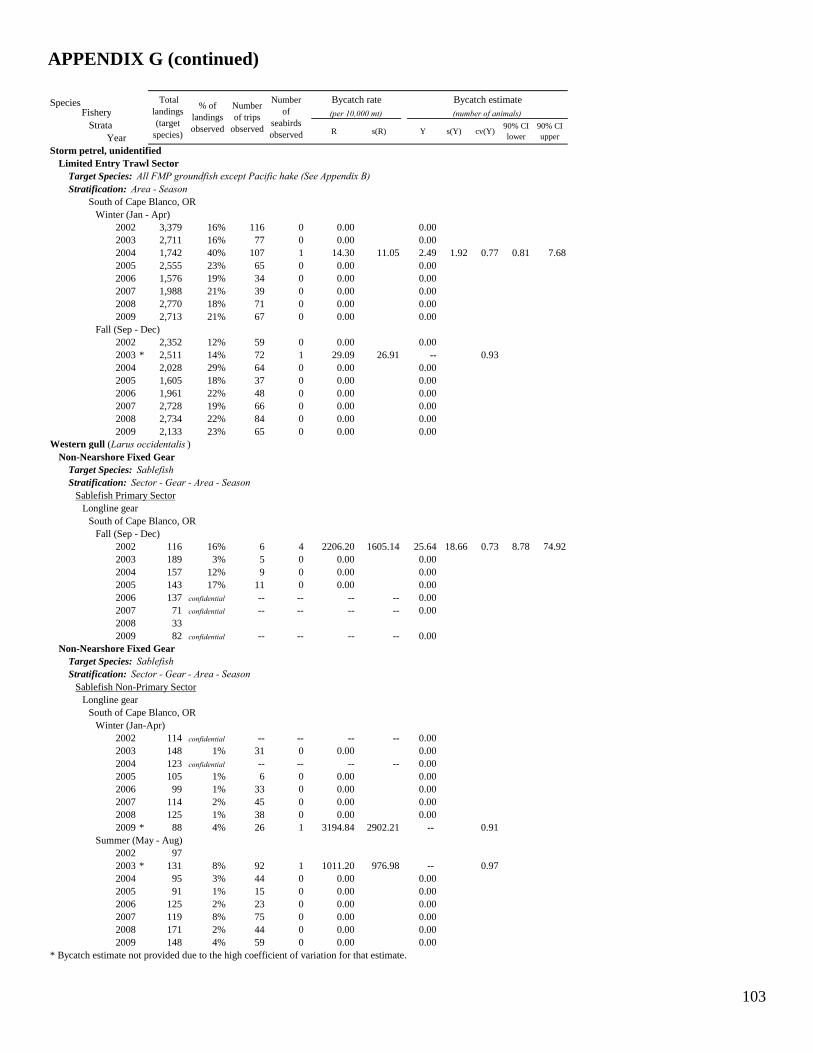
103
APPENDIX G (continued) Species
FisheryStrata
YearStorm petrel, unidentified
Limited Entry Trawl SectorTarget Species: All FMP groundfish except Pacific hake (See Appendix B)
South of Cape Blanco, ORWinter (Jan - Apr)
2002 3,379 16% 116 0 0.00 0.00 2003 2,711 16% 77 0 0.00 0.00 2004 1,742 40% 107 1 14.30 11.05 2.49 1.92 0.77 0.81 7.682005 2,555 23% 65 0 0.00 0.00 2006 1,576 19% 34 0 0.00 0.00 2007 1,988 21% 39 0 0.00 0.00 2008 2,770 18% 71 0 0.00 0.00 2009 2,713 21% 67 0 0.00 0.00
Fall (Sep - Dec)2002 2,352 12% 59 0 0.00 0.00 2003 * 2,511 14% 72 1 29.09 26.91 -- 0.932004 2,028 29% 64 0 0.00 0.00 2005 1,605 18% 37 0 0.00 0.00 2006 1,961 22% 48 0 0.00 0.00 2007 2,728 19% 66 0 0.00 0.00 2008 2,734 22% 84 0 0.00 0.00 2009 2,133 23% 65 0 0.00 0.00
Western gull (Larus occidentalis )Non-Nearshore Fixed Gear
Target Species: SablefishStratification: Sector - Gear - Area - Season
Sablefish Primary SectorLongline gear
South of Cape Blanco, ORFall (Sep - Dec)
2002 116 16% 6 4 2206.20 1605.14 25.64 18.66 0.73 8.78 74.922003 189 3% 5 0 0.00 0.00 2004 157 12% 9 0 0.00 0.00 2005 143 17% 11 0 0.00 0.00 2006 137 confidential -- -- -- -- 0.00 2007 71 confidential -- -- -- -- 0.00 2008 33 2009 82 confidential -- -- -- -- 0.00
Non-Nearshore Fixed GearTarget Species: SablefishStratification: Sector - Gear - Area - Season
Sablefish Non-Primary SectorLongline gear
South of Cape Blanco, ORWinter (Jan-Apr)
2002 114 confidential -- -- -- -- 0.002003 148 1% 31 0 0.00 0.002004 123 confidential -- -- -- -- 0.002005 105 1% 6 0 0.00 0.002006 99 1% 33 0 0.00 0.002007 114 2% 45 0 0.00 0.002008 125 1% 38 0 0.00 0.002009 * 88 4% 26 1 3194.84 2902.21 -- 0.91
Summer (May - Aug)2002 97 2003 * 131 8% 92 1 1011.20 976.98 -- 0.972004 95 3% 44 0 0.00 0.00 2005 91 1% 15 0 0.00 0.00 2006 125 2% 23 0 0.00 0.00 2007 119 8% 75 0 0.00 0.00 2008 171 2% 44 0 0.00 0.00 2009 148 4% 59 0 0.00 0.00
* Bycatch estimate not provided due to the high coefficient of variation for that estimate.
% of landings observed
Number of trips
observed
Number of
seabirds observed
Bycatch rate(per 10,000 mt) (number of animals)
Stratification: Area - Season
R s(R) Y s(Y) cv(Y)90% CI lower
Total landings(target
species) 90% CI upper
Bycatch estimate
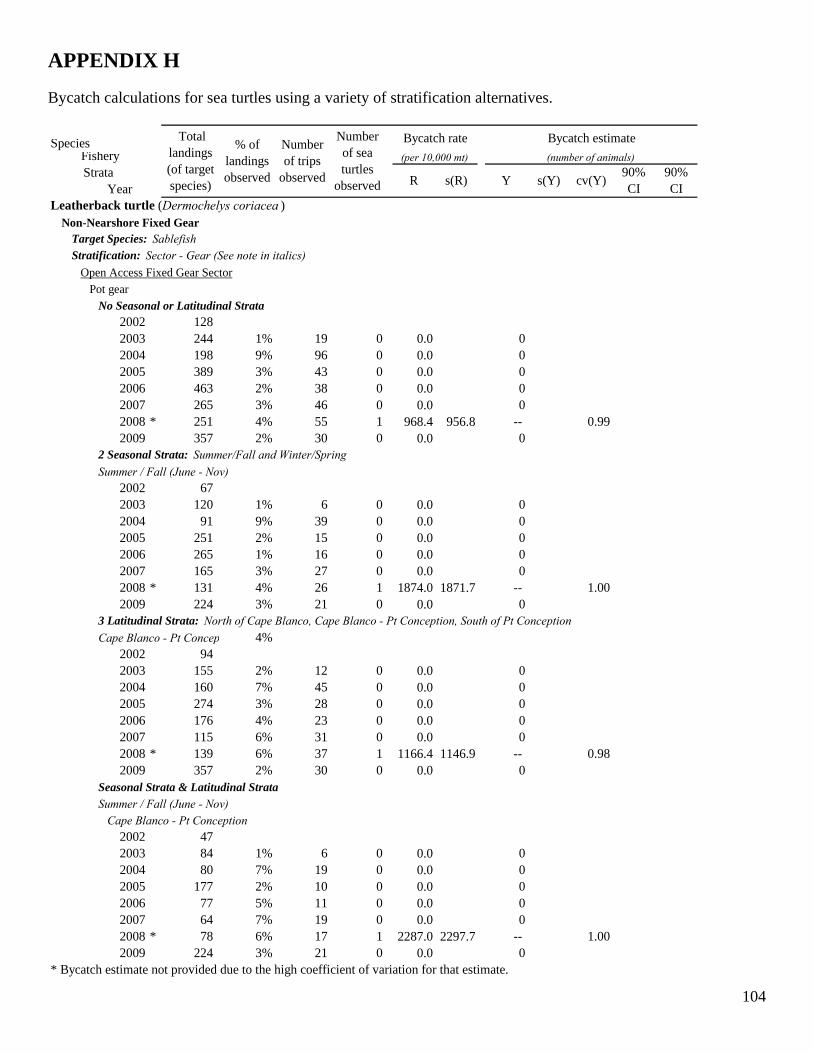
104
APPENDIX H
Bycatch calculations for sea turtles using a variety of stratification alternatives.
SpeciesFisheryStrata
YearLeatherback turtle (Dermochelys coriacea )
Non-Nearshore Fixed GearTarget Species: SablefishStratification: Sector - Gear (See note in italics)
Open Access Fixed Gear SectorPot gear
No Seasonal or Latitudinal Strata2002 128 2003 244 1% 19 0 0.0 0 2004 198 9% 96 0 0.0 0 2005 389 3% 43 0 0.0 0 2006 463 2% 38 0 0.0 0 2007 265 3% 46 0 0.0 0 2008 * 251 4% 55 1 968.4 956.8 -- 0.992009 357 2% 30 0 0.0 0
2 Seasonal Strata: Summer/Fall and Winter/Spring
Summer / Fall (June - Nov)2002 67 2003 120 1% 6 0 0.0 0 2004 91 9% 39 0 0.0 0 2005 251 2% 15 0 0.0 0 2006 265 1% 16 0 0.0 0 2007 165 3% 27 0 0.0 0 2008 * 131 4% 26 1 1874.0 1871.7 -- 1.002009 224 3% 21 0 0.0 0
3 Latitudinal Strata: North of Cape Blanco, Cape Blanco - Pt Conception, South of Pt Conception
Cape Blanco - Pt Concep 4%2002 94 2003 155 2% 12 0 0.0 0 2004 160 7% 45 0 0.0 0 2005 274 3% 28 0 0.0 0 2006 176 4% 23 0 0.0 0 2007 115 6% 31 0 0.0 0 2008 * 139 6% 37 1 1166.4 1146.9 -- 0.982009 357 2% 30 0 0.0 0
Seasonal Strata & Latitudinal Strata
Summer / Fall (June - Nov)Cape Blanco - Pt Conception
2002 47 2003 84 1% 6 0 0.0 0 2004 80 7% 19 0 0.0 0 2005 177 2% 10 0 0.0 0 2006 77 5% 11 0 0.0 0 2007 64 7% 19 0 0.0 0 2008 * 78 6% 17 1 2287.0 2297.7 -- 1.002009 224 3% 21 0 0.0 0
* Bycatch estimate not provided due to the high coefficient of variation for that estimate.
Total landings(of target species)
% of landings observed
Number of trips
observed
Number of sea turtles
observed
Bycatch rate Bycatch estimate
(per 10,000 mt) (number of animals)
90% CI
s(R) Y s(Y) cv(Y)R90% CI