Global Wind Supply Chain Update 2015
18
17-20 November 2015, Paris Global Wind Supply Chain Update 2015 Feng Zhao, Director
Transcript of Global Wind Supply Chain Update 2015
17-20 November 2015, Paris
Global Wind Supply Chain Update 2015 Feng Zhao, Director

Table of Contents
2
About FTI Consulting
Global Wind Supply Chain Update
Global Wind Supply Chain – Challenges and Opportunities

About FTI Consulting

FTI is a global advisory
firm that provides
multidisciplinary
solutions to complex
challenges and
opportunities.
United by a culture of
urgency, our
professionals are
organised around the
globe to provide critical
assistance wherever
and whenever needed.
4
EXPERIENCED PROFESSIONALS
FTI are trusted advisors with diverse
expertise and exceptional credentials
serving clients globally including
accountants, economists, engineers,
former CFOs and strategists.
DEEP INDUSTRY EXPERTISE
FTI combines unparalleled expertise
and industry knowledge to address
critical challenges for clients. Our
largest industry groups are:
Energy, Power & Products
Financial Institutions & Insurance
Healthcare & Life Sciences
Real Estate
Retail & Consumer
Telecom, Media & Technology
GLOBAL REACH
With over 4,400 employees and offices
in 27 countries on six continents, our
breadth and depth extends across
every major social, political and
economic hub across the globe.
FTI Consulting at a Glance
FCN
Publicly traded – NYSE
$1.7 BLN
Market Capitalization
1982 Year founded
80 Different disciplines
4,400+
Employees worldwide
700+
Industry specialists
440+
Senior Managing Directors
2 Nobel
Laureates
10/10 Advisor to the world’s top 10 bank
holding companies
94/100 Advisor to 94 of the world’s
top 100 law firms
47/100
47 of all Global 100
corporations are clients
80
Offices in 80 cities around the globe

Our Wind Energy Capability
5
Example Clients
Subscription Service
Our team
Senior with deep expertise
Ex-BTM Navigant, MAKE Consulting, IHS-CERA, Recharge,
EWEA leaders
Leading industry professionals
Hands-on operational experience
Multi-disciplinary background

Global Wind Supply Chain Update 2015
Global Wind Supply Chain Update 2015
7
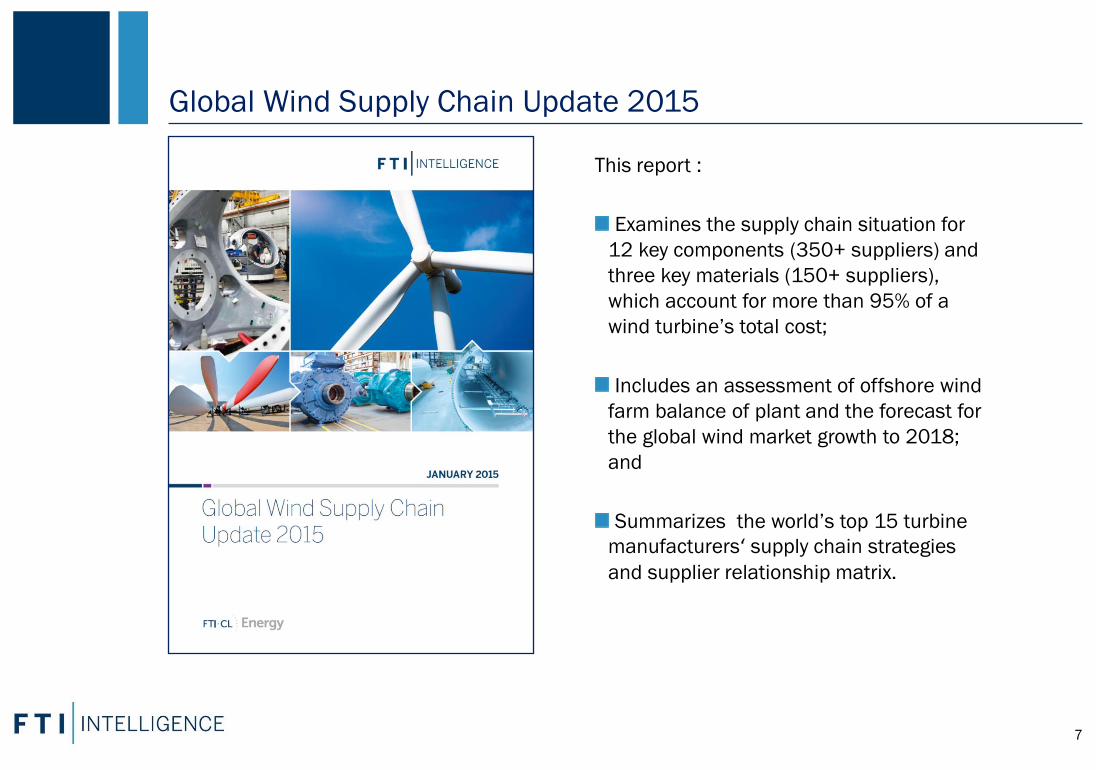
This report :
Examines the supply chain situation for
12 key components (350+ suppliers) and
three key materials (150+ suppliers),
which account for more than 95% of a
wind turbine’s total cost;
Includes an assessment of offshore wind
farm balance of plant and the forecast for
the global wind market growth to 2018;
and
Summarizes the world’s top 15 turbine
manufacturers‘ supply chain strategies
and supplier relationship matrix.

Global Wind Supply Chain – Scope of Work
8
Source: FTI Intelligence and EWEA, January 2015
95% of
turbine
cost

Background of the transformation of the global wind supply chain
9
Europe is still the hub of wind turbine technologies and
major European turbine vendors have built facilities in
all major wind power markets.
More than half of the identified active OEMs in the
world, however, come from China and India.
Eight of the global top 15 turbine OEMs based in China.
Europe used to be the supply chain center of key
components and materials. Globalization has driven the
major European suppliers to expand their business to
North America, Asia and most recently in South America.
The local content requirements (LCRs) is also one of the
largest contributors for this transformation.
> 50% of the wind turbine component suppliers are
currently from South & East Asia.
What is going on in global wind supply chain in the past two years
10
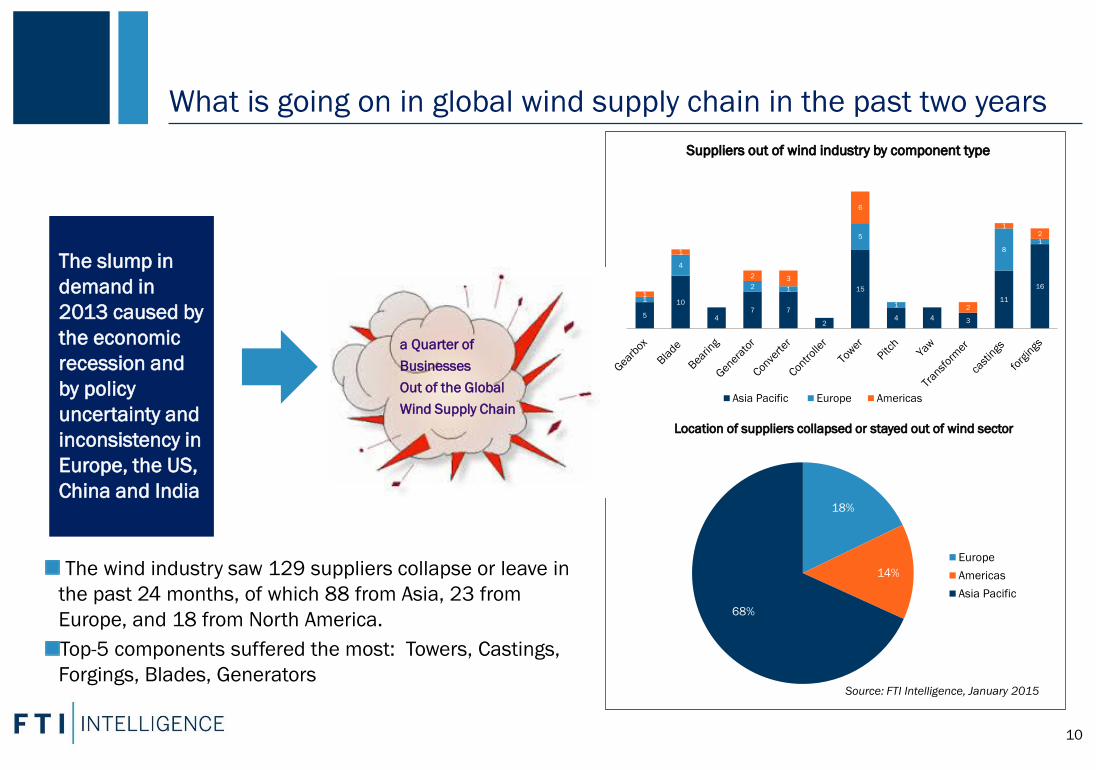
The slump in
demand in
2013 caused by
the economic
recession and
by policy
uncertainty and
inconsistency in
Europe, the US,
China and India
a Quarter of
Businesses
Out of the Global
Wind Supply Chain
Source: FTI Intelligence, January 2015
The wind industry saw 129 suppliers collapse or leave in
the past 24 months, of which 88 from Asia, 23 from
Europe, and 18 from North America.
Top-5 components suffered the most: Towers, Castings,
Forgings, Blades, Generators
5
10
47 7
2
15
4 4 3
11
16
1
4
2 1
5
1
81
1
1
2 3
6
2
12
Suppliers out of wind industry by component type
Asia Pacific Europe Americas
18%
14%
68%
Location of suppliers collapsed or stayed out of wind sector
Europe
Americas
Asia Pacific
Trends of turbine OEMs supply chain strategies
11
Taper integration
(Hybrid model)
S
up
ply
ch
ain
so
urc
ing p
att
ern
s
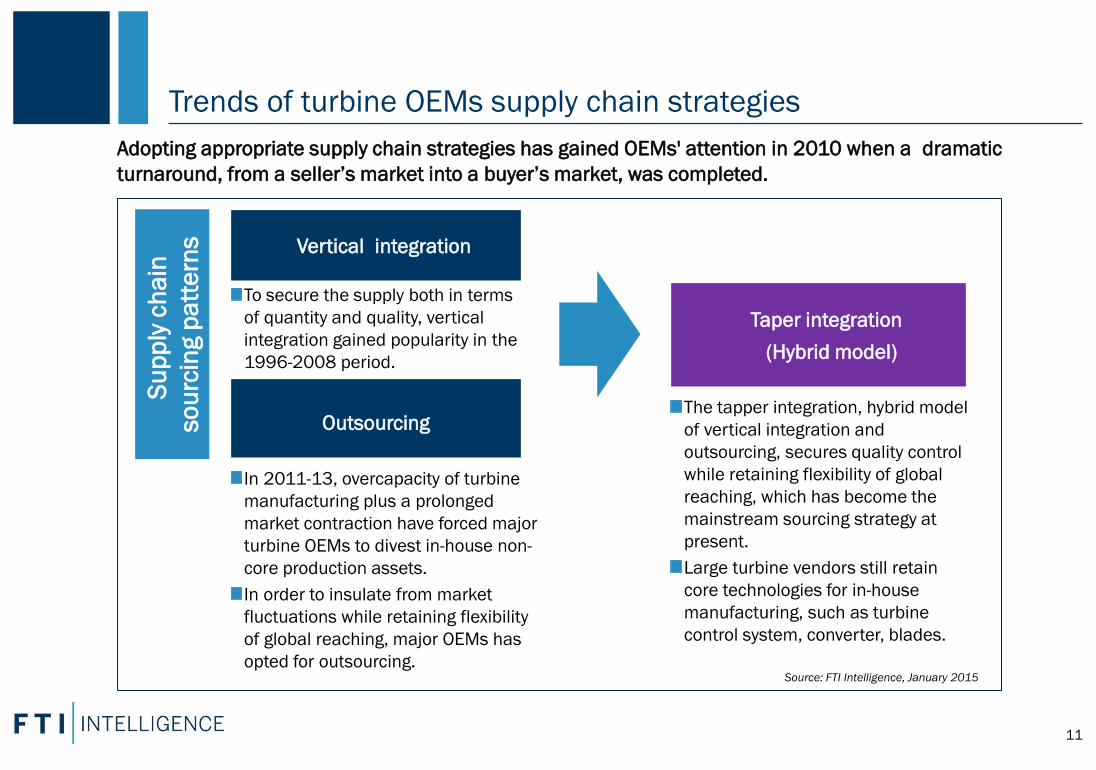
Vertical integration
Outsourcing
To secure the supply both in terms
of quantity and quality, vertical
integration gained popularity in the
1996-2008 period.
Adopting appropriate supply chain strategies has gained OEMs' attention in 2010 when a dramatic
turnaround, from a seller’s market into a buyer’s market, was completed.
In 2011-13, overcapacity of turbine
manufacturing plus a prolonged
market contraction have forced major
turbine OEMs to divest in-house non-
core production assets.
In order to insulate from market
fluctuations while retaining flexibility
of global reaching, major OEMs has
opted for outsourcing.
The tapper integration, hybrid model
of vertical integration and
outsourcing, secures quality control
while retaining flexibility of global
reaching, which has become the
mainstream sourcing strategy at
present.
Large turbine vendors still retain
core technologies for in-house
manufacturing, such as turbine
control system, converter, blades.
Source: FTI Intelligence, January 2015

Supply vs. Demand – Overview of current and near-term situation In general, no constraints have
been identified in the global supply
chain. Supply of most components
and materials is expected to
exceed demand in 2015.
Most of key components and
materials will continue to face the
challenge of overcapacity, but
bearings (ultra-large tapered roller
bearings with almost all direct drive
designs) and rare earth materials
are expected to be in short supply
through 2018.
A strong regional imbalance exists
(for control system, castings,
forgings and rare earth materials),
which still causes a sourcing
challenge in some regions.
LCOE will certainly play a role to
decide the winners and losers. 12
Source: FTI Intelligence, January 2015
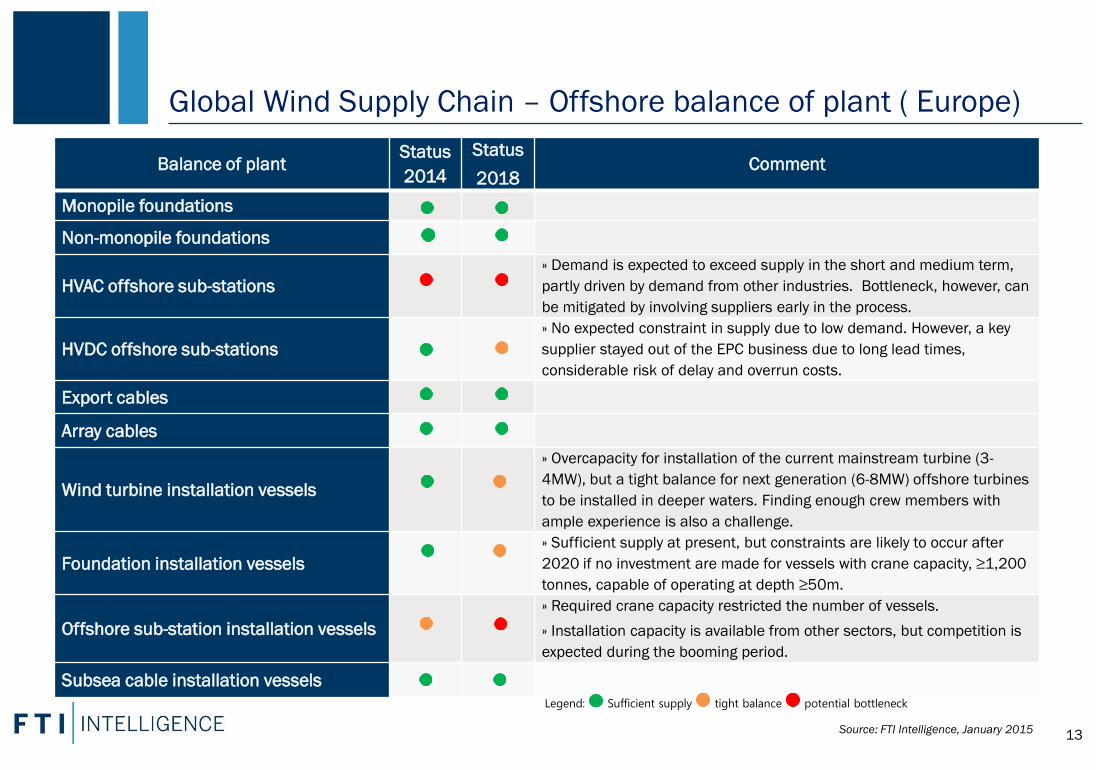
Balance of plant Status
2014
Status
2018 Comment
Monopile foundations
Non-monopile foundations
HVAC offshore sub-stations
» Demand is expected to exceed supply in the short and medium term,
partly driven by demand from other industries. Bottleneck, however, can
be mitigated by involving suppliers early in the process.
HVDC offshore sub-stations
» No expected constraint in supply due to low demand. However, a key
supplier stayed out of the EPC business due to long lead times,
considerable risk of delay and overrun costs.
Export cables
Array cables
Wind turbine installation vessels
» Overcapacity for installation of the current mainstream turbine (3-
4MW), but a tight balance for next generation (6-8MW) offshore turbines
to be installed in deeper waters. Finding enough crew members with
ample experience is also a challenge.
Foundation installation vessels
» Sufficient supply at present, but constraints are likely to occur after
2020 if no investment are made for vessels with crane capacity, ≥1,200
tonnes, capable of operating at depth ≥50m.
Offshore sub-station installation vessels
» Required crane capacity restricted the number of vessels.
» Installation capacity is available from other sectors, but competition is
expected during the booming period.
Subsea cable installation vessels
Global Wind Supply Chain – Offshore balance of plant ( Europe)
13 Source: FTI Intelligence, January 2015
Legend: Sufficient supply tight balance potential bottleneck

Global Wind Supply Chain – Challenges and Opportunities
0
10000
20000
30000
40000
50000
60000
70000
80000
2014 2015e 2016e 2017e 2018e 2019e 2020e 2021e 2022e 2023e 2024e
An
nu
al In
sta
lati
on
s (M
W)
Europe South & East Asia North America Latin America OECD-Pacific Africa Middle East & CIS Countries
15
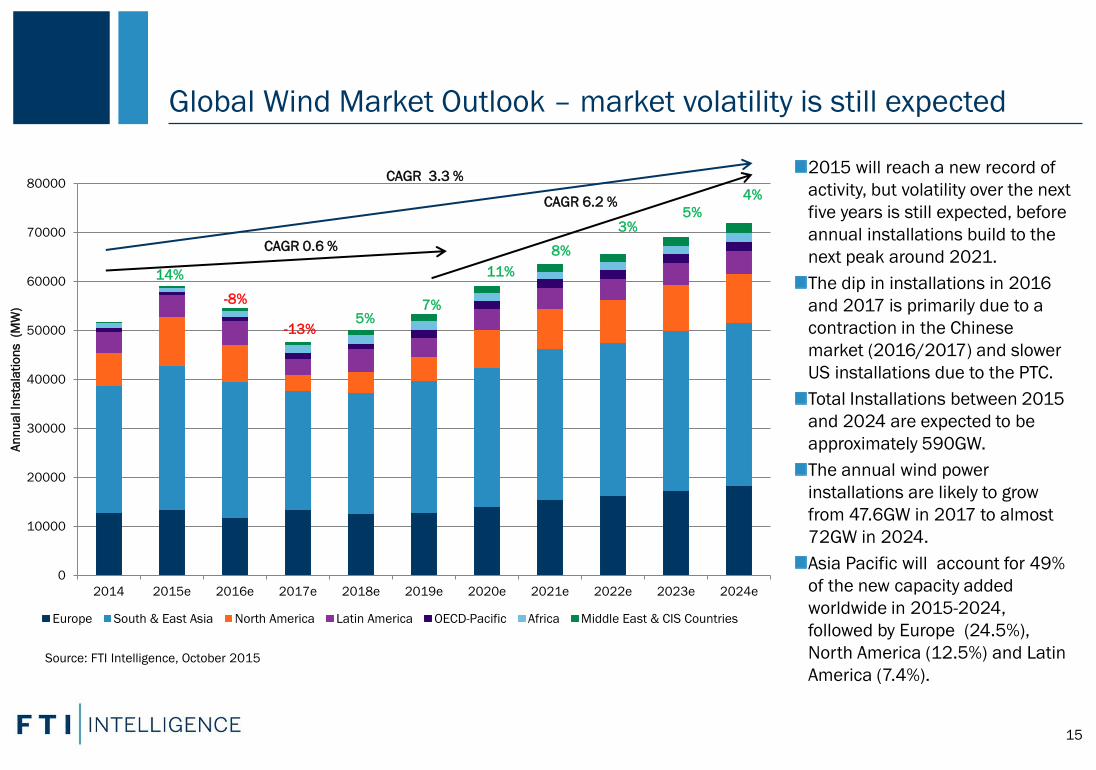
Source: FTI Intelligence, October 2015
14%
-8%
-13% 5%
7%
11%
8%
3% 5%
4%
2015 will reach a new record of
activity, but volatility over the next
five years is still expected, before
annual installations build to the
next peak around 2021.
The dip in installations in 2016
and 2017 is primarily due to a
contraction in the Chinese
market (2016/2017) and slower
US installations due to the PTC.
Total Installations between 2015
and 2024 are expected to be
approximately 590GW.
The annual wind power
installations are likely to grow
from 47.6GW in 2017 to almost
72GW in 2024.
Asia Pacific will account for 49%
of the new capacity added
worldwide in 2015-2024,
followed by Europe (24.5%),
North America (12.5%) and Latin
America (7.4%).
CAGR 3.3 %
CAGR 0.6 %
CAGR 6.2 %
Global Wind Market Outlook – market volatility is still expected

Investment Opportunities in the Global Wind Supply Chain
16
The Top 15 fastest growing wind markets in terms of CAGR in 2015-2019
The Top 15 largest wind markets in terms of new additions in 2015-2019
Source: FTI Intelligence, October 2015
The Top 15 largest wind
markets are expected to add
231 GW, accounting for 88%
of the new capacity added
worldwide in 2015-2019.
Among the top 15, China is
going to add 112GW new
capacity in 2015-2019,
followed by the US, Germany,
India and Brazil.
The Top 15 fastest growing
wind markets are expected to
install 12.8 GW in 2015-2019,
account for 5% of the new
capacity added worldwide.
Most of those fastest growing
markets are emerging markets
in Asia, Africa and Latin
America, but political and
financial uncertainties remain
in those markets.

Q&A

Critical Thinking at the Critical Time ™
Aris Karcanias Feng Zhao Robert Clover Ben Backwell Victor Musuku
Managing Director Director Director Managing Director Analyst
+44 20 3727 1282 direct +45 2046 2658 direct +44 20 3727 1801 direct +44 20 3727 1801 direct +45 2046 2658 direct
+44 77 1784 6696 mobile +45 3113 5677 mobile +44 77 8974 2653 mobile +44 20 3727 1798 direct +45 3113 5677 mobile
[email protected] [email protected] [email protected] [email protected] [email protected]
200 Aldersgate Gl. Kongevej 1 200 Aldersgate 200 Aldersgate Gl. Kongevej 1
Aldersgate Street 1610 Copenhagen Aldersgate Street Aldersgate Street 1610 Copenhagen
London EC1A 4HD Denmark London EC1A 4HD London EC1A 4HD Denmark
United Kingdom United Kingdom United Kingdom