
GLOBAL WIND ENERGY OUTLOOK | 2016
44
OCTOBER 2016 GLOBAL WIND ENERGY OUTLOOK | 2016
Transcript of GLOBAL WIND ENERGY OUTLOOK | 2016
OCTOBER 2016
GLOBAL WIND ENERGY
OUTLOOK | 2016

2 GLOBAL WIND ENERGY OUTLOOK | 2016
CHAPTER TITLE1
Opening up new markets for business
Join GWEC today!www.gwec.net
“ GWEC introduced us to the key people we needed to know... ”
“ We view GWEC as a key partner in the growth of our business.” Kjell Forsen, CEO, Vaisala
“ Our GWEC membership opens up a world of new business opportunities.”
up the Latin American market for wind.”
e Wind

3GLOBAL WIND ENERGY OUTLOOK | 2016
1CHAPTER TITLE
G L O B A L W I N D E N E R G Y
O U T L O O K | 2 0 1 6

4 GLOBAL WIND ENERGY OUTLOOK | 2016
CHAPTER TITLE1
Scenarios GWEC UTS:ISF
Text editors Lauha Fried Shruti Shukla Steve Sawyer Sven Teske
Design bitter grafi k
Cover photo © Vestas

5GLOBAL WIND ENERGY OUTLOOK | 2016
1CHAPTER TITLE
T A B L E O F C O N T E N T S
Foreword . . . . . . . . . . . . . . . . . . . . . . . . . . . . . . . . . . . . . . . . . . . . . 6
Preface . . . . . . . . . . . . . . . . . . . . . . . . . . . . . . . . . . . . . . . . . . . . . . 8
GLOBAL STATUS OF WIND POWER . . . . . . . . . . . . . . . . . . . . . . . . 11
GLOBAL WIND ENERGY OUTLOOK SCENARIOS . . . . . . . . . . . . . . . 15
Wind power shaping the energy transformation . . . . . . . . . . . . . . . . . . . . . . . 15
Global scenario results . . . . . . . . . . . . . . . . . . . . . . . . . . . . . . . . . . . . 18
Capacity growth . . . . . . . . . . . . . . . . . . . . . . . . . . . . . . . . . . . . . . . . 18
Scenario results . . . . . . . . . . . . . . . . . . . . . . . . . . . . . . . . . . . . . . . . . 19
Global cumulative wind power capacity . . . . . . . . . . . . . . . . . . . . . . . . . . . 19
Production and share of electricity supply . . . . . . . . . . . . . . . . . . . . . . . . . . 20
Wind power share of global electricity demand . . . . . . . . . . . . . . . . . . . . . . . 22
Specific costs (per kW) . . . . . . . . . . . . . . . . . . . . . . . . . . . . . . . . . . . . . 22
Scenario results . . . . . . . . . . . . . . . . . . . . . . . . . . . . . . . . . . . . . . . . . 23
Total installed cost, investment and employment . . . . . . . . . . . . . . . . . . . . . . 24
Annual and cumulative CO2 emissions reductions (MT CO2) . . . . . . . . . . . . . . . . 27
THE FUTURE OF WIND . . . . . . . . . . . . . . . . . . . . . . . . . . . . . . . 31
What has changed? . . . . . . . . . . . . . . . . . . . . . . . . . . . . . . . . . . . . . . 31
What hasn’t changed? . . . . . . . . . . . . . . . . . . . . . . . . . . . . . . . . . . . . . 32
So what do we know about the future? . . . . . . . . . . . . . . . . . . . . . . . . . . . . 33
Conclusion . . . . . . . . . . . . . . . . . . . . . . . . . . . . . . . . . . . . . . . . . . . 39
ANNEX . . . . . . . . . . . . . . . . . . . . . . . . . . . . . . . . . . . . . . . . . . 40

6 GLOBAL WIND ENERGY OUTLOOK | 2016
CHAPTER TITLE1
F O R E W O R D
T he Global Wind Energy Council is pleased to present this 6th edition of
the Global Wind Energy Outlook, looking at the future of our industry out to 2020, 2030 and ultimately to 2050. What happens in the energy sector in that time frame is not only of vital concern to the wind industry, but to all humankind. In the next critical 5-15 years we will answer the question as to whether or not we as a species will have responded to the existential threat of climate change, or whether we spend the second half of this century trying to cope with the disaster we have caused.
With new markets developing rapidly across Africa, Asia and Latin America; Unprece dented policy stability in the US market; strong and continued commitment from India and China; and the rapidly dropping prices for wind power both on and offshore - on the whole things look very good for the industry. With the Paris Agreement about to enter into force, the climate regime may fi nally become the major driver for the development of renewable energy that it should have been for at least the last 20 years. But of course much could go wrong...history rarely follows the smooth curves in this and other reports. But at least now the direction of travel is the clearest it has ever been.
Since 1999, the Global Wind Energy Outlook and its forerunners have presented scenarios looking at the long term future of the industry1. In the early days, they were considered to be pie-in-the-sky wishful thinking. However, what actually occurred was that the industry generally met or exceeded the totals in those early reports. Of course we didn’t predict the dramatic rise in China, and we expected North America to be much further ahead than it is now. But on the whole, we were pretty close, far closer than the offi cial national and international agencies looking at technology development, whose forecasts until relatively recently were ridiculously low-ball. But of late there is something of a convergence, although the GWEC Advanced Scenario, the successor of the original Wind Force Scenario, is still far and away the ‘brightest’ picture of the wind indus-try’s future. It should be noted that the indus-try tracked the Advanced Scenario up through 2009, but then as the fi nancial crisis struck and markets were essentially fl at through 2013, real installations slipped towards the Moderate Scenario track; but with spectacular growth in both 2014 and 2015, the industry is back on the Advanced Scenario track.
1 http://www.inforse.dk/doc/Windforce10.pdf https://www.greenpeace.de/sites/www.greenpeace.de/fi les/
greenpeace_studie_windforce_12_1.pdf http://greenpeace.org.br/energia/pdf/windforce12.pdf http://www.offshorecenter.dk/log/bibliotek/WF12-2004_eng.pdf

7GLOBAL WIND ENERGY OUTLOOK | 2016
1CHAPTER TITLE
In 2006, the current format was adopted where we measure our scenarios against the central scenario in the IEA’s World Energy Outlook (WEO) – formerly the Reference Scenario, and now the New Policies Scenario; and run all production scenarios against a baseline demand model from the IEA as well as another more effi cient demand forecast. This year, we have also included the IEA’s 450 Scenario, developed in the aftermath of the Copenhagen Climate Summit in 2009, which has become a regular feature of the WEO. In conjunction, and viewed against two different projections of electricity demand growth, they provide a range of plausible futures for the development of the sector.
The GWEC Moderate and Advanced scenarios have evolved collaboratively over the years between the Global Wind Energy Council, Greenpeace International and the German Aerospace Centre (Deutsches Zentrum fur Luft-und-Raumfahrt – DLR). These scenarios for the future of the wind industry have con-tributed to an ongoing series of broader studies on global sustainable energy pathways up to 2050 conducted by DLR and Greenpeace International in collaboration with a number of industry associations including GWEC. For this latest iteration, our prime analyst has moved to the Unversity of Technology, Sydney – In-stitute For Sustainable Futures.
Thanks to the IEA for providing us with their latest projections for wind energy development as of June 2016. We have extrapolated their scenarios out to 2050 and made adjustments to make all the scenarios fully commensurate, and any errors that may have resulted from that process are all our own. In the past, we used the IEA reference scenario to show how far apart we were...but that has all changed and our scenarios are getting closer and closer all the time...great minds think alike!
Steve SawyerSecretary GeneralGlobal Wind Energy Council
Morten DyrholmChairmanGlobal Wind Energy Council
Dr. Sven TeskeResearch Principal, EngineerInstitute for Sustainable Futures University of Technology Sydney
W H A T H A P P E N S I N T H E E N E R G Y S E C T O R
I S N O T O N L Y O F V I T A L C O N C E R N T O
T H E W I N D I N D U S T R Y , B U T T O A L L
H U M A N K I N D

8 GLOBAL WIND ENERGY OUTLOOK | 2016
CHAPTER TITLE1
P R E F A C E
I n 2016, wind power continued to push the boundaries of what many thought
was possible.
On 15 May, a combination of wind and solar provided Germany with nearly 100% of its power needs. On a stormy day in August, wind turbines in Scotland generated more elec-tricity than the entire country used on that day. Denmark now produces more than 40% of its electricity from wind turbines. And in the US, which now produces 2.5 times more wind energy than it did 5 years ago, recent polling found that 70% of registered voters view wind energy favourably.
This dramatic shift – in policy and practice – towards renewable energy sources like wind is largely being driven by one overarching consid-eration: cost.
Wind turbine prices have fallen by almost a third since 2009. Onshore wind is now one of the most competitive sources of electricity available with some projects now delivering electricity for as little as 4 US cents per kWh. Compared to onshore wind, nuclear power costs three times more to produce in the Americas and energy from new coal-fi red or gas-fi red power plants costs up to 30% more in Europe, the Middle East and Africa.
And wind power costs are expected to decline even further. With the right policies in place, IRENA research fi nds that average electricity costs could decrease by 35% for offshore wind and 26% for onshore wind by 2025.
The fact remains that wind is one of the least-cost options in many markets for new power generation, and this is even before factoring in environmental and health costs. IRENA estimates that doubling the global share of renewables by 2030 would save up to $4.2 trillion dollars annually thanks to avoided expenditures on air pollution and climate change.
But it’s not just cost that is driving the wind boom. There are four other key environmental and social challenges that point to renewables like wind as a smarter energy solution:
1. Jobs – Renewable energy employs more people per unit of electricity than oil or gas. More than 1 million people worldwide are employed by the wind industry alone, a 5% increase over last year. Wind employment in the US rose by 21% in 2015 – 12 times faster than overall job creation in the US economy. If we double the global share of renewables by 2030, renewable energy employment would exceed 24 million people worldwide.
2. Water – Water is an essential ingredient in the energy production process. In the EU for example, energy production accounts for 44% of total water use. During power gener-ation, solar power withdraws 200 times less water than a coal power plant to produce the same amount of electricity. Wind power requires no water. IRENA analysis fi nds that doubling the share of renewable energy, in particular solar PV and wind, could reduce water withdrawals in the power sector as

9GLOBAL WIND ENERGY OUTLOOK | 2016
1CHAPTER TITLE
much as 52% in the UK, 37% in the US, 32% in Australia, 28% in Germany and 12% in India.
3. Public health/air pollution – Doubling the share of renewables would also decrease harmful emissions from pollutants such as ammonia, particulate matter, volatile organic compounds, and sulphur dioxide by 82%, 33%, 27% and 12% respectively, saving up to 4 million lives per year by 2030. The largest air pollution savings would come from the power sector, mainly due to reduced coal use. China, India, Indonesia and the USA would accrue the greatest health savings, along with all developing coun-tries thanks to the reduced use of traditional biomass.
4. Climate change – The energy sector ac-counts for more than two thirds of global greenhouse gas emissions. As such, energy must be our priority in bringing down CO2 emissions. Renewable energy can deliver half of all emission reductions needed to keep temperature rise below 2°C while energy effi ciency measures can deliver the other half. Renewables and effi ciency are the only technologies that can be deployed fast enough and at suffi cient scale to meet the target set in Paris.
More and more countries around the world are now seeing that choosing renewables, like wind, is not only the most economic pathway, but also the most socially and environmentally advantageous. It would create more jobs,
save millions of lives from reduced air pollution and set us on a pathway to limit global tem-perature rise to two degrees as agreed in Paris.
The wind industry has come a long way, but still more has to be done. World wind power generation capacity reached 435 gigawatts at the end of 2015, which is only 7% of total global power generation capacity. To push this fi gure higher, governments should implement a range of measures and support schemes like feed in tariffs, renewable portfolio standards in combination with auctions, and production tax credits. As shares of wind continue to increase, countries must also take steps to create power systems that can integrate large amounts of variable wind energy, exploring smart grids, storage technologies and other grid man-agement mechanisms.
The recent ground-breaking achievements of wind and other renewable energy sources have proven that we have yet to truly tap into their full potential. With the right support policies in place that boost investment, foster innovation and spur further development, renewables can deliver the clean energy future we need, in record time.
GWEC has been a strong collaborator with IRENA since the beginning, and this report, the latest in a series that goes back to 1999, provides valuable insights at what the future holds for wind power. We look forward to continuing our collaboration with GWEC in the coming years.
I T ’ S N O T J U S T C O S T T H A T I S D R I V I N G T H E
W I N D B O O MAdnan Z. AminDirector-General International Renewable Energy Agency (IRENA)

11GLOBAL WIND ENERGY OUTLOOK | 2016
1G L OB A L S TAT U S OF W I N D P O W E R
1
G L O B A L S T A T U S O F W I N D P O W E R
T he global wind industry had another record year in 2015, with annual in-
stallations topping 63 GW. Overall, by the end of 2015, there were about 433 GW of wind power spinning around the globe, a 17% increase over the previous year; and wind power supplied more new power generation than any other technology.
China, the largest overall market for wind power since 2009, maintained its leadership position and installations in Asia led global markets again, with Europe in the second spot, and North America closing the gap with Europe, in third place. The majority of wind installations globally were outside the OECD once again and this trend is likely to continue.
The global wind industry is present today in more than 80 countries, of which 28 countries have more than 1 GW installed, including 17 in Europe; 4 in Asia-Pacifi c (China, India, Japan & Australia); 3 in North America (Canada, Mexico, US); 3 in Latin America (Brazil, Chile and Uruguay); and 1 in Africa (South Africa).
Eight countries had more than 10 GW in-stalled, including China (145,362 MW); the US (74,471 MW); Germany (44,947 MW);
India (25,088 MW); Spain (23,025 MW); UK (13,603 MW); Canada (11,205 MW); and France (10,358 MW). In 2016 Brazil joined the 10GW club.
China’s cumulative wind power installations (145 GW) at the end of 2015 are more than all European Union countries combined (141.6 GW).
2015 was a big year for the big markets – China, the US, Germany and Brazil, all of which set new records. But there is also a lot of activity in new markets around the world; Guatemala and Jordan each added their fi rst large commercial wind farms, and South Africa became the fi rst African market to pass the 1 GW milestone. New markets are emerging across Africa, Asia and Latin America, which will provide the major growth markets for the next decade.
Asia is the world’s largest regional wind market with an overall total installed capacity of 175.8 GW.
In terms of annual installations China maintained its leadership position in 2015 by adding 30.8 GW of new wind power capacity to the grid, the highest annual number for any country ever.
© Vestas
12 GLOBAL WIND ENERGY OUTLOOK | 2016
1 GLOBAL STATUS OF WIND POWER
Observers continue to be surprised by the astonishing track record for growth of the wind sector in China over the last decade. However, the Chinese wind power market may see a slowdown in 2017. Curtailment remains a major challenge in China. China’s National Energy Administration and State Grid are working to solve the transmission bottlenecks and other grid issues, and the situation is expected to improve over the medium term.
India’s wind energy installations totalled 25,088 MW at the end of 2015, keeping the Indian wind power market fi rmly in the top fi ve rankings globally.
Outside of China, Asia will be led by India, but new markets such as Indonesia, Vietnam, the Philippines, Pakistan and Mongolia are devel-oping quickly.
The United States is the single largest market in terms of total installed capacity after China. The US market added 4000 new turbines for a total of 8,598 MW in 2015, and its total in-stalled capacity reached 74,471 MW.
Wind energy accounted for almost 31% of all new generating capacity installed in the US over last 5 years. Wind energy provided more than 31% of the electricity in Iowa, 25% in South Dakota, and 12% or more of the generation in a total of nine states.
The fi ve year extension and phase out of the PTC provides the greatest degree of long term policy stability the US wind industry has ever seen. This, combined with a broader range of customers, and an on-going “wind rush” driven by technological improvements is setting the stage for more years like 2015 in the US.
Canada‘s total installed wind capacity stood at 11.2 GW at the end of 2015 making it the seventh largest market globally. Canada’s new wind energy projects (1,506 MW) in 2015 rep-resent over $3 billion in investment.
Mexico installed an impressive 713.6 MW of new capacity to reach a total of 3,073 MW by the end of 2015.
Across Europe there are now 147.7 GW in-stalled, out of which 141.6 GW are in the EU. Wind power installed more than any other form of power generation in 2015, accounting for 44.2% of total 2015 power capacity in-stallations.
However, the overall EU installation levels mask signifi cant volatility across Europe; 47% of all new EU installations in 2015 took place in Germany and 73% occurred in the top four markets, a similar trend to the one seen in 2014. This is unlike previous years when in-stallations were less concentrated and spread across many more healthy European markets.
Germany remains the EU country with the largest installed capacity (44.9 GW), followed by Spain (23 GW), the UK (13.6 GW), France (10 GW) and Italy (9 GW). Sweden, Denmark, Poland and Portugal each have more than 5 GW installed.
Weakened legislative frameworks, on-going economic crises and austerity measures im-plemented across Europe continue to hinder growth of the wind power industry. The year ahead is likely to be diffi cult but the broader investment shift away from fossil fuels could boost the European renewables sector.
Beyond the EU, Turkey is the largest market in Europe with a cumulative installed capacity of 4,694 MW at the end of 2015.
Latin America and the Caribbean has a total installed capacity of 12.2 GW. Post the Paris Agreement at COP211, the demand for clean energy bolstered by concerns for energy security and diversity of supply will promote the growth of wind power in Latin America and the Caribbean.
Brazil leads the Latin American market with in-stallations of more than 10 GW and continues to be the most promising onshore market for wind energy in the region out to 2020.
1 http://unfccc.int/fi les/meetings/parisnov2015/application/pdf/parisagreementenglish_.pdf

13GLOBAL WIND ENERGY OUTLOOK | 2016
1GLOBAL STATUS OF WIND POWER
Uruguay will generate more than 30% of its power from wind by the end of 2016 and had a total installed capacity of over 845 MW at the end of 2015, but has now surpassed the 1,000 MW mark.
Chile’s total installed capacity now stands at just over 1 GW; Panama added 235 MW in 2015 to reach 270 MW; and Costa Rica added 70 MW of new capacity to reach a total of 268 MW. Honduras saw its total installed capacity reach 176 MW. Guatemala for the fi rst time added wind power to its energy mix in 2015, with a 50 MW project.
Argentina added 8 MW of new capacity in 2015 to bring its total installed capacity up to 279 MW. The Caribbean reached a total installed capacity of 250 MW across various island states.
The Pacifi c region saw its total installed capacity rise to just over 4.8 GW by the end of 2015. Australia, the biggest wind market in the region, brought its total installed wind capacity up to 4,187 MW.
Samoa added 550 kW of new wind power capacity in 2015. This was the fi rst wind project in the Pacifi c Island nation.
The Africa and Middle East region saw 953 MW of new capacity additions in 2015, bringing cumulative capacity for the region up to 3,489 MW. Africa’s wind resource is best around the coasts and in the eastern highlands, but until 2014 when the South African market took off, it was in North and East Africa that wind power has been developed at scale.
At the end of 2015, over 99% of the region’s total wind installations were spread across ten countries – South Africa (1,053 MW), Morocco (787 MW), Egypt (810 MW), Tunisia (245 MW), Ethiopia (324 MW), Jordan (119 MW), Iran (91 MW), Cape Verde (24 MW), Kenya (19 MW), Israel (6.25 MW) and Algeria (10 MW). New projects are expected to come online in Egypt, Ethiopia, Kenya, Morocco, Tanzania and South Africa in 2016.
OFFSHORE WIND ENERGY
The global offshore wind industry took a big step forward in 2015, installing more than 3.4 GW across fi ve markets globally, bringing total offshore wind capacity to over 12 GW.
At the end of 2015, more than 91% (11,034 MW) of all offshore wind installations were located in waters off the coast of eleven European countries. The remaining 9% of the installed capacity is located largely in China, followed by Japan and South Korea.
Globally, the UK is the largest offshore wind market today and accounts for over 40% of the installed capacity, followed by Germany in the second spot with 27%. Denmark accounts for 10.5%, Belgium for almost 6%, Netherlands for 3.5% and Sweden for 1.6%. Other European markets including Finland, Ireland, Norway, Spain and Portugal make up about 0.5% of the market. The largest market outside of the European waters is China, which accounts for approximately 8.4% of the global market.
However, other countries are setting ambitious targets for offshore wind and development is starting to take off in some of these markets. Japan, South Korea and Taiwan have put actual turbines in the water. Construction is now complete on the fi rst commercial offshore project in the US, and it will be commis-sioned before the end of 2016. The GWEC-led FOWIND consortium is developing an offshore wind roadmap for India.
Onshore wind power has become the least cost option when adding new capacity to the grid in an increasing number of markets, and prices continue to fall. Also, we have recently seen record low prices in the offshore wind sector. Given the urgency to cut CO2 emissions, clean our air and decrease reliance on imported fossil fuels, wind power’s pivotal role in the world’s future energy supply is assured.


15GLOBAL WIND ENERGY OUTLOOK | 2016
2T H E G L OB A L W I N D E N E R G Y O U T L O OK S C E N A R IO S
2
G L O B A L W I N D E N E R G Y O U T L O O K S C E N A R I O S
WIND POWER SHAPING THE ENERGY TRANSFORMATION
T he Global Wind Energy Outlook (GWEO) explores the future of the wind energy
industry out to 2020, 2030 and up to 2050. We use the International Energy Agency’s New Policies Scenario from the World Energy Outlook as a baseline; and for this edition we have included the IEA’s 450 Scenario, as the climate consequences of different energy pathways have once again risen up the inter-national political agenda. We have updated two scenarios especially for this publication: the GWEC Moderate Scenario and the GWEC Advanced Scenario.
The GWEC Moderate and Advanced Scenarios have evolved collaboratively over the years between the Global Wind Energy Council and the German Aerospace Centre (Deutsches Zentrum fur Luft-und-Raumfahrt – DLR). These scenarios for the future of the wind industry have contributed to an ongoing series of broader studies on global sustainable energy pathways up to 2050 conducted by DLR and Greenpeace International in collaboration with a number of industry associations including GWEC. The Energy [R]evolution scenario, or 2°C Scenario,
has become one of the benchmarks in inter-national energy scenario discussions, utilized by the IPCC, IEA and others.1
For this edition of the GWEO, our lead analyst has moved to the University of Technology, Sydney – Institute for Sustainable Futures. We continue to compare all scenarios with two different projected energy demand futures: the demand projections used in the IEA’s World En-ergy Outlook, and a lower, Effi ciency Scenario developed by DLR as an update of the original Effi ciency scenario used for these studies.
The upheaval in electricity markets around the globe and the wild swings in policy both in favor of and against renewable energy deployment make predictions about the future of this or any other industry challenging. However, it is also the case that as wind power plays a more and more central role in most future energy scenarios, that the various scenarios from industry, the IEA and others all begin to con-verge. Here we present four scenarios for each of the 10 IEA-defi ned regions as well as global totals, looking towards 2020 and 2030 – with
1 See http://www.energyblueprint.info
© AMDEE

16 GLOBAL WIND ENERGY OUTLOOK | 2016
THE GLOBAL WIND ENERGY OUTLOOK SCENARIOS2
longer-term projections out to 2050. A brief description of the underlying assumptions and orientation of each scenario is listed below.
1. IEA NEW POLICIES SCENARIO
The IEA’s New Policies Scenario (NPS) is based on an assessment of current directions and intentions of both national and international energy and climate policy, even though they may not yet have been incorporated into formal decisions or enacted into law. Examples of this would include the emissions reduction targets adopted in Paris in 2015, the various commitments to renewable energy and effi ciency at national and regional levels, and commitments by governments in such fora as the G-8/G-20 and the Clean Energy Ministerial. The New Policies scenario is now at the center of the IEA’s World Energy Outlook analysis; and we have extrapolated it out to 2050 for comparison purposes.
2. IEA 450 SCENARIO
The 450 Scenario (450), fi rst introduced in the IEA’s World Energy Outlook in 2010, sets out an energy pathway consistent with the goal of having about a 50% chance of limiting the global increase in average temperature to 2 °C, which would require the concentration of greenhouse gases (GHG) in the atmosphere to be limited to around 450 parts per million of carbon-dioxide equivalent (ppm CO2-eq) in the long-term. The basis of the 450 Scenario is, however, different. Rather than being a projection infl uenced by policy actions, it deliberately selects a plausible energy pathway to achieve the desired goal. Near-term policy assumptions for the period to 2020 draw on measures that were outlined in the WEO Spe-cial Report on Energy and Climate2.
3. GWEC MODERATE SCENARIO
GWEC’s Moderate Scenario (MS) has many of the same characteristics as the NPS, taking into account all policy measures to support
renewable energy either already enacted or in the planning stages around the world, and at the same time assuming that the commit-ments for emissions reductions agreed by governments at COP21 (Paris, 2015) will be implemented, although on the modest side. At the same time it takes into account existing and planned national and regional targets for the uptake of renewable energy in general and wind energy in particular, and assumes that they are in fact met.
Through the period out to 2020, the MS is very close to our annual fi ve-year market forecast3, based on industry orders and planning as well as intelligence from our global network about new and emerging markets. After 2020 it is diffi cult to make a precise forecast given the current set of global uncertainties, but at that stage we assume that an even broader range of governments will begin to respond to essential asks of national energy security and long-term price stability offered by wind energy. Further, the cost of wind continues to come down and the price of conventional generation continues to go up.
4. GWEC ADVANCED SCENARIO
GWEC’s Advanced Scenario (AS) is the most ambitious, and outlines the extent to which the wind industry could grow in a best case Wind Energy Vision. It assumes an unam biguous commitment to renewable energy in line with industry recommendations, the political will to commit to appropriate policies and the political stamina to stick with them. Further, it does NOT assume massive new-build nuclear or a large take up of carbon capture and storage technologies, as is the case in the IEA scenarios.
The AS also assumes that governments enact clear and effective policies on carbon emission reductions in line with the now universally agreed objective of keeping global mean tem-perature rise below 2°C above pre-industrial
2 https://www.iea.org/publications/freepublications/publication/WEO2015SpecialReportonEnergyandClimateChange.pdf
3 http://www.gwec.net/wp-content/uploads/2014/04/Market-Forecast-for-2016-2020-1.jpg

17GLOBAL WIND ENERGY OUTLOOK | 2016
THE GLOBAL WIND ENERGY OUTLOOK SCENARIOS 2
temperatures. Wind power is critical to meet-ing the fi rst objective in that battle - which is getting global emissions to peak and begin to decline before the end of this decade.
PROJECTIONS FOR ELECTRICITY DEMAND DEVELOPMENT
While it is useful to calculate the production from global wind power installations, it is also instructive to put it in the context of global elec-tricity demand, and thereby determine what percentage of the world’s growing demand for electricity can be met by wind. As was the case in past GWEO publications, we have compared each of the four supply scenarios against two different demand scenarios. The fi rst is that used by the IEA for the New Policies Scenario in the 2015 World Energy Outlook, and the latter an Energy Effi ciency Scenario, originally devel-oped by the Ecofys consultancy, later updated
by researchers at the University of Utrecht4, and updated once again by the authors of the Energy [R]evolution, 2015 edition5. The study includes the implementation of best practice existing technologies and a certain share of new effi ciency technologies, while using the same assumption for population and GDP growth over the period as the IEA, and assuming no structural economic changes beyond those in the IEA scenarios. It does not foresee lifestyle changes or loss in comfort levels, nor does it foresee ‘stranded’ assets, i.e., the early retirement of ineffi cient installations in favor of more effi cient ones – which is very conservative given that such early retirement is already beginning to happen and seems likely to increase substantially.
4 http://www.energyblueprint.info/fi leadmin/media/documents/2012/UU_Demand_projections_for energy_revolution_2012_30_3_12.pdf
5 See http://www.greenpeace.org/international/Global/international/publications/climate/2015/Energy-Revolution-2015-Full.pdf, p. 61
© Vestas
18 GLOBAL WIND ENERGY OUTLOOK | 2016
THE GLOBAL WIND ENERGY OUTLOOK SCENARIOS2
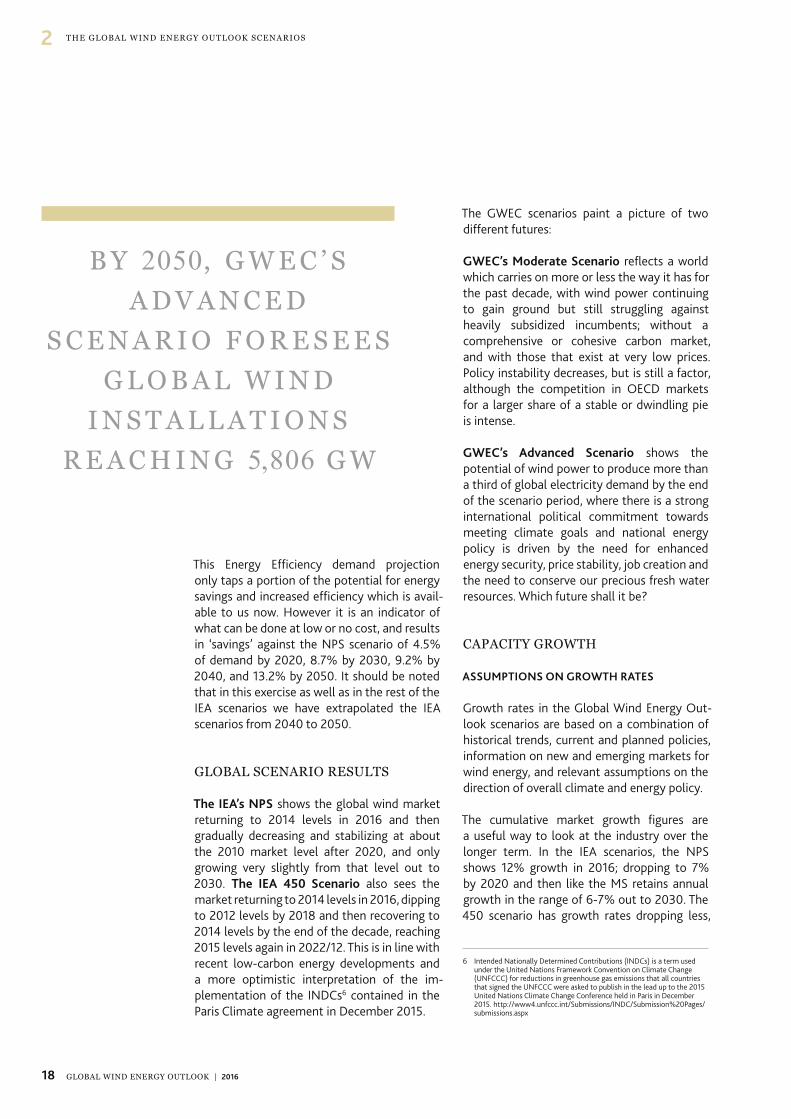
This Energy Effi ciency demand projection only taps a portion of the potential for energy savings and increased effi ciency which is avail-able to us now. However it is an indicator of what can be done at low or no cost, and results in ‘savings’ against the NPS scenario of 4.5% of demand by 2020, 8.7% by 2030, 9.2% by 2040, and 13.2% by 2050. It should be noted that in this exercise as well as in the rest of the IEA scenarios we have extrapolated the IEA scenarios from 2040 to 2050.
GLOBAL SCENARIO RESULTS
The IEA’s NPS shows the global wind market returning to 2014 levels in 2016 and then gradually decreasing and stabilizing at about the 2010 market level after 2020, and only growing very slightly from that level out to 2030. The IEA 450 Scenario also sees the market returning to 2014 levels in 2016, dipping to 2012 levels by 2018 and then recovering to 2014 levels by the end of the decade, reaching 2015 levels again in 2022/12. This is in line with recent low-carbon energy developments and a more optimistic interpretation of the im-plementation of the INDCs6 contained in the Paris Climate agreement in December 2015.
The GWEC scenarios paint a picture of two different futures:
GWEC’s Moderate Scenario refl ects a world which carries on more or less the way it has for the past decade, with wind power continuing to gain ground but still struggling against heavily subsidized incumbents; without a comprehensive or cohesive carbon market, and with those that exist at very low prices. Policy instability decreases, but is still a factor, although the competition in OECD markets for a larger share of a stable or dwindling pie is intense.
GWEC’s Advanced Scenario shows the potential of wind power to produce more than a third of global electricity demand by the end of the scenario period, where there is a strong international political commitment towards meeting climate goals and national energy policy is driven by the need for enhanced energy security, price stability, job creation and the need to conserve our precious fresh water resources. Which future shall it be?
CAPACITY GROWTH
ASSUMPTIONS ON GROWTH RATES
Growth rates in the Global Wind Energy Out-look scenarios are based on a combination of historical trends, current and planned policies, information on new and emerging markets for wind energy, and relevant assumptions on the direction of overall climate and energy policy.
The cumulative market growth fi gures are a useful way to look at the industry over the longer term. In the IEA scenarios, the NPS shows 12% growth in 2016; dropping to 7% by 2020 and then like the MS retains annual growth in the range of 6-7% out to 2030. The 450 scenario has growth rates dropping less,
B Y 2050, G W E C ’ S A D V A N C E D
S C E N A R I O F O R E S E E S G L O B A L W I N D
I N S T A L L A T I O N S R E A C H I N G 5,806 G W
6 Intended Nationally Determined Contributions (INDCs) is a term used under the United Nations Framework Convention on Climate Change (UNFCCC) for reductions in greenhouse gas emissions that all countries that signed the UNFCCC were asked to publish in the lead up to the 2015 United Nations Climate Change Conference held in Paris in December 2015. http://www4.unfccc.int/Submissions/INDC/Submission%20Pages/submissions.aspx

19GLOBAL WIND ENERGY OUTLOOK | 2016
2THE GLOBAL WIND ENERGY OUTLOOK SCENARIOS
holding at about 8% for most of the rest of the decade, increasing to 9% after 2025, and then tapering off again after 2030.
The MS starts with about 15% annual growth in 2016, tapering off gradually to 11% by 2020, and then stabilizes at about 7% over most of the next decade out to 2030. In the AS, annual growth rates start off well below the historical average at 15%; remain steady in the middle of this decade and then taper off to 13% by the end of the decade, dropping to 6% by 2030.
It is worth noting that cumulative market growth fi gures will inevitably drop over time in almost any scenario as the size of the market grows; although even small percentage in-creases a decade out from now will mean a large actual increase in the quantity of wind power deployed.
SCENARIO RESULTS
The IEA New Policies Scenario projects that annual wind energy markets will match the stellar results from 2014 and cross the 50GW
mark in 2016 as well; and then shrink to just under 38 GW/annum by the end of the decade. It then projects an increase to near 2015 levels in the middle of the next decade, gradually decreasing to a net of 43 GW/annum by 2030 and essentially stays in the mid-30s in terms of GWs installed per annum, remaining fl at for the rest of the period out to 2050 in net terms. On the basis of this, cumulative installed capacity would still reach 639 GW by 2020, and 1,260 GW by 2030. The latter is almost 300 GW higher than the NPS projections two years ago. By 2050, NPS foresees global wind installations reaching 2,870 GW.
The 450 Scenario also sees 2016 at 2014 levels, but is substantially higher than NPS in-stallations out to 2020, for a total of 658 GW. It then projects a marked increase in installations with cumulative installed capacity reaching 1,454 GW by 2030, which is almost 200 GW higher than the NPS projections. By 2050, this scenario foresees global wind installations reaching 3,546 GW.
The GWEC Moderate Scenario follows the lines of our short term market projections
GLOBAL CUMULATIVE WIND POWER CAPACITY
0
1,000,000
2,000,000
3,000,000
4,000,000
5,000,000
6,000,000 Advanced ScenarioModerate Scenario450 ScenarioNew Policies ScenarioMW
2013 2015 2020 2030 2040 2050
New Policies ScenarioMW 318,354 432,656 639,478 1,259,974 2,052,583 2,869,611
TWh/a 714 868 1,569 3,311 5,394 7,541
450 ScenarioMW 318,354 432,656 658,009 1,454,395 2,458,757 3,545,595
TWh/a 714 868 1,614 3,822 6,462 9,318
Moderate ScenarioMW 318,354 432,656 797,028 1,675,624 2,767,351 3,983,995
TWh/a 714 868 1,955 4,404 7,273 10,470
Advanced ScenarioMW 318,354 432,656 879,446 2,110,161 3,720,919 5,805,882
TWh/a 714 868 2,157 5,546 9,779 15,258

20 GLOBAL WIND ENERGY OUTLOOK | 2016
THE GLOBAL WIND ENERGY OUTLOOK SCENARIOS2
prepared for our annual market update out to 20207, with annual market size reaching almost 80 GW/annum by 2020 for a total installed capacity of 797 GW. We expect robust growth in the period after 2020. By 2030 total in-stalled capacity would reach nearly 1,676 GW. By 2050, this scenario foresees global wind installations reaching 3,984 GW.
The GWEC Advanced Scenario maintains ambitious growth rates throughout this decade, assuming that a broad, clear commit-ment to the decarbonisation of the electricity sector emerges quickly with the ratifi cation of the 2015 Paris Climate Agreement. Annual market size would top 100 GW by the end of the decade, bringing total installed capacity to just over 879 GW by 2020, and to 2,110 GW
by 2030, which could only occur with com-prehensive and robust climate action globally and essential political will to tackle the climate challenge. By 2050, this scenario foresees global wind installations reaching 5,806 GW. This is almost 3,000 GW higher than the current baseline scenario of the long-term NPS projections for the wind sector.
PRODUCTION AND SHARE OF ELECTRICITY SUPPLY
ASSUMPTIONS ON TURBINE CAPACITY
The rated output, rotor diameter and average height of wind turbines have steadily increased over the years, although the average size of tur-bines varies substantially by country and region. This trend is expected to continue as larger and more effi cient machines are developed for the
7 http://www.gwec.net/wp-content/uploads/2014/04/Market-Forecast-for-2016-2020-1.jpg
REGIONAL BREAKDOWN: 450 SCENARIOOECD Asia Oceania 3%
PR China 31%
Non-OECD Asia 3%India 11%Eastern Europe/Eurasia 0%
Middle East 2%Africa 2%
OECD Europe 24%
LatinAmerica
3%
North America 21%
20302020
3%
33%
1%10%
20%
3%
29%1%0%0%
2020 2030North America 131,659 303,322Latin America 18,913 35,830OECD Europe 190,855 355,769Africa 7,207 23,005Middle East 1,501 30,124Eastern Europe/Eurasia 722 1,982India 67,098 155,736Non-OECD Asia 6,411 49,250PR China 216,806 452,081OECD Asia Oceania 16,836 47,295
Global Total / MW 658,009 1,454,395
REGIONAL BREAKDOWN: NEW POLICIES SCENARIOOECD Asia Oceania 3%
PR China 31%
Non-OECD Asia 2%India 9%Eastern Europe/Eurasia 0%Middle East 1%
Africa 1%OECD Europe 28%
LatinAmerica
3%
North America 22%
20302020
2%
33%
1%8%
21%
3%
31%1%
0%0%
2020 2030North America 126,961 252,784Latin America 18,749 36,196OECD Europe 186,878 323,091Africa 6,575 15,908Middle East 1,072 8,009Eastern Europe/Eurasia 668 1,117India 50,063 111,938Non-OECD Asia 5,213 21,796PR China 201,178 364,801OECD Asia Oceania 15,322 34,598
Global Total / MW 639,478 1,259,974
21GLOBAL WIND ENERGY OUTLOOK | 2016
2THE GLOBAL WIND ENERGY OUTLOOK SCENARIOS
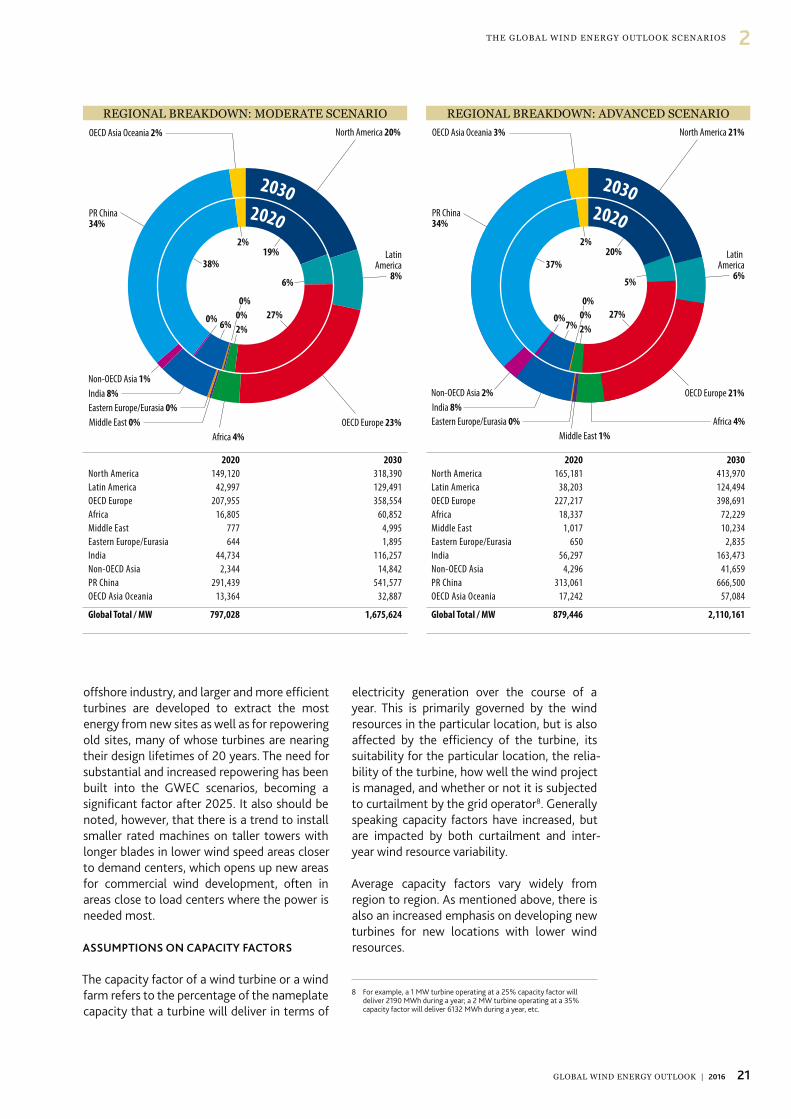
offshore industry, and larger and more effi cient turbines are developed to extract the most energy from new sites as well as for repowering old sites, many of whose turbines are nearing their design lifetimes of 20 years. The need for substantial and increased repowering has been built into the GWEC scenarios, becoming a signifi cant factor after 2025. It also should be noted, however, that there is a trend to install smaller rated machines on taller towers with longer blades in lower wind speed areas closer to demand centers, which opens up new areas for commercial wind development, often in areas close to load centers where the power is needed most.
ASSUMPTIONS ON CAPACITY FACTORS
The capacity factor of a wind turbine or a wind farm refers to the percentage of the nameplate capacity that a turbine will deliver in terms of
electricity generation over the course of a year. This is primarily governed by the wind resources in the particular location, but is also affected by the effi ciency of the turbine, its suitability for the particular location, the relia-bility of the turbine, how well the wind project is managed, and whether or not it is subjected to curtailment by the grid operator8. Generally speaking capacity factors have increased, but are impacted by both curtailment and inter-year wind resource variability.
Average capacity factors vary widely from region to region. As mentioned above, there is also an increased emphasis on developing new turbines for new locations with lower wind resources.
8 For example, a 1 MW turbine operating at a 25% capacity factor will deliver 2190 MWh during a year; a 2 MW turbine operating at a 35% capacity factor will deliver 6132 MWh during a year, etc.
REGIONAL BREAKDOWN: MODERATE SCENARIOOECD Asia Oceania 2%
PR China 34%
Non-OECD Asia 1%India 8%Eastern Europe/Eurasia 0%Middle East 0%
Africa 4%OECD Europe 23%
LatinAmerica
8%
North America 20%
20302020
2%
38%
0% 6%
19%
6%
27%2%0%0%
2020 2030North America 149,120 318,390Latin America 42,997 129,491OECD Europe 207,955 358,554Africa 16,805 60,852Middle East 777 4,995Eastern Europe/Eurasia 644 1,895India 44,734 116,257Non-OECD Asia 2,344 14,842PR China 291,439 541,577OECD Asia Oceania 13,364 32,887
Global Total / MW 797,028 1,675,624
REGIONAL BREAKDOWN: ADVANCED SCENARIOOECD Asia Oceania 3%
PR China 34%
Non-OECD Asia 2%India 8%Eastern Europe/Eurasia 0%
Middle East 1%Africa 4%
OECD Europe 21%
Latin America
6%
North America 21%
20302020
2%
37%
0%7%
20%
5%
27%2%0%0%
2020 2030North America 165,181 413,970Latin America 38,203 124,494OECD Europe 227,217 398,691Africa 18,337 72,229Middle East 1,017 10,234Eastern Europe/Eurasia 650 2,835India 56,297 163,473Non-OECD Asia 4,296 41,659PR China 313,061 666,500OECD Asia Oceania 17,242 57,084
Global Total / MW 879,446 2,110,161

22 GLOBAL WIND ENERGY OUTLOOK | 2016
THE GLOBAL WIND ENERGY OUTLOOK SCENARIOS2
WIND POWER SHARE OF GLOBAL ELECTRICITY DEMAND%
0
10
20
30
40
50 Advanced Scenario – Energy Efficiency demand projectionAdvanced Scenario – IEA demand projection
Moderate Scenario – Energy Efficiency demand projectionModerate Scenario – IEA demand projection
450 Scenario – Energy Efficiency demand projection450 Scenario – IEA demand projection
New Policies Scenario – Energy Efficiency demand projectionNew Policies Scenario – IEA demand projection
2013 2015 2020 2030 2040 2050
New Policies ScenarioIEA demand projection 3% 4% 7% 11% 14% 18%Energy Effi ciency demand projection 3% 4% 7% 12% 16% 20%
450 ScenarioIEA demand projection 3% 4% 7% 13% 17% 22%Energy Effi ciency demand projection 3% 4% 7% 14% 19% 25%
Moderate ScenarioIEA demand projection 3% 4% 8% 14% 20% 25%Energy Effi ciency demand projection 3% 4% 9% 16% 22% 28%
Advanced ScenarioIEA demand projection 3% 4% 9% 18% 26% 36%Energy Effi ciency demand projection 3% 4% 9% 20% 29% 41%
SPECIFIC COSTS (€/kW)
1,300
1,400
1,600
1,500
Advanced ScenarioModerate Scenario450 ScenarioNew Policies Scenario
€/kW
2013 2015 2020 2030 2040 2050
New Policies Scenario 1,592 1,571 1,541 1,465 1,472 1,469
450 Scenario 1,592 1,571 1,550 1,426 1,417 1,418
Moderate Scenario 1,592 1,571 1,518 1,445 1,408 1,408
Advanced Scenario 1,592 1,571 1,452 1,379 1,328 1,321

23GLOBAL WIND ENERGY OUTLOOK | 2016
2THE GLOBAL WIND ENERGY OUTLOOK SCENARIOS
These ‘low wind speed’ turbines generally are on taller towers with smaller generators and larger blades, and operate with a higher capacity factor. India is one of the key markets for such machines.
However, for the GWEC scenarios we have left the average global capacity factor at 28% for the period out to 2030, increasing to 30% after that date for the rest of the scenario period. The reality is that it will probably be greater than that. For the regional scenarios, however, we have used capacity factors slightly higher than the global average in OECD North America, Latin America, Africa and OECD Asia Pacifi c; and slightly lower in India and China, refl ecting the current situation in those markets.
SCENARIO RESULTS
INVESTMENT
The capital cost of turbines has been decreas-ing, precipitously in some markets over the past several years, both in adjusted and in absolute terms. Of late, this has been largely the result of market forces, but at the same time, continuous design refi nements and
experience with mass producing an increasing number of the same or similar turbines have decreased the cost of the technology itself. The other major factor, commodity prices, has contributed to the decrease in prices, although the industry is susceptible to price spikes, particularly for steel and copper. Signifi cant regional variations are seen, as both competition and other underlying market factors affect the fi nal costs. Further inter-annual variations as a result of market forces, commodity prices and the rate of infl ation can have an impact, which is beyond the scope of the scenarios discussed.
Total project costs are a more complex story, as many administrative and regulatory factors come into play, as well as the highly variable costs of labor, permitting and development in different markets.
The development of installed project costs in the GWEC scenarios assumes gradually decreasing costs in absolute terms, refl ecting the projected growth of the industry. Re-gardless, the growth of the wind power industry is attracting increased investment. Last year almost €110 billion was invested in new wind power development, of which
© Bent Nielsen and Danish Wind Industry
Association

24 GLOBAL WIND ENERGY OUTLOOK | 2016
THE GLOBAL WIND ENERGY OUTLOOK SCENARIOS2
almost €67 billion was in developing and emerging economies9.
In the NPS the costs remain roughly static over the period out to 2030. Capital costs per kilo-watt of installed capacity were considered to have averaged €1,571 in 2015. For the NPS they don’t change signifi cantly over the scenario period, ending up at €1,465/kw in 2030. In the 450 Scenario the prices reach €1,550/kW in 2020 and €1,426/kW in 2030.
In the MS prices drop to about €1,518/kw in 2020 and to €1,445/kw by 2030; and in the Advanced Scenario, with rapid scale up, costs drop more rapidly, down to €1,452 by 2020 and to €1,379 by 2030.
In the NPS, the annual investment decreases to €57.6 billion in 2020, and then slowly rises to €121 billion in 2030. The 450 scenario sees annual investment levels fall below the 2015 levels to €85 billion in 2020, and then over the next ten years double to €163 billion annually by 2030.
In the MS, annual investment increases to nearly €120 billion by 2020 and to €155 billion per year by 2030. Finally, in the AS, annual investments are around €150 billion by 2020, and then rise to €199 billion in 2030.
9 http://fs-unep-centre.org/sites/default/fi les/publications/globaltrendsin-renewableenergyinvestment2016lowres_0.pdf
TOTAL INSTALLED COST, INVESTMENT AND EMPLOYMENT
MW
0
50,000
100,000
150,000
200,000
250,000 Advanced ScenarioModerate Scenario450 ScenarioNew Policies Scenario
2013 2015 2020 2030 2040 2050
New Policies ScenarioAnnual Installation MW 35,787 63,350 37,370 82,428 70,955 76,955Cost € / kW 1,592 1,571 1,541 1,465 1,472 1,469
Investment € billion /year 57 100 58 121 104 113
Employment Job / year 606,076 1,029,681 696,841 936,232 1,080,374 1,316,408
450 ScenarioAnnual Installation MW 35,787 63,350 54,962 114,494 101,525 121,998Cost € / kW 1,592 1,571 1,550 1,426 1,417 1,418Investment € billion /year 57 100 85 163 144 173Employment Job / year 606,076 1,029,681 931,654 1,385,182 1,370,137 1,682,231
Moderate ScenarioAnnual Installation MW 35,787 63,350 79,005 107,488 125,397 118,604Cost € / kW 1,592 1,571 1,518 1,445 1,408 1,408Investment € billion /year 57 100 120 155 177 167Employment Job / year 606,076 1,029,681 1,290,079 1,374,111 1,469,931 1,866,633
Advanced ScenarioAnnual Installation MW 35,787 63,350 103,423 144,165 196,748 207,879Cost € / kW 1,592 1,571 1,452 1,379 1,328 1,321Investment € billion /year 57 100 150 199 261 275Employment Job / year 606,076 1,029,681 1,634,721 2,426,331 3,588,875 4,202,612

25GLOBAL WIND ENERGY OUTLOOK | 2016
2THE GLOBAL WIND ENERGY OUTLOOK SCENARIOS
EMPLOYMENT
The International Renewable Energy Agency’s (IRENA) annual review of jobs in RE sector stated that nearly 1.1 million people were em-ployed by the global wind power industry at the end of 201510. Driven by favorable policies and declining technology costs, rising deployment of renewables in Asian markets kept driving the regional shifts in job numbers from traditional OECD markets.
The assumption this report continues to make, which is verifi ed by such studies as do exist, is that for every new megawatt of capacity in-stalled in a country in a given year, 14 person/year of employment is created through manufacturing, component supply, wind farm development, construction, transportation, etc. While there is quite substantial regional vari-ation, this seems to work as a global average. As production processes are optimized, we project that this level will decrease to 13 person/year of employment per new megawatt installed by 2020, and to 12 person/year of employment by 2030.
In addition, 0.33 person/year of employment per MW of installed capacity are judged to be needed for operations and maintenance work at existing wind farms. Again, there will be sub-stantial regional variations, but this seems to work as a global number.
The wind industry creates a large number of skilled, semi-skilled and unskilled jobs, and this has taken on an increasing political as well as economic importance. The macro-economic effects of the development of the wind power sector as well as the renewable energy sector as a whole is increasingly a factor in political decision making on future energy choices.
Given the assumptions, and on the basis of existing numbers available, the global wind industry employed about 1.1 million people, as of the end of 2015.
Under the NPS, this number would drop to 696,000 jobs in the sector and slowly rise towards 936,232 jobs by 2030. Under the 450 Scenario, this number would stay roughly the same out to 2020 and grow strongly to reach nearly 1.39 million jobs by 2030.
In the MS the global wind sector sees 1.29 mil-lion by 2020, and nearly 1.4 million by 2030.In the AS, employment numbers near 1.6 million jobs, and reaches 2.4 million by 2030.
CO2 REDUCTION
Wind power’s environmental benefi ts include the elimination of local air pollution and nearly zero water consumption. However, the greatest benefi t is wind power's contribution to reduction of carbon dioxide emissions from the power sector, which is the single largest an-thropogenic contributor to the global climate change problem.
Wind energy technology has an extremely good energy balance. All of the CO2 emissions related to the manufacturing, installation,
T H E W I N D I N D U S T R Y C R E A T E S A L A R G E N U M B E R O F J O B S ,
A N D T H I S H A S T A K E N O N A N I N C R E A S I N G P O L I T I C A L A S W E L L
A S E C O N O M I C I M P O R T A N C E
10 http://www.irena.org/DocumentDownloads/Publications/IRENA_RE_Jobs_Annual_Review_2016.pdf

26 GLOBAL WIND ENERGY OUTLOOK | 2016
THE GLOBAL WIND ENERGY OUTLOOK SCENARIOS2
servicing and decommissioning of a turbine are generally ‘paid back’ after the fi rst 3 to 9 months of operation. For the rest of its 20-year design lifetime, the turbine operates without producing any of the harmful greenhouse gases that are already disrupting life on earth.
The benefi t obtained from wind power in relation to CO2 emissions depends entirely on what sort of power plant it displaces. If it displaces hydro or nuclear power, the benefi t is small; but if it replaces coal or gas, then the benefi t is enormous.
Emissions from fossil fuel plants range from around 500g CO2 /kWh up to 1200g CO2/kWh or more for the dirtiest fuels. On the basis of the current electricity distribution, we have calculated that 600g CO2 /kWh is a good average number to characterize the savings generated by wind power, although the regional variations will be signifi cant.
Annual reductions in CO2 from existing wind power plants were about 521 million tonnes in
2015. Under the NPS, this is expected to rise to 941 million tonnes annually by 2020 and up to 1,987 tonnes per year by 2030. Under the 450 Scenario, this is expected to rise to 968 million tonnes annually by 2020 and up to 2,293 tonnes / annum by 2030.
The MS implies savings of over 1.17 billion tonnes of CO2 /annum by 2020 and more than 2.6 billion tonnes by 2030; while the GWEO AS would result in savings of nearly 1.29 billion tonnes of CO2 per year by 2020, and 3.3 billion tonnes/annum by 2030.
Over the long-term the AS will bring almost double the savings in CO2 annually. In 2050 the AS is foreseen to bring about 9.2 billion tonnes of CO2emission reduction annually. In comparison the 450 Scenario forecasts annual CO2emission reduction of 5.6 billion tonnes.
AVOIDED CO2 SINCE 2006
In cumulative terms, the NPS has wind power saving nearly 7.2 billion tonnes by 2020, and more than 21 billion tonnes by 2030. In cumulative terms, the 450 Scenario has wind power saving nearly 7.3 billion tonnes by 2020, and nearly 23 billion tonnes by 2030.
The MS results in nearly 7.9 billion tonnes in cumulative savings by 2020, and 26.4 billion tonnes of CO2 savings by 2030. The AS yields cumulative CO2 savings of 8.2 billion tonnes by 2020, and 30.7 billion tonnes by 2030.
These are signifi cant reductions across all scenarios, but the critical issue here is not just the total volume of reductions, but the speed at which these savings are achieved, as GHGs are long-lived gases, and the imperative is for early emissions reductions to achieve the greatest benefi t.
Wind power’s scalability and its speed of de-ployment makes it an ideal technology to bring about the early emissions reductions which are required if we are to keep the window open for keeping global mean temperature rise to less than 2°C above pre-industrial levels.
COP21 © unclimatechange_fl ickr

27GLOBAL WIND ENERGY OUTLOOK | 2016
2THE GLOBAL WIND ENERGY OUTLOOK SCENARIOS
CUMULATIVE CO2 EMISSIONS REDUCTIONS
MT CO2
0
40,000
80,000
120,000
160,000Advanced ScenarioModerate Scenario450 ScenarioNew Policies Scenario
2013 2015 2020 2030 2040 2050
ANNUAL CO2 EMISSIONS REDUCTIONS
MT CO2
0
2,000
4,000
6,000
8,000
10,000 Advanced ScenarioModerate Scenario450 ScenarioNew Policies Scenario
2013 2015 2020 2030 2040 2050
ANNUAL AND CUMULATIVE CO2 EMISSIONS REDUCTIONS (MT CO2)
2013 2015 2020 2030 2040 2050
New Policies ScenarioAnnual CO2 savings 428 521 941 1,987 3,237 4,525Cumulative CO2 savings 2,112 3,105 7,247 21,223 48,137 87,610
450 ScenarioAnnual CO2 savings 428 521 968 2,293 3,877 5,591Cumulative CO2 savings 2,112 3,105 7,279 22,730 54,687 102,639
Moderate ScenarioAnnual CO2 savings 428 521 1,173 2,642 4,364 6,282Cumulative CO2 savings 2,112 3,105 7,850 26,393 61,770 116,043
Advanced ScenarioAnnual CO2 savings 428 521 1,294 3,327 5,867 9,155Cumulative CO2 savings 2,112 3,105 8,153 30,702 76,953 153,634

28 GLOBAL WIND ENERGY OUTLOOK | 2016
CHAPTER TITLE1
Africa Algeria, Angola, Benin, Botswana, Burkina Faso, Burundi, Cameroon, Cape Verde, Central African Republic, Chad, Comoros, Congo, Democratic Republic of Congo, Cote d’Ivoire, Djibouti, Egypt, Equatorial Guinea, Eritrea, Ethiopia, Gabon, Gambia, Ghana, Guinea, Guinea-Bissau, Kenya, Lesotho, Liberia, Libya, Madagascar, Malawi, Mali, Mauritania, Mauritius, Morocco, Mozambique, Namibia, Niger, Nigeria, Reunion, Rwanda, Sao Tome and Principe, Senegal, Seychelles, Sierra Leone, Somalia, South Africa, Sudan, Swaziland, United Republic of Tanzania, Togo, Tunisia, Uganda, Zambia, Zimbabwe
Eastern Europe/Eurasia Albania, Armenia, Azerbaijan, Belarus, Bosnia-Herzegovina, Croatia, Serbia and Montenegro, the former Republic of Macedonia, Georgia, Kazakhstan, Kyrgyzstan, Moldova, Russia, Tajikistan, Turkmenistan, Ukraine, Uzbekistan
EU 28 Austria, Belgium, Bulgaria, Croatia, Republic of Cyprus, Czech Republic, Denmark, Estonia, Finland, France, Germany, Greece, Hungary, Ireland, Italy, Latvia, Lithuania, Luxembourg, Malta, Netherlands, Poland, Portugal, Romania, Slovakia, Slovenia, Spain, Sweden, United Kingdom
India India
Latin America Antigua and Barbuda, Aruba, Argentina, Bahamas, Barbados, Belize, Bermuda, Bolivia, Brazil, the British Virgin Islands, the Cayman Islands, Chile, Colombia, Costa Rica, Cuba, Dominica, the Dominican Republic, Ecuador, El Salvador, the Falkland Islands, French Guyana, Grenada, Guadeloupe, Guatemala, Guyana, Haiti, Honduras, Jamaica, Martinique, Montserrat, Netherlands Antilles, Nicaragua, Panama, Paraguay, Peru, St. Kitts and Nevis, Saint Lucia, Saint Pierre et Miquelon, St. Vincent and the Grenadines, Suriname, Trinidad and Tobago, the Turks and Caicos Islands, Uruguay, Venezuela
Middle East Bahrain, Iran, Iraq, Israel, Jordan, Kuwait, Lebanon, Oman, Qatar, Saudi Arabia, Syria, United Arab Emirates, Yemen
Non-OECD Asia Afghanistan, Bangladesh, Bhutan, Brunei, Cambodia, Chinese Taipei, Cook Islands, East Timor, Fiji, French Polynesia, Indonesia, Kiribati, North Korea, Laos, Macao, Malaysia, Maldives, Mongolia, Myanmar, Nepal, New Caledonia, Pakistan, Papua New Guinea, Philippines, Samoa, Singapore, Solomon Islands, Sri Lanka, Thailand, Tonga, Vietnam, Vanuatu
North America Canada, Mexico, United States
OECD Asia Oceania Australia, Japan, South Korea, New Zealand
OECD Europe Austria, Belgium, Czech Republic, Denmark, Estonia, Finland, France, Germany, Greece, Hungary, Iceland, Ireland, Italy, Luxembourg, the Netherlands, Norway, Poland, Portugal, Slovak Republic, Slovenia, Spain, Sweden, Switzerland, Turkey, United Kingdom
PR China People’s Republic of China including Hong Kong
NORTH AMERICATotal Capacity in MW 2013 2014 2015 2020 2030 2040 2050New Policies Scenario 70,640 77,935 88,749 126,961 252,784 377,743 505,383
450 Scenario 70,640 77,935 88,749 131,659 303,322 492,384 717,528Moderate Scenario 70,640 77,935 88,749 149,120 318,390 491,120 661,669Advanced Scenario 70,640 77,935 88,749 165,181 413,970 643,214 919,379
LATIN AMERICATotal Capacity in MW 2013 2014 2015 2020 2030 2040 2050New Policies Scenario 4,747 8,568 12,220 18,749 36,196 66,425 95,189
450 Scenario 4,747 8,568 12,220 18,913 35,830 82,150 130,895Moderate Scenario 4,747 8,568 12,220 42,997 129,491 234,631 352,151Advanced Scenario 4,747 8,568 12,220 38,203 124,494 276,050 481,487
AFRICATotal Capacity in MW 2013 2014 2015 2020 2030 2040 2050New Policies Scenario 1.493 2.426 3.262 6.575 15.908 31.254 50.216
450 Scenario 1.493 2.426 3.262 7.207 23.005 56.557 96.862Moderate Scenario 1.493 2.426 3.262 16.805 60.852 128.905 227.443Advanced Scenario 1.493 2.426 3.262 18.337 72.229 157.411 288.864
OECD EUROPETotal Capacity in MW 2013 2014 2015 2020 2030 2040 2050New Policies Scenario 119,810 132,155 145,416 186,878 323,091 476,388 607,085
450 Scenario 119,810 132,155 145,416 190,855 355,769 549,187 741,833Moderate Scenario 119,810 132,155 145,416 207,955 358,554 512,002 641,939Advanced Scenario 119,810 132,155 145,416 227,217 398,691 567,937 703,724
EU 28Total Capacity in MW 2013 2014 2015 2020 2030 2040 2050New Policies Scenario 117,472 129,060 141,578 180,755 311,273 455,984 578,681
450 Scenario 117,472 129,060 141,578 182,105 328,938 499,517 665,616Moderate Scenario 117,472 129,060 141,578 200,462 320,334 455,149 546,978Advanced Scenario 117,472 129,060 141,578 220,342 360,526 517,014 590,850
REGIONAL BREAKDOWN OF CUMULATIVE CAPACITY UP TO 2050

29GLOBAL WIND ENERGY OUTLOOK | 2016
1CHAPTER TITLE
PR CHINATotal Capacity in MW 2013 2014 2015 2020 2030 2040 2050New Policies Scenario 91,413 114,609 145,362 201,178 364,801 600,590 794,013
450 Scenario 91,413 114,609 145,362 216,806 452,081 735,458 1,010,198Moderate Scenario 91,413 114,609 145,362 291,439 541,577 868,779 1,150,189Advanced Scenario 91,413 114,609 145,362 313,061 666,500 1,189,629 1,789,753
GLOBAL TOTALTotal Capacity in MW 2013 2014 2015 2020 2030 2040 2050New Policies Scenario 318,354 369,596 432,656 639,478 1,259,974 2,052,583 2,869,611
450 Scenario 318,354 369,596 432,656 658,009 1,454,395 2,458,757 3,545,595Moderate Scenario 318,354 369,596 432,656 797,028 1,675,624 2,767,351 3,983,995Advanced Scenario 318,354 369,596 432,656 879,446 2,110,161 3,720,919 5,805,882
OECD ASIA OCEANIATotal Capacity in MW 2013 2014 2015 2020 2030 2040 2050New Policies Scenario 7,098 7,846 8,695 15,322 34,598 60,494 90,842
450 Scenario 7,098 7,846 8,695 16,836 47,295 82,575 130,944Moderate Scenario 7,098 7,846 8,695 13,364 32,887 68,136 128,583Advanced Scenario 7,098 7,846 8,695 17,242 57,084 107,808 187,579
NON-OECD ASIATotal Capacity in MW 2013 2014 2015 2020 2030 2040 2050New Policies Scenario 562 861 861 5,213 21,796 58,854 114,834
450 Scenario 562 861 861 6,411 49,250 111,702 204,530Moderate Scenario 562 861 861 2,344 14,842 49,388 124,912Advanced Scenario 562 861 861 4,296 41,659 146,439 371,895
EASTERN EUROPE / EURASIATotal Capacity in MW 2013 2014 2015 2020 2030 2040 2050New Policies Scenario 390 516 533 668 1,117 2,204 3,201
450 Scenario 390 516 533 722 1,982 4,551 7,149Moderate Scenario 390 516 533 644 1,895 5,247 10,824Advanced Scenario 390 516 533 650 2,835 7,454 14,163
MIDDLE EASTTotal Capacity in MW 2013 2014 2015 2020 2030 2040 2050New Policies Scenario 99 99 216 1,072 8,009 41,573 101,051
450 Scenario 99 99 216 1,501 30,124 89,366 147,344Moderate Scenario 99 99 216 777 4,995 16,085 35,147Advanced Scenario 99 99 216 1,017 10,234 42,623 96,128
INDIATotal Capacity in MW 2013 2014 2015 2020 2030 2040 2050New Policies Scenario 20,150 22,465 25,088 50,063 111,938 184,838 256,789
450 Scenario 20,150 22,465 25,088 67,098 155,736 254,827 358,314Moderate Scenario 20,150 22,465 25,088 44,734 116,257 227,137 372,830Advanced Scenario 20,150 22,465 25,088 56,297 163,473 294,184 452,197

31GLOBAL WIND ENERGY OUTLOOK | 2016
1CHAPTER TITLE
3
T H E F U T U R E O F W I N D
A ll analyses of the global energy picture today say that the wind industry has
a ‘bright future’. Having experienced double digit cumulative growth for nearly twenty years, wind is unique among modern manu-facturing industries, to the point where the fastest growing job in the United States is ‘wind energy technician’.
But how bright? Left to its own devices, market forces alone would generate steady growth for the sector, due to its low cost, speed of deployment and the stability it brings to power prices. Of course, energy markets are never left to their own devices. Public policy, tax policies, subsidies and clean air, water and climate legislation and regulation, among others, have a dramatic effect on what the power markets look like, which technologies are favored, and how the system is forced to adapt.
There are two overarching questions which will have more than anything else to do with the rate and scope of wind power’s expansion out to 2020, 2030 and to 2050: 1) Will humanity once and for all join forces to combat the existential threat of climate change? The Paris Agreement gives hope that this might be the case. The discourse in the current US presi-
dential election campaign does not; 2) Is there some miraculous technological breakthrough just around the corner that will transform the power sector without the need for wind, solar and other existing technologies? It doesn’t seem likely, but it can never be ruled out.
Answering those two questions is far beyond the scope of this report, or of the wind (or any other) industry. But this report is the best look at the future of wind energy based on what we know and what we can reasonably expect to happen. History viewed in retrospect rarely looks like that, but we shall see.
WHAT HAS CHANGED?
WIND HAS BECOME A MAINSTREAM POWER SOURCE
Wind provides ~4% of global electricity supply and is growing rapidly. Wind supplied more than 40% of Denmark’s total power generation last year, 23% in Portugal and Ireland, ~20% in Uruguay, 19% in Spain, and 15% in Germany. The US state of Iowa sourced 31% of its elec-tricity from wind in 2015, South Dakota 25%, Kansas 24%, Oklahoma 18% and 10% in Texas;
© Puget Sound Energy

32 GLOBAL WIND ENERGY OUTLOOK | 2016
THE FUTURE OF WIND3
and South Australia was around 40%. In 2015, wind was the largest single source (nearly 50%) of all increase in electricity generation globally.
PRICES HAVE FALLEN DRAMATICALLY
Wind is the cheapest way to add capacity to the grid in a large number of markets, becoming the utility option of choice. Very low prices across South America and Africa and in the United States are becoming the new normal, as both the technology and the industry matures and becomes more competitive. In the US, the cost of wind energy has dropped by more than 65% in the past 6 years.1
INTEGRATION
With the increasing penetration of wind power in a larger number of markets, differing experiences have shown that managing large penetrations of variable renewables (wind and solar) can be handled without threatening the stability of the power system, and indeed, in many cases it enhances it, as the system is less vulnerable to the failure of a single large source2. Increased interconnection, improved
forecasting and facilities for demand manage-ment only increase possible penetration levels. As the Portuguese Secretary of State for Energy pointed out a couple of years ago: “We recently had a situation where we were getting more than 90% of our power from wind alone. And you know what happened? Nothing.”
GLOBAL SPREAD
As a look at our country by country break-down3 shows, wind has moved far beyond the ‘traditional’ markets in North America, Europe and (more recently) China and India: Brazil, Mexico, Chile, Peru, Uruguay and Argentina; South Africa, Ethiopia, Egypt and Morocco; and Iran, the Philippines, Indonesia, and Vietnam are now the new markets to watch. For four out of the last fi ve years the majority of new in-stallations have taken place outside the OECD, and that is expected to continue.
WHAT HASN’T CHANGED?
HUGE SUBSIDIES TO FOSSIL FUELS AND NUCLEAR
This is many times the support given to re-newables. How many times depends on what you include. Estimates for annual fossil fuel subsidies range from a low of $US 5-600 million/annum, up to more than $US 5 trillion according to the International Monetary Fund, which includes the damage to climate, human health and the biosphere4. While there have been some moves for subsidy reform in some countries, the basic picture hasn’t changed.
INTERNATIONAL POLICY IN THE ENERGY SECTOR
Despite the change in rhetoric, international fi nancial institutions are still spending more money supporting fossil fuels than they are
WIND IS THE CHEAPEST WAY TO ADD CAPACITY
TO THE GRID IN A LARGE NUMBER OF MARKETS, BECOMING THE UTILITY OPTION
OF CHOICE
1 https://cleantechnica.com/2016/06/16/us-wind-industry-highlights-66-drop-costs-wind-generated-electricity/
2 https://www.windpowerengineering.com/policy/awea-interim-ceo-rob-gramlich-addresses-house-committee-on-energy-power/
3 http://www.gwec.net/wp-content/uploads/2012/06/Global-Installed-Wind-Power-Capacity-MW-–-Regional-Distribution.jpg
4 https://www.imf.org/external/pubs/ft/wp/2015/wp15105.pdf

33GLOBAL WIND ENERGY OUTLOOK | 2016
3THE FUTURE OF WIND
renewables, with the World Bank leading the charge5. But why should we surprised, since their ultimate decision making body is com-posed of national government representatives whose own governments are doing the same thing?
DETRACTORS PROMOTE MYTHS
Mostly fi nanced and promoted by incumbent energy interests, gainsaying the positive bene-fi ts of wind power and other renewables has become almost as large a business for inter-net cranks and trolls and unapologetic fossil fuel industry shills as climate skepticism; and with as little underlying truth. They are too numerous to go into here, but useful industry rebuttal can be found at these links6.
AMBIGUITY AND INSTABILITY OF GOVERNMENT POLICY
The steady growth and development of the renewable energy sector relies upon stable and predictable government policies. It is still the case that far too many governments talk out of both sides of their mouths (see subsidies,
above) and make rapid and sometimes retro-active policy changes which are very damaging to the sector. In the worlds of IEA (then Chief Economist) Executive Director Fatih Birol:
“But while variability of renewables is a challenge that energy systems can learn to adapt to, variability of policies poses a far greater risk.”7
SO WHAT DO WE KNOW ABOUT THE FUTURE?
Without attempting to answer the un-answerable questions about human response to climate change and technological miracles, there are some key developments which seem very likely to occur in the wind industry over the coming decades. How fast and how far they go will depend on the broad commitment to a clean energy system globally.
5 http://blueandgreentomorrow.com/2016/09/22/bottom-class-two-faced-world-bank-climate-change-scorecard/
6 http://www.ewea.org/uploads/pics/Windpower_Myths.png; http://www.distgen.co/top-10-wind-energy-myths-busted/; http://www.aweablog.org/fact-check-awea-represents-american-wind-power/
7 https://www.iea.org/newsroomandevents/pressreleases/2015/october/renewables-to-lead-world-power-market-growth-to-2020.html
Fukushima 7MW fl oater in Nagasaki© FukushimaFORWARD MHI
34 GLOBAL WIND ENERGY OUTLOOK | 2016
CHAPTER TITLE1
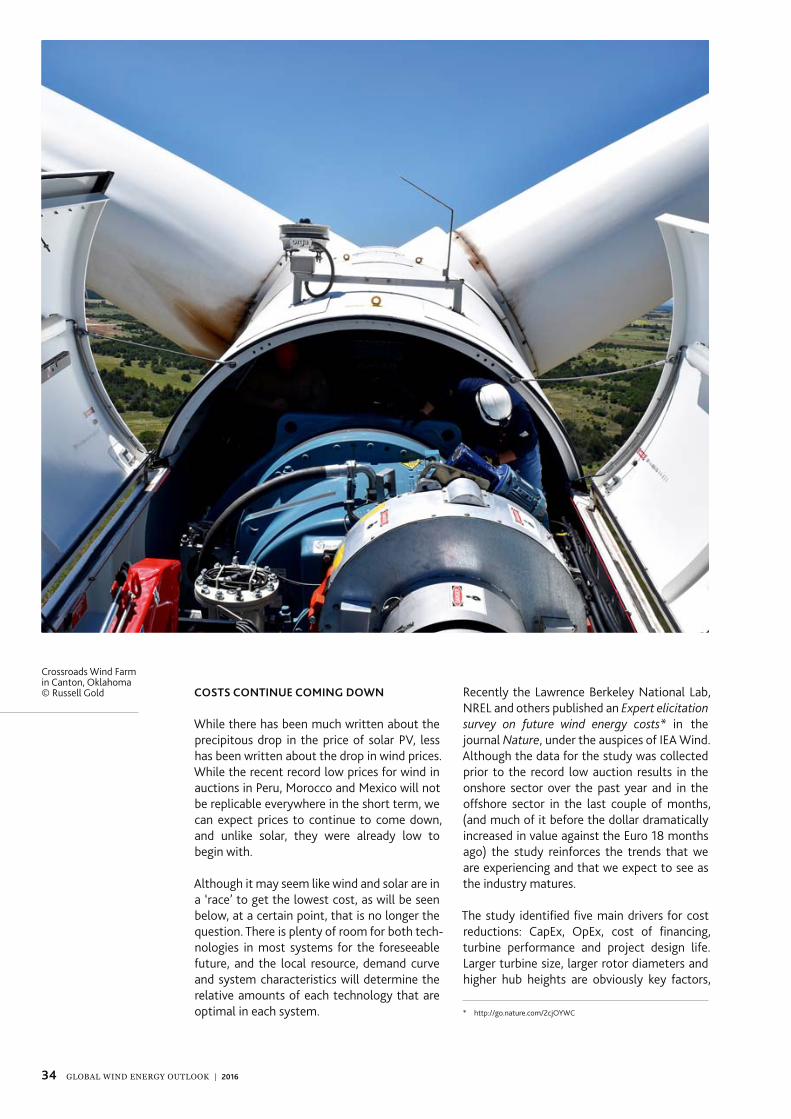
COSTS CONTINUE COMING DOWN
While there has been much written about the precipitous drop in the price of solar PV, less has been written about the drop in wind prices. While the recent record low prices for wind in auctions in Peru, Morocco and Mexico will not be replicable everywhere in the short term, we can expect prices to continue to come down, and unlike solar, they were already low to begin with.
Although it may seem like wind and solar are in a ‘race’ to get the lowest cost, as will be seen below, at a certain point, that is no longer the question. There is plenty of room for both tech-nologies in most systems for the foreseeable future, and the local resource, demand curve and system characteristics will determine the relative amounts of each technology that are optimal in each system.
Recently the Lawrence Berkeley National Lab, NREL and others published an Expert elicitation survey on future wind energy costs* in the journal Nature, under the auspices of IEA Wind. Although the data for the study was collected prior to the record low auction results in the onshore sector over the past year and in the offshore sector in the last couple of months, (and much of it before the dollar dramatically increased in value against the Euro 18 months ago) the study reinforces the trends that we are experiencing and that we expect to see as the industry matures.
The study identifi ed fi ve main drivers for cost reductions: CapEx, OpEx, cost of fi nancing, turbine performance and project design life. Larger turbine size, larger rotor diameters and higher hub heights are obviously key factors,
Crossroads Wind Farm in Canton, Oklahoma© Russell Gold
* http://go.nature.com/2cjOYWC

35GLOBAL WIND ENERGY OUTLOOK | 2016
3THE FUTURE OF WIND
but improved operation, siting and improved fi nancial conditions for wind projects also play a role. The study reinforces the trends that we are experiencing and that we expect to see as the industry matures.
While prices for onshore wind have been competitive in an increasing number of markets, the recent drop in offshore prices is also encouraging. The record low prices in the Dutch auction for 700 MW at the Borssele site near the Belgian border in the beginning of July 1016 - less than €73/MWh, which if you add the cost of transmission would be somewhere in the low to mid 80s. The next tender for another 700 MW is now open for bids which will close on 29 September and be awarded around the end of this year.
Vattenfall has just won the bid for 350 MW of Danish nearshore projects at a price just over €60/MWh. Granted, these projects are close to shore, but still it's a positive sign. How soon will prices <€100/MWh be ‘normal’? Time will tell, but it seems inevitable.
TECHNOLOGY CONTINUES TO IMPROVE
A signifi cant portion of the cost reductions are coming through technology improvements, which are generally evolutionary rather than spectacular, although I can tell you that stand-ing next to one of the new 8 MW machines seems pretty spectacular. But technology, scale and management improvements to extract the maximum amount of energy from a column of moving air continues.
In the past several years we have seen the widespread deployment of so-called ‘low wind’ machines, and the deployment of Class II and III turbines in wind regimes which might have formerly seemed most suited for Class I machines. Particularly in places like Brazil, Morocco and Egypt, the steady winds and rel-atively mild climate mean using a Class II or III machine means higher capacity factors and a lower cost of energy.
The deployment of turbines on taller towers with longer blades and downrated generators with lower cut-in speeds means that maximum extraction of energy at high capacity factors in modest wind regimes closer to load centers has now become economical. The impact of
* http://newscenter.lbl.gov/2016/09/13/experts-anticipate-signifi cant-continued-reductions-wind-energy-costs/
MEDIAN LCOE SCENARIOLCOE ($/MWh) in real 2014 US dollars LCOE (€/MWh) in real 2014 Euros
0
100
50
150
200
250
0
100
50
150
2010 2015 2020 2025 2030 2035 2040 20502045 2055
Onshore
Fixed-bottom offshore
Floating offshore
Lines/markers indicate the median expert response for the median LCOE scenarioShaded areas show the 1st-3rd quartiles of expert responses.
Source: Berkeley Lab*

36 GLOBAL WIND ENERGY OUTLOOK | 2016
THE FUTURE OF WIND3
this can be seen in the dramatic increase in the area of the continental United States where wind power becomes economic.
For some years experiments have been proceeding with the use of nacelle mounted LiDAR units both for the purposes of ensuring that turbines are performing up to their rated power curves, and more importantly, to maximize energy yield by providing a series of ‘snapshots’ of the wind some hundreds or thousands of meters in front of the turbine, allowing in particular for yaw optimization.
In a recent breakthrough, Dong Energy an-nounced that it is now ready to deploy its fi rst-of-kind ‘Dual Doppler’8 radar, which will map the wind resource across an entire swath of ocean, for instance, enabling optimization of the design, siting and operation of offshore wind farms, reducing wear and tear and provid-ing another source of short term forecasting for the production of the power plant – which is what offshore wind farms will increasingly ‘look like’ to the system operator.
And of course we can expect machines to get bigger. One of the reasons for the recent reductions in tender prices for offshore wind is the availability of the new range of 7 and 8 MW
machines – the bigger and more powerful the machine, the fewer expensive foundations and support structures are required, thereby lowering the cost of energy. A 2011 study9
demonstrated that with existing materials machines of up to 20 MW could be constructed. While such behemoths are not yet economic, it will probably not be long before we’ll see 10, 12 and 15 MW machines – and if there are fundamental limits, they’re not yet clear. As materials science continues to advance, who knows how large offshore machines will be in 20 years’ time?
THE TRANSFORMATION OF THE POWER SECTOR
To get to zero emissions in the power sector fi rst, and then to a totally emissions free energy system, it is clear that electricity is going to play the dominant role. As well as providing power for an increasing number of services, it is expected that electricity will take over much of the transport sector as well as some sub-stantial portion of heat production.
8 http://cleantechnica.com/2016/09/23/worlds-fi rst-advanced-offshore-wind-power-radar-system-now-operational/
9 http://www.ewea.org/fi leadmin/ewea_documents/documents/upwind/21895_UpWind_Report_low_web.pdf
NEW TECHNOLOGY MEANS MORE DEVELOPMENT IN MORE REGIONSWind Resource Potential at Turbine Hub Height of 80m
Land Area30% Net Capacity Factor110-Meters Hub HeightNear Future Turbine Technology
Area (sq km)
Wind Resource Potential at Turbine Hub Height of 110m
200 - 300 300 - 400 > 400 Land exclusions0 < 100 100 - 200
Land Area≥ 30% Net Capacity Factor80-Meters Hub HeightCurrent Turbine Technology
• New technology can reach higher and steadier winds, making wind energy development possible in new regions of the country• Longer blades can capture more wind energy
Source: NREL/AWS Truepower

37GLOBAL WIND ENERGY OUTLOOK | 2016
3THE FUTURE OF WIND
Now that wind and solar power have become so cheap, and are so universally available, we need to fi gure out how to make a system dominated by these two technologies work. The Danish transmission system operator Energinet.dk puts it thusly:
Coherent and fl exible energy systems
Transportation
50% of electricity demand from wind by 2020
Heat p
umps
, Elec
tric b
oiler
s
Electricity
energyemissionselectricity
District Heating
Gas & Oil- other sectors
Source: Energinet.dk
This is for the Danish energy system: good interconnections, no hydro, not much solar but lots and lots of wind – well over 100% of total demand on occasion.
But of course, every system is different, every country’s natural resource endowment is different; it’s level of interconnectedness with neighboring systems is different, dispersion or compactness of the population/demand; pattern and fl exibility of demand, etc.
But what is required is a careful analysis and planning for each country/region, and a market which rewards and prioritises carbon-free emissions, but at the same time rewards the fl exibility in both supply and demand which will allow maximum utilization of zero emis-sion (and zero marginal cost) but variable renewable sources.
Finally, there is the much-discussed question of storage. Storage is always a hot topic of con-versation in countries without much RE pen-etration, but much less so in countries that do. Storage is, as of today, the most expensive and last option for integrating variable renewables, but it may be necessary in some places in the future. But that is unlikely to be the case soon: Boris Schutz of 50HZ, a major German utility,
told this year’s Energiewende conference that “storage only becomes an issue, in Europe at least, when we get to penetration levels of 70-80% of variable RE”.
At the end of the day, countries will fi nd their own way. We recently have news of Portugal running on 100%10 renewable electricity for 4 consecutive days in May 2016, and Uruguay did the same for six straight days in September 2016. But of course the leader is Costa Rica, which was 100% renewable in the electricity sector for 285 days in 201511.
DRIVERS FOR WIND ENERGY DEPLOYMENT:
As this report documents, wind power is an increasing contributor to CO2 reduction, and will be more so in the future. The sector also attracts billions in investment and has created over a million jobs worldwide, and those numbers are set to rise dramatically. But there are a number of other key drivers for wind deployment, which will apply to differing degrees in different countries over time.
W I N D P O W E R I S A N I N C R E A S I N G
C O N T R I B U T O R T O C O 2 R E D U C T I O N ,
A N D W I L L B E M O R E S O I N T H E F U T U R E
10 https://www.theguardian.com/environment/2016/may/18/portugal-runs-for-four-days-straight-on-renewable-energy-alone
11 http://www.ecowatch.com/costa-rica-powers-285-days-of-2015-with-100-renewable-energy-1882135438.html

38 GLOBAL WIND ENERGY OUTLOOK | 2016
THE FUTURE OF WIND3
Wind also helps us to combat another global crisis: the water crisis. Water shortage and stress are among the major impacts of worsen-ing global climate change, and our profl igacy with this precious resource is a serious problem even without the threat of climate change. While both the characterization of the problem and its potential solutions are different in each case and vary widely by geography, the (ther-mal) power sector is a very large consumer. If you’re a policymaker in a water-stressed coun-try or region, the chart above is instructive.
Air pollution kills over 6 million people per year, and globally is the fourth largest threat to human health. Especially in the rapidly growing economies of Asia, urban air pollution has become a chronic problem. We read a great deal about the problems in Beijing and Delhi, but the problem is actually worse in many smaller cities across Asia and in some parts of Africa.
Energy production is by far the largest source of air pollution. Policymakers looking to do something about the fact that their capitals and major industrial cities are becoming un-inhabitable, would do well to consider a recent report on energy and air pollution from the IEA12. It goes without saying that wind, solar and most other renewables contribute virtually zero to air pollution, and are potent tool to fi ght this worsening crisis.
Finally, wind power and other renewables en-hance a country’s energy security. While that may seem like less of an issue now when fossil fuel prices are at decadal lows, just a few years ago the money pouring out of oil importing states was crippling many developing econ-omies and causing major headaches for the rest. Every kilowatt-hour of electricity generated by wind power can displace an equivalent amount
12 https://www.iea.org/publications/freepublications/publication/weo-2016-special-report-energy-and-air-pollution.html
AVERAGE WF RELATED TO ELECTRICITY AND HEAT PRODUCTION
m3/TJ
0
100
10
1,000
10,000
100,000
1,000,000Maximum
Minimum
Firewood Hydro power
Nudear Oil Coal and
lignite
Geothermal Natural gas
Solar Wind Production weighted
average
Operation 400 15,100 610 440 440 340 240 50 0.2 2,410Construction 0.4 0.3 0.3 1.1 1.1 2.1 1.1 90 1.1 1.0Fuel supply 156,000 0 68 55 54 0 6 0 0 1,830
Average consumptive WF per unit of electricity and heat produced (m3 TJe-1) for the period 2008-2012. Note that the scale is logarithmic. The ranges shown refl ect minimum and maximum values per
energy source. The values in the table represent the WF (m3 TJ-1) for the three main stages of the electricity and heat production chain.
Source: http://waterfootprint.org/media/downloads/Mekonnen-et-al-2015.pdf

39GLOBAL WIND ENERGY OUTLOOK | 2016
3THE FUTURE OF WIND
of imported fossil fuel whether it is directly for power, for electric mobility or for heat. Renew-able energy is by defi nition indigenous, and at least in a practical sense, will not be depleted within any time frame that matters.
Macro-economic security is enhanced with better energy security, and this is not limited to purely fi nancial matters, as fossil-fuel ex-porting nations have often in the past and will no doubt in future use the dependence they generate in consuming countries for political purposes. Insulating national economies from this dependence continues to be a driver for renewable energy development.
CONCLUSION
Since the oil embargoes of the 1970s, the emergence of climate change as a global threat in the late 1980s and through to the negotiations in Paris last December, there has been much talk on the sidelines of the role renewable energy can play to solve a number of the crises facing us. But that was always going to be ‘some time’ in the future, when costs come down. Well, the future is now, and the cost issue is all but gone. It is merely now a question of summoning the political will to put together the programs and policies which will enable the smoothest transition to a global energy system based on renewable energy, led by wind.
This is necessary in order to meet challenge of climate change, to preserve our precious fresh water resources, make our cities livable again, and create new industries, new jobs and greater security for our citizens and our economies. Will we choose to do so? It’s up to us.
Wind turbine installed on the Eiffel Tower in Paris
© Urban Green Energy
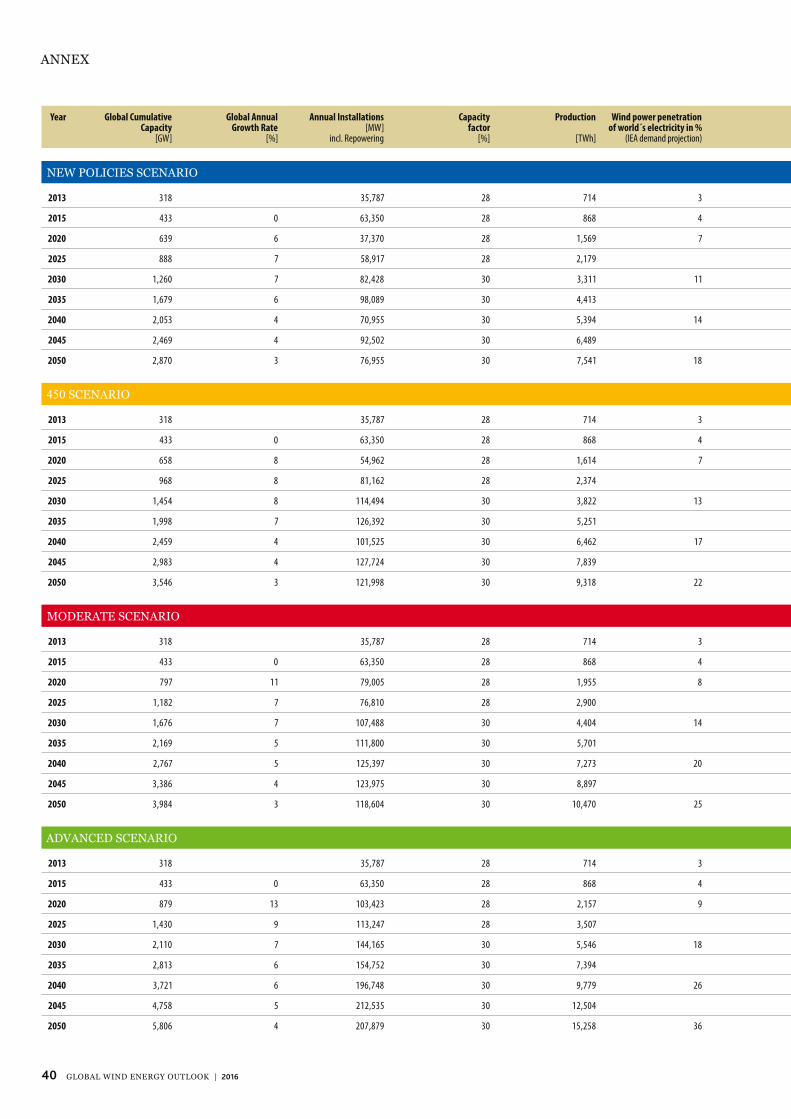
40 GLOBAL WIND ENERGY OUTLOOK | 2016
Year Global Cumulative Capacity
[GW]
Global Annual Growth Rate
[%]
Annual Installations [MW]
incl. Repowering
Capacity factor
[%]
Production
[TWh]
Wind power penetration of world´s electricity in %
(IEA demand projection)
NEW POLICIES SCENARIO
2013 318 35,787 28 714 3
2015 433 0 63,350 28 868 4
2020 639 6 37,370 28 1,569 7
2025 888 7 58,917 28 2,179
2030 1,260 7 82,428 30 3,311 11
2035 1,679 6 98,089 30 4,413
2040 2,053 4 70,955 30 5,394 14
2045 2,469 4 92,502 30 6,489
2050 2,870 3 76,955 30 7,541 18
450 SCENARIO
2013 318 35,787 28 714 3
2015 433 0 63,350 28 868 4
2020 658 8 54,962 28 1,614 7
2025 968 8 81,162 28 2,374
2030 1,454 8 114,494 30 3,822 13
2035 1,998 7 126,392 30 5,251
2040 2,459 4 101,525 30 6,462 17
2045 2,983 4 127,724 30 7,839
2050 3,546 3 121,998 30 9,318 22
MODERATE SCENARIO
2013 318 35,787 28 714 3
2015 433 0 63,350 28 868 4
2020 797 11 79,005 28 1,955 8
2025 1,182 7 76,810 28 2,900
2030 1,676 7 107,488 30 4,404 14
2035 2,169 5 111,800 30 5,701
2040 2,767 5 125,397 30 7,273 20
2045 3,386 4 123,975 30 8,897
2050 3,984 3 118,604 30 10,470 25
ADVANCED SCENARIO
2013 318 35,787 28 714 3
2015 433 0 63,350 28 868 4
2020 879 13 103,423 28 2,157 9
2025 1,430 9 113,247 28 3,507
2030 2,110 7 144,165 30 5,546 18
2035 2,813 6 154,752 30 7,394
2040 3,721 6 196,748 30 9,779 26
2045 4,758 5 212,535 30 12,504
2050 5,806 4 207,879 30 15,258 36
ANNEX

41GLOBAL WIND ENERGY OUTLOOK | 2016
Wind power penetration of world´s electricity in %
(Effi ciency demand projection)
CO2 reduction (with 600g CO2/kWh)
[annual MT CO2]
Avoided CO2 since 2006
[cumulative MT CO2]
Total installed Costs
[€/kW]
Investment
[€1,000/year]
Jobs total
3 428 2,112 1,592 56,973,015 606,076
4 521 3,105 1,571 99,523,313 1,029,681
7 941 7,247 1,541 57,578,304 696,841
1,307 12,981 1,497 88,205,229 1,059,044
12 1,987 21,223 1,465 120,789,259 936,232
2,648 33,076 1,453 142,529,204 971,001
16 3,237 48,137 1,472 104,415,628 1,080,374
3,894 66,216 1,464 135,382,490 1,184,300
20 4,525 87,610 1,469 113,032,568 1,316,408
3 428 2,112 1,592 56,973,015 606,076
4 521 3,105 1,571 99,523,313 1,029,681
7 968 7,279 1,550 85,217,140 931,654
1,424 13,393 1,506 122,221,625 1,374,438
14 2,293 23,730 1,426 163,260,361 1,385,182
3,151 33,076 1,417 179,151,043 1,415,916
19 3,877 54,687 1,417 143,903,203 1,370,137
4,703 76,449 1,417 181,039,230 1,496,486
25 5,591 102,639 1,418 172,996,031 1,682,231
3 428 2,112 1,592 56,973,015 606,076
4 521 3,105 1,571 99,523,313 1,029,681
9 1,173 7,850 1,518 119,959,286 1,290,079
1,740 15,419 1,525 117,117,490 1,388,753
16 2,642 26,393 1,445 155,351,075 1,374,111
3,421 41,884 1,429 159,774,659 1,297,268
22 4,364 61,770 1,408 176,545,253 1,469,931
5,338 86,511 1,408 174,543,061 1,636,049
28.3 6,282 116,043 1,408 166,981,343 1,866,633
3 428 2,112 1,592 56,973,015 606,076
4 521 3,105 1,571 99,523,313 1,029,681
9 1,294 8,153 1,452 150,213,585 1,634,721
2,104 17,031 1,433 162,230,756 1,944,062
20 3,327 30,702 1,379 198,838,088 2,426,331
4,436 50,603 1,361 210,693,492 2,785,432
29 5,867 76,953 1,328 261,332,230 3,588,875
7,502 111,152 1,318 280,111,058 3,907,964
41 9,155 153,634 1,321 274,520,745 4,202,612

42 GLOBAL WIND ENERGY OUTLOOK | 2016
CHAPTER TITLE1
GWEC is the international trade association representing the global wind industry. The members of GWEC represent over 1,500 com-panies, organisations and institutions in more than 80 countries, including manufacturers, developers, component suppliers, research institutes, national wind and renewables associations, electricity providers, fi nance, insurance companies and law fi rms.
GWEC works at the highest international political level to create a better policy environ-ment for wind power. GWEC and its members are active all over the world, educating local and national governments and international agencies about the benefi ts of wind power.
Our mission is to ensure that wind power establishes itself as the answer to today’s energy challenges, providing substantial environmental and economic benefi ts. GWEC works with national and international policy makers and industry associations to help open new markets for wind power i.e. UNFCCC, the IEA, international fi nancial institutions, the IPCC and IRENA. GWEC has a proven track record of success in helping to build the wind power industry in emerging markets around the world, including Argentina, Brazil, China, India, Mexico and South Africa.
INSTITUTE FOR SUSTAINABLE FUTURESUniversity of Technology SydneyLevel 11, Building 10, 235 Jones Street UltimoSydney, NSW 2007 (PO Box 123)AustraliaTel +61 2 9514 4786 [email protected]
www.uts.edu.au
GLOBAL WIND ENERGY COUNCILRue d’Arlon 801040 BrusselsBelgiumTel +32 2 213 18 [email protected]
www.gwec.net
University of Technology, Sydney (UTS) is a dynamic and innovative university in central Sydney. One of Australia’s leading universities of technology, UTS has a distinct model of learning, strong research performance and a leading reputation for engagement with indus-try and the professions. With a total enrolment of over 40,000 students, UTS is one of the largest universities in Australia.
The Institute for Sustainable Futures (ISF) is a university research institute based on the Sydney downtown campus. Our mission is to create change towards sustainable futures by conducting independent project based research for Australian and international clients.
Our researchers come from varied back-grounds, including engineering, architecture, management, economics, science, the social sciences, international studies and political studies.
The ISF vision for sustainable Energy Futures is one in which energy is clean, affordable and accessible to all, where energy systems and services support a high quality of life and in which people and communities are empowered. We develop inspiring pictures of energy futures in which the economy thrives on innovative ideas and technologies, focusing on modern and cutting edge energy use and supply systems. The ISF views the energy system holistically and work on improving every part of it, from fi nancing and business models, to policy and regulation, to technology analysis. Our research areas in regard to renew-able energies are:
• Visualising future energy infrastructure• Empowering new energy market participants• Transforming through data and information• Renewable energy market research• Energy scenarios for countries, regions, com-
munities, cities and islands
Find out more about GWEC’s policy work, publications, events and other membership benefi ts on our website at www.gwec.net

GWEC events – organised by the industry… for the industry
and join GWEC todaywww.gwec.net


