
GLOBAL VALUE CHAINS AND TRADE IN VALUE … VALUE CHAINS AND TRADE IN VALUE ADDED: THE NEED FOR NEW...
25
GLOBAL VALUE CHAINS AND TRADE IN VALUE ADDED: THE NEED FOR NEW POLICY THINKING Nadim Ahmad, Head of Trade and Competitiveness Statistics Division 1 Copenhagen: 21 November, 2016
-
Upload
truongtuong -
Category
Documents
-
view
218 -
download
1
Transcript of GLOBAL VALUE CHAINS AND TRADE IN VALUE … VALUE CHAINS AND TRADE IN VALUE ADDED: THE NEED FOR NEW...

GLOBAL VALUE CHAINS AND TRADE IN
VALUE ADDED:
THE NEED FOR NEW POLICY THINKING
Nadim Ahmad, Head of Trade and Competitiveness Statistics Division 1
Copenhagen: 21 November, 2016

International fragmentation of production
Explosion of trade in intermediates as firms specialise in stages (tasks) of production
2
Escape slides: Air Cruisers (USA)
Horizontal Stabiliser:
Alenia Aeronautica (Italy)
Centre fuselage: Alenia Aeronautica (Italy)
Final assembly: BoeingCommercial Airplanes (USA)
Vertical Stabiliser: Boeing
Commercial Airplanes (USA)
Landing gear: Messier-Dowti (France)
Electric brakes: Messier-Bugatti (France)
Tires: Bridgestone Tires (Japan)
Doors & windows:
Zodiac Aerospace (USA)
PPG Aerospace (USA)
Tools/Software: Dassault Systemes (France)
Navigation: Honeywell (USA)
Pilot control system: Rockwell Colins (USA)
Wiring: Safran (France)
Centre wing box:
Fuji Heavy Industries (Japan)
Engines: GE Engines (USA),
Rolls Royce (UK)
Wing box: Mitsubishi Heavy Industries (Japan)
Wing ice protection: GKN Aerospace (UK)
Engine nacelles: Goodrich (USA)Aux. power unit: Hamilton
Sundstrand (USA)
Flight deck seats:
Ipeco (UK)
Lavatories:
Jamco (Japan)
Cargo doors: Saab (Sweden)
Forward fuselage:
Kawasaki Heavy Industries (Japan)
Spirit Aerosystems (USA)
Raked wing tips: Korean Airlines
Aerospace division (Korea)
Passenger doors:
Latécoère Aéroservices (France)
Prepreg composites:
Toray (Japan)
Rear fuselage:
Boeing South Carolina (USA)
Final consumption
3
7
5
62
Final assembly
1
4
0%
10%
20%
30%
40%
50%
60%
70%
80%
90%
100%
1
23
4
5
67
Value added in the country of final production
Value added by first tier suppliers
Value added by second tier suppliers
Trade in inputs (first
tier suppliers)
Trade in inputs(second tier
suppliers)
Decomposition of gross exports

Resulting in multiple counting…..
…..in conventional trade statistics
• With the potential to create ‘misleading perceptions’ and imperfect policies:
3
0
20
40
60
80
100
120
140
160
180
200
Ex
po
rts
Imp
ort
sE
xp
ort
sIm
po
rts
Ex
po
rts
Imp
ort
sE
xp
ort
sIm
po
rts
Ex
po
rts
Imp
ort
sE
xp
ort
sIm
po
rts
Ex
po
rts
Imp
ort
sE
xp
ort
sIm
po
rts
Ex
po
rts
Imp
ort
sE
xp
ort
sIm
po
rts
Ex
po
rts
Imp
ort
sE
xp
ort
sIm
po
rts
Ex
po
rts
Imp
ort
sE
xp
ort
sIm
po
rts
Ex
po
rts
Imp
ort
sE
xp
ort
sIm
po
rts
Ex
po
rts
Imp
ort
sE
xp
ort
sIm
po
rts
Ex
po
rts
Imp
ort
sE
xp
ort
sIm
po
rts
Ex
po
rts
Imp
ort
sE
xp
ort
sIm
po
rts
Ex
po
rts
Imp
ort
sE
xp
ort
sIm
po
rts
Ex
po
rts
Imp
ort
sE
xp
ort
sIm
po
rts
Ex
po
rts
Imp
ort
sE
xp
ort
sIm
po
rts
Ex
po
rts
Imp
ort
sE
xp
ort
sIm
po
rts
Ex
po
rts
Imp
ort
sE
xp
ort
sIm
po
rts
Ex
po
rts
Imp
ort
sE
xp
ort
sIm
po
rts
LUX IRL SVK HUN EST BEL NLD CZE SVN CHE ISL DNK KOR AUT POL DEU SWE PRT FIN NOR ISR CHL MEX ESP GRC CAN GBR NZL ITA FRA TUR AUS JPN USA
Gross Trade, % of GDP
1993 2013
Requiring a new statistical response:
TiVA
Gross exports (100) Gross exports (130)
Value added (100)
Value added (100) Value added (30)
Country A Country B Country C
[no direct relationship]
[in value added terms, there is a direct relationship between A and C]

Most intermediate imports are used for exports..
5
0%
10%
20%
30%
40%
50%
60%
70%
80%
Agric
ulture
Min
ing
Food p
roducts
Textile
s &
appare
l
Wood &
paper
Coke &
petrole
um
Chem
icals
Rubber &
pla
stics
Non-m
eta
llic
min
erals
Basic
meta
ls
Fabric
ate
d m
eta
ls
Machin
ery
ICT &
ele
ctronic
s
Ele
ctric
al m
achin
ery
Moto
r vehic
les
Oth
er tra
nsport
Oth
er m
anufa
ctu
res
Utilities
Whole
sale
, re
tail &
hote
ls
Tra
nsport &
tele
com
s
Fin
ance &
insura
nce
Busin
ess s
erv
ices
Oth
er s
erv
ices
Tota
l
2011 2009 2008
0%
10%
20%
30%
40%
50%
60%
70%
80%
90%
Agric
ulture
Min
ing
Food p
roducts
Textile
s &
appare
l
Wood &
paper
Coke &
petrole
um
Chem
icals
Rubber &
pla
stics
Non-m
eta
llic
min
erals
Basic
meta
ls
Fabric
ate
d m
eta
ls
Machin
ery
ICT &
ele
ctronic
s
Ele
ctric
al m
achin
ery
Moto
r vehic
les
Oth
er tra
nsport
Oth
er m
anufa
ctu
res
Utilities
Whole
sale
, re
tail &
hote
ls
Tra
nsport &
tele
com
s
Fin
ance &
insura
nce
Busin
ess s
erv
ices
Oth
er s
erv
ices
Tota
l
2011 2009 2008
0%
10%
20%
30%
40%
50%
60%
70%
80%
Agric
ulture
Min
ing
Food p
roducts
Textile
s &
appare
l
Wood &
paper
Coke &
petrole
um
Chem
icals
Rubber &
pla
stics
Non-m
eta
llic
min
erals
Basic
meta
ls
Fabric
ate
d m
eta
ls
Machin
ery
ICT &
ele
ctronic
s
Ele
ctric
al m
achin
ery
Moto
r vehic
les
Oth
er tra
nsport
Oth
er m
anufa
ctu
res
Utilities
Whole
sale
, re
tail &
hote
ls
Tra
nsport &
tele
com
s
Fin
ance &
insura
nce
Busin
ess s
erv
ices
Oth
er s
erv
ices
Tota
l
2011 2009 2008
Imported intermediate inputs used for exports, by import category: %
Sweden Norway
Finland Denmark
…driving exports and competitiveness
6
Foreign content of exports, % of exports
Sweden Norway
Finland Denmark
0%
10%
20%
30%
40%
50%
60%
70%
80%
90%
Agric
ulture
Min
ing
Food p
roducts
Textile
s &
appare
l
Wood &
paper
Coke &
petrole
um
Chem
icals
Rubber &
pla
stics
Non-m
eta
llic
min
erals
Basic
meta
ls
Fabric
ate
d m
eta
ls
Machin
ery
ICT &
ele
ctronic
s
Ele
ctric
al m
achin
ery
Moto
r vehic
les
Oth
er tra
nsport
Oth
er m
anufa
ctu
res
Whole
sale
, re
tail &
hote
ls
Tra
nsport &
tele
com
s
Fin
ance &
insura
nce
Busin
ess s
erv
ices
Oth
er s
erv
ices
Tota
l
FVA share of gross exports, 2011 FVA share of gross exports, 1995
0%
10%
20%
30%
40%
50%
60%
Agric
ulture
Min
ing
Food p
roducts
Textile
s &
appare
l
Wood &
paper
Coke &
petrole
um
Chem
icals
Rubber &
pla
stics
Non-m
eta
llic
min
erals
Basic
meta
ls
Fabric
ate
d m
eta
ls
Machin
ery
ICT &
ele
ctronic
s
Ele
ctric
al m
achin
ery
Moto
r vehic
les
Oth
er tra
nsport
Oth
er m
anufa
ctu
res
Whole
sale
, re
tail &
hote
ls
Tra
nsport &
tele
com
s
Fin
ance &
insura
nce
Busin
ess s
erv
ices
Oth
er s
erv
ices
Tota
l
FVA share of gross exports, 2011 FVA share of gross exports, 1995
0%
10%
20%
30%
40%
50%
60%
70%
80%A
gric
ulture
Min
ing
Food p
roducts
Textile
s &
appare
l
Wood &
paper
Coke &
petrole
um
Chem
icals
Rubber &
pla
stics
Non-m
eta
llic
min
erals
Basic
meta
ls
Fabric
ate
d m
eta
ls
Machin
ery
ICT &
ele
ctronic
s
Ele
ctric
al m
achin
ery
Moto
r vehic
les
Oth
er tra
nsport
Oth
er m
anufa
ctu
res
Whole
sale
, re
tail &
hote
ls
Tra
nsport &
tele
com
s
Fin
ance &
insura
nce
Busin
ess s
erv
ices
Oth
er s
erv
ices
Tota
l
FVA share of gross exports, 2011 FVA share of gross exports, 1995
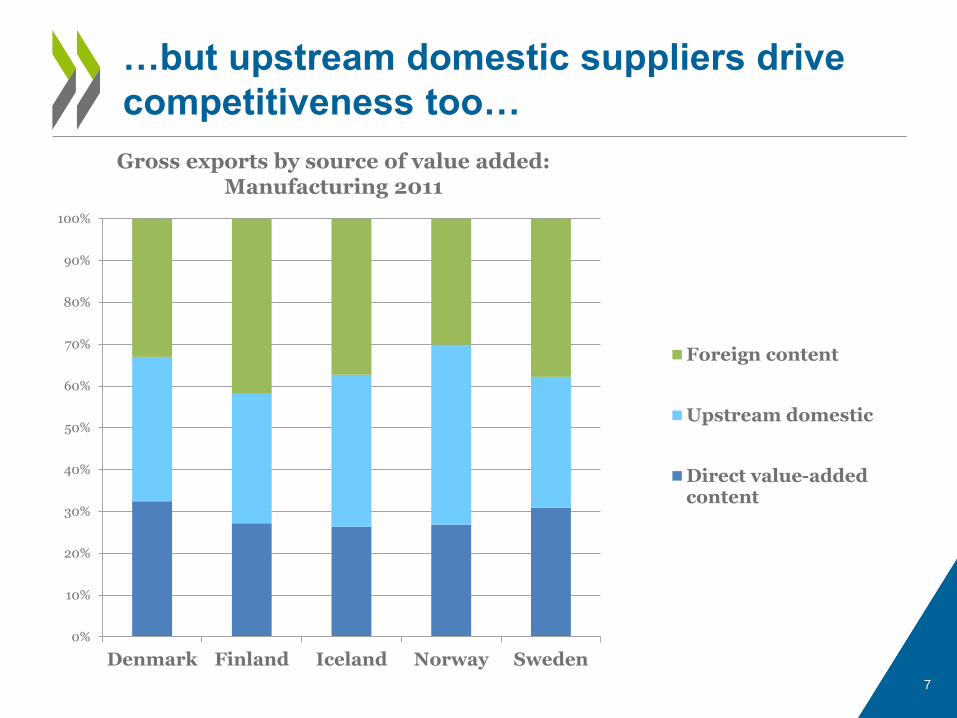
…but upstream domestic suppliers drive
competitiveness too…
7
0%
10%
20%
30%
40%
50%
60%
70%
80%
90%
100%
Denmark Finland Iceland Norway Sweden
Foreign content
Upstream domestic
Direct value-addedcontent
Gross exports by source of value added: Manufacturing 2011

….including services..
8
0%
5%
10%
15%
20%
25%
30%
35%
40%
45%
50%
IDN
CH
L
KO
R
CH
N
US
A
ME
X
JP
N
GR
C
IND
CA
N
NO
R
AU
S
ZA
F
ISL
GB
R
RU
S
DE
U
AU
T
BR
A
SV
K
TU
R
CZE
ES
P
ISR
SV
N
PO
L
IRL
ES
T
PR
T
HU
N
NZL
NLD
ITA
FIN
SW
E
CH
E
LU
X
DN
K
BE
L
FR
A
Construction Wholesale, retail & hotels Transport & telecoms Finance & insurance Business services Other services 1995, Total
Services value added embodied in manufacturing exports, by country
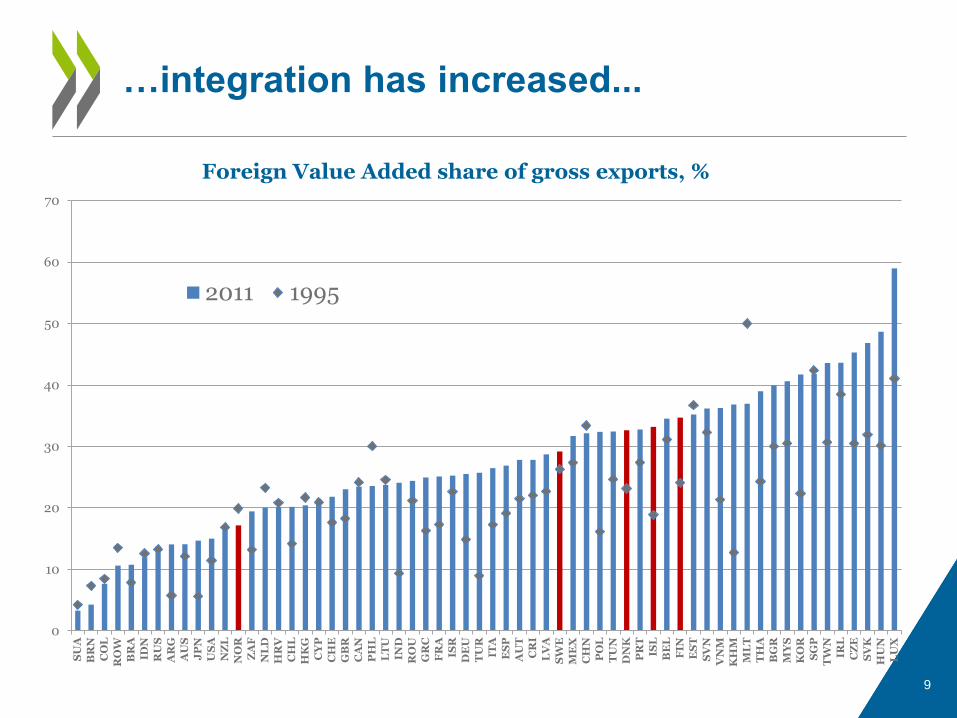
…integration has increased...
9
Foreign Value Added share of gross exports, %
0
10
20
30
40
50
60
70
SU
A
BR
N
CO
L
RO
W
BR
A
IDN
RU
S
AR
G
AU
S
JP
N
US
A
NZ
L
NO
R
ZA
F
NL
D
HR
V
CH
L
HK
G
CY
P
CH
E
GB
R
CA
N
PH
L
LT
U
IND
RO
U
GR
C
FR
A
ISR
DE
U
TU
R
ITA
ES
P
AU
T
CR
I
LV
A
SW
E
ME
X
CH
N
PO
L
TU
N
DN
K
PR
T
ISL
BE
L
FIN
ES
T
SV
N
VN
M
KH
M
ML
T
TH
A
BG
R
MY
S
KO
R
SG
P
TW
N
IRL
CZ
E
SV
K
HU
N
LU
X
2011 1995
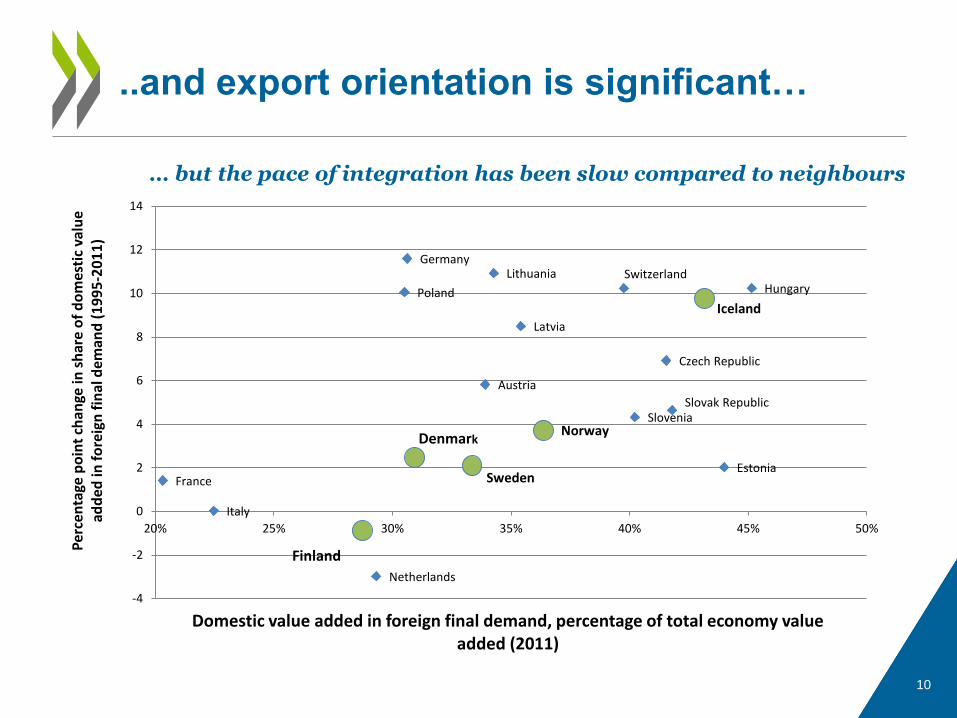
..and export orientation is significant…
10
Austria
Czech Republic
Denmark
Estonia
Finland
France
Germany
Hungary
Iceland
Italy
Latvia
Netherlands
Norway
Poland
Slovak Republic Slovenia
Sweden
Switzerland Lithuania
-4
-2
0
2
4
6
8
10
12
14
20% 25% 30% 35% 40% 45% 50%
Per
cen
tage
po
int
chan
ge in
sh
are
of
do
mes
tic
valu
e ad
ded
in f
ore
ign
fin
al d
eman
d (
19
95
-20
11
)
Domestic value added in foreign final demand, percentage of total economy value added (2011)
… but the pace of integration has been slow compared to neighbours
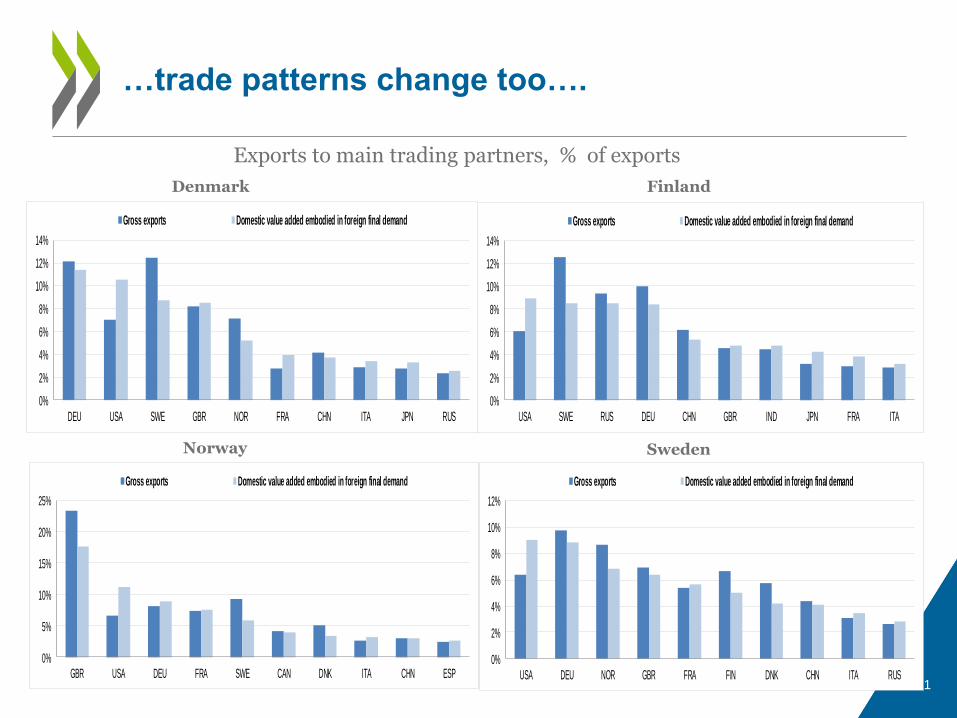
…trade patterns change too….
11
Exports to main trading partners, % of exports
Sweden Norway
Finland Denmark
0%
2%
4%
6%
8%
10%
12%
14%
DEU USA SWE GBR NOR FRA CHN ITA JPN RUS
Gross exports Domestic value added embodied in foreign final demand
0%
2%
4%
6%
8%
10%
12%
14%
USA SWE RUS DEU CHN GBR IND JPN FRA ITA
Gross exports Domestic value added embodied in foreign final demand
0%
5%
10%
15%
20%
25%
GBR USA DEU FRA SWE CAN DNK ITA CHN ESP
Gross exports Domestic value added embodied in foreign final demand
0%
2%
4%
6%
8%
10%
12%
USA DEU NOR GBR FRA FIN DNK CHN ITA RUS
Gross exports Domestic value added embodied in foreign final demand

…adding important insights…
12
-50
0
50
100
150
200
250
300
Gross
Value added
US trade deficit with selected partners, 2011, USD bn
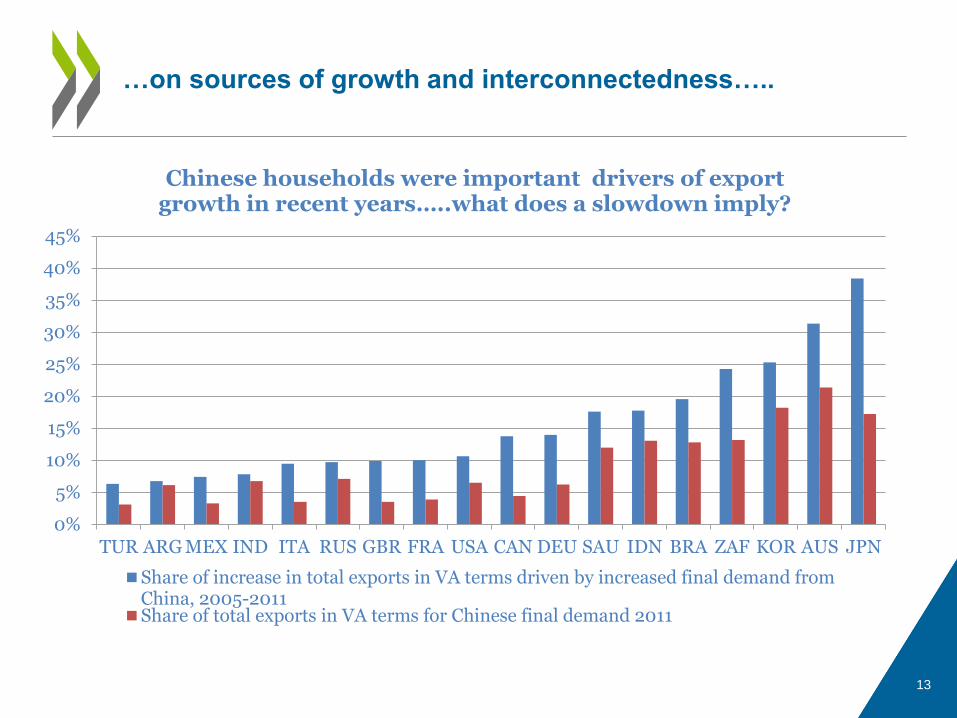
…on sources of growth and interconnectedness…..
13
0%
5%
10%
15%
20%
25%
30%
35%
40%
45%
TUR ARG MEX IND ITA RUS GBR FRA USA CAN DEU SAU IDN BRA ZAF KOR AUS JPN
Chinese households were important drivers of export growth in recent years…..what does a slowdown imply?
Share of increase in total exports in VA terms driven by increased final demand fromChina, 2005-2011Share of total exports in VA terms for Chinese final demand 2011

…the feedback loop…
14
0%
10%
20%
30%
40%
50%
60%
70%
80%
90%
100%
Mexico
ROW
US
Mexico’s exports by origin of value-added, 2011

Investment
Trade
Production
But this only scratches at the surface
15
Jobs
Actors - SMEs
Inequalities

• that we put ‘global’ at the heart of ‘national’
– But with a granularity that provides insights on the actors and their heterogeneity
– Improving our understanding of interconnectedness and benefits, challenges and consequences of globalisation
• Whilst also improving GDP
– In other words new internationally integrated economic accounting systems
Global production requires
16
• To create expanded TIVA highlighting the role of SMEs and MNEs and Traders in global production
Trailblazing collaboration with Nordic
council…
17
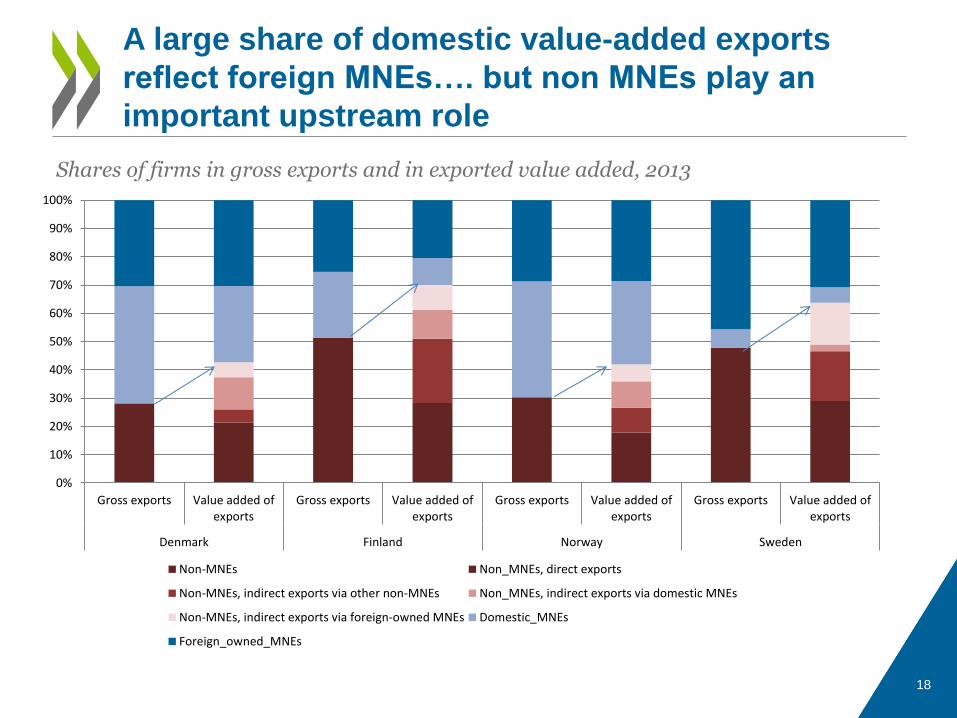
A large share of domestic value-added exports
reflect foreign MNEs…. but non MNEs play an
important upstream role
18
0%
10%
20%
30%
40%
50%
60%
70%
80%
90%
100%
Gross exports Value added ofexports
Gross exports Value added ofexports
Gross exports Value added ofexports
Gross exports Value added ofexports
Denmark Finland Norway Sweden
Non-MNEs Non_MNEs, direct exports
Non-MNEs, indirect exports via other non-MNEs Non_MNEs, indirect exports via domestic MNEs
Non-MNEs, indirect exports via foreign-owned MNEs Domestic_MNEs
Foreign_owned_MNEs
Shares of firms in gross exports and in exported value added, 2013

…meaning that SMEs are highly
integrated (directly and indirectly)
19
Shares of firms in gross exports and in exported value added, 2013
0%
10%
20%
30%
40%
50%
60%
70%
80%
90%
100%
Gross exports Value addedexports
Gross exports Value addedexports
Gross exports Value addedexports
Gross exports Value addedexports
Denmark Finland Norway Sweden
Independent - Micro
Independent - Small
Independent - Medium
Dependent - Micro
Dependent - Small
Dependent - Medium
Large
… particularly dependent SMEs…

20
0
0.2
0.4
0.6
0.8
1
1.2
1.4
1.6
1.8
2
No
n-M
NEs
Do
mes
tic
MN
Es
Fore
ign
-ow
ned
MN
Es
No
n-M
NEs
Do
mes
tic
MN
Es
Fore
ign
-ow
ned
MN
Es
No
n-M
NEs
Do
mes
tic
MN
Es
Fore
ign
-ow
ned
MN
Es
No
n-M
NEs
Do
mes
tic
MN
Es
Fore
ign
-ow
ned
MN
Es
Denmark Finland Norway Sweden
Value added generated at domestic suppliers for each Euro of value added at exporter, by firm type , 2013
But spillovers are higher from domestic MNEs..
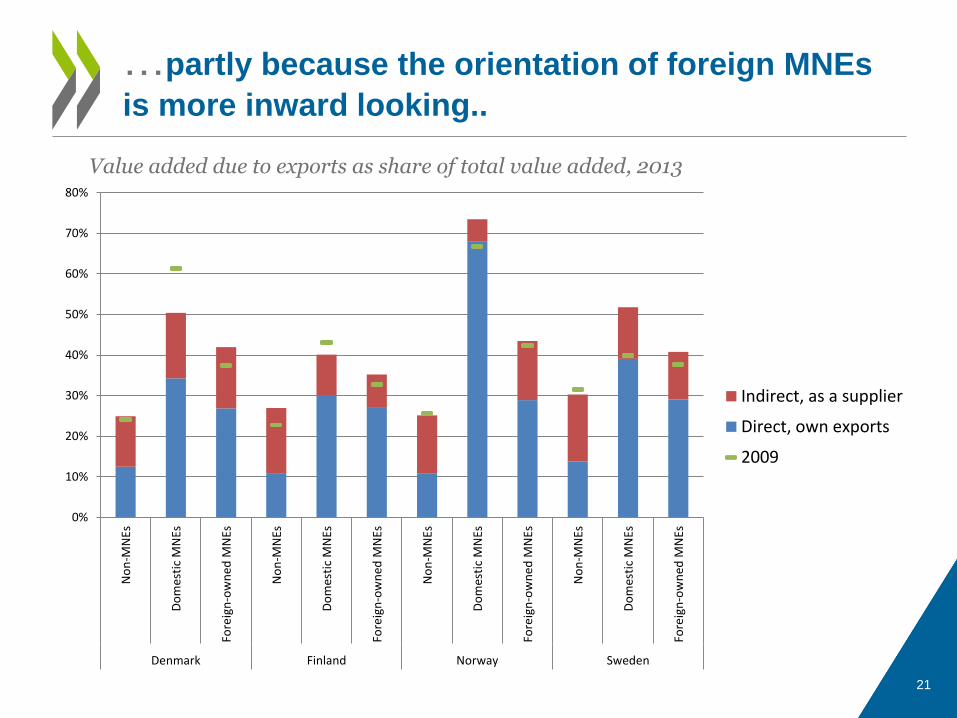
…partly because the orientation of foreign MNEs
is more inward looking..
21
0%
10%
20%
30%
40%
50%
60%
70%
80%
No
n-M
NEs
Do
mes
tic
MN
Es
Fore
ign
-ow
ned
MN
Es
No
n-M
NEs
Do
mes
tic
MN
Es
Fore
ign
-ow
ned
MN
Es
No
n-M
NEs
Do
mes
tic
MN
Es
Fore
ign
-ow
ned
MN
Es
No
n-M
NEs
Do
mes
tic
MN
Es
Fore
ign
-ow
ned
MN
Es
Denmark Finland Norway Sweden
Indirect, as a supplier
Direct, own exports
2009
Value added due to exports as share of total value added, 2013
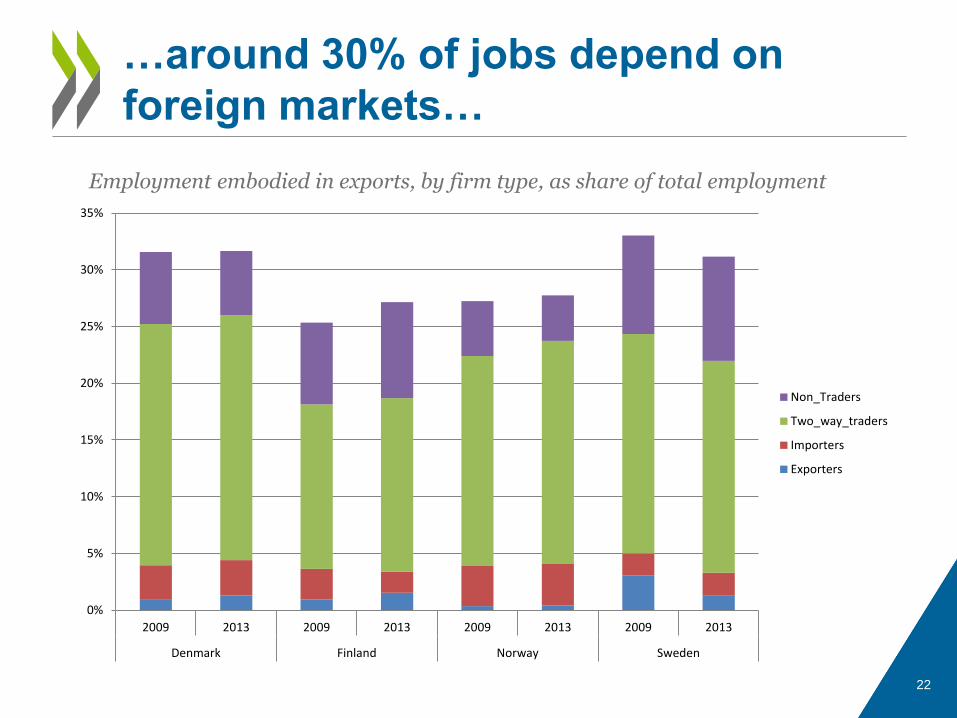
…around 30% of jobs depend on
foreign markets…
22
0%
5%
10%
15%
20%
25%
30%
35%
2009 2013 2009 2013 2009 2013 2009 2013
Denmark Finland Norway Sweden
Non_Traders
Two_way_traders
Importers
Exporters
Employment embodied in exports, by firm type, as share of total employment
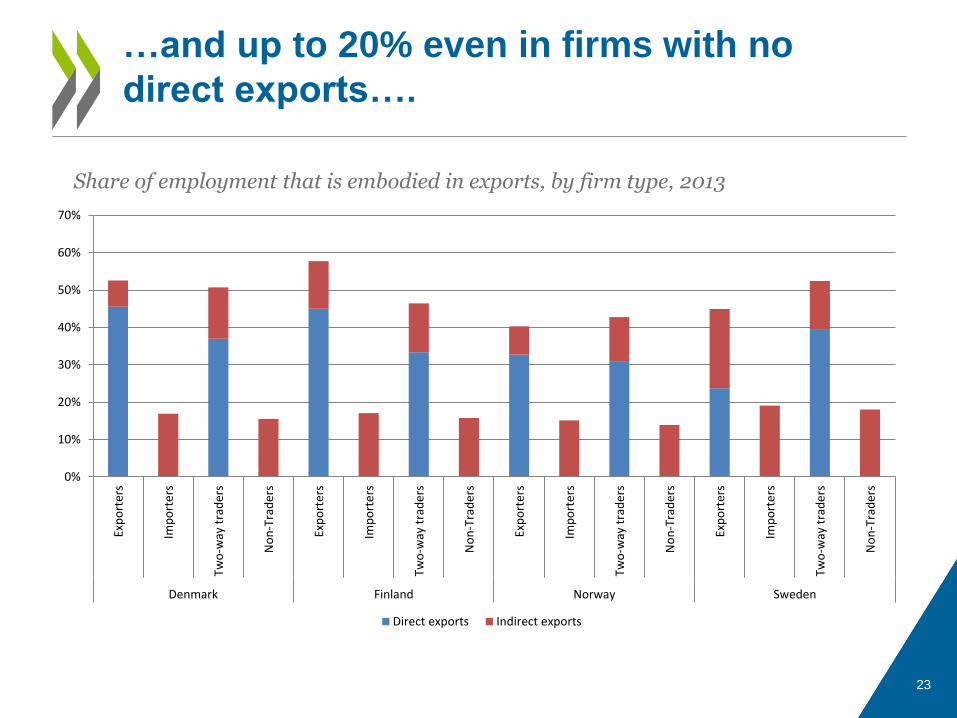
…and up to 20% even in firms with no
direct exports….
23
0%
10%
20%
30%
40%
50%
60%
70%
Exp
ort
ers
Imp
ort
ers
Two
-way
tra
de
rs
No
n-T
rad
ers
Exp
ort
ers
Imp
ort
ers
Two
-way
tra
de
rs
No
n-T
rad
ers
Exp
ort
ers
Imp
ort
ers
Two
-way
tra
de
rs
No
n-T
rad
ers
Exp
ort
ers
Imp
ort
ers
Two
-way
tra
de
rs
No
n-T
rad
ers
Denmark Finland Norway Sweden
Direct exports Indirect exports
Share of employment that is embodied in exports, by firm type, 2013
• Forthcoming report to accompany today’s report
• Build on momentum from the collaboration with the Nordics but also advance with other countries
• To help build the 21st century statistical information systems needed for 21st century production
Next steps
24