GLOBAL PATTERNS OF FRESHWATER FISH COMMUNITIES IN MEDITERRANNEAN
64
GLOBAL PATTERNS OF FRESHWATER FISH COMMUNITIES IN MEDITERRANNEAN BIOMES Elif Esther Fehm-Sullivan B.S., California State University, Sacramento, 2003 THESIS Submitted in partial satisfaction of the requirements for the degree of MASTER OF SCIENE in BIOLOGICAL SCIENCES at CALIFORNIA STATE UNIVERSITY, SACRAMENTO FALL 2010
Transcript of GLOBAL PATTERNS OF FRESHWATER FISH COMMUNITIES IN MEDITERRANNEAN

GLOBAL PATTERNS OF FRESHWATER FISH COMMUNITIES IN MEDITERRANNEAN BIOMES
Elif Esther Fehm-Sullivan
B.S., California State University, Sacramento, 2003
THESIS
Submitted in partial satisfaction of the requirements for the degree of
MASTER OF SCIENE
in
BIOLOGICAL SCIENCES
at
CALIFORNIA STATE UNIVERSITY, SACRAMENTO
FALL 2010

ii
GLOBAL PATTERNS OF FESHWATER FISH COMMUNITIES IN MEDITERRANNEAN BIOMES
A Thesis
by
Elif Esther Fehm-Sullivan Approved by: __________________________________, Committee Chair Jamie Kneitel, Ph.D. __________________________________, Second Reader Brett Holland, Ph.D. __________________________________, Third Reader Patrick Foley, Ph.D. __________________________________ Date

iii
Student: Elif Esther Fehm-Sullivan
I certify that this student has met the requirements for format contained in the University
format manual, and that this thesis is suitable for shelving in the Library and credit is to
be awarded for the thesis.
__________________________, Graduate Coordinator ___________________ Susanne Lindgren, Ph.D. Date Department of Biological Sciences
iv
Abstract
of
GLOBAL PATTERNS OF FRESHWATER FISH COMMUNITIES IN MEDITERRANNEAN BIOMES
by
Elif Esther Fehm-Sullivan
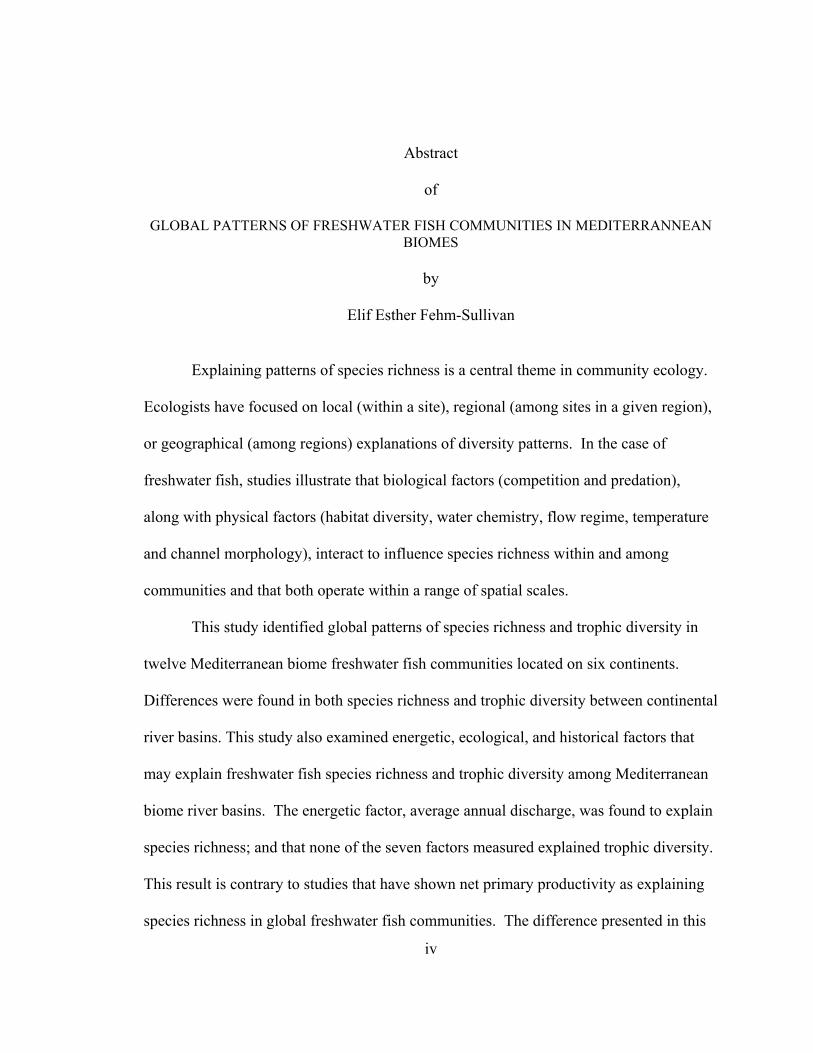
Explaining patterns of species richness is a central theme in community ecology.
Ecologists have focused on local (within a site), regional (among sites in a given region),
or geographical (among regions) explanations of diversity patterns. In the case of
freshwater fish, studies illustrate that biological factors (competition and predation),
along with physical factors (habitat diversity, water chemistry, flow regime, temperature
and channel morphology), interact to influence species richness within and among
communities and that both operate within a range of spatial scales.
This study identified global patterns of species richness and trophic diversity in
twelve Mediterranean biome freshwater fish communities located on six continents.
Differences were found in both species richness and trophic diversity between continental
river basins. This study also examined energetic, ecological, and historical factors that
may explain freshwater fish species richness and trophic diversity among Mediterranean
biome river basins. The energetic factor, average annual discharge, was found to explain
species richness; and that none of the seven factors measured explained trophic diversity.
This result is contrary to studies that have shown net primary productivity as explaining
species richness in global freshwater fish communities. The difference presented in this

v
study states that all basin studies were in one habitat type, the Mediterranean biome,
whereas other studies examined several varying habitat types. The resulting specific
knowledge can help conserve species richness and manage river basins altered by human
activity.
___________________________, Committee Chair Jamie Kneitel, Ph.D.
___________________________ Date

vi
DEDICATION
In loving memory of Sherwood Anthony Fehm Jr. and Saba Phyllis Fehm-Sullivan.

vii
ACKNOWLEDGMENTS
Completing a Masters is truly a marathon event, and I would not have
been able to complete this journey without the aid and support of countless people
over the past seven and a half years. I would like to express my gratitude to my
supervisor, Dr. Jamie Kneitel, whose expertise, understanding, and patience added
considerably to my graduate experience. I appreciate his vast knowledge and skill
in many areas (e.g., statistical analysis, community ecology, and dry humor), and
his assistance in writing. I also want to thank him for his calm reserve during
times of stress. I would like to thank the other members of my committee, Dr.
Bret Holland, and Dr. Patrick Foley for the assistance they provided at all levels
of my thesis project. Finally, I would like to thank Dr. Susanne Lindgren, the
Graduate Student Advisor, for giving me the opportunity to finish my thesis.
I would like to give my eternal gratitude to my father James E. Sullivan
for the guidance and wisdom that he has given me throughout my life. I have
been able to develop and grow as an individual as a result. He provided me with
moral, emotional, and writing support during this entire process. I doubt I will
ever be able to convey my appreciation fully. I must also acknowledge the quiet,
constant, intense and enduring support of my mother Sadie Çançar Sullivan. A
very special thank you goes to Dr. Barbara Cordonii, who years ago diagnosed
my learning disabilities, and with whose tutelage enabled me to reach this level of

viii
education. Without her motivation and encouragement, I would not have
considered a graduate career.

ix
TABLE OF CONTENTS Page
Dedication .......................................................................................................................... vi
Acknowledgments............................................................................................................. vii
List of Tables .......................................................................................................................x
List of Figures .................................................................................................................... xi
Introduction ..........................................................................................................................1
Methods................................................................................................................................9
Results ................................................................................................................................11
Discussion ..........................................................................................................................24
Conclusion .........................................................................................................................29
Appendix A. Trophic level richness per drainage basin. ...................................................32
Appendix B. Data sources ..................................................................................................33
Appendix C. Species lists and trophic level .......................................................................34
Appendix D. Table of environmental factor values per drainage basin ............................42
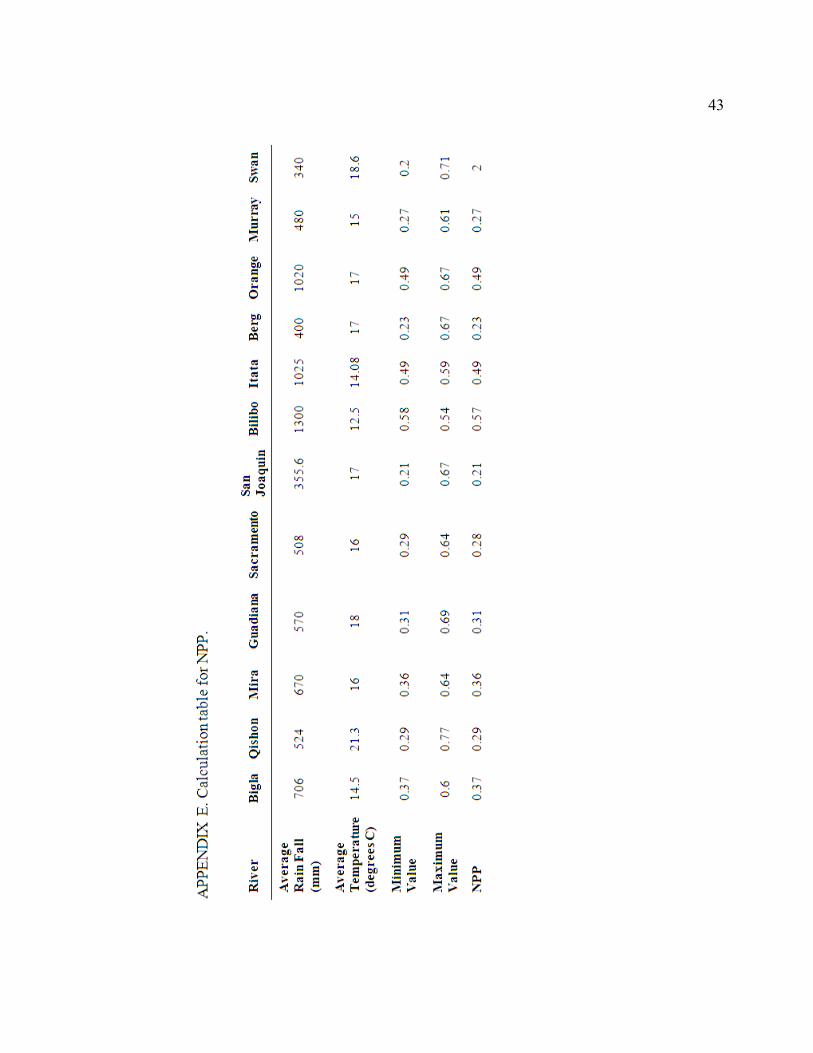
Appendix E. Calculation table for NPP .............................................................................43
Literature Cited ..................................................................................................................44
x
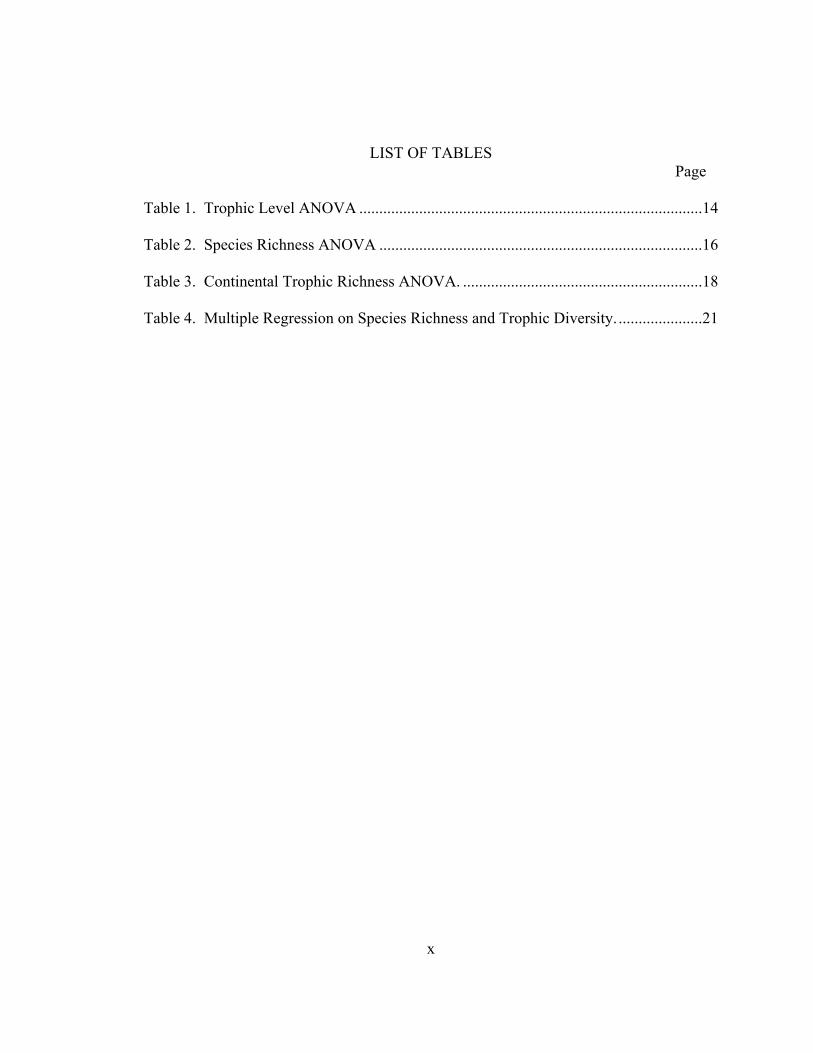
LIST OF TABLES Page Table 1. Trophic Level ANOVA ......................................................................................14 Table 2. Species Richness ANOVA .................................................................................16 Table 3. Continental Trophic Richness ANOVA. ............................................................18 Table 4. Multiple Regression on Species Richness and Trophic Diversity. .....................21

xi
LIST OF FIGURES Page Figure 1. Global map of Mediterranean Biome Locations .................................................8 Figure 2. Trophic Level Histogram. .................................................................................15 Figure 3. Species Richness Histogram. .............................................................................17 Figure 4. Continental Trophic Species Richness Histogram. ...........................................19 Figure 5. Continental Community Composition Chart. ....................................................20 Figure 6. Species Richness Regression with the San Joaquin River. ...............................22 Figure 7. Species Richness Regression without the San Joaquin River. ..........................23

1
INTRODUCTION
A central issue in both biogeography and community ecology is to understand the
factors that shape species richness patterns across different spatial scales (Cody and
Mooney, 1978; Griffiths, 2006). Among vertebrates, fish have been one of the most
intensely studied groups for local (within river), regional (among rivers), and
geographical (among regions) community structure. Numerous common patterns in fish
community organization have been identified among distinct river basins at several
different spatial scales. For example, at a local scale, physical factors appear to
determine species richness in variable environments (Capone and Kushlan, 1991). On
larger spatial scales (regional and geographical), physical factors such as area, total
discharge, and primary productivity, along with historical factors such as speciation rates
and dispersal are the major determinant of species richness and regulate the importance
of local-scale factors (Lamoureux et al., 2002).
To better understand freshwater fish communities, ecologists have studied several
aspects of community structure. These include biogeographic histories and their relation
to the distribution of freshwater fishes (Novacek, 1976; Bernatchez and Wilson, 1998;
McDowall, 2002; Landini and Sorbini, 2005; Goren and Ortal, 1998), diversity of
trophic categories (feeding patterns) (Tonn, 1990; Winemiller, 1991; Behrens and
Lafferty, 2007; Daufresne and Boёt, 2007; Erös, 2007; Mittelbach et al., 2007; Lévêque
et al., 2008), and species richness (Hawkins et al., 2003; Oberdorff et al., 1995; Guégan
et al., 1998; Oberdorff et al., 2001; Griffiths, 2006; Reyjol et al., 2007).

2
The inland water fishes of the Mediterranean have been studied since the first
description of Tilapia galieae by Peter Artedi, considered the father of Ichthyology, more
than 200 years ago (Goren and Ortal, 1998). Some biogeographers have recognized the
importance of the isolation of fishes, and distinct drainages in shaping species richness
and diversity. For example, Lyons and Willig (2002) noted that isolation preserved the
products of speciation events which occurred either within single bodies of water, or
when waters became fragmented and rejoined. Each isolated lake or river system tends to
have its own characteristics and a substantial number of endemic species. In some cases,
the present distribution of freshwater fishes has been shaped by millions of years of
change in global water cycles (Lèvêque et al., 2008). Due to these constantly changing
global water cycles (i.e. glaciation, water availability and temperature variation due to
climate change), the nature and dynamics of freshwater systems have evolved
continuously, at various spatial and temporal scales (Lèvêque et al., 2008). Although
clearly there can be important differences among the fish species present in tributaries
within any basin, species are typically more similar in any location within a river basin
than they are among locations in neighboring basins (Griffiths, 2006). These basins and
waterways can provide natural laboratories for the study of community structure and the
processes that influence them. The similarities among some of the fishes in these
historically isolated systems suggest broad-scale parallelism or convergence (Dyer, 2000;
Cussac et al., 2004; Landini and Sorbini, 2005).
Most studies of assemblage organization in stream fish address the effects of
inter-specific interactions and environmental variation on assemblage structure and
3
resource use (Moyle and Light, 1996). Some effort has been devoted to quantifying
large-scale variation and the multi-scale determinants of assemblage patterns and
processes (Bernatchez and Wilson, 1998). As a result, it is uncertain whether
determinants of local structure and function can be extrapolated to explain assemblage
patterns over broad regional scales (Bernatchez and Wilson, 1998). Moreover,
knowledge of the influence of regional constraints and historical processes on species
distribution, abundance, and assemblage composition remain general, although this
knowledge has been considered critical for advancement in stream fish ecology and
conservation (Poff, 1997). Because as a general rule fish only move by swimming, no
other single factor is more important in regional biogeography of freshwater fishes and
drainage basin limits and affinities (Koleff et al., 2003).
Spatial variability in species diversity patterns are primarily explained by three
hypotheses. These include the (1) species-area theory (Preston, 1962), which predicts
that species richness increases as a power function of surface area; (2) species-energy
theory (Wright, 1983), which predicts that species variation is correlated with energy
availability in the system; and (3) historical theory (Whittaker, 1977), which explains
richness gradients, on a global scale, by patterns of recolonization and maturation of
ecosystems after glaciation (Guégan et al., 1998). This study undertakes an exploration
to determine if any of these hypotheses for freshwater vertebrates (fishes) in similar
climates holds true. Much research on the community ecology of temperate freshwater
streams has been conducted in North America, and some researchers have assumed that
the patterns observed in North America should be applicable elsewhere (Reyjol et al.,

4
2007; Rühland et al., 2008). Notably, this assumption has recently been called into
question (Hendry and Stearns, 2004). In the circum-Mediterranean region, there is a
dearth of information about factors causing the large-scale spatial structuring of fish
assemblages. It is also doubtful whether the frameworks developed for temperate streams
can be directly translated to such semiarid systems (Reyjol et al., 2007).
Mediterranean ecosystems largely occur along the western edges of continents
between the 30° and 40° parallels in both northern and southern hemispheres. The
world’s five Mediterranean-climate ecosystems are limited to: the region bordering the
Mediterranean Sea; central Chile; the Cape region of South Africa; southwestern and
southern Australia; and all of California south to upper Baja California (Illes, 1978;
Moyle, 2002; Morgan, 2003; Figure 1). Moderated by cold ocean currents offshore, the
Mediterranean climate is characterized by mild, rainy winters and warm, dry summers
(Underwood et al., 2009). ). This favorable climate has made the Mediterranean Biome
densely populated by humans (Clavero et al., 2004).
Consequently, these regions suffer from multiple threats, including deforestation
and desertification that result from urbanization, agriculture, recreation and other human
activities. Invasive plants and animals are also drastically altering the ecosystem and its
biodiversity in all of the five Mediterranean regions of the world. As a result, the
Mediterranean biome, occurring on three percent of the earth’s total land area, is one of
the most highly altered and imperiled ecosystems on the planet, with the most disturbed
area of any biome (Underwood et al., 2009). In concert with high biodiversity and

5
endemism, this has resulted in all Mediterranean biome locations considered biodiversity
hotspots (Myers et al., 2000).
Several studies have focused on comparisons of physical characteristics of
species, species richness, and composition of Mediterranean biome communities within
one continental location, or between two different continental locations. These studies
have focused on the status of the high level of species richness and endemism in plant
communities (Mooney and Dunn, 1970; Cody and Mooney, 1978; Arroyo and Cavieres,
1991; Heywood, 1993; Cowling et al., 199; and Underwood et al., 2009). They have also
included avian communities (Kark and Sol, 2005) and freshwater fish communities
(Bernardo et al., 2003; Clavero at al., 2004; Darwall and Smith, 2006; Pascual et al.,
2007). Very few studies have focused on the communities or organisms found within the
Mediterranean biome and compared them across continents. These studies include those
done by Mooney and Dunn (1970) on Mediterranean plant species, which focused on the
physical similarities of plants illustrating instances of convergent evolution due to
similarities in climate, despite separate distinct evolutionary histories. Additionally,
Cody and Mooney (1978) found similar occurrences of convergent evolution due to
similar climates in their review of Mediterranean plant communities, in addition to other
similar studies that focused on bird and lizard communities (Kark and Sol, 2005;
Ioannidis, 2008).
No studies have looked specifically at freshwater fish trophic diversity within a
similar but isolated biome and compared them across continents, including the
Mediterranean biomes. Most fish assemblage comparisons are done across varying

6
latitudinal gradients of differing biotic regions such as Arctic, Nearctic, Tropical, and
Temperate regions (Winemiller, 1991), or are used to identify ichthyological “provinces”
of the world (Lèvêque et al., 2008). In addition, studies have been done to investigate
the freshwater icthyofauna of several Mediterranean streams (Goren and Ortal, 1999;
Kleynhans, 1999; Dyer, 2000; Kadye and Marshall, 2007). Many of these have been
conducted to establish a baseline of species present after urbanization and/or to monitor
restoration measures (Corbacho and Sanchez, 2001; Bernardo et al., 2003; Clavero et al.,
2004; Clavero et al., 2005; Habit et al., 2006; Magalhães et al., 2007). There are
however, no comparative studies of global freshwater fish community patterns within a
similar biome or latitudinal location. What makes the study of patterns in the
Mediterranean biome so uniquely compelling is its location. Being equidistant to the
Equator, this location minimizes or even eliminates any latitudinal gradient effects on
species richness and trophic diversity (Winemiller, 1991; Mittelbach et al., 2007).
The purpose of this study was to compare freshwater fish community richness and
structure among Mediterranean biomes, which have similar climatic conditions and
minimal latitudinal gradient effects. Differences of community trophic diversity and
species richness were tested between the biome locations, and related to measurable
physical parameters. These parameters were hydrology, geology, ecology, and climate.
The hydrological parameters included total drainage basin area in square kilometers and
mean annual discharge at the river mouth in cubic meters per second. The geological
parameters were total surface area of the continent and area of glaciation. The ecological

7
parameter was net primary productivity. Finally, the climactic parameters were mean
annual temperature and mean annual rain fall in the basin area.

8
Figure 1. Figure 1. Global Map of Mediterranean Biome Locations. California Mediterranean Research Learning Center (2009).
.

9
METHODS
The twelve rivers studied were distributed as follows: two river basins from each of
the continents of Europe, Asia, North and South America, Africa and Australia
(Appendix A). Species richness was obtained by recording presence data from published
sources of fish assemblages (Appendix B), which were then counted and totaled
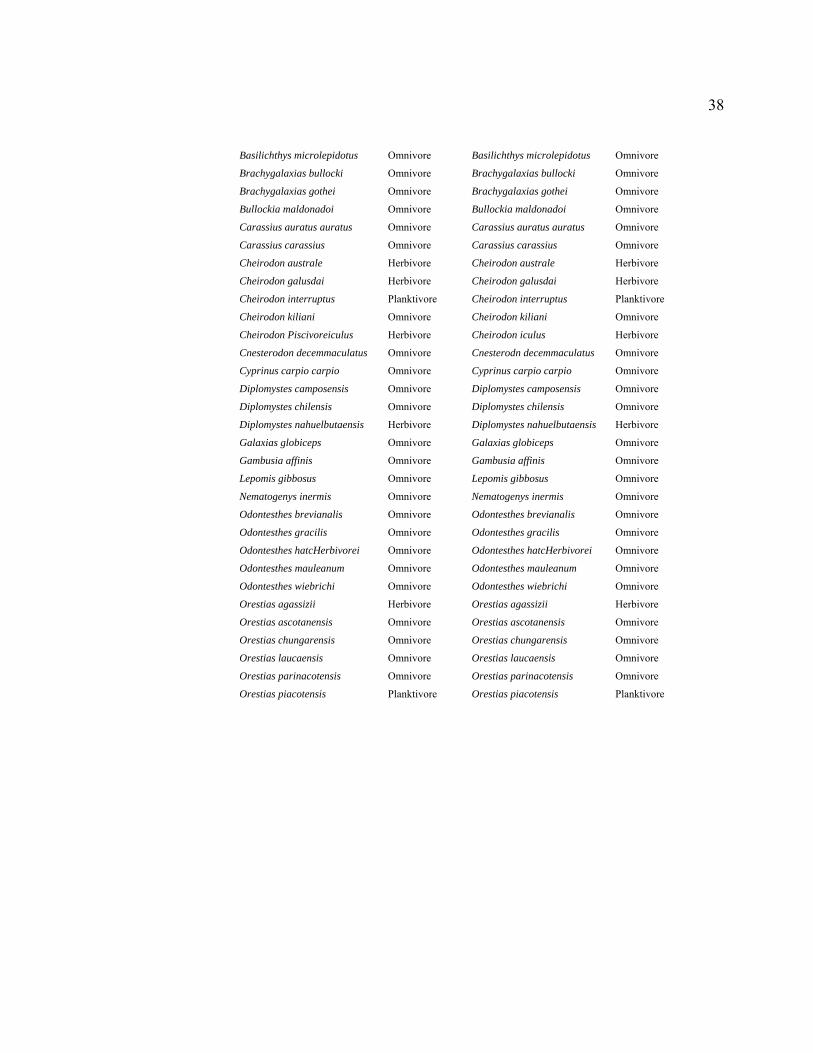
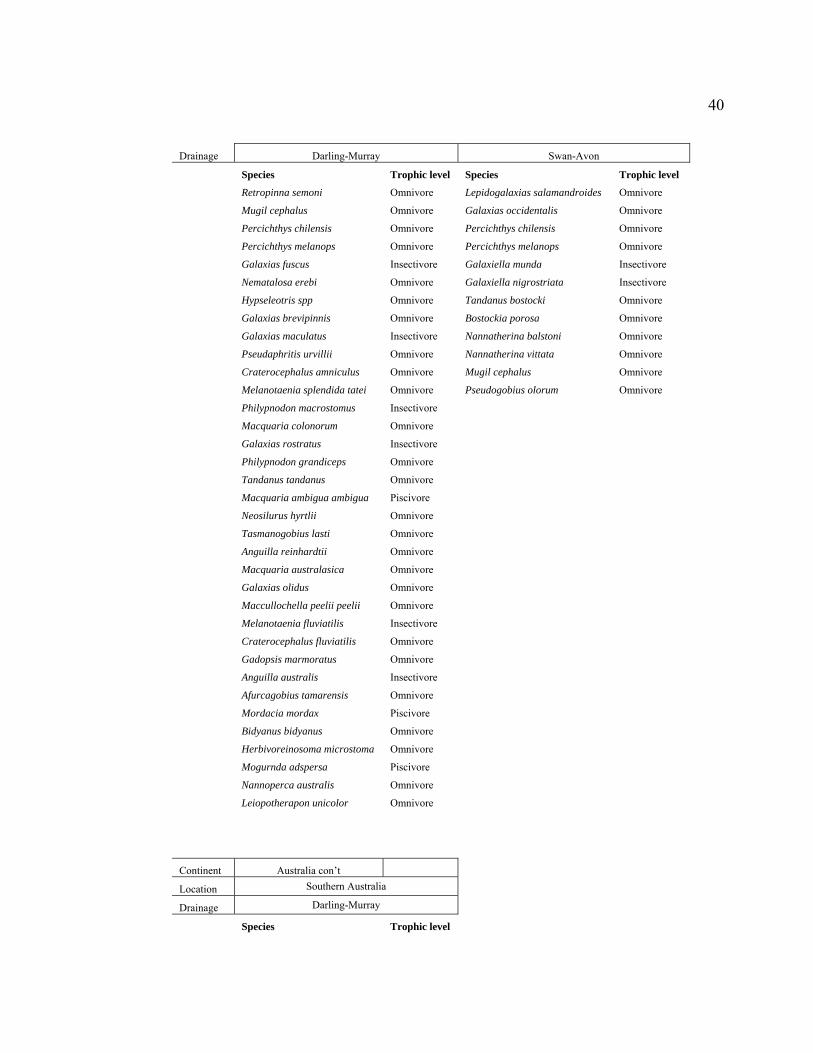
(Appendix A and C). Fish species found in drainages located within the six continents
were categorized into feeding guilds: insectivores, piscivores, herbivores, omnivores,
and planktivores using diet information from www.fishdatabase.org (Appendix C).
These five feeding guilds are commonly used for trophic level classification of fish in
North America (Karr, 1986) and Europe (Griffiths, 2006). Only adult forms were taken
into consideration as feeding behavior changes during ontogeny (Brown and Matthews,
1995). The number of species found in each of the five feeding guilds were counted and
totaled to determine species richness within trophic levels (Appendix A).
Values for fish species richness were subject to several sources of error. First, the
number of fish species may be underestimated due to inadequate sampling effort or
extinctions due to human activity occurring before collections were made (Oberdorff et
al., 1995). Secondly, the number of fish species may be overestimated if some species
have been recently introduced in rivers (Moyle 2002). To minimize these potential
adverse effects upon the accuracy of the study, only the most recent references were
selected, and only fish currently found within these basins were used. Extinct fishes were
not included in this study.

10
For each drainage system the following variables were determined from the
literature (Appendix D) : (1) total surface area of the drainage basin in square kilometer
(km2), (2) mean annual discharge at the river mouth in cubic meters per second (m3/s),
(3) total surface area of the continent (km2), (4) mean annual temperate (C˚), (5) mean
annual rain fall in the area (mm), (6) glaciated area within the study basin (km2), and (7)
net primary productivity (kg2/yr) as can be seen in Table 2.
The seventh variable of net primary productivity was calculated using Lieth’s
(1975) model as applied by Golubyatnikov and Denisenko (2001) (Appendix E). As net
aquatic productivity data was difficult to obtain, mean annual air temperature and mean
annual rainfall were used to estimate average mass of terrestrial primary productivity
from Lieth’s (1975) model as demonstrated by Oberdorff et al. (1995). Terrestrial
primary productivity and aquatic primary productivity co-vary (Livingstone et al., 1982;
Oberdorff et al., 1995; Hugueny, 1989) and were used as a surrogate in this study; as seen
in previous studies (Livingstone et al., 1982; Oberdorff et al., 1995; Hugueny, 1989).
Statistical Analysis
One-way analysis of variance (ANOVA), the two-way ANOVA, the chi-squared
test, and multiple regressions were all used to assess hypotheses. One-way ANOVAs
were used to determine whether the number of trophic levels present and species richness
differed among continents. A two-way ANOVA was used to determine whether the
species richness within each trophic level differed among continents. A chi-square test
was conducted to determine if there was an association between number of species per

11
trophic level and continent. Finally, two backward elimination multiple regressions were
used to determine if there were any relationships between the independent variables total
surface area, mean annual discharge, total surface area of the continent, mean annual
temperature, mean annual rain fall in the area, and the dependent variables of species
richness and number of trophic levels present. The variable, total basin area of historical
glaciation was removed from the multiple regressions because none of these basins had
any history of glaciation (Mercer, 1983; Moyle and Herbold, 1987). After running the
multiple regressions, the San Joaquin River became an outlier. Upon further
investigation, as this river is a highly disturbed system and in fact is intermittently dry for
over 132 miles (Pereira et al., 1996), it was removed from the data set.
Species richness (total and within trophic levels) data was not normally distributed.
All attempts at transformation of these data sets were unsuccessful at obtaining normal
distribution, including squaring, taking the square root, taking the natural log, and
multiplying the data set. As a result, non-parametric tests were used and caution should
be used when interpreting the results. Data was analyzed using SPSS 17.0 software.
RESULTS
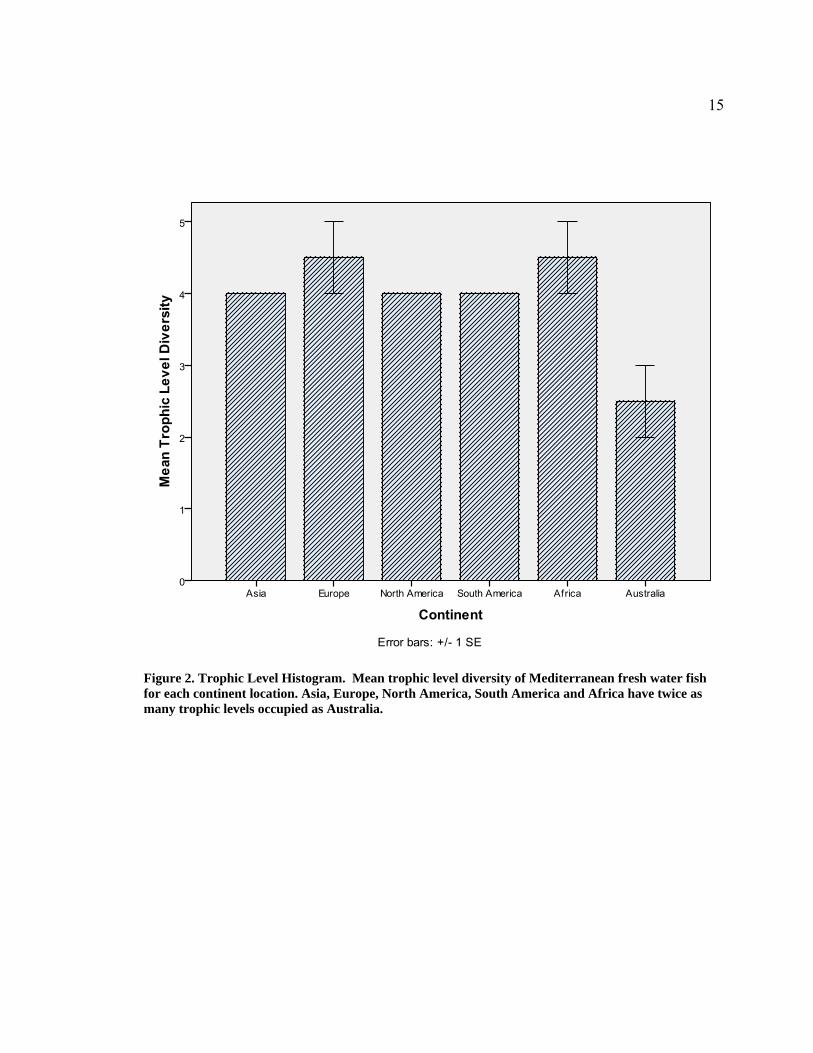
Numbers of trophic levels (trophic diversity) were statistically different among
continental locations (Table 1, Figure 2). The continents of Asia, Europe, North
America, Africa and South America had somewhat similar trophic diversity. Trophic
levels from all continents were significantly different from Australia (Figure 2). Rivers
in Africa, Asia, Europe, North America, and South America supported almost twice as

12
many trophic levels as Australia (Figure 2). Total species richness was also significantly
different among continents (Table 2, Figure 3). North America, Australia, and South
America had greater species richness then that of Asia, Europe and Africa. Across trophic
levels and continents, there were significant differences in species richness (Table 3,
Figure 4). The omnivore trophic level had the greatest number of species than any other
group (Figure 4 and 5).
The chi-square test conducted to determine a possible association between species
richness of trophic levels and continent revealed a significant difference between trophic
richness levels in the southern hemisphere and the northern hemisphere (X2 = 34.59,
df=4, P<0.001 (Figure 5).
Ecological and Historical Factors on Species Richness
Among all six factors (total surface area of the drainage basin, mean annual
discharge at the river mouth, total surface area of the continent, mean annual temperate,
mean annual rain fall, and glaciated area within the study basin) there were no
statistically significant relationships with species richness except for a weak positive
relationship with annual average discharge (Table 3, Figure 6). The San Joaquin River
was found to be the only outlier. With this outlier removed, there was a very strong
positive relationship between species richness and annual average discharge (Table 4) as
seen in Figure 7.

13
Ecological and Historical Factors on Number of Tropic Levels Present
Among all six factors of total surface area of the drainage basin, mean annual
discharge at the river mouth, total surface area of the continent, mean annual temperate,
and mean annual rain fall, there were no statistically significant relationships within
tropic levels (Table 4).

14
Trophic Level SS df MS F-value P-value
Between
Continents 5.417 5 1.083 4.333 0.051
Within
Continents 1.500 6 0.250
Total 6.917 11 229.9
Table 1. Trophic Level ANOVA. Statistical summary of a one-way ANOVA results for between continent effects for number of trophic levels present. This table illustrates that there is a statistically significant difference between the numbers of trophic levels between continental locations. All statistically significant P-values are italicized.
15
Figure 2. Trophic Level Histogram. Mean trophic level diversity of Mediterranean fresh water fish for each continent location. Asia, Europe, North America, South America and Africa have twice as many trophic levels occupied as Australia.

16
Species Richness SS Df MS F-value P-value
Between
continents 4916.667 5 983.33 5.717 0.028
Within
Continents 1032.000 6 172.00
Total 5948.667 11
Table 2. Species Richness ANOVA. Statistical summary of a one-way ANOVA results for between continent effects for species richness. This table illustrates that there is a statistically significant difference between the numbers of trophic levels between continental locations. All statistically significant P-values are italicized.

17
Figure 3. Species Richness Histogram. Mean species richness of Mediterranean fresh water fish for each continent location. North America has the greatest number of species. Australia and South America are the second most specious and have similar species richness. Asia, Europe, and Africa are similar and have the least amount of species richness.

18
Source SS Df MS F-value P-value
Trophic Level 4038.90 4 1009.725 49.335 P <0.001
Continent 983.33 5 196.667 9.609 P<0.001
Trophic Level*Continent 2511.50 20 125.575 6.136 P<0.001
Error 614.00 30 20.467
Total (Corr) 8147.73 59
Table 3. Continental Trophic Richness ANOVA. Statistical summary of a two-way ANOVA testing possible interactions between tropic level, species richness and continent. This table illustrates that there is a significant difference in species richness among both trophic levels and continents. Additionally, there is a significant interaction between trophic level and content on species richness. All significant P-values are italicized.

19
Figure 4. Continental Trophic Species Richness Histogram. This represents all of the species present within the trophic levels present at each continental location.

20
Figure 5. Continental Community Composition Chart. This chart breaks down each continent into its representative trophic levels and their contribution to total species richness.

21
Table 4. Multiple Regression on Species Richness and Trophic Diversity. This table consists of the most descriptive factors on species richness and trophic diversity found when conducting a backwards multiple regression on the hydrological, geological, ecological, and climactic factors. Included are annual average discharge both with and without the San Joaquin River on species richness, and drainages area on trophic diversity. These values had the lowest P-value of all 7 factors measured against. Significant P values are italicized.
Dependent variable
Parameter R F-value P-value Df Model
Species Richness (SR)
Annual Average Discharge with San Joaquin River (AAD)
0.478 2.965 0.116 11 SR=0.035(AAD)+15.524
Species Richness (SR)
Annual Average Discharge without San Joaquin River (AAD)
0.852 23.847 0.001 10 SR=0.058(AAD)+0.571
Trophic Diversity (TD)
Drainage Area (AREA)
0.45 2.533 0.143 11 TD=4.065-1.197e^-6(AREA)

22
Figure 6. Species Richness Regression with the San Joaquin River. Species Richness of Mediterranean freshwater fish for each river as a function of annual average discharge at river mouth. This regression is illustrated with the San Joaquin River included.

23
Figure 7. Species Richness Regression without the San Joaquin River. Species richness of Mediterranean freshwater fish for each river excluding the San Joaquin River, as a function of annual average discharge at river mouth.

24
DISCUSSION
Freshwater fish community structure (trophic level diversity, trophic level
richness, and species richness) differed across each of the six Mediterranean biomes.
North America supported the highest levels of species richness followed by Australia and
South America; Asia, Europe, and Africa were similar and had lower species richness
(Figure 3). Australia had the least amount of species richness present (Figure 2).
Continental trophic richness differed significantly with omnivory consistently
having the highest species richness (Figure 4). Further observation revealed significant
differences between types of trophic levels present among the continental locations
specifically regarding the richness of both insectivores and piscivores between the
northern and southern hemispheres (Figure 5). The northern hemisphere had
significantly fewer insectivores than the southern hemisphere. Conversely, the northern
hemisphere had significantly more piscivores then the southern hemisphere.
The second investigation comprising this study examined differences of
community trophic diversity and species richness between the biome locations, in
addition to seeing if these differences could be explained by measurable physical
parameters such as hydrology, geology, ecology, and climate. Among all seven factors
measured, only the hydrological parameters of annual average discharge demonstrated a
positive effect upon species richness (Figure 7). No significant effects of the seven
factors on trophic diversity were found.
Historically, biogeography is the science of studying and observing patterns in
ecosystems at different spatial and temporal scales (Lamouroux, 2002). Previous studies

25
have done so by using various community properties, such as species richness and
proportional composition of trophic levels (Moyle and Herbold, 1987; Lamouroux,
2002). Such patterns expressed in community convergence are an aspect of the
hypothesis that characteristics of communities are predictable from their environment
(Schluter, 1986), and that communities are structured rather than random entities.
Models predicting similarities in community traits from independent systems having
similar environmental features suggest the existence of key repeated mechanisms
underlying community organization (Lamouroux, 2002). Therefore, while predictive
tools in ecology often site specific and poorly transferable across ecosystems (Peters and
Myers, 1991), convergence studies can provide general models for predicting
fundamental community patterns in multiple sites (Mooney and Dunn, 1970; Cody and
Mooney, 1978). This study investigated community structure across the broadly separate
geographic regions in the Mediterranean biome and then compared this structure in terms
of trophic level diversity.
The concept of trophic levels is one of the oldest ideas in ecology and helps us to
understand assemblage composition and energy flow within communities (Thompson et
al., 2007). The results of the trophic diversity analysis of this study illustrate a
prevalence of omnivory within all of the continental locations. This is not the only case
where omnivory dominates communities, a fact that has been documented in several
aquatic systems (e.g., marine, reservoirs, and estuarine) and is thought to stabilize food
webs (Emmerson and Yearsley, 2004). The importance and prevalence of omnivory for
the structure and dynamics of food webs is a long-standing controversy (Cousins, 1987;

26
Burns, 1989; Polis, 1991; Holt and Polis, 1997; Vandermeer, 2006; Thompson et al.,
2007). Omnivory is key to the fundamental understanding of food web dynamics, and
as a result much debate has occurred over this subject (Polis and Strong, 1996; Hairston
and Hairston, 1997; Thompson et al., 2007). Current theoretical models suggest that
omnivory may in fact stabilize food webs (Emmerson and Yearsley, 2004; Thompson et
al., 2007), and that larger food webs support higher levels of omnivory (Woodward and
Hildrew, 2002; Thompson et al., 2007). This theory was evident in this study, as there
were greater numbers of species within continental locations that had higher levels of
omnivory (Figure 4 and 5). Further analysis would be required to confirm this
possibility.
The inverse proportion of piscivorous and insectivorous species richness between
the northern and southern hemisphere is not surprising as both of these families evolved
separately approximately 160 to 150 million years ago; salmonids evolved in Laurasia
while the galaxiid family evolved in Gondwanaland (Waters et al., 2000; McDowall,
2002; Clavero et al., 2005; Lévêque et al., 2008). This finding supports both the well-
documented biogeographical colonization histories of the southern and northern
hemispheres (McDowall, 2002) and the positive relationship between body size and
trophic level in fishes (see Data collected in Appendix C). Body size determines the
range of prey species a predator can consume, allowing larger individuals with larger
anatomy to feed at higher trophic levels (Winemiller, 1991; Jennings et al., 2001). The
salmonid family dominates northern hemisphere freshwater fish communities in
temperate locations, which tend to be large piscivorous fish (Jennings et al., 2001).

27
Meanwhile, in the southern hemisphere the galaxiid family dominates these same
communities, which tend to be small insectivorous fish (Reyjol et al., 2007).
While these two historical explanations of trophic level composition contribute to
understating the observed patterns, other ecological processes such as extinction,
invasion, competition, and disturbance, may also play a role in shaping these
communities.
As previously discussed, the difference in the predictive ability of varying factors
is based on the size scale of the community patterns. On the local scale, physical factors
appear to determine species richness in variable environments (Capone and Kushlan,
1991). On larger spatial scales (regional and geographical), physical factors such as area,
total discharge, and primary productivity, along with historical factors such as speciation
rates and dispersal are the major determinant of species richness, and regulate the
importance of local-scale factors (Lamoureux et al., 2002). These differences in spatial
variability in species diversity patterns are primarily explained by the three previously
introduced theories: the species-area theory (Preston, 1962), the species-energy theory
(Wright, 1983), and the historical theory (Whittaker, 1977). This study sought to try and
branch these two differing spatial scales by comparing similar a similar type of
environment across a broad geographical area, in addition to trying to determine if any of
the three aforementioned hypotheses held true for freshwater vertebrates (fishes) in
similar climates.
The results of this study indicated that annual average discharge is the most
important factor influencing freshwater fish species richness patterns globally across the

28
entire Mediterranean biome, illustrating for the Mediterranean biome that the species-
area theory and historical theory do not explain species richness patterns. This finding is
consistent with those of Poff and Allan (1995), Oberdorff et al. (2001) and Cattanéo
(2005). These studies show that changes in annual average discharge influence the
functional organization of fish assemblages and/or demonstrated effects on species
richness. While the species-energy theory does help explain species richness across the
Mediterranean biome, additional consideration is in order since several previous studies
looking at freshwater species richness patterns have found that area, average annual
discharge, and primary productivity explained species richness (Oberdorff et al., 1995;
Guégan, 1998; Hawkins et al., 2003; Clavero et al., 2004). Nevertheless, a general
understanding of the degree of similarity of fish communities across geographical distinct
basins is lacking. This is primarily because quantitative descriptors can sometimes
become intercorreleated across basins, making it difficult to identify which factors are
responsible for community structure (Lamaroux, 2002). Using these species richness
theories as general predicative tools of community characteristics seem to initially require
precise measurements of the factors defining the community’s habitat (Lamaroux, 2002).
A better understanding of Mediterranean biome communities could be achieved by
further studies into the hydraulic nature of these basins, the effect of high disturbance of
flow regime on primary productivity, and the effect of invasive species on the native
community.
In this study, primary productivity not being a predictor of species richness could
be due to the highly disturbed nature of the riparian habitat of the Mediterranean biome.

29
As previously stated, the Mediterranean biome is one of the most altered systems in the
world. Several studies have illustrated that changes in natural stream regime affect
primary productivity (Mallin et al., 1993). All rivers in this study, as with most
Mediterranean biome rivers, have been dammed and have several water diversions. The
primary reasons for these dams are flood control, to regulate the fluctuation of water flow
throughout the year, and agricultural purposes. As in all Mediterranean biome locations,
agriculture has been a dominant feature of the terrestrial environment. This has led to the
degradation of riparian habitats and diversion of water from the rivers themselves to
irrigate vast croplands (Underwood et al., 2009). Due to the installation of these dams,
the natural hydrology of these rivers has also been altered to reflect more of a constant
flow regime rather than the cyclical flood regime that defines the Mediterranean biome
(Junk et al., 1989). The damming of a river has been called a cataclysmic event in the
life of a riverine ecosystem (Ligon et al., 1995). By changing the flow of water,
sediment, nutrients, energy, and biota, dams interrupt and alter most of a river’s
important ecological processes (Ligon et al., 1995). This could be the reason that
primary productivity in the basins studied does not reflect species richness.
CONCLUSION
The data and analysis presented here have led to the surprising conclusion that
annual average discharge is the most important factor influencing fish species richness
patterns globally across the entire Mediterranean biome. This illustrates that for the
Mediterranean biome the species-area theory and historical theory do not explain species

30
richness patterns. While the species-energy theory does help explain species richness in
the Mediterranean biome, additional consideration is in order; since several previous
studies looking at freshwater species richness patterns have found that area, average
annual discharge and primary productivity explained species richness (Oberdorff et al.,
1995; Guégan, 1998; Hawkins et al., 2003).
The Mediterranean-climate regions of the world are renowned for high levels of
richness and endemism in both flora and fauna. However, it is one of the most imperiled
ecosystems in the world, and has the highest density of human population and
agricultural practices. A fuller understanding of these freshwater Mediterranean
communities, their composition, and the factors that contribute to their survival and
enhancement will help formulate the required strategies to rehabilitate, conserve, and
protect them in the future. Armed with the knowledge that annual average discharge of
these highly endangered river basins directly influences species diversity, dam discharge
regimes can be monitored and modified to result in the desired level of species richness.

31
APPENDICES

32
Appendix B. Data sources.

33
Location Drainage
Drainage Area in Square
Kilometers
Average Annual Discharge in Cubic Meters per Second
Area of Continent in
Square Kilometers
Average Annual Rain
Fall in millimeters
Average Annual
Temperature in Degrees Celsius
Average Area of
Historical Glaciation
Species Richness in Number of
Species
Europe
Mira Antunes,
2008
Global Runoff Data Center,
2010
Encyclopedia Britannica,
2008
Magalhaes, 2002
Magalhaes, 2002
Illes, 1978;
Griffiths, 2006
Bernardo et al., 2003
Guadiana Clavero et al., 2004
Global Runoff Data Center,
2010
Encyclopedia Britannica,
2008
Corbacho and Sanchez,
2001
Corbacho and Sanchez, 2001
Illes, 1978;
Griffiths, 2006
Clavero et al., 2005
Asia
Bilga Sari et al.,
2006
Global Runoff Data Center,
2010
Encyclopedia Britannica,
2008
World Weather
Information Service,2000
World Weather Information
Service, 2000
Illes, 1978;
Griffiths, 2006
Sari et al., 2006
Qishon Bar-Or,
2000
Oren et al., 1973; Global Runoff Data Center, 2010
Encyclopedia Britannica,
2008
World Weather
Information Service, 2000
Bar-Or, 2000 Goren and
Ortal, 1999
Oren et al., 1973; Goren and Ortal,
1999
North America
Sacramento Moyle, 2002
Global Runoff Data Center,
2010
Encyclopedia Britannica,
2008
World Weather
Information Service, 2000
World Weather Information
Service ,2000
May and Brown, 2002
May and Brown, 2002
San Joaquin
Moyle, 2002
Global Runoff Data Center,
2010
Encyclopedia Britannica,
2008
World Weather
Information Service, 2000
World Weather Information
Service, 2000
Moyle, 2002
Moyle, 2002
South America
Biobío
Gobierno De Chile, Direccion
General De Aguas, 2004
Oyarzun, 1995; Feige et al.,
2009; Global Runoff Data Center, 2010
Encyclopedia Britannica,
2008
Oyarzun, 1995;
Gobierno De Chile,
Direccion General De Aguas, 2004
World Weather Information
Service, 2000
Cussac et al., 2004
Dyer, 2000
Itata
Gobierno De Chile, Direccion
General De Aguas, 2004
Feige et al., 2009; Global Runoff Data Center, 2010
Encyclopedia Britannica,
2008
World Weather
Information Service,
2000
World Weather Information
Service, 2000
Cussac et al., 2004
Dyer, 2000; Figueroa et al.,
2010
Africa
Berg Kalejta and
Hockey, 1991
Global Runoff Data Center,
2010
Encyclopedia Britannica,
2008
Flügel, 1995; World
Weather Information
Service, 2000
Flügel, 1995; World Weather
Information Service., 2000
Cussac et al., 2004
Livingstone et al., 1982
Orange Kleynhans,
1999
Global Runoff Data Center,
2010
Encyclopedia Britannica,
2008
Swanevelder, 1981; World
Weather Information
Service, 2000
Flügel, 1995; World Weather
Information Service, 2000
Cussac et al., 2004
Livingstone et al., 1982
Australia
Murray Walker et al., 1993
Global Runoff Data Center,
2010
Encyclopedia Britannica,
2008
World Weather
Simpson et al., 1993;
Information Service, 2000
World Weather Information
Service, 2000
Unmack, 2001;
Cussac et al., 2004
Allen et al., 2002; Morgan, 2003; Morgan et al.,
2005; Australian Department of Fisheries, 2009
Swan Morgan,
2004
Global Runoff Data Center,
2010
Encyclopedia Britannica,
2008
World Weather
Information Service,
2000; Viney and
Sivapalan, 2001
World Weather Information
Service, 2000
Unmack, 2001;
Cussac et al., 2004
Allen et al., 2002; Morgan, 2003; Morgan,, 2004; Morgan et al.,
2005; Australia Department of Fisheries, 2009
Appendix C. Species lists and trophic level.

34
Continent Europe
Location Iberian Peninsula
Drainage Guadiana Mira
Continent Asia
Location Turkey Israel
Drainage Bigla Qishon
Species Trophic level Species
Trophic Level
Anguilla anguilla Piscivore Anguilla anguilla Piscivore
Salmo trutta macrostigma Omnivore Acantghobrama lissneri Omnivore
Oncorhynchus mykiss Omnivore Garra rufa Herbivore
Leuciscus cephalus Omnivore Hemigrammocapoeta nana Herbivore
Petroleuciscus borysthenicus Omnivore Clarias gariepinus Omnivore
Rhodeus amarus Herbivore Aphanius mento Omnivore
Phoxinus phoxinus Omnivore Mugil cephalus Planktivore
Vimba vimba Omnivore Liza ramada Planktivore
Chalcalburnus chalcoides Omnivore Orecochromis aureus Planktivore
Barbus tauricus escherichi Planktivore Tilapia zillii Herbivore
Capoeta capoeta bergamae Planktivore Tristamella sacra Omnivore
Gobio gobio Omnivore Mugil cephalus Omnivore
Cobitis fahirae Omnivore
Neogobius fluviatilis Omnivore
Mugil cephalus Omnivore

35
Species Trophic level Species Trophic level
Petromyzon marinus Piscivore Anguilla anguilla Piscivore
Anguilla anguills Piscivore Chondrostoma lemmingii Omnivore
Alosa alosa Omnivore Barbus sclateri Omnivore
Anaecypris hispanica Planktivore Barbus bocagei Omnivore
Barbus comiza Piscivore Chondrostoma polylepis Planktivore
Luciobarbus microcephalus Omnivore Rutilus alburonides Omnivore
Barbus sclateri Omnivore Mugil cephalus Omnivore
Chondrostoma polylepis Omnivore
Leuciscux pyrenaicus Omnivore
Rutilus lemmingii Omnivore
Tinca tinca Omnivore
Tropidophoxinellus alurnoides Omnivore
Coitis paludica Omnivore
Gasterosteus aculeatus Omnivore
Blennius fluviatilis Omnivore
Oncorhynchus mykiss Omnivore
Esox lucius Piscivore
Carassius auratus Herbivore
Cyprinus carpio Omnivore
Gobio gobio Omnivore
Lepomis gibbossus Omnivore
Micropterus salmoides Piscivore
Gambusia holbrooki Insectivore
Mugil cephalus Omnivore
Continent North America
Location California
Drainage Sacramento San Joaquin
Species Trophic level Species
Trophic level
Lampetra tridentata Piscivore Lampetra tridentata Piscivore

36
Lampetra fluviatilis Piscivore Lampetra fluviatilis Piscivore
Lampetra pacifica Piscivore Entosphenus hubbsi Piscivore
Acipenser transmontanus Omnivore Acipenser transmontanus Omnivore
Acipenser medirostris Omnivore Acipenser medirostris Omnivore
Alosa sapidissima Omnivore Alosa sapidissima Omnivore
Dorosoma petenese Herbivore Dorosoma petenese Herbivore
Cyprinus carpio Omnivore Cyprinus carpio Omnivore
Carassius auratus Herbivore Carassius auratus Herbivore
Notemigonus crysoleucas Omnivore Notemigonus crysoleucas Omnivore
Orthodon microlepidotus Omnivore Orthodon microlepidotus Omnivore
Mylopharodon conocephalus Omnivore Mylopharodon conocephalus Omnivore
Lavinia exilicauda Omnivore Lavinia exilicauda Omnivore
Ptychocheilus grandis Piscivore Ptychocheilus grandis Piscivore
Gila bicolor Omnivore Pogonichthys macrolepidotus Omnivore
Pogonichthys macrolepidotus Omnivore Hesperoleucus symmetricus Omnivore
Hesperoleucus symmetricus Omnivore Hesperoleucus symmetricus Omnivore
Rhinichthys osculus Omnivore Rhinichthys osculus Omnivore
Richardsonius egregius Omnivore Notemigonus crysoleucas Omnivore
Notemigonus crysoleucas Omnivore Pimephales promelas Herbivore
Pimephales promelas Herbivore Catostomus occidentalis Herbivore
Catostomus planyrhynchus Herbivore Ictalurus furcatus Omnivore
Catostomus occidentalis Herbivore Ictalurus punctatus Omnivore
Ictalurus furcatus Omnivore Ictalurus catus Piscivore
Ictalurus punctatus Omnivore Ictalurus nebulosus Omnivore
Ictalurus catus Piscivore Ictalurus melas Omnivore
Ictalurus nebulosus Omnivore Hypomesus transpacificus Planktivore
Ictalurus melas Omnivore Hypomesus nipponensis Omnivore
Hypomesus transpacificus Planktivore Spirinchus thaleichthys Omnivore
Hypomesus nipponensis Omnivore Oncorhynchus kisutch Planktivore
Spirinchus thaleichthys Omnivore Oncorhynchus tshawytscha Omnivore
Oncorhynchus kisutch Planktivore Oncorhynchus mykiss Omnivore
Oncorhynchus tshawytscha Omnivore Oncorhynchus keta Omnivore
Oncorhynchus mykiss Omnivore Oncorhynchus gorbuscha Omnivore
Oncorhynchus keta Omnivore Oncorhynchus nerka Planktivore
Oncorhynchus gorbuscha Omnivore Salmo trutta Omnivore
Oncorhynchus nerka Planktivore Salvelinus fontinalis Omnivore
Salmo trutta Omnivore Salvelinus namaycush Omnivore
Continent North America con’t
Location California
Drainage Sacramento San Joaquin
Salvelinus namaycush Omnivore Lucania parva Omnivore
Salvelinus fontinalis Omnivore Salvelinus confluentus Omnivore
Lucania parva Omnivore Menidia beryllina Planktivore
Gambusia affinis Omnivore Gasterosteus aculeatus Omnivore

37
Menidia beryllina Planktivore Morone saxatilis Omnivore
Gasterosteus aculeatus Omnivore Morone chrysops Piscivore
Morone saxatilis Omnivore Archoplites interruptus Omnivore
Morone chrysops Piscivore Pomoxis nigromaculatus Omnivore
Archoplites interruptus Omnivore Pomoxis annularis Piscivore
Pomoxis nigromaculatus Omnivore Lepomis gulosus Omnivore
Pomoxis annularis Piscivore Lepomis cyanellus Omnivore
Lepomis gulosus Omnivore Lepomis macrochirus Omnivore
Lepomis cyanellus Omnivore Lepomis gibbosus Omnivore
Lepomis macrochirus Omnivore Lepomis microlophus Omnivore
Lepomis gibbosus Omnivore Micropterus salmoides Omnivore
Lepomis microlophus Omnivore Micropterus punctulatus Omnivore
Micropterus salmoides Omnivore Micropterus dolomieui Omnivore
Micropterus punctulatus Omnivore Micropterus coosae Omnivore
Micropterus dolomieui Omnivore Perca flavescens Omnivore
Micropterus coosae Omnivore Percina macrolepida Omnivore
Perca flavescens Omnivore Hysterocarpus traski Omnivore
Percina macrolepida Omnivore Eucyclogobius newberryi Omnivore
Hysterocarpus traski Omnivore Acanthogobius flavimanus Omnivore
Eucyclogobius newberryi Omnivore Tridentiger bifasciatus Omnivore
Acanthogobius flavimanus Omnivore Leptocottus armatus Omnivore
Tridentiger bifasciatus Omnivore Cottus asperrimus Omnivore
Leptocottus armatus Omnivore Cottus gulosus Omnivore
Cottus asperrimus Omnivore Planktivoretichthys stellatus Omnivore
Cottus gulosus Omnivore Mugil cephalus Omnivore
Planktivoretichthys stellatus Omnivore
Mugil cephalus Omnivore
Continent South America
Location Central Chile Central Chile
Drainage Biobio Itata
Species Trophic level Species Trophic level
Ameiurus melas Omnivore Ameiurus melas Omnivore
Ameiurus nebulosus Omnivore Ameiurus nebulosus Omnivore
Ancistrus erinaceus Herbivore Ancistrus erinaceus Herbivore
Australoheros facetus Omnivore AustraloHerbivoreos facetus Omnivore
Basilichthys australis Omnivore Basilichthys australis Omnivore
38
Basilichthys microlepidotus Omnivore Basilichthys microlepidotus Omnivore
Brachygalaxias bullocki Omnivore Brachygalaxias bullocki Omnivore
Brachygalaxias gothei Omnivore Brachygalaxias gothei Omnivore
Bullockia maldonadoi Omnivore Bullockia maldonadoi Omnivore
Carassius auratus auratus Omnivore Carassius auratus auratus Omnivore
Carassius carassius Omnivore Carassius carassius Omnivore
Cheirodon australe Herbivore Cheirodon australe Herbivore
Cheirodon galusdai Herbivore Cheirodon galusdai Herbivore
Cheirodon interruptus Planktivore Cheirodon interruptus Planktivore
Cheirodon kiliani Omnivore Cheirodon kiliani Omnivore
Cheirodon Piscivoreiculus Herbivore Cheirodon iculus Herbivore
Cnesterodon decemmaculatus Omnivore Cnesterodn decemmaculatus Omnivore
Cyprinus carpio carpio Omnivore Cyprinus carpio carpio Omnivore
Diplomystes camposensis Omnivore Diplomystes camposensis Omnivore
Diplomystes chilensis Omnivore Diplomystes chilensis Omnivore
Diplomystes nahuelbutaensis Herbivore Diplomystes nahuelbutaensis Herbivore
Galaxias globiceps Omnivore Galaxias globiceps Omnivore
Gambusia affinis Omnivore Gambusia affinis Omnivore
Lepomis gibbosus Omnivore Lepomis gibbosus Omnivore
Nematogenys inermis Omnivore Nematogenys inermis Omnivore
Odontesthes brevianalis Omnivore Odontesthes brevianalis Omnivore
Odontesthes gracilis Omnivore Odontesthes gracilis Omnivore
Odontesthes hatcHerbivorei Omnivore Odontesthes hatcHerbivorei Omnivore
Odontesthes mauleanum Omnivore Odontesthes mauleanum Omnivore
Odontesthes wiebrichi Omnivore Odontesthes wiebrichi Omnivore
Orestias agassizii Herbivore Orestias agassizii Herbivore
Orestias ascotanensis Omnivore Orestias ascotanensis Omnivore
Orestias chungarensis Omnivore Orestias chungarensis Omnivore
Orestias laucaensis Omnivore Orestias laucaensis Omnivore
Orestias parinacotensis Omnivore Orestias parinacotensis Omnivore
Orestias piacotensis Planktivore Orestias piacotensis Planktivore

39
Continent Australia
Location Southern Australia South Western Australia
Continent Africa
Location South Africa South Africa
Drainage Orange Berg
Species Trophic level Species Trophic level
Austroglanis sclateri Omnivore Pseudobarbus phlegethon Insectivore
Barbus aeneus Omnivore Oncorhynchus mykiss Omnivore
Barbus anoplus Omnivore Pseudobarbus burgi Omnivore
Barbus hospes Omnivore Sandelia capensis Omnivore
Barbus kimberleyensis Piscivore Calaxias zebratus Planktivore
Barbus pallidus Omnivore Micropterus dolomieu Omnivore
Barbus trimaculatus Omnivore Lepomis macrochirus Omnivore
Clarias gariepinus Omnivore Labeo umbratus Herbivore
Labeo capensis Herbivore Liza richardsonii Planktivore
Labeo umbratus Herbivore Mugil cephalus Omnivore
Liza richardsonii Planktivore
Mesobola brevianalis Planktivore
Mugil cephalus Omnivore
Pseudobarbus quathlambae Insectivore
Tilapia rendalli Herbivore
Tilapia sparrmanii Herbivore
Cyprinus carpio Omnivore
Oreochromis mossambicus Herbivore
Pseudobarbus quathlambae Insectivore
40
Drainage Darling-Murray Swan-Avon
Species Trophic level Species Trophic level
Retropinna semoni Omnivore Lepidogalaxias salamandroides Omnivore
Mugil cephalus Omnivore Galaxias occidentalis Omnivore
Percichthys chilensis Omnivore Percichthys chilensis Omnivore
Percichthys melanops Omnivore Percichthys melanops Omnivore
Galaxias fuscus Insectivore Galaxiella munda Insectivore
Nematalosa erebi Omnivore Galaxiella nigrostriata Insectivore
Hypseleotris spp Omnivore Tandanus bostocki Omnivore
Galaxias brevipinnis Omnivore Bostockia porosa Omnivore
Galaxias maculatus Insectivore Nannatherina balstoni Omnivore
Pseudaphritis urvillii Omnivore Nannatherina vittata Omnivore
Craterocephalus amniculus Omnivore Mugil cephalus Omnivore
Melanotaenia splendida tatei Omnivore Pseudogobius olorum Omnivore
Philypnodon macrostomus Insectivore
Macquaria colonorum Omnivore
Galaxias rostratus Insectivore
Philypnodon grandiceps Omnivore
Tandanus tandanus Omnivore
Macquaria ambigua ambigua Piscivore
Neosilurus hyrtlii Omnivore
Tasmanogobius lasti Omnivore
Anguilla reinhardtii Omnivore
Macquaria australasica Omnivore
Galaxias olidus Omnivore
Maccullochella peelii peelii Omnivore
Melanotaenia fluviatilis Insectivore
Craterocephalus fluviatilis Omnivore
Gadopsis marmoratus Omnivore
Anguilla australis Insectivore
Afurcagobius tamarensis Omnivore
Mordacia mordax Piscivore
Bidyanus bidyanus Omnivore
Herbivoreinosoma microstoma Omnivore
Mogurnda adspersa Piscivore
Nannoperca australis Omnivore
Leiopotherapon unicolor Omnivore
Continent Australia con’t
Location Southern Australia
Drainage Darling-Murray
Species Trophic level

41
Cyprinus carpio Omnivore
Salvelinus confluentus Omnivore
Carassius auratus Omnivore
Misgurnus anguillicaudatus Omnivore
Oncorhynchus mykiss Omnivore
Perca fluviatilis Omnivore
Rutilis rutilis Omnivore
Tinca tinca Omnivore

42
43

44
LITERATURE CITED
Allen, G.R., Midgley, S.H. & Allen, M. (2002) Field guide to the freshwater fishes of Australia. Western Australian Museum, Perth.
Antunes, C. (2008) Report on the eel stock and fishery in Portugal 2008. Technical
Report. Centre for Marine and Environmental Research, University of Porto, Porto, Portugal.
Arroyo, M and L. Cavieres. (1991) The Mediterranean type climate flora of central
Chile-what do we know and how can we assure its protection? Noticiero de Biologica, 5: 48-56.
Australian Department of Fisheries. (2009) Fishes of Australia. Accessed March
17, 2009. http://www.fish.wa.gov.au/docs/pub/NativeFreshwaterFish/ index.php?0501
Bar-Or, Y. (2000) Restoration of the rivers in Israel’s coastal plain. Water, Air, and Soil Pollution. 123, 311-321. Behrens, M. and K. Lafferty. (2007) Temperature and diet affects on omnivorous fish performance: implications for the latitudinal diversity gradient in herbivorous fishes. Canadian Journal of Aquatic Science. 64: 867-873. Bernardo, J., Ilheu, M., Matono, P., and Costa, A. (2003) Interannual variations of fish assemblage structure in a Mediterranean river: implications of stream
flow on the dominance of native or exotic species. River Research and Application. 19: 521-532.
Bernatchez, L. and Wilson, C. (1998) Comparative phylogeography of Nearctic and Palearctic fishes. Molecular Ecology. 7: 431-452. Brown, A. V. and W. J. Mathews. (1995) Stream ecosystems of the central United States, in Ecosystems of the World, Vol. 22. River and Stream Ecosystems (eds. C. E. Cushing, K. W. Cummings, and G. W. Marshall). Elsevier, Amsterdam, pp. 89-116. Burns, T. (1989) Lindemen’s contradiction and the trophic structure of ecosystems. Ecology. 70:1355-1362. Capone, T.A. and J. A. Kushlan. (1991) Fish community structure in dry-season stream pools. Ecology. 72: 983-992.

45
Cattanéo, F. (2005) Does hydrology constrain the structure of fish assemblages in French streams? Regional scale analysis. Archives für Hydrobiologie. 164: 367-385. Clavero, M., Blanco-Garrido, F., and J. Prenda. (2004) Fish fauna in Iberian Mediterranean river basins: biodiversity, introduced species and damming impacts. Aquatic Conservation: Marine and Freshwater Ecosystems. 14: 575-585. Clavero, M., Blanco-Garrido, F., and J. Prenda. (2005) Fish-habitat relationships and fish conservation in small coastal streams in southern Spain. Aquatic Conservation: Marine and Freshwater Ecosystems. 15: 415-426. Cody, M. and H. Mooney. (1978) Convergence versus nonconvergence in
Mediterranean-climate ecosystems. Annual Review of Ecology and Systematics. 9: 265-321.
Corbacho, C. and J. Sánchez. (2001) Patterns of species richness and introduced species in native freshwater fish faunas of a Mediterranean-type basin: The Guadiana river (Southwest Iberian peninsula). Regul. River. Res. Mgmt. 17: 699-707. Cousins, S. (1987) The decline of the trophic level concept. Trends in Ecology and Evolution. 2: 312-316. Cowling, R., Rundel, P., Lamont, B., Arroyo, M. and M. Arianoutsou. (1996) Plant diversity in Mediterranean climate regions. Trends in Ecology and Evolution. 11: 362-366. Cussac, V., Ortubay, S., Iglesias, G., Milano, D., Lattuca, M., Barriga, J., Battini, M, and Gross, M. (2004) The distribution of South American galaxiid fishes: the role of biological traits and post-glacial history. Journal of Biogeography. 31: 103-121. Darwall, W. and K. Smith. (2006) The status and distribution of freshwater fish endemic to the Mediterranean basin. The World Conservation Union (IUCN) Cambridge, UK. Daufresne, M. and P. Boët. (2007) Climate change impacts on structure and diversity of fish communities in rivers. Global Change Biology. 13: 2467- 2478. Dyer, Brian. (2000) Systematic review and biogeography of the freshwater fishes of Chile. Oceanological Studies. 19:77-98.

46
Emmerson, M and J. Yearsley, (2004) Weak interactions, omnivory and emergent food- web properties. Proceedings of the Royal Society B: Biological Sciences. 271: 397-405. Encyclopedia Britannica. (2008) Encyclopedia Britannica Online. Accessed June 15,
2009. Area of continents. http://www.Britannica.com. Erös, T. (2007) Partitioning the diversity of riverine fish: the roles of habitat types and non-native species. Freshwater Biology. 52: 1400-1415. Feige, K., Miller, C., Robinson, L., Figueroa, R., and B. Peucker-Ehrenbrink. (2009) Strontium isotopes in Chilean rivers: the flux of unradiogenic continental Sr to seawater. Technical Document. Laboratoire d’Etudes en Géophysique et Océanographie Spatiale (LEGOS). Figueroa, R., Ruiz, V. H., Berrios, R., Palma, A., Villegas, P., Andreu-Soler,A. (2010) Trophic ecology of native and introduced fish species from the Chillán river, south-central Chile. Journal of Applied Ichthyology, 26:1, 78-83. Fish Base. (2008) Used to collect presence, absence, and trophic level data for fish
species in all biome locations. Accessed May 18th, 2008. http://www.fishbase.org/search.php
Flügel, W. (1995) River salination due to dryland agriculture in the Western Cape
Province, Republic of South Africa. Environment International. 21:5, 679- 686.
Global Runoff Data Center(GRDC). (2007) From the World Climate Research
Programme. River discharge data. Retrieved October 19, 2007. http://www.bafg.de/nn_267044/GRDC/EN/02__Services/02__DataProducts/MajorRiverBasins/riverbasins__node.html?__nnn=true
Griffiths, David. (2006) Patter and process in the ecological biogeography of European freshwater fish. Journal of Animal Ecology. 75: 734 – 751. Gobinero De Chile, Ministerio De Obras Publicas, Direccion General De Aguas. (2004) Informe Tecnico. Departmento De Administraction De Recursos Hidricos. Santiago, Chile. Golubyatnikov, L. and E. Denisenko. (2001) Modeling the values of net primary production for the zonal vegetation of European Russia. Biology Bulletin. 28: 293–300. Translated from Izvestiya Akademii Nauk, Seriya Biologicheskaya, No. 3, 2001, pp. 353–361.

47
Goren, M. and R. Ortal. (1999) Biogeography, diversity and conservation of the inland water fish communities in Israel. Biological Conservation. 89: 1-9. Guégan, J., Lek, S., and T. Oberdorff. (1998) Energy availability and habitat heterogeneity predict global riverine fish diversity. Nature. 391: 382- 384. Habit, E., Belk, M., Tuckfield, R., and O. Parra. (2006) Response of the fish community to human-induced changed in the Biobío River in Chile. Freshwater Biology. 51: 1-11. Hairston, N. Jr., and H. Hairston, Sr. (1997) Does food web complexity elimination trophic-level dynamics? American Naturalist. 149: 1001-1007. Hawkins, B., R Field, H. Cornell, D. Currie, J Guégan, D Kaufman, J. Kerr, G. Mittelbach, T. Oberdorff, E O’Brien, E. Porter, and J. Turner. (2003) Energy, water, and broad-scale geographic patterns of species richness. Ecology, 84: 12, 3105-3117. Hendry, A., S. Stearns. (2004) Evolution illuminated salmon and their relatives. Oxford University Press. Oxford, U.K. Heywood, H. (1993) Mediterranean floras and their significant in relation to world
biodiversity. In Connassance et conservation de la flore des iles de la Méditerranée. Colloque Internaional, Parc Naturel Régional de la Corse and Conservatoire Botanique National de Porquerolles. 5-8 October 1993, Porticcio Corse Sud, France.
Holt, R. and G. Polis. (1997) A theoretical framework for intraguild predation. American Naturalist. 149: 745-764.
Hugueny, B. (1989) West African rivers as biogeographic islands. Oecologia. 79: 235- 243. Illes, J., ed. (1978) Limnofauna Europaea, 2nd edn. Gustav Fishcher Verlad,
Stuttgart. Ioannidis, Y. (2008) Comparison of reptile communities in three types of thermophilous Mediterranean forest in southern Greece. Journal of natural history. 42: 421 -433 Jennings, S., Pinner, J., Polunin, N. and T. Boon. (2001) Weak cross-species
relationships between body size and trophic level belie powerful size based trophic structuring in fish communities. Journal of Animal Ecology. 70: 934-944.

48
Junk, W., Bayley, P. and R. Sparks. (1989) The flood pulse concept in river-floodplain systems, p. 110-127. In D. P. [ed.] Proceedings of the International Large River Symposium. Special Publication Canadian Fisheries and Aquatic Science. 106. Kalejta, B., and P. Hockey. (1991) Distribution, abundance, and productivity of benthic invertebrates at the Berg River estuary, South Africa. Estuarine, Costal and Shelf Science. 33:2, 175-191. Kark, S. and D. Sol. (2005) Establishment success across convergent Mediterranean
ecosystems: an analysis of bird introductions. Conservation Biology. 19: 1519- 1527. Kadye, W. and B. Marshall. (2007) Habitat diversity and fish assemblages in an African river basin (Nyagui River, Zimbabwe). African Journal of Ecology. 45: 374-381. Karr, J. (1986) Assessing biological integrity in running waters: a method and its rational. Special Publication/Illinois Natural History Survey. 5:20-22. Kleynhans, CJ. (1999) The development of a fish index to assess the biological integrity of South African rivers. Water South Africa. 25:3, 265-278. Koleff, P., K. Gaston, and J. Lennon. (2002) Measuring beta diversity for presence absence data. The Journal of Animal Ecology. 72: 3, 367-382. Lamouroux, N., N. Poff, P. Angermeier. (2002) Intercontinental convergence of stream fish community traits along geomorphic and hydraulic gradients. Ecology, 83:7, 1792-1807. Landini, W. and Sorbini, C. (2005) Evolutionary dynamics in the fish faunas of the Mediterranean basin during the Plio-Pleistocene. Quaternary International 140-141: 64-89. Lèvêque, C., T. Oberdorff, and D. Paugy. (2008) Global diversity of fish (Pisces) in freshwater. Hydrobiologia, 595: 545-567. Lieth, C. E. (1975) Climate response and fluctuation dissipation. Journal of Atmospheric Sciences. 32: 2022-2026. Ligon, F., Dietrich, W., and W. Trush. (1995) Downstream ecological effects of dams. 1995. BioScience, Ecology of Large Rivers. 45: 183-192.

49
Livingstone, D., A. Rowland, and P.E. Bailey. (1982) On the size of African riverine fish faunas. American Zoology. 22: 361-369. Lyons, S. C. and M. R. Willig. (2002) Species richness, latitude, and scale- sensitivity. Ecology. 83:1, 47-58. Magalhães, M. Beja, P., Schlosser, I., and M. Collares-Pereira. (2007) Effects of multi-year droughts on fish assemblages of seasonally drying Mediterranean streams. Freshwater Biology. 52: 1494-1510. Mallin, M., Parel, H., Rudeck, J., and P. Bates. (1993) Regulation of estuarine primary production by watershed rainfall and river flow. Marine Ecology Progress Series. 93: 199-203. May, J. and L. Brown. (2002) Fish communities of the Sacramento River Basin:
Implications for conservation of native fishes in the Central Valley, California. Environmental Biology of Fishes. 63:373-388.
McDowall, R. (2002) Accumulating evidence for a dispersal biogeography of southern cool temperate freshwater fishes. Journal of Biogeography. 29: 207-219. Mediterranean Research Learning Center. National Park Service (2009) Used for figure
1. Accessed (February 3, 2009). http://www.researchlearningcenter.com/ media/abo_map.gif
Mercer, J. (1983) Cenozoic glaciation in the Southern Hemisphere. Annual Review of
Earth and Planetary Science. 11: 99-132.
Mittelbach, G., Schemske, D., Cornell, H., Allen, A., Brown, J., Bush, B., Harrison, S., Hurlbert, A., Knowlton, N., Lessios, H., McCain, C., McCune, A., McDade,
L., McPeek, M., Near, T., Price, T., Richlefs, R., Roy, K., Sax, D., Schluter, D., Sobel, J. and M. Turelli. (2007) Evolution and the latitudinal diversity gradient: speciation, extinction, and biogeography. Ecology Letters. 10: 315-331.
Mooney, H. and E. Dunn. (1970) Convergent evolution of Mediterranean-climate
evergreen sclerophyll shrubs. Evolution. 24: 292-303. Morgan, D. (2003) Distribution and biology of Galaxias truttaceus (Galaxiidae) in south-western Australia, including first evidence of parasitism of fishes in Western Australia by Ligula intestinalis (Cestoda). Environmental Biology of Fishes. 66: 155-167.

50
Morgan, D. (2004) Distribution and impacts of introduced freshwater fishes in Western Australia. New Zealand Journal of Marine and Freshwater Research. 38: 511-523. Morgan, D., Hambleton, S., Gill, H., and S. Beatty. (2005. Distribution, biology, and likely impacts of the introduced redfin perch (Perca fluiatilis) (Percidae) in Western Australia. Marine and Freshwater Research. 53:8, 1211-1221. Moyle, P. (2002) Inland fishes of California. University of California Press, Berkley USA. Moyle, P. and B. Herbold. (1987) Life-history patterns and community structure in
stream fishes of Western North American. Comparisons with Eastern North America and Europe, in Community and Evolutionary Ecology of North American Stream Fishes, (eds. W. J. Mathews and D. C. Heins). University of Oklahoma Press, Norman, pp. 25-32.
Moyle, P. and Light, T. (1996) Biological invasions of freshwater: empirical rules and assembly theory. Biological Conservation 78: 149-161. Myers, N., Mittermeier, R., Mittermeier, C., da Forseca, G. and J. Kent. (2000) Biodiversity hotspots for conservation priorities. Nature 403: 853-858. Novacek, M. and Marshal, L. (1976) Early biogeographic history of Ostariophysan fishes. Copeia. 1:1-12. Oberdorff, T., Guégan, J., and B. Hugueny. (1995) Global patterns of fish species richness in rivers. Ecography. 18: 345-352. Oberdorff, T., Hugueny, B., and T. Vigneron. (2001) Is assemblage variability related to environmental variability? An answer for riverine fish. Oikos. 93: 419-418. Oren, O., Zismann, and H. Hornung. (1973) The hydrography and distribution of fishes along the shore of Dor, Israel: Part I. The hydrography of the shore of Dor. Aquaculture. 2, 343-367. Oyarzun, C. (1995) Land use, hydrological properties, and soil erodibilities in the Bio-
Bio basin, central Chile. Mountain Research and Development. 15:331-338.

51
Pascual, M., Cussac, V., Dyer, B., Soto, D., Vegliano, P. Ortuby, S. And P. Macchi. (2007) Freshwater fishes of Patagonia in the 21st Century after a hundred years of human settlement, species introductions, and environmental change. Aquatic Ecosystem Health & Management. 10:212-227. Pereira, W., Domagalski, J., Hostettler, F., Brown, L. and J Rapp. (1996) Occurrence and accumulation of pesticides and organic contaminants in river sediment, water and clam tissues from the san Joaquin River and tributaries. Environmental Toxicology and Chemistry. 15: 172–180. Peters, P. and J. Myers. (1991) Preserving biodiversity in a changing climate. Issues in Science & Technology. 91: 66-72. Poff, N. and J. Allan. (1995) Functional organization of stream fish assemblages in relation to hydrological variability. Ecology. 76: 606-627. Poff, N.L. (1997) Landscape filters and species trait: towards mechanistic understanding and prediction in stream ecology. Journal of the North American Benthological Society. 16: 391-409. Polis, G. (1991) Complex trophic interactions in desserts: an empirical critique of food- web theory. American Naturalist. 138: 123-155. Polis, G and D. Strong. (1996) Food web complexity and community dynamics. American Naturalist. 147: 813-847. Preston, F. (1962) The canonical distribution of commonness and rarity I and II. Ecology. 43: 185-215 and 410-432. Reyjol, Y., Hugueny, B., Bianco, P. and D. Pont. (2007) Patterns in species richness and endemism of European freshwater fish. Global Ecology and Biogeography. 16: 65-75. Rühland, K., Paterson, A., and J. Smol. (2008) Hemispheric-scale patterns of climate-
related shifts in planktonic diatoms from North American and European lakes. Global Change Biology. 14: 2740-2754.
Sari, H., S. Balik, M. Ustaoğlu, A. Ilhan. (2006) Distribution and ecology of freshwater ichtyofauna of the Biga Peninsula, North-western Anatolia, Turkey. Turkish Journal of Zoology. 30: 35-45.

52
Simpson, H., Cane, M., Herczeg, A., and S. Zebiak. (1993) Annual river discharge in southeastern Australia related to El Nino-southern oscillation forecasts of sea surface temperatures. Water Resources Research. 29:11, 3671-3680. Schluter, D. (1986) Tests for similarity and convergence of finch communities. Ecology. 67: 1073-1085. Swanevelder, C. (1981) Utilizing South Africa’s largest river: The physiographic background to the Orange River scheme. GeoJournal. 2:2, 29-40. Thompson, J., Gautheir, R., Amiot, J., Ehlers, B., Collin, C., Fossat, J., Barrios, V., Arnaud-Miramont F., Keefover-Ring. K. and Y. Linhart. (2007) Ongoing adaptation to Mediterranean climate extremes in a chemically polymorphic plant. Ecological Monographs. 77: 421-439. Tonn, W. (1990) Climate change and fish communities: a conceptual framework. Transactions of the American Fisheries Society. 119: 337-352. Unmack, P. (2001) Biogeography of Australian freshwater fishes. Journal of Biogeography. 28:9, 1053-1089. Underwood, E., Viers, J., Klausmeyer, K., Cox. and M. Shaw. (2009) Threats and
biodiversity in the Mediterranean biome. Diversity and Distributions. 15:188-197. Vandermeer, J. (2006) Omnivory and the stability of food webs. Journal of Theoretical Biology. 238: 497-504 Viney, N. and M. Sivapalan. (2001) Modeling catchment processes in the Swan- Avon river basin. Hydrological Processes. 15: 2671-2685. Waters, M.J., Dijkstra, H. and P. G. Wallis. (2000) Biogeography of a Southern Hemisphere freshwater fish: how important is marine dispersal? Molecular Ecology 9:1815-1821 Winemiller, Kirk O. (1991) Ecomorphological diversification in lowland freshwater fish assemblages from five biotic regions. Ecological Monographs. 61:4, 343-365. Whittaker, R. (1977) Evolution of species diversity in land communities. Evolution Biology. 10: 1-67. Woodward, G. and A. Hildrew. (2001) Invasion of a stream food web by a new top predator. Journal of Animal Ecology. 70: 273-288.
53
World Weather Information Service. (2000). The Commission of Basic Systems of the World Meteorological Organization Mandated. Hong Kong. Temperature and Rainfall Data World Wide. Retrieved February 18th, 2009. From http://worldweather.wmo.int/
Wright, E. (1983) Species energy theory: an extension of species-area theory. Oikos. 41: 495-506.