Drug Abuse Education Course Master Sgt. Doug Oswald Assistant Drug Demand Reduction Administrator.
Upload
nguyenphucCategory
view
213download
0
WORLD DRUG REPORT 20
18
GLOBAL OVERVIEW OF DRUG DEMAND AND SUPPLY Latest trends, cross-cutting issues
29 789211 483048
ISBN 978-92-1-148304-8
© United Nations, June 2018. All rights reserved worldwide.ISBN: 978-92-1-148304-8 eISBN: 978-92-1-045058-4United Nations publication, Sales No. E.18.XI.9
This publication may be reproduced in whole or in part and in any formfor educational or non-profit purposes without special permission fromthe copyright holder, provided acknowledgement of the source is made.The United Nations Office on Drugs and Crime (UNODC) would appreciatereceiving a copy of any publication that uses this publication as a source.
Suggested citation: World Drug Report 2018 (United Nations publication, Sales No. E.18.XI.9).
No use of this publication may be made for resale or any other commercialpurpose whatsoever without prior permission in writing from UNODC.Applications for such permission, with a statement of purpose and intent of thereproduction, should be addressed to the Research and Trend Analysis Branch of UNODC.
DISCLAIMER
The content of this publication does not necessarily reflect the views orpolicies of UNODC or contributory organizations, nor does it imply any endorsement.
Comments on the report are welcome and can be sent to:
Division for Policy Analysis and Public AffairsUnited Nations Office on Drugs and CrimePO Box 5001400 Vienna AustriaTel: (+43) 1 26060 0Fax: (+43) 1 26060 5827
E-mail: [email protected]: https://www.unodc.org/wdr2018
1
PREFACE
Drug treatment and health services continue to fall short: the number of people suffering from drug use disorders who are receiving treatment has remained low, just one in six. Some 450,000 people died in 2015 as a result of drug use. Of those deaths, 167,750 were a direct result of drug use disorders, in most cases involving opioids.
These threats to health and well-being, as well as to security, safety and sustainable development, demand an urgent response.
The outcome document of the special session of the General Assembly on the world drug problem held in 2016 contains more than 100 recommendations on promoting evidence-based prevention, care and other measures to address both supply and demand.
We need to do more to advance this consensus, increasing support to countries that need it most and improving international cooperation and law enforcement capacities to dismantle organized crimi-nal groups and stop drug trafficking.
The United Nations Office on Drugs and Crime (UNODC) continues to work closely with its United Nations partners to assist countries in imple-menting the recommendations contained in the outcome document of the special session, in line with the international drug control conventions, human rights instruments and the 2030 Agenda for Sustainable Development.
In close cooperation with the World Health Organi-zation, we are supporting the implementation of the International Standards on Drug Use Prevention and the international standards for the treatment of drug use disorders, as well as the guidelines on treat-ment and care for people with drug use disorders in contact with the criminal justice system.
The World Drug Report 2018 highlights the impor-tance of gender- and age-sensitive drug policies, exploring the particular needs and challenges of women and young people. Moreover, it looks into
Both the range of drugs and drug markets are expanding and diversifying as never before. The findings of this year’s World Drug Report make clear that the international community needs to step up its responses to cope with these challenges.
We are facing a potential supply-driven expansion of drug markets, with production of opium and manufacture of cocaine at the highest levels ever recorded. Markets for cocaine and methampheta-mine are extending beyond their usual regions and, while drug trafficking online using the darknet con-tinues to represent only a fraction of drug trafficking as a whole, it continues to grow rapidly, despite successes in shutting down popular trading platforms.
Non-medical use of prescription drugs has reached epidemic proportions in parts of the world. The opioid crisis in North America is rightly getting attention, and the international community has taken action. In March 2018, the Commission on Narcotic Drugs scheduled six analogues of fentanyl, including carfentanil, which are contributing to the deadly toll. This builds on the decision by the Commission at its sixtieth session, in 2017, to place two precursor chemicals used in the manufacture of fentanyl and an analogue under international control.
However, as this World Drug Report shows, the prob-lems go far beyond the headlines. We need to raise the alarm about addiction to tramadol, rates of which are soaring in parts of Africa. Non-medical use of this opioid painkiller, which is not under international control, is also expanding in Asia. The impact on vulnerable populations is cause for seri-ous concern, putting pressure on already strained health-care systems.
At the same time, more new psychoactive substances are being synthesized and more are available than ever, with increasing reports of associated harm and fatalities.
2
WO
RLD
DRU
G R
EPO
RT 2
018
increased drug use among older people, a develop-ment requiring specific treatment and care.
UNODC is also working on the ground to promote balanced, comprehensive approaches. The Office has further enhanced its integrated support to Afghanistan and neighbouring regions to tackle record levels of opiate production and related secu-rity risks. We are supporting the Government of Colombia and the peace process with the Revolu-tionary Armed Forces of Colombia (FARC) through alternative development to provide licit livelihoods free from coca cultivation.
Furthermore, our Office continues to support efforts to improve the availability of controlled substances for medical and scientific purposes, while prevent-ing misuse and diversion – a critical challenge if we want to help countries in Africa and other regions come to grips with the tramadol crisis.
Next year, the Commission on Narcotic Drugs will host a high-level ministerial segment on the 2019 target date of the 2009 Political Declaration and Plan of Action on International Cooperation towards an Integrated and Balanced Strategy to Counter the World Drug Problem. Preparations are under way. I urge the international community to take this opportunity to reinforce cooperation and agree upon effective solutions.
Yury FedotovExecutive Director
United Nations Office on Drugs and Crime

3
CONTENTS
BOOKLET 1 EXECUTIVE SUMMARY — CONCLUSIONS AND POLICY IMPLICATIONS
BOOKLET 2 GLOBAL OVERVIEW OF DRUG DEMAND AND SUPPLY Latest trends, cross-cutting issues
BOOKLET 3 ANALYSIS OF DRUG MARKETSOpioids, cocaine, cannabis, synthetic drugs
BOOKLET 4 DRUGS AND AGE Drugs and associated issues among young people and older people
BOOKLET 5 WOMEN AND DRUGS Drug use, drug supply and their consequences
PREFACE ...................................................................................................... 1EXPLANATORY NOTES ................................................................................ 5KEY FINDINGS ............................................................................................. 6INTRODUCTION ........................................................................................... 9
A. EXTENT OF DRUG USE .......................................................................... 11 More than a quarter of a billion people use drugs globally ............................................................ 11 Trends in drug treatment are consistent with changing patterns
of drug use in different regions ...................................................................................................... 13
B. HEALTH CONSEQUENCES OF DRUG USE ............................................... 14 Almost 11 million people worldwide injected drugs in 2016 ......................................................... 15 One in eight people who inject drugs is living with HIV .............................................................. 16 Injecting drugs is a major route for transmission of the HCV virus...............................................17 Coverage of core interventions to prevent spread of HIV and HCV among
PWID remains poor and insufficient ............................................................................................. 19 Deaths attributable to drug use remain high globally .................................................................... 21
C. EXTENT OF DRUG SUPPLY ..................................................................... 28 Drug cultivation and production ................................................................................................... 28 Drug seizures ................................................................................................................................. 29 Drug trafficking via the darknet is a growing challenge for authorities .......................................... 33
GLOSSARY ..................................................................................................59REGIONAL GROUPINGS ..............................................................................60
4
WO
RLD
DRU
G R
EPO
RT 2
018
Acknowledgements
The World Drug Report 2018 was prepared by the Research and Trend Analysis Branch, Division for Policy Analysis and Public Affairs, United Nations Office on Drugs and Crime, under the supervision of Jean-Luc Lemahieu, Director of the Division, and Angela Me, Chief of the Research and Trend Analysis Branch.
General coordination and content overviewChloé Carpentier Angela Me
Analysis and draftingPhilip Davis Kamran Niaz Thomas Pietschmann
Data management and estimates production Enrico Bisogno Coen Bussink Jesus Maria Garcia Calleja (WHO)Hernan EpsteinRiku Lehtovuori Andrea OterováUmidjon RakhmonberdievAli Saadeddin Keith Sabin (UNAIDS)Antoine Vella
EditingJonathan Gibbons
Graphic design and productionAnja KorenblikSuzanne KunnenKristina Kuttnig
Coordination Francesca Massanello
Data supportDiana CameriniChung Kai ChanSarika DewanSmriti Ganapathi
Administrative supportAnja Held Iulia Lazar
Jonathan CaulkinsPaul GriffithsMarya HynesVicknasingam B. KasinatherLetizia Paoli
Charles ParryPeter ReuterFrancisco ThoumiAlison Ritter
In memoriamBrice de Ruyver
Review and commentsThe World Drug Report 2018 benefited from the expertise of and invaluable contributions from UNODC colleagues in all divisions.
The Research and Trend Analysis Branch acknowledges the invaluable contributions and advice provided by the World Drug Report Scientific Advisory Committee:
The research and production of the joint UNODC/UNAIDS/WHO/World Bank estimates of the number of people who inject drugs were partly funded by the HIV/AIDS Section of the Drug Prevention and Health Branch of the Division for Operations of UNODC.

5
EXPLANATORY NOTES
The boundaries and names shown and the designa-tions used on maps do not imply official endorsement or acceptance by the United Nations. A dotted line represents approximately the line of control in Jammu and Kashmir agreed upon by India and Paki-stan. The final status of Jammu and Kashmir has not yet been agreed upon by the parties. Disputed boundaries (China/India) are represented by cross-hatch owing to the difficulty of showing sufficient detail.
The designations employed and the presentation of the material in the World Drug Report do not imply the expression of any opinion whatsoever on the part of the Secretariat of the United Nations con-cerning the legal status of any country, territory, city or area, or of its authorities or concerning the delimi-tation of its frontiers or boundaries.
Countries and areas are referred to by the names that were in official use at the time the relevant data were collected.
All references to Kosovo in the World Drug Report, if any, should be understood to be in compliance with Security Council resolution 1244 (1999).
Since there is some scientific and legal ambiguity about the distinctions between “drug use”, “drug misuse” and “drug abuse”, the neutral terms “drug use” and “drug consumption” are used in the World Drug Report. The term “misuse” is used only to denote the non-medical use of prescription drugs.
All uses of the word “drug” in the World Drug Report refer to substances controlled under the international drug control conventions.
All analysis contained in the World Drug Report is based on the official data submitted by Member States to the United Nations Office on Drugs and Crime through the annual report questionnaire unless indicated otherwise.
The data on population used in the World Drug Report are taken from: World Population Prospects: The 2017 Revision (United Nations, Department of Economic and Social Affairs, Population Division).
References to dollars ($) are to United States dollars, unless otherwise stated.
References to tons are to metric tons, unless other-wise stated.
The following abbreviations have been used in the present booklet:
ATS amphetamine-type stimulants
EMCDDA European Monitoring Centre for Drugs and Drug Addiction
Europol European Union Agency for Law Enforcement Cooperation
HBV hepatitis B virus
HCV hepatitis C virus
HIV human immunodeficiency virus
LSD lysergic acid diethylamide
NPS new psychoactive substances
PWID people who inject drugs
UNAIDS Joint United Nations Programme on HIV/AIDS
UNODC United Nations Office on Drugs and Crime
WHO World Health Organization

6
KEY FINDINGS
Drug use is associated with significant adverse health consequences
About 275 million people worldwide, which is roughly 5.6 per cent of the global population aged 15–64 years, used drugs at least once during 2016. Some 31 million people who use drugs suffer from drug use disorders, meaning that their drug use is harmful to the point where they may need treat-ment. Opioids continue to cause the most harm, accounting for 76 per cent of deaths where drug use disorders were implicated. PWID — some 10.6 million worldwide in 2016 — endure the greatest health risks. More than half of them live with hepa-titis C, and one in eight live with HIV.
Number of deaths associated with the use of drugs remains high
Roughly 450,000 people died as a result of drug use in 2015, according to WHO. Of those deaths, 167,750 were directly associated with drug use dis-orders (mainly overdoses). The rest were indirectly attributable to drug use and included deaths related to HIV and hepatitis C acquired through unsafe injecting practices. Overdose deaths from the non-medical use of pharmaceutical opioid use reach epidemic proportions in North America
In 2015 and 2016, for the first time in half a cen-tury, life expectancy in the United States of America declined for two consecutive years. A key factor was the increase in unintentional injuries, which include overdose deaths.
In 2016, 63,632 people died from a drug overdose in the United States, the highest number on record and a 21 per cent increase from the previous year. This was largely due to a rise in deaths associated with pharmaceutical opioids, including fentanyl and fentanyl analogues. This group of opioids, exclud-ing methadone, was implicated in 19,413 deaths in the country, more than double the number in 2015. Evidence suggests that Canada is also affected, with
a large number of overdose deaths involving fentanyl and its analogues in 2016.
Outside North America, with the exception of Esto-nia, the impact of fentanyl and its analogues is relatively low.
Many countries still fail to provide adequate drug treatment and health services to reduce the harm caused by drugs
One in six people suffering from drug use disorders received treatment for those disorders during 2016, which is a relatively low proportion that has remained constant in recent years.
Some of the most adverse health consequences of drug use are experienced by PWID. A global review of services aimed at reducing adverse health consequences among PWID has suggested that only 79 countries have implemented both needle and syringe programmes and opioid substitution therapy. Only four countries were classified as having high levels of coverage of both of those types of interventions.
Information on the availability of HIV testing and counselling and antiretroviral therapy remains sparse: only 34 countries could confirm the availability of HIV-testing programmes for PWID, and 17 coun-tries confirmed that they had no such programmes. There was no information on the availability of antiretroviral therapy for 162 countries.
Witnessing an overdose and experiencing a non-fatal overdose are common
Witnessing an overdose is common among those who use heroin and/or cocaine and who inject drugs. This provides an opportunity to intervene and influ-ence the outcome of the situation (for example, in the administration of naloxone in the case of opioid overdose) and whether it proves to be fatal.
Many people who use heroin and/or cocaine and who inject drugs also report that they have
7
2
KEY FINDINGS
experienced a non-fatal overdose. Non-fatal over-doses can leave drug users with significant health problems and have also been shown to be associated with a subsequent fatal overdose, with the risk of death increasing with the number of prior non-fatal overdoses.Prisoners are at higher risk for infectious diseases but are poorly served
People in prison and other closed settings are at a much greater risk of contracting infections such as tuberculosis, HIV and hepatitis C than the general population, but access to treatment and prevention programmes is often lacking. Even where such pro-grammes are available, they are not necessarily of the same standard as those provided in the com-munity. The lack of access to prevention measures in many prisons can result in the rapid spread of HIV and other infections.
People who use heroin are exposed to a severe risk of death from overdose after release from prison, especially in the first two weeks. Such deaths are related to a lowered tolerance to the effects of heroin use developed after periods of relative abstinence, including during incarceration. However, released prisoners are rarely able to access overdose manage-ment interventions, including prevention medications such as naloxone, or treatment for sub-stance dependence, including methadone.
Afghan opium poppy cultivation drives record opiate production
Total global opium production jumped by 65 per cent from 2016 to 2017, to 10,500 tons, easily the highest estimate recorded by UNODC since it started estimating global opium production at the beginning of the twenty-first century. The total area under opium poppy cultivation worldwide increased to almost 420,000 ha in 2017. More than 75 per cent of that area is in Afghanistan.
Overall seizures of opiates rose by almost 50 per cent from 2015 to 2016. The quantity of heroin seized globally reached a record high of 91 tons in 2016. Most opiates were seized near the manufac-turing hubs in Afghanistan.
A notable increase has been seen in cocaine manufacture
Global cocaine manufacture in 2016 reached its
highest level ever: an estimated 1,410 tons. After falling during the period 2005–2013, global cocaine manufacture rose by 56 per cent during the period 2013–2016. The increase from 2015 to 2016 was 25 per cent. The total area under coca cultivation worldwide in 2016 was 213,000 ha, almost 69 per cent of which was in Colombia.
Global seizures are still dominated by can-nabis but sharp increases are reported for other drugs
Despite declining in 2016, cannabis continues to be the drug seized in the greatest quantities world-wide, followed by coca/cocaine-related substances and opioids. Both the quantity of ATS and of cocaine seized worldwide reached a record level in 2016. The sharpest increases in the quantities of drugs intercepted worldwide in 2016 were reported for plant-based NPS, which rose sevenfold, mainly due to seizures of kratom. The quantity of synthetic NPS seized worldwide, by contrast, saw a marked decline of more than 50 per cent in 2016, mainly due to a decline in the quantities of phenetalyamines and synthetic cannabinoids seized.
Effect of the crackdown on darknet drug dealers is not yet clear
In July 2017, police forces from several countries worked together to take down the largest drug-trad-ing platform on the darknet, the part of the “deep web” containing information that is only accessible using special web browsers. Before it was closed, AlphaBay had featured more than 250,000 listings for illegal drugs and chemicals. It had had over 200,000 users and 40,000 vendors during its exist-ence. The authorities also succeeded in taking down the trading platform Hansa, described as the third largest criminal marketplace on the dark web.
It is not yet clear what effect the closures will have. According to an online survey in January 2018, 15 per cent of those who had used darknet sites for purchasing drugs said that they had used such mar-kets less frequently since the closures, and 9 per cent said they had completely stopped. However, more than half did not consider themselves to have been affected by the closures.
Although the scale of drug trafficking on the dark-net remains limited, it has shown signs of rapid
8
WO
RLD
DRU
G R
EPO
RT 2
018
growth. Authorities in Europe estimated that drug sales on the darknet from 22 November 2011 to 16 February 2015 amounted to roughly $44 million per year. However, a later study estimated that, in early 2016, drug sales on the darknet were between $14 million and $25 million per month, equivalent to between $170 million and $300 million per year.
9
INTRODUCTION
This booklet constitutes the second part of the World Drug Report 2018. It provides a global overview of the latest estimates of and trends in drug use and drug supply, as well as of several cross-cutting issues related to the world drug problem. Such issues com-prise the health impact of drug use, including trends in drug use disorders, problem drug use as reflected in treatment demand and estimates of the number of people who inject drugs (PWID) and of those living with HIV and hepatitis.
The present booklet also examines the global extent of deaths attributable to drug use, with recent trends in overdose deaths in some countries being presented
as illustrative. Information on witnessing an over-dose or personally experiencing a non-fatal overdose is also presented. A review of the availability and levels of coverage of core interventions (particularly needle and syringe programmes and opioid substi-tution therapy) to help prevent the spread of HIV and HCV among PWID is also included. Finally, the booklet contains a global overview of the latest estimates of and trends in cultivation, production and trafficking of illicit drugs, including on the Internet, using the darknet.
+60%2000
105,000deaths
168,000deaths
2015
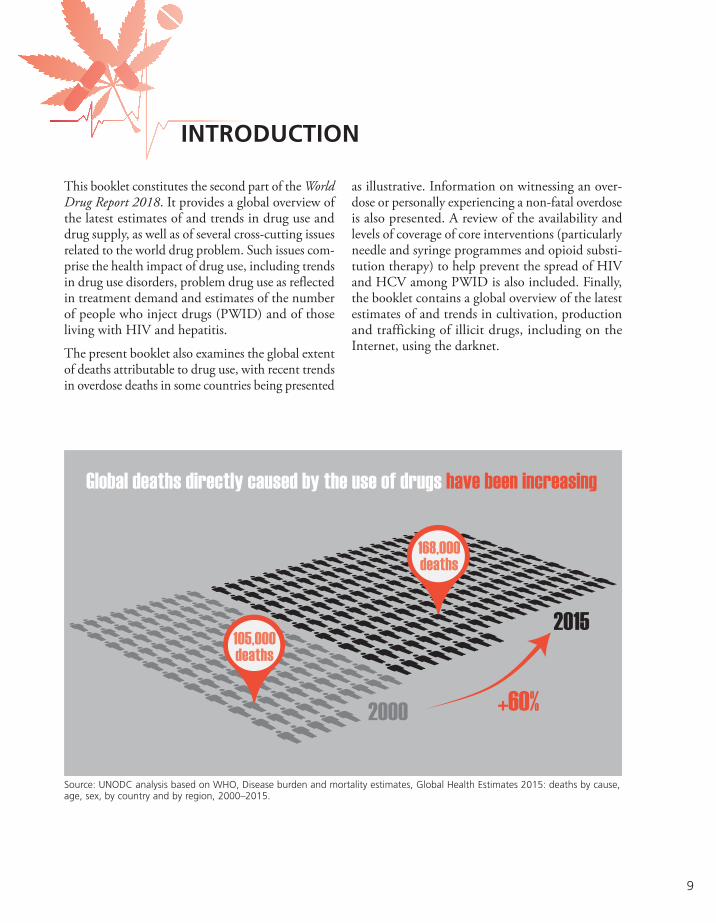
Global deaths directly caused by the use of drugs have been increasing
Source: UNODC analysis based on WHO, Disease burden and mortality estimates, Global Health Estimates 2015: deaths by cause, age, sex, by country and by region, 2000–2015.

11
2 GLOBAL OVERVIEW OF DRUG DEMAND AND SUPPLY A. Extent of drug use
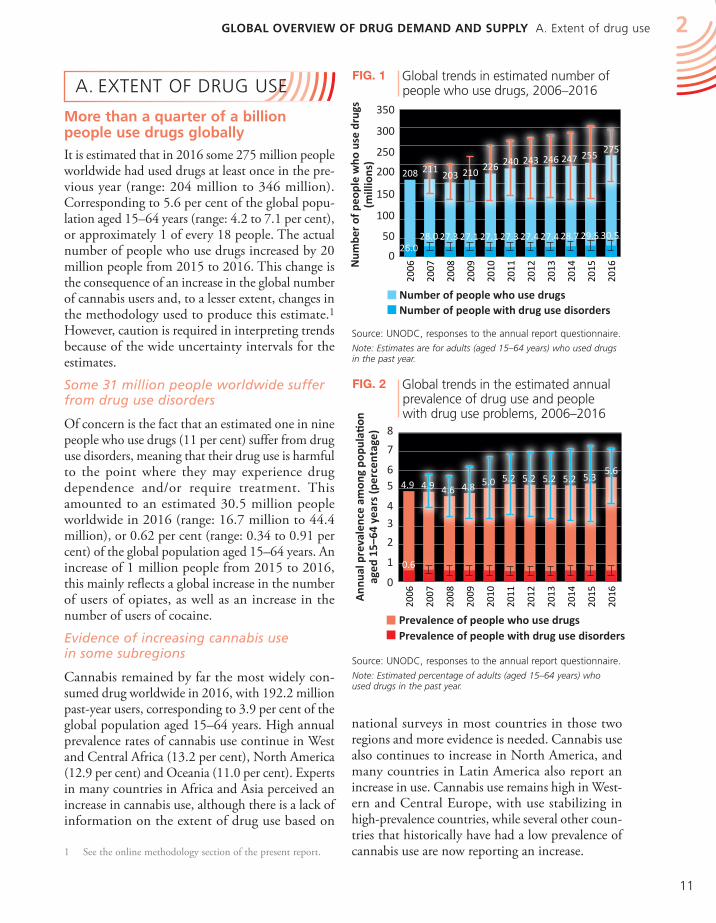
Fig. 2 Global trends in the estimated annual prevalence of drug use and people with drug use problems, 2006–2016
Source: UNODC, responses to the annual report questionnaire.
Note: Estimated percentage of adults (aged 15–64 years) who used drugs in the past year.
national surveys in most countries in those two regions and more evidence is needed. Cannabis use also continues to increase in North America, and many countries in Latin America also report an increase in use. Cannabis use remains high in West-ern and Central Europe, with use stabilizing in high-prevalence countries, while several other coun-tries that historically have had a low prevalence of cannabis use are now reporting an increase.
A. EXTENT OF DRUG USE
More than a quarter of a billion people use drugs globally
It is estimated that in 2016 some 275 million people worldwide had used drugs at least once in the pre-vious year (range: 204 million to 346 million). Corresponding to 5.6 per cent of the global popu-lation aged 15–64 years (range: 4.2 to 7.1 per cent), or approximately 1 of every 18 people. The actual number of people who use drugs increased by 20 million people from 2015 to 2016. This change is the consequence of an increase in the global number of cannabis users and, to a lesser extent, changes in the methodology used to produce this estimate.1 However, caution is required in interpreting trends because of the wide uncertainty intervals for the estimates.
Some 31 million people worldwide suffer from drug use disorders
Of concern is the fact that an estimated one in nine people who use drugs (11 per cent) suffer from drug use disorders, meaning that their drug use is harmful to the point where they may experience drug dependence and/or require treatment. This amounted to an estimated 30.5 million people worldwide in 2016 (range: 16.7 million to 44.4 million), or 0.62 per cent (range: 0.34 to 0.91 per cent) of the global population aged 15–64 years. An increase of 1 million people from 2015 to 2016, this mainly reflects a global increase in the number of users of opiates, as well as an increase in the number of users of cocaine.
Evidence of increasing cannabis use in some subregions
Cannabis remained by far the most widely con-sumed drug worldwide in 2016, with 192.2 million past-year users, corresponding to 3.9 per cent of the global population aged 15–64 years. High annual prevalence rates of cannabis use continue in West and Central Africa (13.2 per cent), North America (12.9 per cent) and Oceania (11.0 per cent). Experts in many countries in Africa and Asia perceived an increase in cannabis use, although there is a lack of information on the extent of drug use based on
1 See the online methodology section of the present report.
Fig. 1 Global trends in estimated number of people who use drugs, 2006–2016
Source: UNODC, responses to the annual report questionnaire.
Note: Estimates are for adults (aged 15–64 years) who used drugs in the past year.
0
1
2
3
4
56
7
8
Ann
ual p
reva
lenc
e am
ong
popu
lati
on
aged
15–
64 y
ears
(per
cent
age)
Prevalence of people with drug use disordersPrevalence of people who use drugs
0
50
100
150
200
250
300
350
Number of people with drug use disordersNumber of people who use drugs
208 211 203 210 226 240 243 246 247 255
275
26.028.0 27.3 27.1 27.1 27.3 27.4 27.4 28.7 29.5 30.5
2006
2007
2008
2009
2010
2011
2012
2013
2014
2015
2016
4.9 4.9 4.6 4.8 5.0 5.2 5.2 5.2 5.2 5.35.6
0.6
2006
2007
2008
2009
2010
2011
2012
2013
2014
2015
2016 N
umbe
r of
peo
ple
who
use
dru
gs(m
illio
ns)
0
1
2
3
4
56
7
8
Ann
ual p
reva
lenc
e am
ong
popu
lati
on
aged
15–
64 y
ears
(per
cent
age)
Prevalence of people with drug use disordersPrevalence of people who use drugs
0
50
100
150
200
250
300
350
Number of people with drug use disordersNumber of people who use drugs
208 211 203 210 226 240 243 246 247 255
275
26.028.0 27.3 27.1 27.1 27.3 27.4 27.4 28.7 29.5 30.5
2006
2007
2008
2009
2010
2011
2012
2013
2014
2015
2016
4.9 4.9 4.6 4.8 5.0 5.2 5.2 5.2 5.2 5.35.6
0.6
2006
2007
2008
2009
2010
2011
2012
2013
2014
2015
2016 N
umbe
r of
peo
ple
who
use
dru
gs(m
illio
ns)

12
WO
RLD
DRU
G R
EPO
RT 2
018
corresponding to 0.7 per cent of the global popula-tion aged 15–64 years. The prevalence of past-year use of opioids among the population aged 15–64 years is high in North America (4.2 per cent) and Oceania (2.2 per cent). Among users of opioids, 19.4 million were past-year users of opiates (heroin and opium), corresponding to 0.4 per cent of the population aged 15–64 years, with high prevalence rates of past-year use of opiates in Central Asia and Transcaucasia (0.9 per cent), Eastern and South-Eastern Europe (0.7 per cent) and North America (0.8 per cent).
Misuse of pharmaceutical opioids is a growing concern
The misuse of pharmaceutical opioids such as tramadol is reported in many countries in Africa (particularly West and North Africa) and in some countries of the Near and Middle East. This is reflected in the number of people in treatment for tramadol-related problems and the number of tramadol overdose deaths reported in some countries. The high level of misuse of pharmaceutical opioids remains a major concern in North America, a subregion that has seen a resurgence in heroin use in the past four years, particularly in the United States of America. Coupled with the use of fentanyl and its analogues, the interlinked epidemic of
In most countries, cannabis is the most widely used drug, both among the general population and among young people. A global estimate, produced for the first time by UNODC, based on available data from 130 countries, suggests that, in 2016, 13.8 million young people (mostly students) aged 15–16 years used cannabis at least once in the pre-vious 12 months, equivalent to 5.6 per cent of the population in that age range. Annual use of cannabis in 15-16 year old people was slightly higher than among the general population aged 15-64 years (3.9 per cent in 2016). However, caution is required as error margins around these two estimates overlap.
Opioids are responsible for most of the negative health impact of drug use
While cannabis is the most widely used drug glob-ally, opioids are responsible for most of the negative health impact of drug use. For example, opioids accounted for 76 per cent of deaths from drug use disorders in 2015.2 There were an estimated 34.3 million past-year users of opioids (persons who use opiates and persons who use prescription opioids for non-medical purposes) globally in 2016,
2 WHO, Disease burden and mortality estimates, Global Health Estimates 2015: deaths by cause, age, sex, by country and by region, 2000–2015. Available at www.who.int/.
Cannabis use among young peopleIn most countries, canna-bis is the drug most widely used, both among the gen-eral population and among youth. A global estimate, produced for the first time by UNODC, based on available data from 130 countries, suggests that in 2016 13.8 million young people (mostly students) aged 15–16 years used cannabis at least once over the previous 12 months, equivalent to 5.6 per cent of the population in this age range. Annual use of cannabis in 15–16 year old people was slightly higher than among the general population aged 15–64 years (3.9 per cent in 2016). However, caution is required as error margins around these two estimates overlap.
Global annual prevalence of cannabis use among the general population, aged 15–64 years and among students aged 15–16 years, 2016
Sources: UNODC, annual report questionnaire data and other government reports.
Note: the estimate of cannabis use in the last year in young people aged 15–16 years is based on school surveys in most countries, thus the use of the term ‘students’.
192.2 million
General population aged 15-64 years
13.8million
Young peopleaged 15–16 years
3.9
5.6
0
2
4
6
8
Ann
ual p
reva
lenc
e (p
erce
ntag
e)
General population (aged 15-64…Students (aged 15-16 years)
General population (aged 15–64 years)Students (aged 15–16 years)
3.9
5.6
0
2
4
6
8
Ann
ual p
reva
lenc
e (p
erce
ntag
e)
General population (aged 15-64…Students (aged 15-16 years)
13
GLOBAL OVERVIEW OF DRUG DEMAND AND SUPPLY A. Extent of drug use 2
base paste, previously confined to cocaine-manu-facturing countries, has spread to many countries in South America.
Non-medical use of benzodiazepines in combination with prescription opioids is a growing problem
While global estimates of the non-medical use of prescription drugs are not available, such misuse remains quite widespread, particularly among indi-viduals practicing polydrug use. The non-medical use of prescription drugs such as prescription stim-ulants and benzodiazepines, in combination with prescription opioids, is reported to be a growing problem in many countries. Of misused prescription drugs, the non-medical use of benzodiazepines remains the most common: approximately 60 coun-tries3 have ranked benzodiazepines among the three most commonly misused substances, and some coun-tries report higher prevalence rates for their use than for many other substances. Benzodiazepines are also frequently reported in fatal overdose cases involving opioids.
Trends in drug treatment are consistent with changing patterns of drug use in different regions
Globally, the extent to which people in need of drug treatment actually receive it remains limited. In 2016, as in previous years, an estimated one in six people who had drug use disorders received treat-ment. Despite limitations, information about people in treatment for drug use can provide useful insight into trends and geographical variations with respect to drug use disorders. However, this information should be interpreted with caution because treat-ment numbers reflect not only demand for treatment (the number of people seeking help) but also the extent of the provision of treatment (depending on government willingness to finance treatment services).
Most people in drug treatment in Africa, the Ameri-cas and Oceania are being treated for cannabis use. In all regions except Africa, an increasing proportion of the drug treatment provided is related to cannabis use. Although cannabis has consistently been the
3 Based on responses to the annual report questionnaire by Member States in 2015 and 2016.
prescription opioids and heroin has taken a heavy toll, especially in terms of the high number of reported fatal overdoses associated with their use. There are also increasing signs of misuse of pharmaceutical opioids in Western and Central Europe, as reflected, for example, in the increasing proportion of people entering treatment services for non-medical use of pharmaceutical opioids in the subregion. While not at the same level as in North America, overdose deaths related to fentanyl and its analogues have also been reported in Western and Central Europe.
Amphetamines are one of the most worrying threats of drug use in East and South-East Asia
In 2016, an estimated 34.2 million people world-wide, or 0.7 cent of the population aged 15–64 years, used amphetamines in the past year. The high-est annual prevalence of use of amphetamines among the population aged 15–64 years was in North America (2.0 per cent), followed by Oceania (1.3 per cent). It is not possible to construct a specific estimate of use of amphetamines in East and South-East Asia due to the chronic lack of data in the subregion, but many countries in that subregion consider methamphetamine use to be one of the most worrying threats of drug use. There are also concerns that an increasing number of countries are reporting methamphetamine use, especially among opioid users in West Asia. “Ecstasy” is used by 0.4 per cent of the global population aged 15–64 years, but its spread across most regions has been striking in recent years, during which time there has also been an increasing trend in “ecstasy” use in Western and Central Europe, as well as Latin America.
Indications of an increase in cocaine use in the Americas
The use of cocaine remains concentrated in North America and South America, where, respectively, 1.9 per cent and 0.95 per cent of the population aged 15–64 years are past-year users, and in Oceania (1.7 per cent) and Western and Central Europe (1.2 per cent). Globally, an estimated 18.2 million people used cocaine in 2016, or 0.4 per cent of the popu-lation aged 15–64 years. There are indications of an increase in cocaine use in many countries in North and South America. In addition, the use of cocaine

14
WO
RLD
DRU
G R
EPO
RT 2
018
most common drug of use among those receiving drug treatment in Africa, treatment for opioid use disorders is increasing in the region. This trend may be an indication that ongoing trafficking of heroin and pharmaceutical opioids in transit through Africa to other destinations has produced a worrying spillo-ver effect on drug use within Africa. Opioids remain a major concern in Europe and Asia, especially in Eastern and South-Eastern Europe, where two of every three people in drug treatment are there for opioid use disorders.
Cocaine continues to be a drug of concern among those receiving treatment in Latin America and the Caribbean, in particular, where one third of those in treatment for drug use disorders are being treated for cocaine use, although that proportion has been declining. Cocaine use disorders are reported as the primary reason for drug treatment, albeit to a lesser extent, in North America and Western and Central Europe as well. In North America, treatment pri-marily for cocaine use disorders has been declining in relative importance, while the proportion of those in treatment for opioid use disorders has increased. In the United States, between 2004 and 2014, the number of admissions related primarily to the use of cocaine declined by 65 per cent, from 248,000 to 88,000 individuals, and treatment for the use of opiates increased by 51 per cent, from 323,000 to 490,000 individuals. There is a higher proportion of treatment for the use of ATS in Asia and Oceania than in other regions.
Women with drug use disorders are underrepresented in treatment
Although one in three drug users is a woman, women continue to account for only one in five people in treatment. The proportion of females in treatment tends to be higher for tranquillizers and sedatives (approximately one in three treatment admissions in most subregions of the Americas and Europe) than for other substances. This reflects the fact that although men are three times as likely to use can-nabis, cocaine or amphetamines, women are more likely to use tranquillizers and sedatives for non-medical purposes. People in treatment for drug use disorders related to opioids and cocaine tend to be older: in their early thirties on average. By contrast, those in treatment for cannabis use disorders tend to be younger: in their early twenties on average.
B. HEALTH CONSEQUENCES OF DRUG USE
The main focus of this section are the health-related aspects of the use of drugs, such as injecting drug use, HIV and HCV acquired through unsafe inject-ing practices, as these are responsible for the greatest burden of disease, in terms of mortality and disabil-ity, associated with the use of drugs.4, 5 While opioids
4 Institute for Health Metrics and Evaluation, Global Burden of Disease Data. Available at www.healthdata.org/.
5 5 World Drug Report 2017 (United Nations publica-tion, Sales No. E.17.XI.6).
Fig. 3 Trends in the proportion of primary drug of use in drug treatment admissions, by region, 2003, 2009 and 2016
Source: UNODC, responses to the annual report questionnaire.
0102030405060708090
100
2003
2009
2016
2003
2009
2016
2003
2009
2016
2003
2009
2016
2003
2009
2016
2003
2009
2016
2003
2009
2016
Africa NorthAmerica
LatinAmerica and
theCaribbean
Asia Eastern andSouth-EasternEurope
Western andCentralEurope
Oceania
Prop
orti
on o
f tre
atm
ent
(per
cent
age) Other drugs
Amphetamine-type stimulantsCocaineOpioidsCannabis
Africa North America
Latin America and the
Caribbean
Asia Eastern and South-Eastern
Europe
Western and Central
Europe
Oceania

15
GLOBAL OVERVIEW OF DRUG DEMAND AND SUPPLY B. Health consequences of drug use 2
corresponding to 0.22 per cent (range: 0.17 to 0.30 per cent) of the global population aged 15–64 years. This estimate is based on the most recent and high-est quality information currently available to UNODC. It does not imply that there has been a change in the global number of PWID compared with those published in previous editions of the World Drug Report. Based on data from 107 coun-tries, the estimate covers 88 per cent of the global population aged 15–64 years.
The extent of injecting drug use is less certain or unknown in some subregions due to the paucity of data: in the Caribbean, information is available only for Puerto Rico; for all of Oceania, there are data for Australia and New Zealand only; while for Africa, data are available for countries comprising 58 per cent of the population aged 15–64 years, and for the Near and Middle East, only 17 per cent of that population.
The subregions where the largest numbers of PWID reside are Eastern and South-Eastern Europe, with 17 per cent of the global total number of PWID and where the prevalence of injecting drug use is highest at 3.8 times the global average; North America, with 17 per cent of the global total of PWID and where the prevalence of injecting drug use is 2.5 times the global average; and East and South-East Asia, with 30 per cent of the global total of PWID, but where the prevalence of injecting drug use is relatively low and is below the global average.
Almost half of all PWID worldwide in 2016 were estimated to reside in just three countries: China, the Russian Federation and the United States. Although these three countries combined account for just 27 per cent of the global population aged 15–64 years, together they are home to 45 per cent of the world’s PWID, an estimated 4.8 million people.
In addition to the estimates presented here, another study6 providing national, regional and global esti-mates of PWID and the prevalence of HIV among PWID was published in The Lancet Global Health in 2017 (see the box, entitled “Injecting drug use
6 Louisa Degenhardt and others, “Global prevalence of injecting drug use and sociodemographic characteristics and prevalence of HIV, HBV, and HCV in people who inject drugs: a multistage systematic review”, The Lancet Global Health, vol. 5, No. 12 (2017), pp. e1192–e1207.
are responsible for most of the negative health impact of drug use, in regions where opioid use is less common, the use of other substances such as cocaine and amphetamines (both injecting and non-injecting use) is also associated with adverse health conse-quences. There is also increasing awareness of the health risks associated with the use of NPS, although in terms of the magnitude of the problem they are small. Furthermore, in many subregions, the non-medical use of benzodiazepines has been associated with overdose deaths that also involved opioids.
Almost 11 million people worldwide injected drugs in 2016
The UNODC/WHO/UNAIDS/World Bank joint estimate of the number of PWID in 2016 is 10.6 million (range: 8.3 million to 14.7 million),
Cocaine base paste in South AmericaTraditionally, the use of cocaine base paste had mostly been confined to Colombia and Peru, but over the past decade its use has gradually spread further south, to Argentina, Brazil, Chile and Uru-guay. Cocaine base paste is a derivative of coca leaf with a high potential for harmful use and depend-ence. However, information on the patterns of use, health effects and options for effective treatment is currently limited.a
Tighter restrictions on the sale of, and access to, the chemical precursors used in the manufacture of cocaine hydrochloride is one of the reasons for the spread of the use of cocaine base paste to many countries in South America. Cocaine base paste is a derivative of coca leaf produced as an intermediate product in the preparation of cocaine hydrochlo-ride. It is a form of “smokable cocaine” of high toxicity with a greater potential for dependence than cocaine hydrochloride, and is now a matter of concern in South America as it can cause severe psychological and physical disorders.
As is the case for treatment of all psychostimulants, there is currently no established pharmacological treatment for cocaine use disorders. Information regarding the appropriate treatment for cocaine base paste dependence is therefore limited.
a Antonio Pascale and others, Cocaine Base Paste Con-sumption in South America: A Review of Epidemiologi-cal and Medical-Toxicological Aspects (Washington, D. C., Organization of American States, Inter-American Drug Abuse Control Commission, 2015).
16
WO
RLD
DRU
G R
EPO
RT 2
018
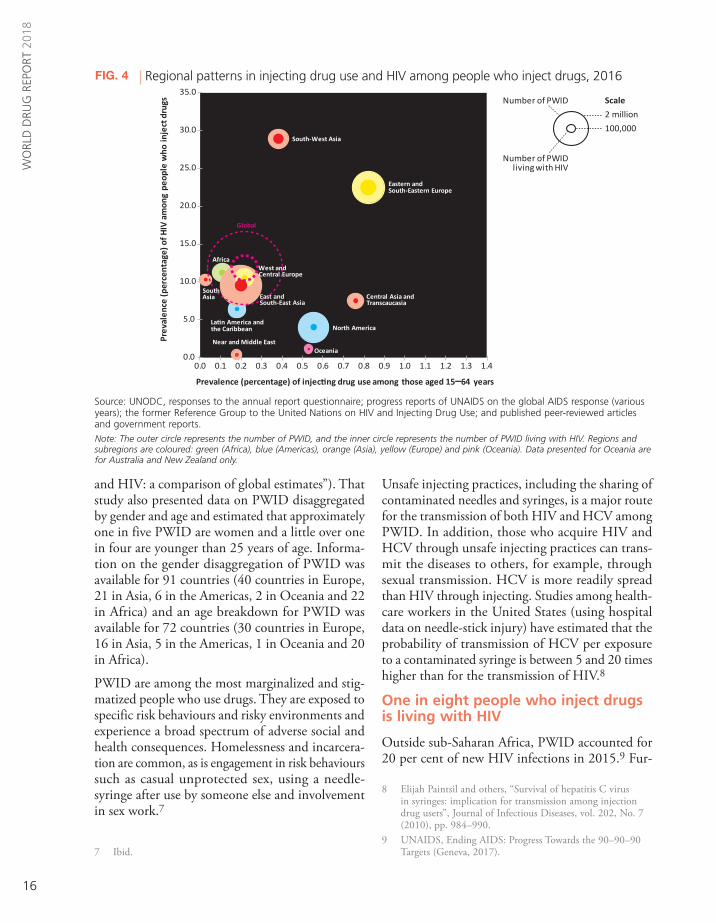
Unsafe injecting practices, including the sharing of contaminated needles and syringes, is a major route for the transmission of both HIV and HCV among PWID. In addition, those who acquire HIV and HCV through unsafe injecting practices can trans-mit the diseases to others, for example, through sexual transmission. HCV is more readily spread than HIV through injecting. Studies among health-care workers in the United States (using hospital data on needle-stick injury) have estimated that the probability of transmission of HCV per exposure to a contaminated syringe is between 5 and 20 times higher than for the transmission of HIV.8
One in eight people who inject drugs is living with HIV
Outside sub-Saharan Africa, PWID accounted for 20 per cent of new HIV infections in 2015.9 Fur-
8 Elijah Paintsil and others, “Survival of hepatitis C virus in syringes: implication for transmission among injection drug users”, Journal of Infectious Diseases, vol. 202, No. 7 (2010), pp. 984–990.
9 UNAIDS, Ending AIDS: Progress Towards the 90–90–90 Targets (Geneva, 2017).
and HIV: a comparison of global estimates”). That study also presented data on PWID disaggregated by gender and age and estimated that approximately one in five PWID are women and a little over one in four are younger than 25 years of age. Informa-tion on the gender disaggregation of PWID was available for 91 countries (40 countries in Europe, 21 in Asia, 6 in the Americas, 2 in Oceania and 22 in Africa) and an age breakdown for PWID was available for 72 countries (30 countries in Europe, 16 in Asia, 5 in the Americas, 1 in Oceania and 20 in Africa).
PWID are among the most marginalized and stig-matized people who use drugs. They are exposed to specific risk behaviours and risky environments and experience a broad spectrum of adverse social and health consequences. Homelessness and incarcera-tion are common, as is engagement in risk behaviours such as casual unprotected sex, using a needle-syringe after use by someone else and involvement in sex work.7
7 Ibid.
Fig. 4 Regional patterns in injecting drug use and HIV among people who inject drugs, 2016
Source: UNODC, responses to the annual report questionnaire; progress reports of UNAIDS on the global AIDS response (various years); the former Reference Group to the United Nations on HIV and Injecting Drug Use; and published peer-reviewed articles and government reports.
Note: The outer circle represents the number of PWID, and the inner circle represents the number of PWID living with HIV. Regions and subregions are coloured: green (Africa), blue (Americas), orange (Asia), yellow (Europe) and pink (Oceania). Data presented for Oceania are for Australia and New Zealand only.
0.0
5.0
10.0
15.0
20.0
25.0
30.0
35.0
0.0 0.1 0.2 0.3 0.4 0.5 0.6 0.7 0.8 0.9 1.0 1.1 1.2 1.3 1.4
Prev
alen
ce (p
erce
ntag
e) o
f HIV
am
ong
peop
le w
ho in
ject
dru
gs
Prevalence (percentage) of injecting drug use among those aged 15–64 years
Africa
North AmericaLatin America and the Caribbean
Central Asia and Transcaucasia
East and South-East Asia
South-West Asia
Near and Middle East
SouthAsia
Eastern andSouth-Eastern Europe
West and Central Europe
Oceania
Number of PWID
Number of PWIDliving with HIV
Scale
2 million
100,000
Global
Number of PWID
17
GLOBAL OVERVIEW OF DRUG DEMAND AND SUPPLY B. Health consequences of drug use 2
nated needles and syringes is an important route for the spread of HCV worldwide. Of the total of 1.7 million new HCV infections worldwide in 2015, 23.0 per cent (390,000 people) were attributable to current injecting drug use.14 Of deaths worldwide in 2015 due to cancer and cirrhosis of the liver asso-ciated with HCV infection, 31.5 per cent were attributable to a history of injecting drug use.15 HCV infection is highly prevalent among PWID, as every second PWID is living with HCV. The joint UNODC/WHO/UNAIDS/World Bank estimate for 2016 for the prevalence of HCV among PWID is 51.9 per cent; in other words, 5.5 million people who inject drugs are living with HCV. This estimate is based on the reporting of the prevalence of HCV among PWID from 96 countries, covering 91 per cent of the estimated global number of PWID.The higher risk of the spread of HCV among PWID who are women is of particular concern. A study conducted among 1,868 PWID in Australia, Canada, the Netherlands and the United States esti-mated that women who inject drugs have a 38 per cent higher risk of contracting HCV than their male counterparts. This higher risk does not seem to be related to different practices in the sharing of syringes, which is a significant risk factor for HCV, but is associated with other factors, including genetic factors, and differences in access to prevention services.16
The joint UNODC/WHO/UNAIDS/World Bank global estimate for 2016 for the prevalence of HBV17 among PWID is 7.5 per cent; in other words, an estimated 0.8 million PWID are living with HBV.
Burden of Disease Study 2013”, The Lancet Infectious Dis-eases, vol. 16, No. 12 (2016), pp. 1385–1398.
14 WHO, Global Hepatitis Report 2017 (Geneva, 2017). 15 Ibid. 16 Aryan Esmaeili and others, “The effect of female sex on
hepatitis C incidence among people who inject drugs: results from the International Multicohort InC3 Collabora-tive”, Clinical Infectious Diseases, vol. 66, No. 1 (2018), pp. 20–28.
17 The HBV prevalence estimate is intended to refer to active infection (HBsAg), rather than anti-HBc, which indicates previous exposure. However, it is not always possible to dif-ferentiate that in the data reported to UNODC.
thermore, the number of newly infected PWID worldwide each year has been on the rise, increasing by one third, from 114,000 new cases in 2011 to 152,000 cases in 2015.10 This contrasts with the estimated 11 per cent decline in new HIV infections among adults in general (more precisely, among people aged 15 years and older) that occurred between 2010 and 2016.11
The joint UNODC/WHO/UNAIDS/World Bank 2016 estimate of the prevalence of HIV among PWID is 11.8 per cent, suggesting that 1.3 million PWID are living with HIV. This estimate is based on the reporting of the prevalence of HIV among PWID from 119 countries, covering 94 per cent of the estimated global number of PWID. For PWID living with HIV, co-infection with HCV is highly prevalent, at 82.4 per cent.12
By far the highest prevalence of HIV among PWID is in South-West Asia and in Eastern and South-Eastern Europe, with rates that are, respectively, 2.4 and 1.9 times the global average. Together, those two subregions account for 49 per cent of the total number of PWID worldwide living with HIV. Although the prevalence of HIV among PWID in East and South-East Asia is below the global aver-age, 24 per cent of the global total of PWID living with HIV reside in that subregion. An estimated 53 per cent of PWID living with HIV worldwide in 2016 (662,000 people) resided in just three coun-tries (China, Pakistan and the Russian Federation), which is disproportionately large compared with the percentage of the world’s PWID living in those three countries (35 per cent).
Injecting drugs is a major route for transmission of the HCV virus
The burden of disease (mortality and morbidity) among PWID resulting from HCV is greater than from HIV.13 Unsafe injecting by sharing contami-
10 UNAIDS, Get on the Fast-Track: The Life-cycle Approach to HIV (Geneva, 2016).
11 Ending AIDS: Progress Towards the 90–90–90 Targets.12 Lucy Platt and others, “Prevalence and burden of HCV
co-infection in people living with HIV: a global systematic review and meta-analysis”, Lancet Infectious Diseases, vol. 16, No. 7 (2016), pp. 797-808.
13 Louisa Degenhardt and others, “Estimating the burden of disease attributable to injecting drug use as a risk factor for HIV, hepatitis C, and hepatitis B: findings from the Global

18
WO
RLD
DRU
G R
EPO
RT 2
018
Injecting drug use and HIV: a comparison of global estimates
Given the hidden and stigmatized nature of injecting drug use, it is extremely challenging to arrive at accurate and valid population size estimates for PWID and the prevalence of HIV among PWID in a given country. Aggregating national data and producing regional and global estimates is even more chal-lenging, given the gaps in data at the country level. Numerous methods are employed, including respondent-driven sampling, capture-recapture, the treatment multiplier or unique object multiplier methods, network-scale up, census and enumeration, and general population surveys to generate such estimates. Each method has its own advantages and disadvantages, relies on particular theoretical assumptions that may not fully reflect the real situation, may be logistically difficult to implement, or may not yet have been fully validated.a Estimating the prevalence of HIV among PWID is further complicated by selection bias and the difficulty of recruiting a representative sample. The prevalence of HIV among PWID can vary considerably between geographi-cal locations within a country, thus making the calculation of a national estimate challenging.
In 2017, Degenhardt and co-authors published country, regional and global population size estimates for PWID and the preva-lence of HIV among PWID.b Their global estimate for the number of PWID in 2015 was 3.8 million higher than the corresponding joint UNODC/WHO/UNAIDS/World Bank estimate, and their esti-mated number of PWID living with HIV was 1.25 million higher. The methodologies used by Degenhardt and co-authors and the joint UNODC/WHO/UNAIDS/World Bank estimates were broadly consistent. The selection of country estimates was based on a comparable grading of the quality of the available national esti-mates. In both cases, a population-weighted average approach was used to determine regional and global estimates and to infer estimates for countries for which no data were available. In the study by Degenhardt and co-authors, PWID population size estimates were identified for 83 countries, and the preva-lence of HIV among PWID was identified for 108 countries. UNODC identified estimates of PWID population size for 107 countries and prevalence of HIV among PWID for 118 countries. Degenhardt and co-authors conducted a systematic review of peer-reviewed and grey literature before UNODC conducted an exhaustive annual search of the scientific literature for countries for which data were not reported to UNODC, or were of insuf-ficient quality, and also conducted a global consultation with experts over the prior four years. Where multiple high-quality studies on PWID were available for a country, Degenhardt and co-authors pooled the estimates through meta-analysis. For the prevalence of HIV, if there were multiple estimates avail-able for a given country, Degenhardt and co-authors pooled the estimates published in the four years previous to the most recent estimate available. UNODC generally selected the most recent estimates from studies of the highest quality, giving due consideration to the definition of injecting, sample size and geographical coverage.
For approximately one third of the countries (25), the PWID size estimates presented in the study by Degenhardt and co-authors were retained from the previous global systematic review published 10 years ago, in 2008.c PWID population size estimates were not updated for some countries that account for a large share of PWID: Brazil, China, India, Italy and the Russian
Comparison of estimates of (a) numbers of PWID and (b) numbers of PWID living with HIV, selected countries, 2015
Source: World Drug Report 2017 (comprising the responses to the annual report questionnaire, progress reports of UNAIDS on the global AIDS response (various years), the former Reference Group to the United Nations on HIV and Injecting Drug Use, and pub-lished peer-reviewed articles and government reports); and Louisa Degenhardt and others, “Global prevalence of injecting drug use and sociodemographic characteristics and prevalence of HIV, HBV, and HCV in people who inject drugs: a multistage systematic review”, The Lancet Global Health, vol. 5, No. 12 (2017), pp. e1192–e1207.
Note: The estimated number of PWID and number of PWID living with HIV are for the 15–64 years age category.a The difference between the estimates produced by the two studies.
0.0
0.1
0.2
0.3
0.4
0.5
0.6
0.7
0.0 0.1 0.2 0.3 0.4 0.5 0.6 0.7
Number (millions) - World Drug Report 2017
(b) Comparison of number of PWID living with HIV
Braz
il (4
47,0
00)
Chin
a (1
56,0
00)
Uni
ted
Stat
es (1
37,0
00)
Uni
ted
Repu
blic
of T
anza
nia
(85,
000)
Indo
nesi
a (5
4,00
0)
0.00
0.02
0.04
0.06
0.08
0.10
0.00 0.02 0.04 0.06 0.08 0.10
0.0
0.5
1.0
1.5
2.0
2.5
3.0
0.0 0.5 1.0 1.5 2.0 2.5 3.0
Num
ber
(mill
ions
) - S
tudy
by
Dag
aenh
ardt
and
co-
auth
ors
(a) Comparison of number of PWID
Russ
ia (4
15,0
00)a
Braz
il (6
60,0
00) Uni
ted
Stat
es(6
60,0
00)a
Chin
a (6
38,0
00)a
Uni
ted
Repu
blic
of T
anza
nia
(311
,000
)It
aly
(196
,000
)
0.0
0.1
0.2
0.3
0.4
0.5
0.0 0.1 0.2 0.3 0.4 0.5
19
GLOBAL OVERVIEW OF DRUG DEMAND AND SUPPLY B. Health consequences of drug use 2
Coverage of core interventions to prevent spread of HIV and HCV among PWID remains poor and insufficient
The coverage of core interventions to help prevent the spread of HIV and HCV among PWID in most countries remains too low to be effective.18 Core, science-based interventions for the prevention of HIV are, in order of priority: needle and syringe programmes that provide sterile injecting equip-ment; opioid substitution therapy to reduce dependency on opioids and hence decrease the fre-quency of injecting; HIV testing and counselling, which is an important gateway into treatment and care; and antiretroviral therapy to reduce the viral load and the transmission of HIV.19 For effective HCV prevention, key interventions are needle and syringe programmes and opioid substitution therapy coupled with HCV treatment to substantially reduce the ongoing HCV transmission in the communi-ty.20, 21 In particular, needle and syringe programmes and opioid substitution therapy can be especially effective for both HIV and HCV prevention when they are implemented together with high levels of coverage among PWID (see table 1).22, 23, 24
18 Sarah Larney and others, “Global, regional, and country-level coverage of interventions to prevent and manage HIV and hepatitis C among people who inject drugs: a systematic review”, The Lancet Global Health, vol. 5, No. 12 (2017), pp. e1208–e1220.
19 WHO, UNODC, UNAIDS Technical Guide for Countries to Set Targets for Universal Access to HIV Prevention, Treatment and Care for Injecting Drug Users: 2012 Revision (Geneva, WHO, 2012).
20 Katy M. E. Turner and others, “The impact of needle and syringe provision and opiate substitution therapy on the incidence of hepatitis C virus in injecting drug users: pool-ing of UK evidence”, Addiction, vol. 106, No. 11 (2011), pp. 1978–1988.
21 Peter Vickerman and others, “Can needle and syringe pro-grammes and opiate substitution therapy achieve substantial reductions in hepatitis C virus prevalence? Model projec-tions for different epidemic settings”, Addiction, vol. 107, No. 11 (2012), pp. 1984–1995.
22 Louisa Degenhardt and others, “Prevention of HIV infec-tion for people who inject drugs: why individual, structural and combination approaches are needed”, The Lancet, vol. 376, No. 9737 (2010), pp. 285–301.
23 Natasha K. Martin and others, “Combination interventions to prevent HCV transmission among people who inject drugs: modeling the impact of antiviral treatment, needle and syringe programs, and opiate substitution therapy”, Clinical Infectious Diseases, vol. 57, Suppl. No. 2 (2013), pp. S39–S45.
24 Turner and others, “The impact of needle and syringe
Federation. Estimates of the prevalence of HIV among PWID was included for 108 countries, using estimates retained from the 2008 review for 12 of those countries, including Brazil and Argentina.
More recent data on injecting drug use have become available for the Russian Federation, China and Italy since the 2008 review and were published in the World Drug Report 2017. The estimates, which used indirect meth-ods of estimation, were officially reported to UNODC or UNAIDS but were not otherwise available in the public domain.
A direct comparison is made, at the country level, of the number of PWID and PWID living with HIV, in order to identify those countries for which there are the larg-est differences between the estimates of the World Drug Report 2017 and the study by Degenhardt and co-authors.
The methodology to determine regional and global esti-mates and imputing data for countries with missing information was based on the same approach in both studies and has not produced tangible discrepancies. A large part of the discrepancy in regional and global estimates is due to the differences in national data for a handful of countries.
There are important policy implications that arise from the differences in the regional estimates put forward by the two data sets. The study by Degenhardt and co-authors shows the highest prevalence of HIV among PWID living with HIV in Latin America, whereas the esti-mates of the World Drug Report 2017 point to Eastern Europe as the region of greatest concern. From a global perspective, regional data on PWID and PWID living with HIV are crucial to prioritize efforts to support national institutions and non-governmental organizations to provide prevention and treatment services. Thus, defin-ing the most recent and methodologically sound set of information is vital to ensuring that global efforts are properly targeted where they are most needed.
a Abu S. Abdul-Quader, Andrew L Baughman and Wolf-gang Hladik, “Estimating the size of key populations: current status and future possibilities”, Current Opinion in HIV and AIDS, vol. 9, No. 2 (2014), pp. 107–114.
b Louisa Degenhardt and others, “Global prevalence of injecting drug use and sociodemographic characteristics and prevalence of HIV, HBV, and HCV in people who inject drugs: a multistage systematic review”, The Lancet Global Health, vol. 5, No. 12 (2017), pp. e1192–e1207.
c Bradley M. Mathers and others, “Global epidemiology of injecting drug use and HIV among people who inject drugs: a systematic review”, The Lancet, vol. 372, No. 9651 (2008), pp. 1733–1745.

20
WO
RLD
DRU
G R
EPO
RT 2
018
Availability of services for people in prison and post releasePeople who use drugs in prison are at greater risk of acquiring infectious diseases and have less access to relevant prevention and treatment services than those in the community outside prison.a The prevalence of risk behaviours, coupled with the lack of access to prevention measures in many prisons, can result in the frighteningly rapid spread of HIV. The prevalence of HIV, HCV, HBV and tuberculosis among people in prison and other closed settings is 2 to 10 times higher than among the general population.b, c, d, e However, access to HIV prevention, treatment and care programmes is often lacking in prison, and even where they are available, in many cases, such programmes are not necessarily of the same standard as those provided in the community.f
On release from prison, most people living with HIV are often discharged without support and have to face pervasive and multidimensional forms of exclusion, stigma and discrimination stemming from their incarceration history, HIV status, socioeco-nomic class and ethnicity.g, h People in prison are often not in contact with HIV, HCV and drug dependence treatment services upon release, or are provided with only some services, because often they are unaware of what services are offered.i, j The widespread lack of adequate discharge planning and follow-up after release has profound and immediate health effects. A systematic review found that prisoners were unlikely to be placed in contact with community health-care services upon their release from prison. People recently released from prison had poor access to HIV prevention, treatment and care as a result of stigma and discrimination, and missed out on follow-up care by health services after release due to a lack of discharge planning.k Research suggests that after release, use of antiret-roviral therapy decreases from 51 per cent to 29 per cent, and viral suppression drops from 40 per cent to 21 per cent.l Lack of follow-up for HCV treatment undermines the effectiveness of prison-provided care, where it is available, and contributes to the spread of the disease in the community.m, n
People who use heroin are exposed to a severe risk of death from overdose after release from prison, especially in the first two weeks. Such deaths are related to a lowered tolerance to the effects of heroin developed during incarceration.o Yet released prisoners are rarely able to access overdose preven-tion medications such as naloxone and methadone, or other treatment for substance dependence.p Having secured housing is an important determinant of access to and retention in HIV care. Disparities in housing status contribute substantially to the gap in HIV treatment outcomes between homeless and non-homeless patients, including the attainment of viral sup-pression over time.q
a Ralf Jürgens, Manfred Nowak and Marcus Day, “HIV and incar-ceration: prisons and detention”, Journal of the International AIDS Society, vol. 14, No. 26 (2011), pp. 1–17.
b Kate Dolan and others, “Global burden of HIV, viral hepatitis, and tuberculosis in prisoners and detainees”, The Lancet, vol. 388, No. 10049 (2016), pp. 1089–1102.
c Kate Dolan and others, “Drug injection, sexual activity, tat-tooing and piercing among prison inmates: A global systematic review and meta-analysis of 2,359,220 prisoners” Epidemiological Reviews, (2018) (in press).
d Amber Arain, Geert Robaeysand Heino Stöver, “Hepatitis C in European prisons: a call for an evidence-informed response”, BMC Infectious Diseases, vol. 14, Suppl. No. 6 (2014), pp. 1–6.
e Lilanganee Telisinghe and others, “HIV and tuberculosis in prisons in sub-Saharan Africa”, The Lancet, vol. 388, No. 10050 (2016), pp. 1215–1227.
f Josiah D. Rich and others, “Clinical care of incarcerated people with HIV, viral hepatitis, or tuberculosis”, The Lancet, vol. 388, No. 10049 (2016), pp. 1103–1114.
g Leonard S. Rubenstein and others, “HIV, prisoners, and human rights”, The Lancet, vol. 388, No. 10050 (2016), pp. 1202–1214.
h Alexis C. Dennis and others, “‘You’re in a world of chaos’: experi-ences accessing HIV care and adhering to medications after incar-ceration”, Journal of the Association of Nurses in AIDS Care, vol. 26, No. 5 (2015), pp. 542–55.
i Liza Solomon and others, “Survey finds that many prisons and jails have room to improve HIV testing and coordination of postrelease treatment”, Health Affairs (Millwood), vol. 33, no. 3 (2014), pp. 434–442.
j Sung-Pil Choi and others, “Prevalence and correlates of commu-nity re-entry challenges faced by HIV-infected male prisoners in Malaysia”, International Journal of STD and AIDS, vol. 21, No. 6 (2010), pp. 416–23.
k Rubenstein and others, “HIV, prisoners, and human rights”.
l Princess A. Iroh and others, “The HIV care cascade before, during, and after incarceration: a systematic review and data syn-thesis”, American Journal of Public Health, vol. 105, No. 7 (2015), pp. e5–16.
m Tianhua He and others, “Prevention of hepatitis C by screening and treatment in U.S. prisons”, Annals of Internal Medicine, vol. 164, No. 2 (2016), pp. 84–92.
n Natasha K. Martin and others, “HCV treatment as prevention in prison: key issues”, Hepatology, vol. 61, No. 1 (2015), pp. 402 and 403.
o WHO, Preventing Overdose Deaths in the Criminal Justice System (Copenhagen, 2014).
p D. Leach and P. Oliver, “Drug-related death following release from prison: a brief review of the literature with recommenda-tions for practice”, Current Drug Abuse Reviews, vol. 4, No. 4 (2011), pp. 292–297.
q Alexei Zelenev and others, “Patterns of homelessness and implica-tions for HIV health after release from jail”, AIDS and Behaviour, vol. 17, Suppl. No. 2 (2013), pp. 181–194.

21
GLOBAL OVERVIEW OF DRUG DEMAND AND SUPPLY B. Health consequences of drug use 2
Table 1 Definition of high, moderate and low target levels for coverage of interventions
Source: WHO, UNODC, UNAIDS Technical Guide for Countries to Set Targets for Universal Access to HIV Prevention, Treatment and Care for Injecting Drug Users: 2012 Revision (Geneva, WHO, 2012).
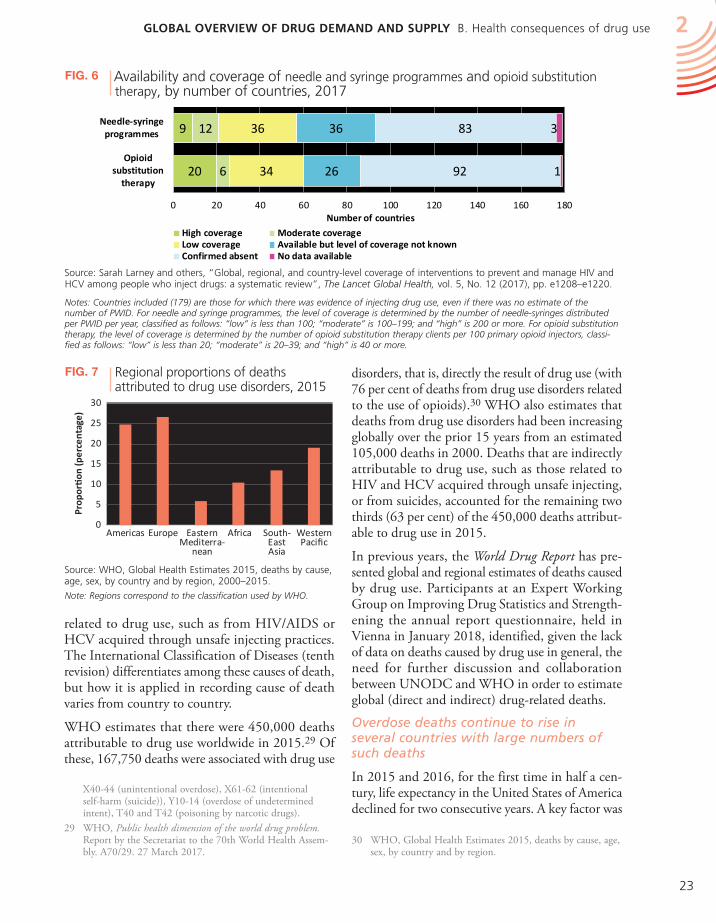
implementation of opioid substitution therapy in 86 countries (48 per cent) but it was absent in 92 countries (46 per cent). There were 79 countries (44 per cent) implementing both needle and syringe programmes and opioid substitution therapy. Infor-mation on the availability of HIV testing and counselling and antiretroviral therapy was found to be very sparse. There were 34 countries with evi-dence of HIV-testing programmes for PWID and 17 countries confirming an absence of such pro-grammes. Data on antiretroviral therapy were not available in 162 countries.27
High levels of coverage of needle and syringe pro-grammes and opioid substitution therapy were available in only 5 per cent and 11 per cent, respec-tively, of the 179 countries where there was evidence of injecting drug use. There were 79 countries (44 per cent) with implementation of both needle and syringe programmes and opioid substitution ther-apy; however, there were only 4 countries (3 in Western Europe and 1 in Oceania) with high cover-age of both needle and syringe programmes and OST.Deaths attributable to drug use remain high globally
Dying prematurely as a consequence of drug use is the most extreme outcome for people who use drugs. However, determining the extent of mortality attrib-utable to drug use is not straightforward: deaths caused by drug use can be directly related to drug use disorders, such as overdose,28 or can be indirectly
27 Ibid.28 According to the International Classification of Diseases
(tenth revision) of WHO, the corresponding codes are:
The above-mentioned core interventions are not available in all countries where there is evidence of injecting drug use. The level of coverage of these interventions has been categorized by WHO, UNODC and UNAIDS as low, moderate, or high.25
A global review of the availability of these interven-tions assessed that the coverage of needle and syringe programmes and opioid substitution therapy among PWID was at low levels, with an estimated 33 (range: 21 to 50) needle-syringes distributed per PWID per year, and 16 (range: 10 to 24) clients of opioid substitution therapy per 100 PWID.26 It was not possible to produce global coverage estimates for HIV testing and counselling and antiretroviral therapy because of a lack of data. In subregions with the largest numbers of PWID (East and South-East Asia, Eastern Europe and North America), there were low levels of service coverage for both needle and syringe programmes and opioid substitution therapy, with the single exception of moderate cov-erage of opioid substitution therapy in North America.
Of the 179 countries where there was evidence of injecting drug use (although not necessarily a PWID population size estimate), needle and syringe pro-grammes were known to be available in 93 countries (52 per cent) and was confirmed to be absent in 83 countries (46 per cent). There was evidence of
provision and opiate substitution therapy on the incidence of hepatitis C virus in injecting drug users”.
25 WHO, UNODC, UNAIDS Technical Guide.26 Larney and others, “Global, regional, and country-level
coverage of interventions to prevent and manage HIV and hepatitis C among people who inject drugs: a systematic review”.
Intervention IndicatorLevel of coverage
low moderate high
Needle-syringe programmes (NSP) Number of needle-syringes distributed per PWID per year
Less than 100
100 to less than 200 200 or more
Opioid substitution therapy (OST) Number of OST clients per 100 PWID
Less than 20
20 to less than 40 40 or more
Antiretroviral therapy (ART)
Number of PWID receiving ART per 100 HIV-positive PWID
Less than 25
25 to less than 75 75 or more
HIV testing and counselling (HTC)Number of PWID receiving an HIV
test in the past 12 months per 100 PWID
Less than40
40 to less than 75 75 or more

22
WO
RLD
DRU
G R
EPO
RT 2
018
Fig. 5 Coverage of core interventions to prevent the spread of HIV and HCV among people who inject drugs, by region, 2017
Source: Sarah Larney and others, “Global, regional, and country-level coverage of interventions to prevent and manage HIV and hepatitis C among people who inject drugs: a systematic review”, The Lancet Global Health, vol. 5, No. 12 (2017), pp. e1208–e1220.
Notes: Regional grouping are those used by the authors. The level of coverage is classified as low, moderate or high according to the WHO, UNODC, UNAIDS Technical Guide for Countries to Set Targets for Universal Access to HIV Prevention, Treatment and Care for Inject-ing Drug Users (2012 revision) (Geneva, WHO, 2012). In the present figure, for Australasia, information is available for only Australia and New Zealand. Regional coverage could not be determined for antiretroviral therapy because of the lack of data.
0 10 20 30 40 50 60 70 80 90 100
Eastern EuropeWestern Europe
East and South-East AsiaSouth Asia
Central AsiaCaribbean
Latin AmericaNorth America
Australia and New ZealandPacific islands
Middle East and North AfricaSub-Saharan Africa
Global
Opioid substitution therapy clients per 100 PWID
low moderate high
0 100 200 300 400 500 600
Eastern EuropeWestern Europe
East and South-East AsiaSouth Asia
Central AsiaCaribbean
Latin AmericaNorth America
Australia and New ZealandPacific islands
Middle East and North AfricaSub-Saharan Africa
Global
Needle-syringes distributed per PWID per year
low moderate high
0 10 20 30 40 50 60 70 80 90 100
Eastern EuropeWestern Europe
East and South-East AsiaSouth Asia
Central AsiaCaribbean
Latin AmericaNorth America
Australia and New ZealandPacific islands
Middle East and North AfricaSub-Saharan Africa
Global
Number of PWID receiving an HIV test in the past 12 months per 100 PWID
low moderate highNot known
Not knownNot known
Not known
Not known
23
GLOBAL OVERVIEW OF DRUG DEMAND AND SUPPLY B. Health consequences of drug use 2
disorders, that is, directly the result of drug use (with 76 per cent of deaths from drug use disorders related to the use of opioids).30 WHO also estimates that deaths from drug use disorders had been increasing globally over the prior 15 years from an estimated 105,000 deaths in 2000. Deaths that are indirectly attributable to drug use, such as those related to HIV and HCV acquired through unsafe injecting, or from suicides, accounted for the remaining two thirds (63 per cent) of the 450,000 deaths attribut-able to drug use in 2015.
In previous years, the World Drug Report has pre-sented global and regional estimates of deaths caused by drug use. Participants at an Expert Working Group on Improving Drug Statistics and Strength-ening the annual report questionnaire, held in Vienna in January 2018, identified, given the lack of data on deaths caused by drug use in general, the need for further discussion and collaboration between UNODC and WHO in order to estimate global (direct and indirect) drug-related deaths.
Overdose deaths continue to rise in several countries with large numbers of such deaths
In 2015 and 2016, for the first time in half a cen-tury, life expectancy in the United States of America declined for two consecutive years. A key factor was
30 WHO, Global Health Estimates 2015, deaths by cause, age, sex, by country and by region.
related to drug use, such as from HIV/AIDS or HCV acquired through unsafe injecting practices. The International Classification of Diseases (tenth revision) differentiates among these causes of death, but how it is applied in recording cause of death varies from country to country.
WHO estimates that there were 450,000 deaths attributable to drug use worldwide in 2015.29 Of these, 167,750 deaths were associated with drug use
X40-44 (unintentional overdose), X61-62 (intentional self-harm (suicide)), Y10-14 (overdose of undetermined intent), T40 and T42 (poisoning by narcotic drugs).
29 WHO, Public health dimension of the world drug problem. Report by the Secretariat to the 70th World Health Assem-bly. A70/29. 27 March 2017.
Fig. 6 Availability and coverage of needle and syringe programmes and opioid substitution therapy, by number of countries, 2017
Source: Sarah Larney and others, “Global, regional, and country-level coverage of interventions to prevent and manage HIV and HCV among people who inject drugs: a systematic review”, The Lancet Global Health, vol. 5, No. 12 (2017), pp. e1208–e1220.
Notes: Countries included (179) are those for which there was evidence of injecting drug use, even if there was no estimate of the number of PWID. For needle and syringe programmes, the level of coverage is determined by the number of needle-syringes distributed per PWID per year, classified as follows: “low” is less than 100; “moderate” is 100–199; and “high” is 200 or more. For opioid substitution therapy, the level of coverage is determined by the number of opioid substitution therapy clients per 100 primary opioid injectors, classi-fied as follows: “low” is less than 20; “moderate” is 20–39; and “high” is 40 or more.
Fig. 7 Regional proportions of deaths attributed to drug use disorders, 2015
Source: WHO, Global Health Estimates 2015, deaths by cause, age, sex, by country and by region, 2000–2015.
Note: Regions correspond to the classification used by WHO.
20
9
6
12
34
36
26
36
92
83
1
3
0 20 40 60 80 100 120 140 160 180
Opioidsubstitution
therapy
Needle-syringeprogrammes
Number of countries
High coverage Moderate coverageLow coverage Available but level of coverage not knownConfirmed absent No data available
20
9
6
12
34
36
26
36
92
83
1
3
0 20 40 60 80 100 120 140 160 180
Opioidsubstitution
therapy
Needle-syringeprogrammes
Number of countries
High coverage Moderate coverageLow coverage Available but level of coverage not knownConfirmed absent No data available
20
9
6
12
34
36
26
36
92
83
1
3
0 20 40 60 80 100 120 140 160 180
Opioidsubstitution
therapy
Needle-syringeprogrammes
Number of countries
High coverage Moderate coverageLow coverage Available but level of coverage not knownConfirmed absent No data available
0
5
10
15
20
25
30
Americas Europe EasternMediterra-
nean
Africa South-EastAsia
WesternPacific
Prop
orti
on (p
erce
ntag
e)

24
WO
RLD
DRU
G R
EPO
RT 2
018
Causes of mortality and early loss of life attributable to drug use: The Global Burden of Disease Study 2016The Global Burden of Disease Studya estimated that there were 452,000 deaths (range: 420,000 to 487,000) worldwide in 2016 attributable to drug use (accounting for 0.83 per cent of global deaths from all causes). Approximately three out of four (74 per cent) of those deaths were of males. Untreated HCV, which can give rise to liver cancer and liver cirrhosis, constituted the largest proportion of them (45 per cent).
Globally, deaths attributable to drug use resulted in 16.8 million (range: 15.5 to 18.2 million) years of life lost due to premature death in 2016.b This suggests that a person who dies from causes attributable to drug use loses on average 37 years of life, a statistic that reflects the very young age at which many such premature deaths occur. Deaths attrib-uted to drug use disorders (mostly overdose) peak among the youngest age group (30–34 years), while deaths from untreated HCV typically occur among an older age group (55–59 years).
(a) Leading causes of deaths attributable to drug use, 2016
Source: Emmanuela Gakidou and others, “Global, regional, and national comparative risk assessment of 84 behavioural, envi-ronmental and occupational, and metabolic risks or clusters of risks, 1990–2016: a systematic analysis for the Global Burden of Disease Study 2016”, The Lancet, vol. 390, No. 10100 (2017), pp. 1345–1422.
(b) Age distribution of deaths attributable to drug use compared to global deaths from all causes, 2016
Source: Institute for Health Metrics and Evaluation, Global Burden of Disease Data.
a Emmanuela Gakidou and others, “Global, regional, and national comparative risk assessment of 84 behavioural, envi-ronmental and occupational, and metabolic risks or clusters of risks, 1990–2016: a systematic analysis for the Global Burden
of Disease Study 2016”, The Lancet, vol. 390, No. 10100 (2017), pp. 1345–1422.
b Institute for Health Metrics and Evaluation, Global Burden of Disease Data.
19.1%
1.9%1.2%
9.6%
13.8%30.7%
11.8%
2.3%8.3%
1.3%
Opioid use disorders
Cocaine use disorders
Amphetamine use disorders
Other drug use disorders
Hepatitis C, liver cancer
Hepatitis C, cirrhosis and other chronic liver diseases
HIV/AIDS resulting in other diseases
HIV/AIDS - Tuberculosis
Self-harm
Other
Drug use disorders
31.8%
0
5
10
15
20
25
10–1
415
–19
20–2
425
–29
30–3
435
–39
40–4
445
–49
50–5
455
–59
60–6
465
–69
70–7
475
–79
80–8
485
–89
90–9
495
plu
s
Perc
enta
ge
Age group
Global deaths, all causes
Deaths related to drug use, all causes
Deaths related to drug use disorders
HCV attributed to drug use
HIV/AIDS attributed to drug use

25
GLOBAL OVERVIEW OF DRUG DEMAND AND SUPPLY B. Health consequences of drug use 2
increased tenfold among men and fivefold among women. In 2016, for the first time, deaths from synthetic opioids other than methadone surpassed both deaths from heroin and deaths from natural and semi-synthetic opioids (including morphine, codeine, hydrocodone and oxycodone). Overdose deaths associated with the use of heroin increased by 19 per cent from 2015 to 2016. Since 1999, deaths related to the use of heroin have increased more than twelvefold among women and sevenfold among men.33, 34 This is in line with the 150 per cent increase in past-year heroin use among women and the 79 per cent increase in use among men that occurred from the period 2002–2004 to the period 2013–2015.35 Excluding those deaths that also included synthetic opioids (primarily fentanyl), deaths related to the use of heroin, cocaine and methamphetamine have, however, remained essen-tially stable since 2013.
33 Holly Hedegaard, Margaret Warner and Arialdi M. Miniño, “Drug overdose deaths in the United States, 1999–2016”, NCHS Data Brief, No. 294 (December 2017).
34 Centers for Disease Control and Prevention, National Center on Health Statistics, CDC WONDER. Available at https://wonder.cdc.gov/.
35 United States, Center for Behavioral Health Statistics and Quality, Key Substance Use and Mental Health Indicators in the United States; Results from the 2015 Survey on Drug Use and Health, HHS Publication No. SMA 16-4984, NSDUH Series H-51 (Rockville, Maryland, 2016).
an increase in unintentional injuries, which include drug-related deaths.31 A study that looked at reasons for declines in life expectancy related to certain causes of mortality over the period 2000–2015 found that overdose deaths, particularly those involving the use of opioids, made an important contribution to the causes of losses in years of life expectancy.32 Overdose deaths continued to increase in the United States, rising faster than ever, with the largest annual percentage increase ever recorded in the age-adjusted overdose mortality rate occurring from 2015 to 2016. Total overdose deaths increased by 21.4 per cent from 2015 to 2016 to reach 63,632, the highest number on record. This increase was mostly related to deaths associated with synthetic opioids other than methadone (including fentanyl, fentanyl analogues and tramadol), which increased substantially to 19,413 overdose deaths in 2016; an increase of 103 per cent (more than doubling) from 2015, which continued the sharply increasing trend that started in 2012, since when deaths associated with synthetic opioids other than methadone have
31 Kenneth D. Kochanek and others, Mortality in the United States, 2016. National Center for Health Statistics Data Brief No. 293, December 2017. Centers for Disease Control and Prevention.
32 Deborah Dowell and others, “Contribution of opioid-involved poisoning to the change in life expectancy in the United States, 2000-2015”, JAMA. vol. 318, No. 11 (2017), pp. 1065–1067.
Fig. 8 Overdose deaths from selected drugs in the United States and British Columbia, Canada
Source: For United States, see Holly Hedegaard, Margaret Warner and Arialdi M. Miniño, “Drug overdose deaths in the United States, 1999–2016”, NCHS Data Brief, No. 294 (December 2017). For British Columbia, Canada, see British Colombia Coroners’ Service, “Illicit drug overdose deaths in B.C., January 1, 2008–February 28, 2018” (Burnaby, British Columbia, Office of the Chief Coroner, 5 April 2018); and British Colombia Coroners’ Service, “Fentanyl-detected illicit drug overdose deaths. January 1, 2012–December 31, 2017” (Burnaby, British Columbia, Office of the Chief Coroner, 31 January 2018).
0
10,000
20,000
30,000
40,000
50,000
60,000
70,00019
9920
0020
0120
0220
0320
0420
0520
0620
0720
0820
0920
1020
1120
1220
1320
1420
1520
16
Num
ber o
f de
aths
Total overdose deathsAll opioidsSynthetic opioids other than methadoneHeroinNatural and semi-synthetic opioids
United States of America Total overdose deathsAll opioidsSynthetic opioids other than methadoneHeroin Natural and semi-synthetic opioidsOverdose deaths – fentanyl detected Overdose deaths – no fentanyl detected
0
200
400
600
800
1,000
1,200
1,400
1,600
2007
2008
2009
2010
2011
2012
2013
2014
2015
2016
2017
Num
ber o
f de
aths
Total overdose deathsOverdose deaths, fentanyl detectedOverdose deaths, no fentanyl detected
British Columbia, Canada

26
WO
RLD
DRU
G R
EPO
RT 2
018
In Australia, since 2011 there has been a significant increase in the rate of drug-induced deaths (deaths directly attributable to drug use), with the number reaching the highest on record in 2016 at 1,808 deaths. The majority of those deaths were caused by unintentional overdose (71 per cent), followed by suicide overdose (23 per cent), with other causes such as chronic complications of drug use or deaths of undetermined intent accounting for the remaining 6 per cent. These drug-induced deaths were mainly associated with non-medical use of benzodiazepines and oxycodone, which are both prescription drugs, used to manage anxiety and pain, respectively. Deaths from use of controlled substances have also been increasing, with the mortality rate related to stimulants (including methamphetamine and crystalline methamphetamine) quadrupling since 1999.42 Witnessing or personally experiencing an overdose is common
Non-fatal overdoses are substantially more common than fatal ones, with many drug users reporting that they have personally experienced a non-fatal over-dose. Overdoses that are fatal make up only a very small proportion of all overdoses, an estimated 2–4 per cent.43 Based on a global, systematic review of the literature, almost half (47 per cent; range: 17 to 68 per cent) of the drug users included in the stud-ies44 reported that they had experienced a non-fatal overdose at least once in their lives, with almost one in six (17 per cent; range: 4 to 38 per cent) person-ally experiencing a non-fatal overdose in the past year.45
The risk of overdose is related to the route of admin-istration of drugs, with injecting carrying the highest
related to drug poisoning in England and Wales: 2016 registrations”, Statistical Bulletin (August 2017).
42 Australian Bureau of Statistics, “Causes of death, Australia, 2016”, No. 3303.0, 27 September 2017. Available at www.abs.gov.au/ausstats/[email protected]/mf/3303.0.
43 Shane Darke, Richard P. Mattick and Louisa Degenhardt, “The ratio of non-fatal to fatal heroin overdose”, Addiction, vol. 98, No. 8 (2003), pp. 1169–1171.
44 Among the 43 separate studies, 6 studies were among users of any substance, while the vast majority of the studies were among heroin, “crack” and/or cocaine users (21 studies), or among people who inject drugs (16 studies).
45 Silvia S. Martins and others, “Worldwide prevalence and trends in unintentional drug overdose: a systematic review of the literature”, American Journal of Public Health, vol. 105, No. 11 (2015), pp. e29–e49.
Overdose deaths in British Columbia, Canada, reached a record level in 2017, continuing the sharply increasing trend that began in 2012. This increase was largely associated with fentanyl and its analogues (consumed either alone or in combination with other drugs), which had been detected in just 4 per cent of overdose deaths in 2012, whereas they were detected in 81 per cent of overdose deaths in 2017. There was a 73 per cent increase in overdose deaths in which fentanyl was detected from 2016 to 2017. The number of overdose deaths in which fen-tanyl was not detected, however, remained fairly stable over the period 2012–2017.36, 37 Fentanyls remain a minor problem in other countries, with the notable exception of Estonia, where fentanyl has dominated the use of opioids for 15 years.
In Europe, overdose deaths rose for the third con-secutive year to reach the highest number on record in 2015 (latest year for which data are available), with 8,441 deaths. Opioid-related deaths were responsible for the overall increase, with the pres-ence of opioids (mostly heroin) detected in 79 per cent of overdose deaths in 2015. Increases in over-dose deaths were reported in Germany, Lithuania, the Netherlands, Spain, Sweden and the United Kingdom.38 The United Kingdom reported the highest number of overdose deaths in Europe, accounting for approximately one third (31 per cent) of the total.39 In England and Wales,40 the number of drug misuse deaths for both men and women that were registered in 2016 was the highest since records began in 1993: 2,593 drug misuse deaths, mostly due to heroin and/or morphine.41
36 Canada, British Colombia Coroners’ Service, “Illicit drug overdose deaths in B.C. January 1, 2008–February 28, 2018” (Burnaby, British Columbia, Office of the Chief Coroner, 5 April 2018).
37 Canada, British Colombia Coroners’ Service, “Fentanyl-detected illicit drug overdose deaths. January 1, 2012–December 31, 2017” (Burnaby, British Columbia, Office of the Chief Coroner, 31 January 2018).
38 EMCDDA, European Drug Report 2017: Trends and Devel-opments, (Luxembourg, Publications Office of the European Union, 2017).
39 Ibid. 40 The definition of a drug misuse death is either a death
where the underlying cause is drug abuse or drug depend-ence or a death where the underlying cause is drug poison-ing and where any substance controlled under the United Kingdom Misuse of Drugs Act 1971 is involved.
41 United Kingdom, Office for National Statistics, “Deaths

27
GLOBAL OVERVIEW OF DRUG DEMAND AND SUPPLY B. Health consequences of drug use 2
an opportunity to intervene and influence the out-come of the situation and whether it proves fatal, for example, by administrating naloxone in the case of an opioid overdose. So called “take-home” nalox-one programmes have been implemented in a number of countries over the past 20 years, provid-ing naloxone training and overdose management education, as well as take-home naloxone kits, to opioid users and others likely to witness opioid over-doses. Through an adequate response, including the administration of naloxone by someone witnessing the overdose, opioid overdose is reversible.54, 55, 56, 57
54 John Strang and Rebecca McDonald, eds., Preventing Opioid Overdose Deaths with Take-home Naloxone, Insights Series No. 20 (Luxembourg, EMCDDA, 2016).
55 WHO, Community Management of Opioid Overdose (Geneva, 2014).
56 EMCDDA, Preventing Fatal Overdoses: A Systematic Review of the Effectiveness of Take-home Naloxone, EMCDDA Papers (Luxembourg, Publications Office of the European Union, 2015).
57 Alexander Y. Walley and others, “Opioid overdose rates and implementation of overdose education and nasal naloxone
risk of overdose compared with swallowing, sniffing or smoking.46 Using combinations of certain drugs increases the risk of overdose, particularly the use of heroin in combination with depressants such as alcohol and benzodiazepines.47 For people who use opioids, starting use again following a period of abstinence, such as disrupted or discontinued treat-ment, or soon after release from prison, leads to a heightened risk of overdose linked to a reduced tol-erance to opioids.48, 49
Non-fatal overdoses can leave drug users with sig-nificant health problems such as muscle tissue breakdown, kidney failure, heart problems, seizures, nerve damage or cognitive impairment.50 Experi-encing a non-fatal overdose has been shown to be associated with a subsequent fatal overdose, and the risk increases with the number of prior non-fatal overdoses.51, 52 Early recognition that an overdose is occurring and subsequent intervention is often vital in preventing a fatal overdose. A very high proportion of people who use heroin and/or cocaine, or who inject drugs (almost three in four), report that they have wit-nessed an overdose (including those that prove fatal).53 This means that people who use drugs have
46 M. Teresa Brugal and others, “Factors associated with non-fatal heroin overdose: assessing the effect of frequency and route of heroin administration”, Addiction, vol. 97, No. 3 (2002), pp. 319–327.
47 UNODC and WHO, “Opioid overdose: preventing and reducing opioid overdose mortality”, Discussion paper, UNODC/WHO 2013 (June 2013).
48 WHO, Preventing Overdose Deaths in the Criminal Justice System (Copenhagen, 2014).
49 John Strang and others, “Loss of tolerance and overdose mortality after inpatient opiate detoxification: follow up study”, British Medical Journal, vol. 326, No. 7396 (2003), pp. 959 and 960.
50 Matthew Warner-Smith and others, “Heroin overdose: causes and consequences”, Addiction, vol. 96, No. 8 (2001), pp. 1113–1125.
51 Mark A. Stoové, Paul M. Dietze and Damien Jolley, “Over-dose deaths following previous non-fatal heroin overdose: record linkage of ambulance attendance and death registry data”, Drug and Alcohol Review, vol. 28, No. 4 (2009), pp. 347–352.
52 Alexander Caudarella and others, “Non-fatal overdose as a risk factor for subsequent fatal overdose among people who inject drugs”, Drug and Alcohol Dependence, vol. 162 (2016), pp. 51–55.
53 Silvia S. Martins and others, “Worldwide prevalence and trends in unintentional drug overdose: a systematic review of the literature”, American Journal of Public Health, vol. 105, No. 11 (2015), pp. e29–e49.
Fig. 9 Proportion of drug usersa who have witnessed an overdose (including fatal overdoses) or personally experienced a non-fatal overdose
Source: Silvia S. Martins and others, “Worldwide prevalence and trends in unintentional drug overdose: a systematic review of the literature”, American Journal of Public Health, vol. 105, No. 11 (2015), pp. e29–e49.
Note: The numbers of studies included are shown in the legend. The shaded box depicts the middle 50 per cent of the data points (i.e., corresponding to the 25th and 75th percentiles) with the hor-izontal like within this box depicting the median value. The error bars are the minimum and maximum values. a Of the 43 separate studies, 6 studies were among users of any substance, while the vast majority were among heroin, “crack” and/or cocaine users (21 studies), or among PWID (16 studies).
100
90
80
70
60
50
40
30
20
10
0Pr
opor
tion
(per
cent
age)
96
70
50
68
47
17
38
17
4
Witnessed overdose(including fatal) during lifetime (n=17 studies)Experienced non-fataloverdose during lifetime(n=29 studies)Experienced non-fataloverdose during pastyear (n=14 studies)

28
WO
RLD
DRU
G R
EPO
RT 2
018
over the period 2013–2016 to 213,000 ha.59 Coca bush cultivation is thus back to the level reported in 2001, only slightly below (4 per cent lower) the peak in 2000. That decline and subsequent increase in coca production were primarily the consequence of changes in coca bush cultivation in Colombia; however, coca bush cultivation increased in all three coca-producing countries, Bolivia (Plurinational State of ), Colombia and Peru, in 2016, resulting in a 36 per cent increase in the total area under coca bush cultivation that year. Opium production is at its highest level since UNODC monitoring began and cocaine manufacture is at its highest ever level
With some 10,500 tons of production, estimated global opium production in 2017 is by far the high-est on record since UNODC started monitoring global opium production on an annual basis at the beginning of the twenty-first century.60 Global opium production61 increased by 65 per cent from 2016 to 2017 (and, increased by 120 per cent since 2015), a far greater increase than the corresponding increase in the area under opium poppy cultivation. This was mainly the result of a gradual increase in poppy yields in Afghanistan, which were starting to recover from the low levels reported in the main cultivation areas over the previous few years. Having fallen over the period 2005–2013, global cocaine manufacture62 rose by 56 per cent over the period 2013–2016. Potential cocaine output reached 1,410 tons (at 100 per cent purity) in 2016, the highest level ever estimated, representing a 25 per
59 The latest data available on coca bush cultivation are from 2016.
60 Estimates available on opium production in the literature for the early decades of the twentieth century show far higher levels of opium production up to the mid-1930s than in the recent past (see UNODC, A Century of International Drug Control, 2009); however, those earlier estimates were based on different methodologies (such as payments of taxes and other levies by opium farmers) and are not fully com-parable with the data presented in the present report, which are largely based on remote sensing and yield surveys (see the online methodological annex for details).
61 To estimate opium production, the area under opium poppy cultivation is multiplied by the respective opium yield per hectare in each region.
62 The Single Convention on Narcotic Drugs of 1961 refers to production of a substance, such as opium, where no further processing takes place, and the manufacture of substance, such as cocaine, where processing in laboratories is required.
C. EXTENT OF DRUG SUPPLY
Drug cultivation and productionCannabis continues to be the most widely produced illicit drug worldwide
In addition to be being the most widely consumed drug worldwide, cannabis continues to be the most widely produced. Over the period 2010–2016, the cultivation of cannabis was reported, directly or indi-rectly, to UNODC by 145 countries located in all regions. Accounting for 94 per cent of the global population, that is more than twice the number of countries reporting opium poppy cultivation.
Cultivation of both opium poppy and coca bush show a marked increase
Growing by some 37 per cent from the previous year, the total global area under opium poppy cultivation has doubled since 2006 to reach almost 418,000 hectares in 2017. This was primarily the result of a marked increase in opium poppy cultivation in Afghanistan,58 which accounted for 86 per cent of global opium production in 2017. There is no single reason for the increase in opium poppy cultivation in Afghanistan as many complex and geographically diverse elements influence farmers’ decisions to cul-tivate opium poppy. A combination of events, including political instability, corruption and a lack of government control and security may have exac-erbated rule of law challenges. By shifting its focus to combatting anti-government elements in densely populated areas, the Afghan Government may have made the rural population more vulnerable. A reduc-tion in the engagement of the international aid community may also have hindered socioeconomic development opportunities in rural areas.
Accounting for some 5 per cent of global opium production in 2017, Myanmar, by contrast, reported a decrease in opium poppy cultivation and production.
Covering an area roughly half the size of the area under opium poppy cultivation, global coca bush cultivation, which had declined by 45 per cent over the period 2000–2013, increased by 76 per cent
distribution in Massachusetts: interrupted time series analy-sis”, BMJ, vol. 346 (2013), pp. 1–13.
58 For a detailed discussion on the opioid market, see booklet 3.
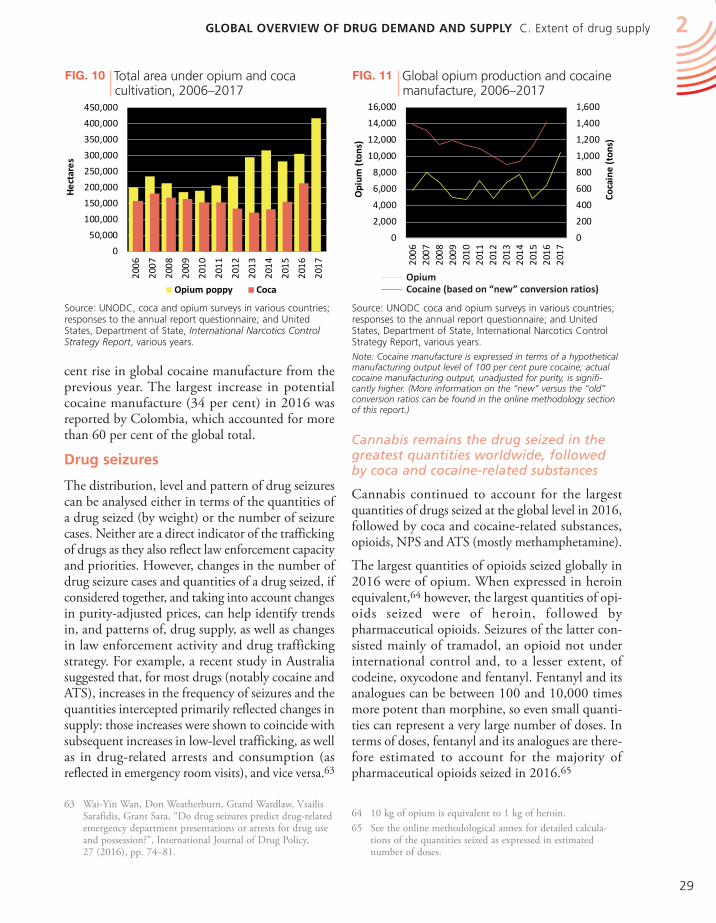
29
GLOBAL OVERVIEW OF DRUG DEMAND AND SUPPLY C. Extent of drug supply 2
Cannabis remains the drug seized in the greatest quantities worldwide, followed by coca and cocaine-related substances
Cannabis continued to account for the largest quantities of drugs seized at the global level in 2016, followed by coca and cocaine-related substances, opioids, NPS and ATS (mostly methamphetamine).
The largest quantities of opioids seized globally in 2016 were of opium. When expressed in heroin equivalent,64 however, the largest quantities of opi-oids seized were of heroin, followed by pharmaceutical opioids. Seizures of the latter con-sisted mainly of tramadol, an opioid not under international control and, to a lesser extent, of codeine, oxycodone and fentanyl. Fentanyl and its analogues can be between 100 and 10,000 times more potent than morphine, so even small quanti-ties can represent a very large number of doses. In terms of doses, fentanyl and its analogues are there-fore estimated to account for the majority of pharmaceutical opioids seized in 2016.65
64 10 kg of opium is equivalent to 1 kg of heroin.65 See the online methodological annex for detailed calcula-
tions of the quantities seized as expressed in estimated number of doses.
cent rise in global cocaine manufacture from the previous year. The largest increase in potential cocaine manufacture (34 per cent) in 2016 was reported by Colombia, which accounted for more than 60 per cent of the global total.
Drug seizures
The distribution, level and pattern of drug seizures can be analysed either in terms of the quantities of a drug seized (by weight) or the number of seizure cases. Neither are a direct indicator of the trafficking of drugs as they also reflect law enforcement capacity and priorities. However, changes in the number of drug seizure cases and quantities of a drug seized, if considered together, and taking into account changes in purity-adjusted prices, can help identify trends in, and patterns of, drug supply, as well as changes in law enforcement activity and drug trafficking strategy. For example, a recent study in Australia suggested that, for most drugs (notably cocaine and ATS), increases in the frequency of seizures and the quantities intercepted primarily reflected changes in supply: those increases were shown to coincide with subsequent increases in low-level trafficking, as well as in drug-related arrests and consumption (as reflected in emergency room visits), and vice versa.63
63 Wai-Yin Wan, Don Weatherburn, Grand Wardlaw, Vsailis Sarafidis, Grant Sara, “Do drug seizures predict drug-related emergency department presentations or arrests for drug use and possession?”, International Journal of Drug Policy, 27 (2016), pp. 74–81.
Fig. 10 Total area under opium and coca cultivation, 2006–2017
Source: UNODC, coca and opium surveys in various countries; responses to the annual report questionnaire; and United States, Department of State, International Narcotics Control Strategy Report, various years.
0
50,000
100,000
150,000
200,000
250,000
300,000
350,000
400,000
450,000
2006
2007
2008
2009
2010
2011
2012
2013
2014
2015
2016
2017
Hec
tare
s
Opium poppy Coca
0
200
400
600
800
1,000
1,200
1,400
1,600
0
2,000
4,000
6,000
8,000
10,000
12,000
14,000
16,000
2006
2007
2008
2009
2010
2011
2012
2013
2014
2015
2016
2017
Coca
ine
(ton
s)
Opi
um (
tons
)
OpiumCocaine (based on 'new' conversion ratios)OpiumCocaine (based on “new” conversion ratios)
Fig. 11 Global opium production and cocaine manufacture, 2006–2017
Source: UNODC coca and opium surveys in various countries; responses to the annual report questionnaire; and United States, Department of State, International Narcotics Control Strategy Report, various years.
Note: Cocaine manufacture is expressed in terms of a hypothetical manufacturing output level of 100 per cent pure cocaine; actual cocaine manufacturing output, unadjusted for purity, is signifi-cantly higher. (More information on the “new” versus the “old” conversion ratios can be found in the online methodology section of this report.)
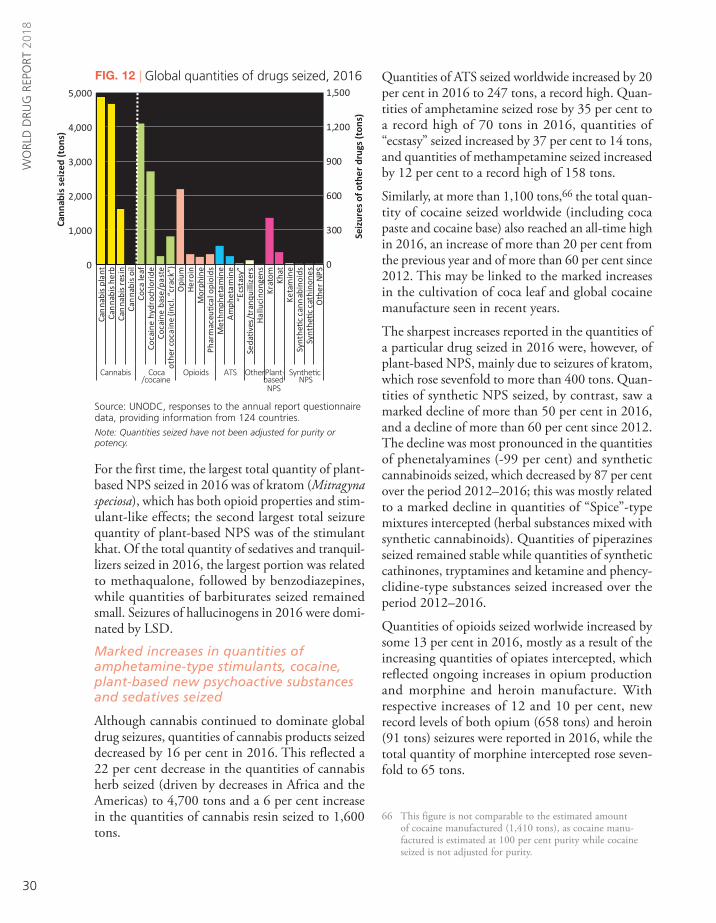
30
WO
RLD
DRU
G R
EPO
RT 2
018
Quantities of ATS seized worldwide increased by 20 per cent in 2016 to 247 tons, a record high. Quan-tities of amphetamine seized rose by 35 per cent to a record high of 70 tons in 2016, quantities of “ecstasy” seized increased by 37 per cent to 14 tons, and quantities of methampetamine seized increased by 12 per cent to a record high of 158 tons.
Similarly, at more than 1,100 tons,66 the total quan-tity of cocaine seized worldwide (including coca paste and cocaine base) also reached an all-time high in 2016, an increase of more than 20 per cent from the previous year and of more than 60 per cent since 2012. This may be linked to the marked increases in the cultivation of coca leaf and global cocaine manufacture seen in recent years.
The sharpest increases reported in the quantities of a particular drug seized in 2016 were, however, of plant-based NPS, mainly due to seizures of kratom, which rose sevenfold to more than 400 tons. Quan-tities of synthetic NPS seized, by contrast, saw a marked decline of more than 50 per cent in 2016, and a decline of more than 60 per cent since 2012. The decline was most pronounced in the quantities of phenetalyamines (-99 per cent) and synthetic cannabinoids seized, which decreased by 87 per cent over the period 2012–2016; this was mostly related to a marked decline in quantities of “Spice”-type mixtures intercepted (herbal substances mixed with synthetic cannabinoids). Quantities of piperazines seized remained stable while quantities of synthetic cathinones, tryptamines and ketamine and phency-clidine-type substances seized increased over the period 2012–2016.
Quantities of opioids seized worlwide increased by some 13 per cent in 2016, mostly as a result of the increasing quantities of opiates intercepted, which reflected ongoing increases in opium production and morphine and heroin manufacture. With respective increases of 12 and 10 per cent, new record levels of both opium (658 tons) and heroin (91 tons) seizures were reported in 2016, while the total quantity of morphine intercepted rose seven-fold to 65 tons.
66 This figure is not comparable to the estimated amount of cocaine manufactured (1,410 tons), as cocaine manu-factured is estimated at 100 per cent purity while cocaine seized is not adjusted for purity.
For the first time, the largest total quantity of plant-based NPS seized in 2016 was of kratom (Mitragyna speciosa), which has both opioid properties and stim-ulant-like effects; the second largest total seizure quantity of plant-based NPS was of the stimulant khat. Of the total quantity of sedatives and tranquil-lizers seized in 2016, the largest portion was related to methaqualone, followed by benzodiazepines, while quantities of barbiturates seized remained small. Seizures of hallucinogens in 2016 were domi-nated by LSD.
Marked increases in quantities of amphetamine-type stimulants, cocaine, plant-based new psychoactive substances and sedatives seized
Although cannabis continued to dominate global drug seizures, quantities of cannabis products seized decreased by 16 per cent in 2016. This reflected a 22 per cent decrease in the quantities of cannabis herb seized (driven by decreases in Africa and the Americas) to 4,700 tons and a 6 per cent increase in the quantities of cannabis resin seized to 1,600 tons.
Fig. 12 Global quantities of drugs seized, 2016
Source: UNODC, responses to the annual report questionnaire data, providing information from 124 countries.
Note: Quantities seized have not been adjusted for purity or potency.
0
300
600
900
1,200
1,500
0
1,000
2,000
3,000
4,000
5,000Ca
nna
bis
plan
tCa
nna
bis
herb
Can
nabi
s re
sin
Can
nabi
s oi
lCo
ca le
afCo
cain
e hy
droc
hlor
ide
Coca
ine
base
/pas
teot
her
coca
ine
(incl
. “cr
ack”
)O
pium
Her
oin
Mor
phin
ePh
arm
aceu
tical
opi
oids
Met
hmph
etam
ine
Am
phet
amin
e“E
csta
sy”
Seda
tives
/tra
nqui
llize
rsH
allu
cino
ngen
sKr
atom Kh
atKe
tam
ine
Synt
hetic
can
nab
inoi
dsSy
nthe
tic c
athi
none
sO
ther
NPS
Cannabis Opioids ATS OtherPlant based NPSSynthetic NPS
Ton
of c
anna
bis
0
300
600
900
1,200
1,500
0
1,000
2,000
3,000
4,000
5,000Ca
nna
bis
plan
tCa
nna
bis
herb
Can
nabi
s re
sin
Can
nabi
s oi
lCo
ca le
afCo
cain
e hy
droc
hlor
ide
Coca
ine
base
/pas
teot
her
coca
ine
(incl
. cra
ck)
Opi
umH
eroi
nM
orph
ine
Phar
mac
eutic
al o
pioi
dsM
ethm
phet
amin
eA
mph
etam
ine
Ecst
asy
Seda
tives
/tra
nqui
liser
sH
allu
cino
ngen
sKr
atom Kh
atKe
tam
ine
Synt
hetic
can
nab
inoi
dsSy
nthe
tic c
athi
none
sO
ther
NPS
CannabisCoca / cocaineOpioids ATS OtherPlant based NPSSynthetic NPSIn
ton
equi
vale
nts
of o
ther
dru
gs
Cann
abis
sei
zed
(ton
s)
0
300
600
900
1,200
1,500
0
1,000
2,000
3,000
4,000
5,000Ca
nna
bis
plan
tCa
nna
bis
herb
Can
nabi
s re
sin
Can
nabi
s oi
lCo
ca le
afCo
cain
e hy
droc
hlor
ide
Coca
ine
base
/pas
teot
her
coca
ine
(incl
. cra
ck)
Opi
umH
eroi
nM
orph
ine
Phar
mac
eutic
al o
pioi
dsM
ethm
phet
amin
eA
mph
etam
ine
Ecst
asy
Seda
tives
/tra
nqui
liser
sH
allu
cino
ngen
sKr
atom Kh
atKe
tam
ine
Synt
hetic
can
nab
inoi
dsSy
nthe
tic c
athi
none
sO
ther
NPS
CannabisCoca / cocaineOpioids ATS OtherPlant based NPSSynthetic NPS
Seiz
ures
of o
ther
dru
gs (t
ons)
Ton
of c
anna
bis
Cannabis
Coca
Opioids
ATS
Other Plant-
Synthe�c
/cocaine
based
NPS
NPS

31
GLOBAL OVERVIEW OF DRUG DEMAND AND SUPPLY C. Extent of drug supply 2
2015–2016 were of cannabis (mostly herb), while the next largest number of seizure cases were of ATS.Analysis of trends in the respective shares of each drug in seizure cases shows a decline in the share of global cannabis seizure cases over the past decade. By contrast, the share of seizure cases of ATS (mostly methamphetamine), opioids and NPS rose over the same period. Such trends are confirmed when analysing data from 71 countries that reported seizure cases in the two periods, 2005–2006 and 2015–2016. It is challenging to compare global trends in the number of drug seizure cases and quantities seized because not all countries always report the number of seizure cases intercepted. Considering the sample of countries that reported the number of seizures and quantities seized in both 2005–2006 and 2015–2016 (71 countries), it can be noted that overall the number of drug seizure cases increased by 17 per cent from the period 2005–2006 to the period 2015–2016, while the quantities of drugs seized increased by 3 per cent. The average size of drug seizure cases decreased from roughly 6 kg in 2005–2006 to 5 kg in the period 2015–2016. However, that overall decline in the average seizure size in the 71 reporting countries masks the variations between the different types of drug intercepted. The average size of seizure cases of cannabis herb, cannabis resin, cocaine, morphine, “ecstasy”, plant-based NPS and synthetic NPS
Although the total quantity of pharmaceutical opi-oids seized worldwide in 2016 decreased by more than 20 per cent from the very high level in 2015, it was still nine times the amount seized in 2012. The increase over the period 2012–2016 was mainly driven by a large increase in the quantities of trama-dol intercepted, as well as of hydrocodone, oxycodone and fentanyl.
A sevenfold increase was reported in the quantities of sedatives and tranquillizers intercepted in 2016. This was mainly the result of a marked increase in the quantities of methaqualone, benzodiazepines and GHB seized.
Quantities of hallucinogens seized worldwide decreased by more than 90 per cent from 2015 to 2016 and, over the medium term, decreased by 75 per cent from 2012 to 2016, mostly because of a marked decline in North America. However, quan-tities of the prototype hallucinogen LSD seized more than doubled in 2016, for the most part because of an increase in the quantities of LSD seized in Europe and North America.
The decline in the average size of drug seizures may reflect changes in both drug trafficking and law enforcement strategies
Member States reported 2.5 million drug seizure cases to UNODC in 2016, up from 2.4 million in 2015 (reported by 69 and 65 countries, respectively). More than half of all drug seizure cases in the period
Fig. 13 Global quantities of selected drugs seized, 2012–2016
Source: UNODC, responses to the annual report questionnaire.
Note: A rate of 10:1 was used to transform seizures of opium into seizures expressed in heroin equivalents.
0
150
300
450
600
750
900
1,050
1,200
0
1,000
2,000
3,000
4,000
5,000
6,000
7,000
8,000
2012
2013
2014
2015
2016
2012
2013
2014
2015
2016
2012
2013
2014
2015
2016
2012
2013
2014
2015
2016
2012
2013
2014
2015
2016
Cannabis Cocaine Opioids ATS NPS
Seiz
ures
of o
ther
dru
gs (
tons
)
Cann
abis
sei
zed
(ton
s)
Cannabis herbCannabis resinSynthetic NPSPlant-based NPSOther ATS “Ecstasy”AmphetamineMethamphetamineOther illicit opioidsPharmaceutical opioidsOpium in heroin equivalentsMorphineHeroinNon-specified cocaineCocaine hydrochlorideand “crack” cocaineCocaine paste/base

32
WO
RLD
DRU
G R
EPO
RT 2
018
The stronger increase in the number of drug seizure cases as compared to the quantities of drugs seized and thus the decline in the average size of seizure cases from the period 2005–2006 to the period 2015–2016 might stem from changes in both law enforcement and drug trafficking practices. Changes in law enforcement strategies may include the tar-geting of retail and microtrafficking and a greater emphasis on less bulky types of drugs. Changes in drug trafficking activities may include a trend towards an increasing number of shipments of smaller quantities of a drug — a strategy used by drug trafficking organizations to reduce losses result-ing from seizures (including the use of drug mules and postal/private parcel services, particularly in the case of drugs sold on the darknet). A trend of traf-ficking less bulky drugs or trafficking substances of a higher purity might also be responsible for declin-ing amounts seized per seizure cases, as might be an increase in the use of social supply networks for distributing drugs. Improved reporting of smaller seizure cases might also have contributed to the decline in the average size of individual seizures.
However, differences in the average weight of seizure cases for different drug types are not necessarily an indication of changes in law enforcement interven-tions or the modus operandi of drug traffickers, as there are large differences in purity and potency for the various substances.
decreased from the period 2005–2006 to the period 2015–2016, while the average size of individual seizure cases of cannabis plant, opium, metham-phetamine, amphetamine, LSD and methaqualone increased.
Fig. 15 Changes in quantities of drugs seized and number of drug seizure cases from 2005–06 to 2015–16
Source: UNODC, responses to the annual report questionnaire
Note: Calculation based on data from 71 countries (index: 2005–2006 = 100).
Fig. 14 Distribution of global number of drug seizure cases, 2015–2016
Source: UNODC, responses to the annual report questionnaire.
Note: The calculations are based on a breakdown of almost 5 million seizure cases reported to UNODC in the period 2015–2016 period. The data set includes 2.4 million seizures cases reported in 2015 and 2.5 million seizures cases in 2016. Seizure case information is based on information from 80 countries, including 65 countries reporting in 2015 and 69 countries reporting in 2016.
Pharmaceutical opioidsOther opioidsCoca leaf/bushCocaine paste/baseCocaine hydrochloride“Crack” and other cocaineNPSSedativesHallucinogensOther
Cannabis herbCannabis resinCannabis plantsOther cannabisMethamphetamineAmphetamine"Ecstasy"Other ATSHeroinOpium/poppy plants
Coca
/cocaine 10%
Opi
oids
15%
ATS 16%
Cannabis 53%
35%
13%3%
12%
8%
6%
3%6%
3%
0
100
200
300
All
drug
s
Cann
abis
her
b
Cann
abis
res
in
Cann
abis
pla
nt
Coca
ine
“Cra
ck”
coca
ine
Opi
um
Her
oin
Mor
phin
e
Am
phet
amin
e
Met
ham
phet
amin
e
“Ecs
tasy
”
Synt
hetic
NPS
Plan
t-ba
sed
NPS
LSD
Met
aqua
lone
Cannabis Cocaine Opiates ATS NPS Others
Inde
x: 2
005/
2006
= 1
00
Change in quantities seized (same countries reporting)Change in seizure cases (same countries reporting)

33
GLOBAL OVERVIEW OF DRUG DEMAND AND SUPPLY C. Extent of drug supply 2
The average size of seizures of cocaine (3.4 kg per case) intercepted in the period 2015–2016 was far larger than, for example, the average size of indi-vidual seizures of ATS, synthetic NPS or heroin, which may suggest that cocaine is more likely than other drugs to be trafficked in large quantities, for instance, on semi-submersibles and ships and in containers. Despite being trafficked on similarly long and diverse trafficking routes to its main con-sumer markets, seizure cases of heroin (0.2 kg) were, on average, substantially smaller in terms of weight than those of cocaine.
The smallest average seizures (under 10 g) reported in the period 2015–2016 were of LSD, benzodiaz-epines, “crack” cocaine and barbiturates. This may be a reflection of the relatively short distances between manufacturing locations (LSD, “crack” cocaine), or between the point where they are diverted into illicit channels (benzodiazepines and barbiturates), and their respective consumer markets.
Drug trafficking via the darknet is a growing challenge for authorities
Empirical research on the darknet (the part of the “deep web” containing information that is only accessible using special web browsers) is limited so far. Summarized below, some recent studies
Fig. 16 Average size of drug seizures in 2015–2016 and trend in average size from the period 2005–2006 to the period 2015–2016, selected drugs
Source: UNODC, responses to the annual report questionnaire.
Note: See online methodological annex for calculation details.
Seizures of some of the bulkiest drugs, such as plant-based NPS (13 kg per case, and mainly reflecting seizures of khat and kratom), opium (9.5 kg) and cannabis plant (9.2 kg), accounted for the largest average size of seizure cases over the period 2015–2016.
Fig. 17 Average size of drug seizures in 2015–2016 and trend in average size from the period 2005–2006 to the period 2015–2016, selected drugs
Source: UNODC, responses to the annual report questionnaire.
Note: See online methodological annex for calculation details.
0.01.02.03.04.05.06.07.08.09.0
10.0
2005
/06
2015
/16
2005
/06
2015
/16
2005
/06
2015
/16
2005
/06
2015
/16
2005
/06
2015
/16
All drugs Cannabisherb
Cannabisresin
Cannabisplant
Opium
Kilo
gram
s pe
r sei
zure
2015-16 full dataset2005-06 and 2015-16 same countries reporting2005-06 and 2015-16 same countries reporting
2015–2016 full data set2005–2006 and 2015–2016 same countries reporting
0.01.02.03.04.05.06.07.08.09.0
10.0
2005
/06
2015
/16
2005
/06
2015
/16
2005
/06
2015
/16
2005
/06
2015
/16
2005
/06
2015
/16
All drugs Cannabisherb
Cannabisresin
Cannabisplant
Opium
Kilo
gram
s pe
r sei
zure
2015-16 full dataset2005-06 and 2015-16 same countries reporting2005-06 and 2015-16 same countries reporting
-
0.5
1.0
1.5
2.0
2.5
3.0
3.5
2005
/06
2015
/16
2005
/06
2015
/16
2005
/06
2015
/16
2005
/06
2015
/16
2005
/06
2015
/16
2005
/06
2015
/16
2005
/06
2015
/16
2005
/06
2015
/16
2005
/06
2015
/16
2015
/16
2015
/16
Cocaine Crack Heroin MorphineAmphetamineMeth-amphetamineEcstasy Synthetic NPSBenzo-diazepinesBarbituratesMetaqualone
Cocaine Opiates ATS NPS Sedatives Sedatives
Kilo
gram
s pe
r sei
zure
2015-16 full dataset2005-06 and 2015-16 same countries reporting2005-06 and 2015-16 same countries reporting
Cocaine "Crack" Heroin Morphine Amphe- Meth- "Ecstasy" Synthetic LSD Benzo- Barbitu- cocaine tamine amphe- NPS diazepines rates tamine Cocaine Opiates ATS NPS Halluci- Sedatives nogens
-
0.5
1.0
1.5
2.0
2.5
3.0
3.5
2005
/06
2015
/16
2005
/06
2015
/16
2005
/06
2015
/16
2005
/06
2015
/16
2005
/06
2015
/16
2005
/06
2015
/16
2005
/06
2015
/16
2005
/06
2015
/16
2005
/06
2015
/16
2015
/16
2015
/16
Cocaine Crack Heroin MorphineAmphetamineMeth-amphetamineEcstasy Synthetic NPSBenzo-diazepinesBarbituratesMetaqualone
Cocaine Opiates ATS NPS Sedatives Sedatives
Kilo
gram
s pe
r sei
zure
2015-16 full dataset2005-06 and 2015-16 same countries reporting2005-06 and 2015-16 same countries reporting
-
0.5
1.0
1.5
2.0
2.5
3.0
3.5
20
05/0
6
20
15/1
6
20
05/0
6
20
15/1
6
20
05/0
6
20
15/1
6
20
05/0
6
20
15/1
6
20
05/0
6
20
15/1
6
20
05/0
6
20
15/1
6
20
05/0
6
20
15/1
6
20
05/0
6
20
15/1
6
20
05/0
6
20
15/1
6
20
15/1
6
20
15/1
6
Cocaine Crack Heroin MorphineAmphetamineMeth-amphetamineEcstasy Synthetic NPSBenzo-diazepinesBarbituratesMetaqualone
Cocaine Opiates ATS NPS Sedatives Sedatives
Kil
ogr
ams
pe
r se
izu
re
2015-16 full dataset2005-06 and 2015-16 same countries reporting2005-06 and 2015-16 same countries reporting
2015–2016 full data set2005–2006 and 2015–2016 same countries reporting
34
WO
RLD
DRU
G R
EPO
RT 2
018
(typically making use of web-crawling techniques whereby repeated snapshots of various darknet market sites are made and analysed) help provide a better understanding of trends and patterns linked to drug purchases via the darknet. The discussion also draws on the experience and in-depth knowl-edge of European and North American police specialists involved in undercover activities to iden-tify drug sellers and dismantle darknet drug selling platforms.
Darknet: drug market business model
The darknet is being used for many illicit activities, including drug trafficking. A darknet study con-ducted jointly by EMCDDA and Europol found that more than 60 per cent of all listings on five major darknet markets worldwide up to August 2017 were related to the illicit sale of drugs, includ-ing drug-related chemicals and pharmaceuticals.67 The illicit sale of drugs alone accounted for almost half of all such listings.
People wishing to purchase drugs via the darknet typically access it through the “Onion router” (TOR) to ensure that their true identities remain concealed. The use of specialized darknet explorers, such as Grams, enables them to navigate to their desired market platform where products bought on darknet marketplaces are typically paid for in cryp-tocurrencies such as bitcoin.68 Bitcoins can then be used to purchase other goods and services or can be exchanged for different national currencies. The delivery of drugs purchased on those marketplaces is usually undertaken by public or private postal services,69 with parcels often sent to anonymous post office boxes, particularly to automated “pack stations”, for self-service collection.
67 EMCDDA and Europol, Drugs and the Darknet: Perspec-tives for Enforcement, Research and Policy, Joint publications series (Luxembourg, Publications Office of the European Union, 2017), p. 15.
68 Since the beginning of the darknet drug markets, the bit-coin has been the most popular payment currency (Martin Horton-Eddison and Matteo Di Cristofaro, “Hard interven-tions and innovation in crypto-drug markets: the escrow example”, Policy Brief No. 11 (Swansea, United Kingdom, Global Drug Policy Observatory, Swansea University, August 2017)), p. 4.
69 World Customs Organization, Illicit Trade Report 2015 (Brussels, December 2016), p. 44.
The main advantage for both suppliers and custom-ers is the anonymity of the transaction as it does not require any physical contact. Darknet trafficking also overcomes the challenge of suppliers and cus-tomers having to be in the same location, as well as the need for suppliers to have the critical mass nec-essary to sustain a standard drug market. As with orthodox Internet transactions, customers also ben-efit from other customers’ feedback on the quality of products sold and the reliability of the supplier. Darknet platforms also guarantee the payment of the goods sold, typically making use of escrow account systems,70 which request immediate pay-ment for goods ordered while delaying the finalization of payment until goods ordered have actually been received by the customer.
High degree of volatility and frequent disappearance of darknet drug trading platforms
Darknet markets have been in operation since 2010,71 although they have only gained true impor-tance since the start of the Silk Road trading platform in February 2011 (closed down in October 2013). They consist of websites that are used as trading platforms, similar to licit trading platforms on the public World Wide Web (the “Surface Web”) used for purchasing licit goods and services. The illegality of many darknet transactions means, how-ever, that there are significant differences between darknet and open World Wide Web trading platforms.
Principal among those differences are the use of a dedicated currency, mostly bitcoin, escrow accounts and the rapid emergence and disappearance of trad-ing platforms, often directly linked to illegal business practices. Based on a detailed analysis by EMCDDA and Europol of 103 darknet marketplaces operating globally over the period 2011–2017, darknet mar-kets remain active for just over eight months on average, with the most enduring ones operating, on average, for just under four years, and most not last-ing more than a year. The main platforms on the darknet have thus changed frequently, from Silk Road over the period 2011–2013, to Agora and
70 Horton–Eddison and Di Cristofaro, “Hard interventions and innovation in crypto-drug markets”, p. 3.
71 EMCDDA and Europol, Drugs and the Darknet.
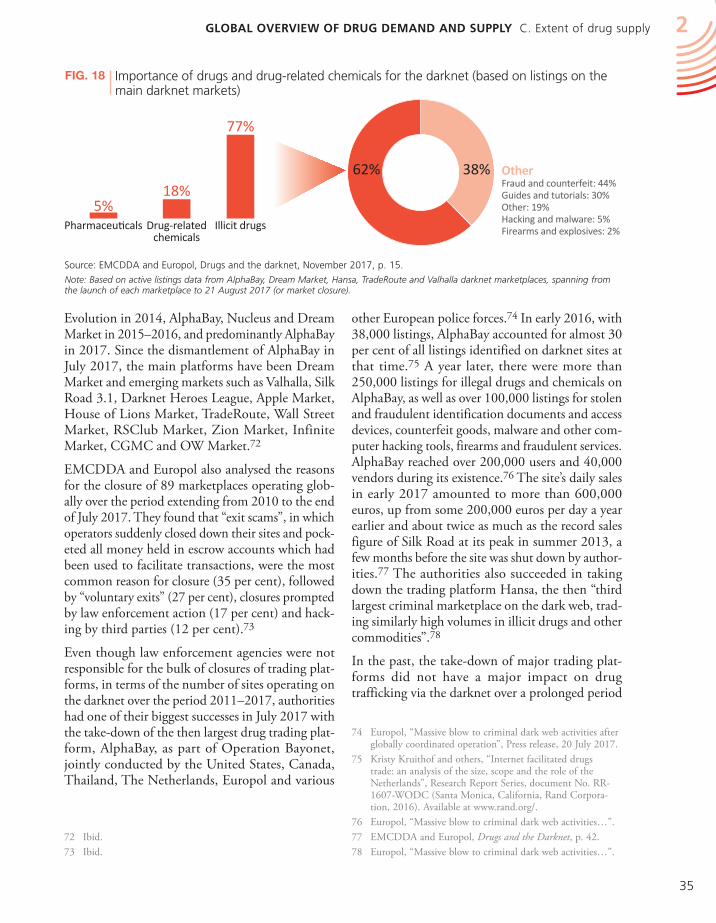
35
GLOBAL OVERVIEW OF DRUG DEMAND AND SUPPLY C. Extent of drug supply 2
other European police forces.74 In early 2016, with 38,000 listings, AlphaBay accounted for almost 30 per cent of all listings identified on darknet sites at that time.75 A year later, there were more than 250,000 listings for illegal drugs and chemicals on AlphaBay, as well as over 100,000 listings for stolen and fraudulent identification documents and access devices, counterfeit goods, malware and other com-puter hacking tools, firearms and fraudulent services. AlphaBay reached over 200,000 users and 40,000 vendors during its existence.76 The site’s daily sales in early 2017 amounted to more than 600,000 euros, up from some 200,000 euros per day a year earlier and about twice as much as the record sales figure of Silk Road at its peak in summer 2013, a few months before the site was shut down by author-ities.77 The authorities also succeeded in taking down the trading platform Hansa, the then “third largest criminal marketplace on the dark web, trad-ing similarly high volumes in illicit drugs and other commodities”.78
In the past, the take-down of major trading plat-forms did not have a major impact on drug trafficking via the darknet over a prolonged period
74 Europol, “Massive blow to criminal dark web activities after globally coordinated operation”, Press release, 20 July 2017.
75 Kristy Kruithof and others, “Internet facilitated drugs trade: an analysis of the size, scope and the role of the Netherlands”, Research Report Series, document No. RR-1607-WODC (Santa Monica, California, Rand Corpora-tion, 2016). Available at www.rand.org/.
76 Europol, “Massive blow to criminal dark web activities…”.77 EMCDDA and Europol, Drugs and the Darknet, p. 42.78 Europol, “Massive blow to criminal dark web activities…”.
Evolution in 2014, AlphaBay, Nucleus and Dream Market in 2015–2016, and predominantly AlphaBay in 2017. Since the dismantlement of AlphaBay in July 2017, the main platforms have been Dream Market and emerging markets such as Valhalla, Silk Road 3.1, Darknet Heroes League, Apple Market, House of Lions Market, TradeRoute, Wall Street Market, RSClub Market, Zion Market, Infinite Market, CGMC and OW Market.72
EMCDDA and Europol also analysed the reasons for the closure of 89 marketplaces operating glob-ally over the period extending from 2010 to the end of July 2017. They found that “exit scams”, in which operators suddenly closed down their sites and pock-eted all money held in escrow accounts which had been used to facilitate transactions, were the most common reason for closure (35 per cent), followed by “voluntary exits” (27 per cent), closures prompted by law enforcement action (17 per cent) and hack-ing by third parties (12 per cent).73
Even though law enforcement agencies were not responsible for the bulk of closures of trading plat-forms, in terms of the number of sites operating on the darknet over the period 2011–2017, authorities had one of their biggest successes in July 2017 with the take-down of the then largest drug trading plat-form, AlphaBay, as part of Operation Bayonet, jointly conducted by the United States, Canada, Thailand, The Netherlands, Europol and various
72 Ibid. 73 Ibid.
Fig. 18 Importance of drugs and drug-related chemicals for the darknet (based on listings on the main darknet markets)
Source: EMCDDA and Europol, Drugs and the darknet, November 2017, p. 15.
Note: Based on active listings data from AlphaBay, Dream Market, Hansa, TradeRoute and Valhalla darknet marketplaces, spanning from the launch of each marketplace to 21 August 2017 (or market closure).
38%62%
5%18%
77%
Pharmaceuticals Drug-relatedchemicals
Illicit drugs
OtherFraud and counterfeit: 44%Guides and tutorials: 30%Other: 19%Hacking and malware: 5%Firearms and explosives: 2%

36
WO
RLD
DRU
G R
EPO
RT 2
018
conceded, however, that this was probably a lower-bound estimate and that the true percentage of bitcoin laundering may be higher.82
The overall importance of drug trafficking via the darknet remains very limited
EMCDDA and Europol estimated drug sales made on 16 major darknet markets over the period from 22 November 2011 to 16 February 2015 to have amounted to 172.4 million euros worldwide (79 million euros generated in European Union coun-tries and 93.3 million euros in other countries),83 equivalent to some $222 million, or an average of $44 million per year. The largest revenues in Europe were generated by the sale of ATS (amphetamine and “ecstasy”), followed by sales of cannabis and cocaine, with the drug vendors accounting for the largest revenues being those in Germany (more than 25 million euros), the United Kingdom (20 million euros) and the Netherlands (18 million euros).84
A subsequent analysis of drug trafficking via AlphaBay85 revealed that the former site actually generated far larger drug sales over the period 2015–2017 than over the previous four-year period. Sales in the period 2015–2017 were estimated to be 163 million euros, consisting of 46.4 million euros in European Union countries and 116.6 million euros in the rest of the world, in the period from January 2015 to July 2017 (equivalent to 65 million euros or $73 million per year on average). It is unclear, however, if the increase in the volume of transac-tions via AlphaBay over the period 2015–2017 was the result of a sharp increase in overall drug trade on the darknet or an increase in the popularity of the site at the expense of other sites.
Another study, conducted by RAND Europe in 2016, estimated that monthly drug-related revenues
82 Yaya J. Fanusie and Tom Robinson, “Bitcoin laundering: an analysis of illicit flows into digital currency services”, 12 January 2018. Available at www.defenddemocracy.org/.
83 EMCDDA and Europol, Drugs and the Darknet, p. 35.84 EMCDDA and Europol, Drugs and the Darknet, p. 47.85 Based on the application of DATACRYPTO, a web crawler,
RAND Europe identified 37,896 listings on AlphaBay on 22 December 2014; the total number of listings identified on 19 cryptomarkets (mostly investigated a few months later, in 2015) reached a total of 133,061 listings; see web article “Internet-facilitated drugs trade”, available at www.rand.org.
of time. EMCDDA and Europol suggest that “law enforcement interventions in the form of darknet market take-downs disrupt darknet markets, although the overall ecosystem appears to be fairly resilient with new markets quickly becoming established”.79 Examples have shown that both ven-dors and customers simply migrate to the next largest trading platform and continue their opera-tions.80 The listings of major darknet drug markets, analysed by Europol, revealed an immediate decline in overall darknet activities following the shutdown of major darknet drug markets, and thus an increase in prices on the surviving marketplaces in the imme-diate aftermath of the takedown. However, prices soon returned to their pre-takedown levels as ven-dors and customers migrated to alternative darknet markets.81
Monitoring the volume of darknet transactions will show whether the take-down of the AlphaBay and Hansa platforms in July 2017 have a long-term impact. Indeed, before taking down the Hansa site, the police continued operating the site for a couple of days to gain insights into its operations and to obtain additional data on clients and vendors.
The value of the bitcoin is not affected by shutdowns of darknet markets. Speculative investment in the bitcoin market has been of far greater importance to the value of the bitcoin than have darknet market take-downs. Bitcoins remain the principal means of exchange in darknet market transactions, but the volume of bitcoins used for illicit drug transactions still appears to account for a limited portion of all bitcoins transactions. One recent study of bitcoin laundering, using a new forensic analysis tool that combines public blockchain data with a proprietary data set of bitcoin addresses, suggested that “illicit bitcoins”, which were mostly linked to transactions on darknet markets (mainly to Silk Road in 2013, Agora in 2014 and 2015, and AlphaBay in 2016) accounted for just 0.6 per cent of all incoming trans-actions exchanged into different national currencies over the period 2013–2016. The study’s authors
79 EMCDDA and Europol, Drugs and the Darknet, p. 11.80 Based on the findings of an international conference on
joint investigations to combat drug trafficking via the vir-tual market (darknet) in the European Union, held in Bad Erlach, Austria, from 18 to 20 November 2015.
81 EMCDDA and Europol, Drugs and the darknet, p. 62.

37
GLOBAL OVERVIEW OF DRUG DEMAND AND SUPPLY C. Extent of drug supply 2
further 3 per cent of revenues were generated in other countries. Analysis of the number of vendors found by email addresses next to drug listings on various darknet market sites (available from a fifth of all vendors) also identified a number of vendors in Asia, most notably in China (9 per cent of all such identified email listings) and India (3 per cent), as well as Afghanistan (1 per cent).91
Studies suggest marked growth in drug-related darknet activities in recent years
Information provided by law enforcement92 and research on drug supply and demand suggest that drug-related activities on the darknet have increased in recent years.93 The RAND Europe study found that monthly transactions rose 2.6-fold over the period from October 2013 to January 2017,94 and the EMCCDA darknet study showed that monthly darknet sales via AlphaBay tripled between early 2016 and early 2017.95 To date, no information is available on the evolution of darknet sales subse-quent to the dismantling of AlphaBay and Hansa in July 2017.
The Global Drug Survey, based on a non-represent-ative convenience sample (which cannot be extrapolated to drug users outside the survey) of around 100,000 self-selected people in over 50 countries (more developed countries than develop-ing countries) who responded to an online survey, found that the proportion of Internet users using drugs who purchased their drugs via the darknet rose from 4.7 per cent in 2014 to 9.3 per cent in January 2018, with increases reported in practically all countries. The highest proportions of Internet users using drugs reporting the purchase of drugs via the darknet in 2018 were found in North Amer-ica, Oceania and Europe.
One survey question regarding the consequences of the shutdown of AlphbaBay and Hansa revealed that 15 per cent of Internet users who use the dark-net for purchasing drugs had used darknet markets
91 Rand Europe, “Internet-facilitated drugs trade”. 92 Europol, SOCTA 2017: European Union and Organised
Crime Threat Assessment – Crime in the Age of Technology (The Hague, 2017), p. 11.
93 EMCDDA and Europol, Drugs and the Darknet, p. 10.94 RAND Europe, “Internet-facilitated drugs trade”. 95 EMCDDA and Europol, Drugs and the Darknet, p. 43.
generated by the then eight largest darknet markets86 amounted to a total of $14 million to $25 million per month in early 2016 (equivalent to $170 mil-lion to $300 million per year). A much higher figure than the EMCDDA/Europol estimate for the period 2011–2015 ($44 million per year), this could sug-gest a marked expansion in darknet market activities in recent years. Nevertheless, according to the esti-mates provided in the RAND Europe study, the global darknet drug market accounts for no more than 0.1–0.2 per cent of the combined annual drug retail markets of the United States87 and the Euro-pean Union.88 Caution needs to be applied, however, as the methodology used in the RAND Europe study assumed that all buyers purchased only the amounts specifically mentioned in offers on the darknet, which may underestimate overall quantities pur-chased per transaction and, thus, underestimate the overall estimated revenue.
The RAND Europe study also estimated that the largest drug-related revenues on the darknet in 2016 were generated by vendors operating in North Amer-ica (43 per cent of global revenues), most notably those operating out of the United States (36 per cent of global revenues) and, to a lesser extent, Canada (7 per cent). This was followed by vendors operating out of Europe (more than 35 per cent of global revenues), most notably those operating out of the United Kingdom (16 per cent of global rev-enues), Germany (8 per cent) and the Netherlands (8 per cent).89 Those three countries were also iden-tified by the EMCDDA/Europol study as the European countries most affected by darknet traf-ficking.90 Other main vendors were found in Australia (11 per cent of global revenues), while a
86 These markets were, in January–February 2016, AlphaBay, Nucleus, Dreammarket, Cryptomarket, Hansa, Python, French Dark Net, Dark Net Heroes League, then account-ing for some 80 per cent of all listings.
87 The United States drug market was estimated by the Office of National Drug Control Policy at around $109 billion in 2010 (range: $69–$171 billion) (Beau Kilmer and others, What America’s Users Spend on Illegal Drugs: 2000–2010, Research Report Series, document No. RR-534-ONDCP (Santa Monica, California, Rand Corporation, 2014)).
88 EMCDDA estimated the European retail value of the illicit drug market was around 24.3 billion euros (range: 21 bil-lion–31 billion euros) in 2013, equivalent to some $32 bil-lion per year.
89 Rand Europe, “Internet-facilitated drugs trade”. 90 EMCDDA and Europol, Drugs and the Darknet, p. 47.

38
WO
RLD
DRU
G R
EPO
RT 2
018
less frequently thereafter while 9 per cent had com-pletely stopped using the darknet for drug purchases while 19 per cent applied operational security changes to increase their security when using the darknet markets. Most (57 per cent), however, did not consider themselves affected by the closure of the darknet markets.
Fig. 19 Proportion of Internet users reporting to an online survey who used drugs in the past year and who purchased drugs via the darknet, 2014 and 2018 (annual prevalence)
Source: Global Drug Survey. Available at https://www.globaldrugsurvey.com/wp-content/themes/globaldrugsurvey/results/GDS2017_key-findings-report_final.pdf.
Note: The proportions shown here are based on convenience samples of people who volunteered to participate in these surveys. The total number of persons answering darknet market-related questions was 53,5572 in 2018, all of whom also reported their past-year drug use.a For the following countries no data for 2014 or 2018 were available, so data from the closest year were used instead: Finland (2016 and 2018); Norway (2016 and 2017); Wales (2017); Scotland (2015 and 2018); Croatia (2017); Greece (2017); Poland (2015 and 2018); Italy (2015 and 2018); Portugal (2014 and 2017); Iceland (2017); Argentina (2017); Mexico (2014 and 2017).
17.2
4.1
14.9
12.2
6.6 9.
3
0
5
10
15
20
25
30
35
40
45
50
Finl
and/
aN
orw
ay/a
Swed
enW
ales
/aEn
glan
dSc
otla
nd/a
Irel
and
Fran
ceCr
oati
a/a
Czec
hia
Belg
ium
Ger
man
yPo
land
/aA
ustr
iaSp
ain
Net
herla
nds
Ital
y/a
Den
mar
kSw
itzer
land
Gre
ece
Port
ugal
/aH
unga
rySl
ovak
iaIc
elan
d/a
Isra
elU
SACa
nada
Arg
enti
na/a
Colo
mbi
aM
exic
o/a
Braz
ilA
ustr
alia
New
Zea
land
Nor
th A
mer
ica
Latin
Am
eric
aO
cean
iaEu
rope
Asi
aG
loba
l
Europe Asia Americas Oceania Averages
Prop
orti
on (
perc
enta
ge)
Europe 2018Europe 2014Americas 2018Americas 2014Oceania 2018Oceania 2014Asia 2018Asia 2014Global 2018Global 2014
4.75.9
7.6 7.9 9.3
0
2
4
6
8
10
2014
2015
2016
2017
2018
Prop
orti
on (p
erce
ntag
e)
Global
Europe Asia Americas Oceania Averages
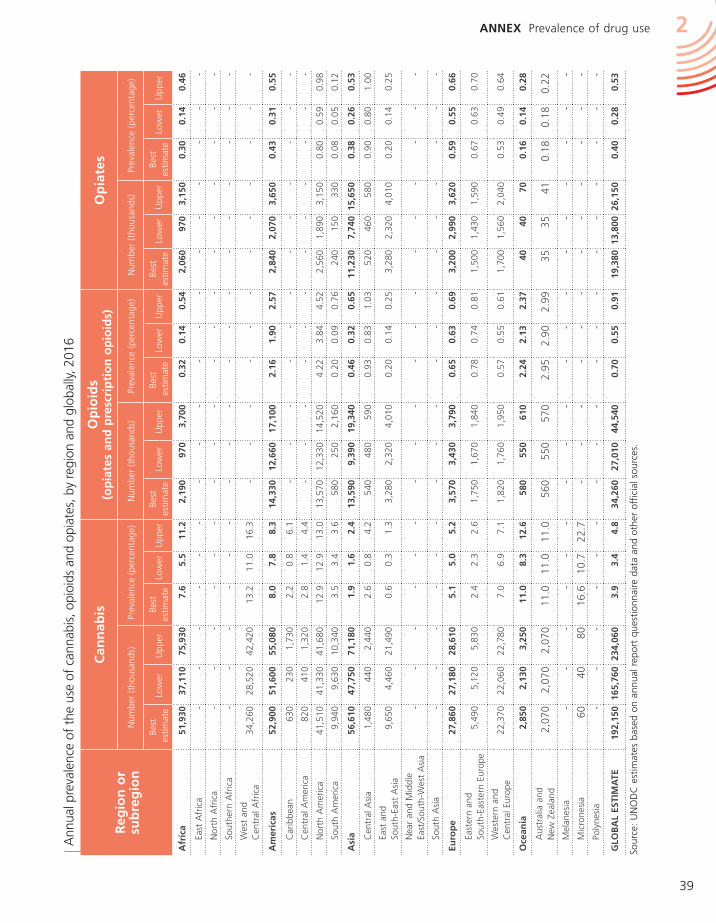
39
ANNEX Prevalence of drug use 2
Ann
ual p
reva
lenc
e of
the
use
of
cann
abis
, opi
oids
and
opi
ates
, by
regi
on a
nd g
loba
lly, 2
016
Sour
ce:
UN
OD
C e
stim
ates
bas
ed o
n an
nual
rep
ort
ques
tionn
aire
dat
a an
d ot
her
offic
ial s
ourc
es.
Reg
ion
or
su
bre
gio
n
Can
nab
isO
pio
ids
(op
iate
s an
d p
resc
rip
tio
n o
pio
ids)
Op
iate
s
Num
ber
(tho
usan
ds)
Prev
alen
ce (
perc
enta
ge)
Num
ber
(tho
usan
ds)
Prev
alen
ce (
perc
enta
ge)
Num
ber
(tho
usan
ds)
Prev
alen
ce (
perc
enta
ge)
Best
e
stim
ate
Low
erU
pper
Best
es
timat
eLo
wer
Upp
erBe
st
estim
ate
Low
erU
pper
Best
e
stim
ate
Low
erU
pper
Best
es
timat
eLo
wer
Upp
erBe
st
estim
ate
Low
erU
pper
Afr
ica
51,9
3037
,110
75,9
307.
65.
511
.22,
190
970
3,70
00.
320.
140.
542,
060
970
3,15
00.
300.
140.
46
East
Afr
ica
--
--
--
--
--
--
--
--
--
Nor
th A
fric
a-
--
--
--
--
--
--
--
--
-
Sout
hern
Afr
ica
--
--
--
--
--
--
--
--
--
Wes
t an
d C
entr
al A
fric
a34
,260
28,5
2042
,420
13.2
11.0
16.3
--
--
--
--
--
--
Am
eric
as52
,900
51,6
0055
,080
8.0
7.8
8.3
14,3
3012
,660
17,1
002.
161.
902.
572,
840
2,07
03,
650
0.43
0.31
0.55
Car
ibbe
an63
023
01,
730
2.2
0.8
6.1
--
--
--
--
--
--
Cen
tral
Am
eric
a82
041
01,
320
2.8
1.4
4.4
--
--
--
--
--
--
Nor
th A
mer
ica
41,5
1041
,330
41,6
8012
.912
.913
.013
,570
12,3
3014
,520
4.22
3.84
4.52
2,56
01,
890
3,15
00.
800.
590.
98
Sout
h A
mer
ica
9,94
09,
630
10,3
403.
53.
43.
658
025
02,
160
0.20
0.09
0.76
240
150
330
0.08
0.05
0.12
Asi
a56
,610
47,7
5071
,180
1.9
1.6
2.4
13,5
909,
390
19,3
400.
460.
320.
6511
,230
7,74
015
,650
0.38
0.26
0.53
Cen
tral
Asi
a1,
480
440
2,44
02.
60.
84.
254
048
059
00.
930.
831.
0352
046
058
00.
900.
801.
00
East
and
Sout
h-Ea
st A
sia
9,65
04,
460
21,4
900.
60.
31.
33,
280
2,32
04,
010
0.20
0.14
0.25
3,28
02,
320
4,01
00.
200.
140.
25
Nea
r an
d M
iddl
e Ea
st/S
outh
-Wes
t A
sia
--
--
--
--
--
--
--
--
--
Sout
h A
sia
--
--
--
--
--
--
--
--
--
Euro
pe
27,8
6027
,180
28,6
105.
15.
05.
23,
570
3,43
03,
790
0.65
0.63
0.69
3,20
02,
990
3,62
00.
590.
550.
66
East
ern
and
So
uth-
East
ern
Euro
pe5,
490
5,12
05,
830
2.4
2.3
2.6
1,75
01,
670
1,84
00.
780.
740.
811,
500
1,43
01,
590
0.67
0.63
0.70
Wes
tern
and
C
entr
al E
urop
e22
,370
22,0
6022
,780
7.0
6.9
7.1
1,82
01,
760
1,95
00.
570.
550.
611,
700
1,56
02,
040
0.53
0.49
0.64
Oce
ania
2,85
02,
130
3,25
011
.08.
312
.658
055
061
02.
242.
132.
3740
4070
0.16
0.14
0.28
Aus
tral
ia a
nd
New
Zea
land
2,07
02,
070
2,07
011
.011
.011
.056
055
057
02.
952.
902.
9935
3541
0.18
0.18
0.22
Mel
anes
ia-
--
--
--
--
--
--
--
--
-M
icro
nesi
a60
4080
16.6
10.7
22.7
--
--
--
--
--
--
Poly
nesi
a-
--
--
--
--
--
--
--
--
-
GLO
BA
L ES
TIM
ATE
192,
150
165,
760
234,
060
3.9
3.4
4.8
34,2
6027
,010
44,5
400.
700.
550.
9119
,380
13,8
0026
,150
0.40
0.28
0.53
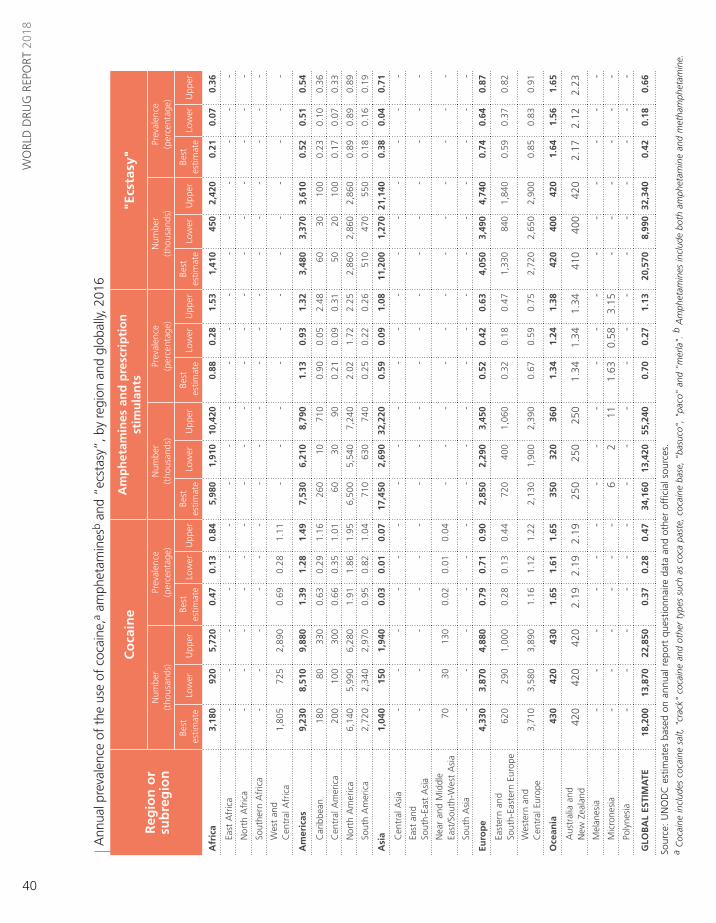
40
WO
RLD
DRU
G R
EPO
RT 2
018
Ann
ual p
reva
lenc
e of
the
use
of
coca
ine,
a am
phet
amin
esb
and
“ecs
tasy
”, b
y re
gion
and
glo
bally
, 201
6
Sour
ce:
UN
OD
C e
stim
ates
bas
ed o
n an
nual
rep
ort
ques
tionn
aire
dat
a an
d ot
her
offic
ial s
ourc
es.
a C
ocai
ne in
clud
es c
ocai
ne s
alt,
"cr
ack"
coc
aine
and
oth
er t
ypes
suc
h as
coc
a pa
ste,
coc
aine
bas
e, "
basu
co",
"pa
co"
and
"mer
la".
b A
mph
etam
ines
incl
ude
both
am
phet
amin
e an
d m
etha
mph
etam
ine.
Reg
ion
or
su
bre
gio
n
Co
cain
eA
mp
het
amin
es a
nd
pre
scri
pti
on
st
imu
lan
ts"E
csta
sy"
Num
ber
(t
hous
ands
)Pr
eval
ence
(p
erce
ntag
e)N
umbe
r
(tho
usan
ds)
Prev
alen
ce
(per
cent
age)
Num
ber
(t
hous
ands
)Pr
eval
ence
(p
erce
ntag
e)
Best
e
stim
ate
Low
erU
pper
Best
es
timat
eLo
wer
Upp
erBe
st
estim
ate
Low
erU
pper
Best
e
stim
ate
Low
erU
pper
Best
es
timat
eLo
wer
Upp
erBe
st
estim
ate
Low
erU
pper
Afr
ica
3,18
092
05,
720
0.47
0.13
0.84
5,98
01,
910
10,4
200.
880.
281.
531,
410
450
2,42
00.
210.
070.
36
East
Afr
ica
--
--
--
--
--
--
--
--
--
Nor
th A
fric
a-
--
--
--
--
--
--
--
--
-
Sout
hern
Afr
ica
--
--
--
--
--
--
--
--
--
Wes
t an
d C
entr
al A
fric
a1,
805
725
2,89
00.
690.
281.
11-
--
--
--
--
--
-
Am
eric
as9,
230
8,51
09,
880
1.39
1.28
1.49
7,53
06,
210
8,79
01.
130.
931.
323,
480
3,37
03,
610
0.52
0.51
0.54
Car
ibbe
an18
080
330
0.63
0.29
1.16
260
1071
00.
900.
052.
4860
3010
00.
230.
100.
36
Cen
tral
Am
eric
a20
010
030
00.
660.
351.
0160
3090
0.21
0.09
0.31
5020
100
0.17
0.07
0.33
Nor
th A
mer
ica
6,14
05,
990
6,28
01.
911.
861.
956,
500
5,54
07,
240
2.02
1.72
2.25
2,86
02,
860
2,86
00.
890.
890.
89
Sout
h A
mer
ica
2,72
02,
340
2,97
00.
950.
821.
0471
063
074
00.
250.
220.
2651
047
055
00.
180.
160.
19
Asi
a1,
040
150
1,94
00.
030.
010.
0717
,450
2,69
032
,220
0.59
0.09
1.08
11,2
001,
270
21,1
400.
380.
040.
71
Cen
tral
Asi
a-
--
--
--
--
--
--
--
--
-
East
and
Sout
h-Ea
st A
sia
--
--
--
--
--
--
--
--
--
Nea
r an
d M
iddl
e Ea
st/S
outh
-Wes
t A
sia
7030
130
0.02
0.01
0.04
--
--
--
--
--
--
Sout
h A
sia
--
--
--
--
--
--
--
--
--
Euro
pe
4,33
03,
870
4,88
00.
790.
710.
902,
850
2,29
03,
450
0.52
0.42
0.63
4,05
03,
490
4,74
00.
740.
640.
87
East
ern
and
So
uth-
East
ern
Euro
pe62
029
01,
000
0.28
0.13
0.44
720
400
1,06
00.
320.
180.
471,
330
840
1,84
00.
590.
370.
82
Wes
tern
and
C
entr
al E
urop
e3,
710
3,58
03,
890
1.16
1.12
1.22
2,13
01,
900
2,39
00.
670.
590.
752,
720
2,65
02,
900
0.85
0.83
0.91
Oce
ania
430
420
430
1.65
1.61
1.65
350
320
360
1.34
1.24
1.38
420
400
420
1.64
1.56
1.65
Aus
tral
ia a
nd
New
Zea
land
420
420
420
2.19
2.19
2.19
250
250
250
1.34
1.34
1.34
410
400
420
2.17
2.12
2.23
Mel
anes
ia-
--
--
--
--
--
--
--
--
-M
icro
nesi
a-
--
--
-6
211
1.63
0.58
3.15
--
--
--
Poly
nesi
a-
--
--
--
--
--
--
--
--
-
GLO
BA
L ES
TIM
ATE
18,2
0013
,870
22,8
500.
370.
280.
4734
,160
13,4
2055
,240
0.70
0.27
1.13
20,5
708,
990
32,3
400.
420.
180.
66

41
2ANNEX People who inject drugs and HIV
Estim
ated
num
ber
and
prev
alen
ce (p
erce
ntag
e) o
f pe
ople
who
inje
ct d
rugs
and
tho
se li
ving
with
HIV
am
ong
this
gro
up, b
y re
gion
, 201
6
Sour
ce:
Resp
onse
s to
the
ann
ual r
epor
t qu
estio
nnai
re;
prog
ress
rep
orts
of
the
Join
t U
nite
d N
atio
ns P
rogr
amm
e on
HIV
/AID
S (U
NA
IDS)
on
the
glob
al A
IDS
resp
onse
(va
rious
yea
rs);
the
form
er R
efer
ence
Gro
up t
o th
e U
nite
d N
atio
ns o
n H
IV a
nd In
ject
ing
Dru
g U
se;
publ
ishe
d pe
er-r
evie
wed
art
icle
s; a
nd g
over
nmen
t re
port
s.N
ote:
Pre
vale
nce
of p
eopl
e w
ho in
ject
dru
gs is
the
per
cent
age
of t
he p
opul
atio
n ag
ed 1
5–64
yea
rs.
Reg
ion
or
sub
reg
ion
Peo
ple
wh
o i
nje
ct d
rug
sH
IV a
mo
ng
peo
ple
wh
o i
nje
ct d
rug
s
Estim
ated
num
ber
Prev
alen
ce (
%)
Dat
aco
vera
ge o
f po
pula
tion
aged
15–
64
year
s
Estim
ated
num
ber
Prev
alen
ce
(%)
Best
es
timat
e
Dat
a co
vera
ge
of e
stim
ated
nu
mbe
r of
pe
ople
who
in
ject
dru
gsLo
wBe
stH
igh
Low
Best
Hig
hLo
wBe
stH
igh
Afr
ica
390,
000
730,
000
2,31
0,00
00.
060.
110.
3457
.6%
36,0
0082
,000
564,
000
11.2
75.5
%
Am
eric
a1,
860,
000
2,40
0,00
03,
300,
000
0.28
0.36
0.50
85.2
%75
,000
111,
000
211,
000
4.6
93.1
%
N
orth
Am
eric
a1,
550,
000
1,78
0,00
02,
010,
000
0.48
0.55
0.63
100%
62,0
0071
,000
81,0
004.
010
0%
La
tin A
mer
ica
and
th
e C
arib
bean
310,
000
610,
000
1,29
0,00
00.
090.
180.
3771
.3%
14,0
0039
,000
129,
000
6.4
73.2
%
Asi
a3,
470,
000
4,84
0,00
06,
300,
000
0.12
0.16
0.21
94.3
%38
8,00
058
1,00
086
1,00
012
.095
.3%
C
entr
al A
sia
and
Tran
scau
casi
a40
0,00
044
0,00
050
0,00
00.
690.
760.
8793
.6%
28,0
0033
,000
42,0
007.
593
.6%
Ea
st a
nd S
outh
-Eas
t A
sia
2,21
0,00
03,
200,
000
4,19
0,00
00.
140.
200.
2695
.1%
174,
000
306,
000
510,
000
9.6
96.4
%
So
uth-
Wes
t A
sia
560,
000
740,
000
930,
000
0.29
0.38
0.48
100%
160,
000
212,
000
267,
000
28.8
100%
N
ear
and
Mid
dle
East
50,0
0019
0,00
038
0,00
00.
040.
180.
3617
.2%
400
800
7,30
00.
455
.8%
So
uth
Asi
a27
0,00
028
0,00
030
0,00
00.
030.
030.
0399
.9%
25,0
0029
,000
34,0
0010
.399
.9%
Euro
pe
2,44
0,00
02,
520,
000
2,66
0,00
00.
450.
470.
4999
.9%
468,
000
483,
000
503,
000
19.1
100%
Ea
ster
n an
d
So
uth-
East
ern
Euro
pe1,
780,
000
1,82
0,00
01,
880,
000
0.80
0.82
0.85
100%
402,
000
409,
000
416,
000
22.4
100%
W
este
rn a
nd
C
entr
al E
urop
e65
0,00
070
0,00
078
0,00
00.
200.
220.
2499
.9%
65,0
0074
,000
87,0
0010
.699
.9%
Oce
ania
140,
000
140,
000
150,
000
0.52
0.53
0.56
73.3
%1,
300
1,60
01,
700
1.2
73.3
%
Glo
bal
8,30
0,00
010
,630
,000
14,7
10,0
000.
170.
220.
3088
.4%
970,
000
1,26
0,00
02,
140,
000
11.8
94.3
%
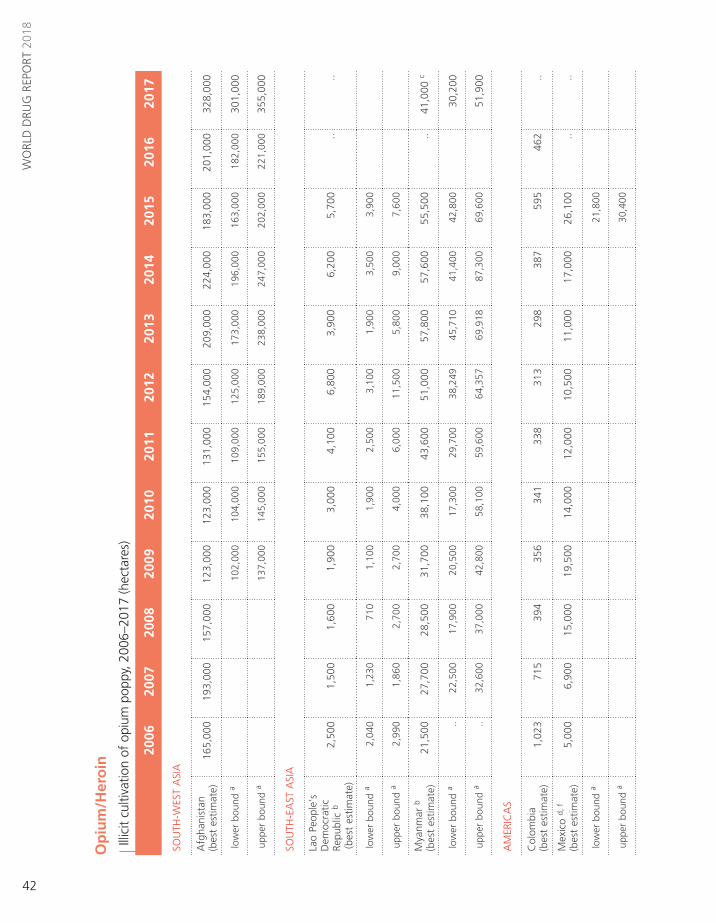
42
WO
RLD
DRU
G R
EPO
RT 2
018
Op
ium
/Her
oin
Illic
it cu
ltiva
tion
of o
pium
pop
py, 2
006–
2017
(hec
tare
s)
2006
2007
2008
2009
2010
2011
2012
2013
2014
2015
2016
2017
SOU
TH-W
EST
ASI
A
Afg
hani
stan
(b
est
estim
ate)
165,
000
193,
000
157,
000
123,
000
123,
000
131,
000
154,
000
209,
000
224,
000
183,
000
201,
000
328,
000
low
er b
ound
a 10
2,00
010
4,00
010
9,00
012
5,00
017
3,00
019
6,00
016
3,00
018
2,00
030
1,00
0
upp
er b
ound
a 13
7,00
014
5,00
015
5,00
018
9,00
023
8,00
024
7,00
020
2,00
022
1,00
035
5,00
0
SOU
TH-E
AST
ASI
A
Lao
Peop
le's
D
emoc
ratic
Re
publ
ic b
(bes
t es
timat
e)
2,50
01,
500
1,60
01,
900
3,00
04,
100
6,80
03,
900
6,20
05,
700
....
low
er b
ound
a 2,
040
1,23
071
01,
100
1,90
02,
500
3,10
01,
900
3,50
03,
900
upp
er b
ound
a 2,
990
1,86
02,
700
2,70
04,
000
6,00
011
,500
5,80
09,
000
7,60
0
Mya
nmar
b
(bes
t es
timat
e)21
,500
27,7
0028
,500
31,7
0038
,100
43,6
0051
,000
57,8
0057
,600
55,5
00..
41,0
00 c
low
er b
ound
a ..
22,5
0017
,900
20,5
0017
,300
29,7
0038
,249
45,7
1041
,400
42,8
00 3
0,20
0
upp
er b
ound
a ..
32,6
0037
,000
42,8
0058
,100
59,6
0064
,357
69,9
1887
,300
69,6
00 5
1,90
0
AM
ERIC
AS
Col
ombi
a
(bes
t es
timat
e)1,
023
715
394
356
341
338
313
298
387
595
462
..
Mex
ico
d, f
(bes
t es
timat
e)5,
000
6,90
015
,000
19,5
0014
,000
12,0
0010
,500
11,0
0017
,000
26,1
00..
..
low
er b
ound
a 21
,800
upp
er b
ound
a 30
,400

43
ANNEX Opium/Heroin 2
2006
2007
2008
2009
2010
2011
2012
2013
2014
2015
2016
2017
OTH
ER
Oth
er
coun
trie
s e
5,97
75,
885
10,5
099,
479
12,2
2116
,462
12,2
8213
,293
11,5
2210
,597
103,
839
49,0
00
TOTA
L (b
est
esti
mat
e)20
1,00
023
5,70
021
3,00
318
5,93
519
0,66
220
7,50
023
4,89
529
5,29
131
6,70
928
1,49
230
5,30
141
8,00
0
low
er b
ound
15
2,93
514
9,76
217
0,00
018
9,44
424
5,20
126
9,80
924
2,69
226
5,61
739
7,21
7 f
upp
er b
ound
21
1,83
523
3,66
224
9,40
028
7,95
233
8,30
937
2,20
932
0,79
234
6,01
749
7,71
7 f
TOTA
L (b
est
esti
mat
e ro
un
ded
)20
1,00
023
5,70
021
3,00
018
5,90
019
0,70
020
7,50
023
4,90
029
5,30
031
6,70
028
1,50
030
5,30
041
8,00
0 f
Sour
ce:
Afg
hani
stan
, La
o Pe
ople
's D
emoc
ratic
Rep
ublic
and
Mya
nmar
: na
tiona
l illi
cit
crop
mon
itorin
g sy
stem
sup
port
ed b
y th
e U
nite
d N
atio
ns O
ffic
e on
Dru
gs a
nd C
rime
(UN
OD
C).
Col
ombi
a: G
over
nmen
t of
Col
ombi
a.
Mex
ico:
up
to 2
014,
est
imat
es d
eriv
ed f
rom
sur
veys
by
the
Gov
ernm
ent
of t
he U
nite
d St
ates
of
Am
eric
a (in
tern
atio
nal n
arco
tics
cont
rol s
trat
-eg
y re
port
s);
for
2015
, jo
int
Mex
ico/
UN
OD
C p
roje
ct e
ntitl
ed "
Mon
itorin
g of
the
illic
it cu
ltiva
tion
on M
exic
an t
errit
ory"
.
Not
e: F
igur
es in
ital
ics
are
prel
imin
ary
and
may
be
revi
sed
whe
n up
date
d in
form
atio
n be
com
es a
vaila
ble.
Tw
o do
ts in
dica
te t
hat
data
wer
e un
avai
labl
e. In
form
atio
n on
est
imat
ion
met
hodo
logi
es
and
defin
ition
s ca
n be
fou
nd in
the
onl
ine
met
hodo
logy
sec
tion
of t
he W
orld
Dru
g Re
port
201
8.
a B
ound
of
the
stat
istic
ally
der
ived
con
fiden
ce in
terv
al.
b M
ay in
clud
e ar
eas
that
wer
e er
adic
ated
aft
er t
he d
ate
of t
he a
rea
surv
ey.
c E
stim
ate
for
2017
onl
y co
vers
the
Sta
tes
of S
han
and
Kac
hin.
d U
p to
201
4, t
he e
stim
ates
for
Mex
ico
are
sour
ced
from
the
Dep
artm
ent
of S
tate
of
the
Uni
ted
Stat
es.
The
Gov
ernm
ent
of M
exic
o do
es n
ot v
alid
ate
the
estim
ates
pro
vide
d by
the
Uni
ted
Stat
es
as t
hey
are
not
part
of
its o
ffic
ial f
igur
es a
nd it
doe
s no
t ha
ve in
form
atio
n on
the
met
hodo
logy
use
d to
cal
cula
te t
hem
. Es
timat
es o
f op
ium
pop
py c
ultiv
atio
n fo
r th
e ye
ars
2016
and
201
7,
base
d on
the
Mex
ico/
UN
OD
C jo
int
proj
ect
entit
led
"Mon
itorin
g of
the
Illic
it C
ultiv
atio
n on
Mex
ican
Ter
ritor
y",w
ill s
oon
beco
me
avai
labl
e.e
Incl
udes
cou
ntrie
s w
ith lo
w le
vels
of
culti
vatio
n (le
ss t
han
400
hect
ares
in t
he la
test
yea
r w
ith a
vaila
ble
data
) an
d co
untr
ies
with
indi
rect
evi
denc
e of
illic
it cu
ltiva
tion
(era
dica
tion
of o
pium
pop
py)
but
no d
irect
mea
sure
men
t. S
ee t
able
"C
ultiv
atio
n of
opi
um p
oppy
and
pro
duct
ion
of o
pium
in o
ther
cou
ntrie
s, a
nd e
radi
catio
n of
opi
um p
oppy
, 20
07-2
017"
. In
add
ition
, fo
r 20
16 a
nd 2
017,
be
st e
stim
ates
for
cou
ntrie
s fo
r w
hich
dat
a ar
e no
t av
aila
ble
(Lao
Peo
ple'
s D
emoc
ratic
Rep
ublic
, M
exic
o fo
r 20
16 a
nd 2
017,
Mya
nmar
for
201
6 an
d C
olom
bia
for
2017
) ar
e in
clud
ed in
thi
s ca
t-eg
ory.
St
artin
g in
200
8, a
new
met
hodo
logy
was
intr
oduc
ed t
o es
timat
e op
ium
pop
py c
ultiv
atio
n an
d op
ium
/her
oin
prod
uctio
n in
cou
ntrie
s w
ith n
o da
ta o
n ill
icit
culti
vatio
n of
opi
um p
oppy
. A
de
taile
d de
scrip
tion
of t
he e
stim
atio
n m
etho
dolo
gy is
ava
ilabl
e in
the
onl
ine
met
hodo
logy
sec
tion
of t
he W
orld
Dru
g Re
port
201
8.f
The
fig
ures
for
201
5, a
s pu
blis
hed
in t
he W
orld
Dru
g Re
port
201
6 (U
nite
d N
atio
ns p
ublic
atio
n, S
ales
No.
E.1
6.X
I.7),
hav
e be
en r
evis
ed o
win
g to
a s
tatis
tical
adj
ustm
ent
proc
esse
d by
UN
OD
C.
Thes
e fig
ures
are
bas
ed o
n th
e es
timat
ion
perio
d Ju
ly 2
014-
June
201
5.
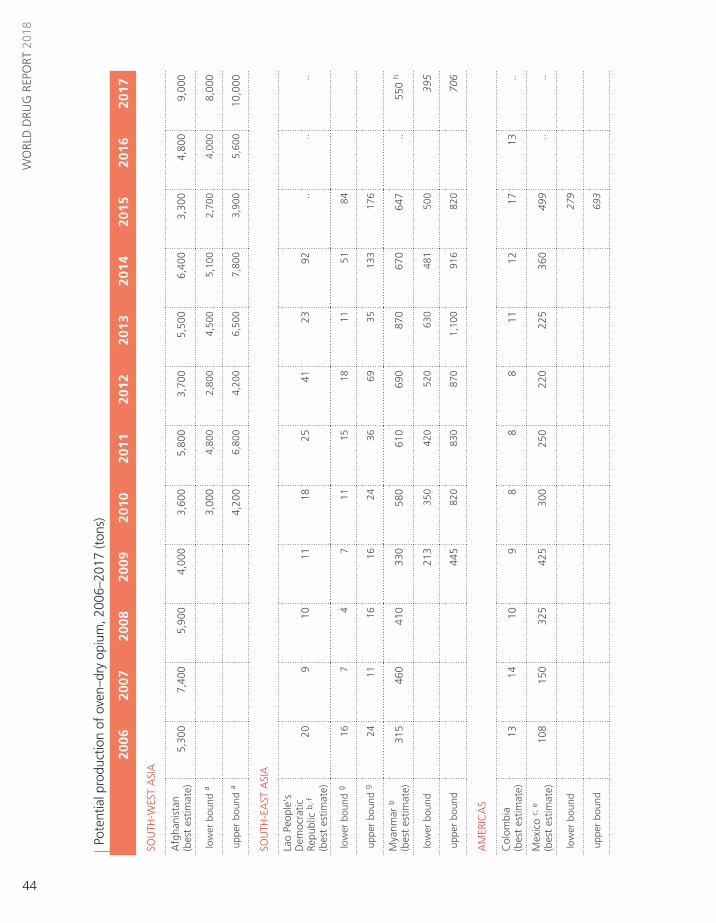
44
WO
RLD
DRU
G R
EPO
RT 2
018
Pote
ntia
l pro
duct
ion
of o
ven–
dry
opiu
m, 2
006–
2017
(ton
s)
2006
2007
2008
2009
2010
2011
2012
2013
2014
2015
2016
2017
SOU
TH-W
EST
ASI
A
Afg
hani
stan
(b
est
estim
ate)
5,30
07,
400
5,90
04,
000
3,60
05,
800
3,70
05,
500
6,40
03,
300
4,80
09,
000
low
er b
ound
a 3,
000
4,80
02,
800
4,50
05,
100
2,70
04,
000
8,00
0
upp
er b
ound
a 4,
200
6,80
04,
200
6,50
07,
800
3,90
05,
600
10,0
00
SOU
TH-E
AST
ASI
A
Lao
Peop
le's
D
emoc
ratic
Re
publ
ic b
, f
(bes
t es
timat
e)
209
1011
18 2
5 41
2392
....
..
low
er b
ound
g 16
74
711
1518
1151
84
upp
er b
ound
g 24
1116
1624
3669
3513
317
6
Mya
nmar
b
(bes
t es
timat
e)31
546
041
033
058
0 6
10
690
870
670
647
..55
0 h
low
er b
ound
2
13
350
4
20
520
6
30
481
500
395
upp
er b
ound
445
8
20
830
8
70
1,1
00
916
820
706
AM
ERIC
AS
Col
ombi
a
(bes
t es
timat
e)13
1410
98
88
1112
1713
..
Mex
ico
c, e
(bes
t es
timat
e)10
815
032
542
530
025
022
022
536
049
9..
..
low
er b
ound
27
9
upp
er b
ound
69
3
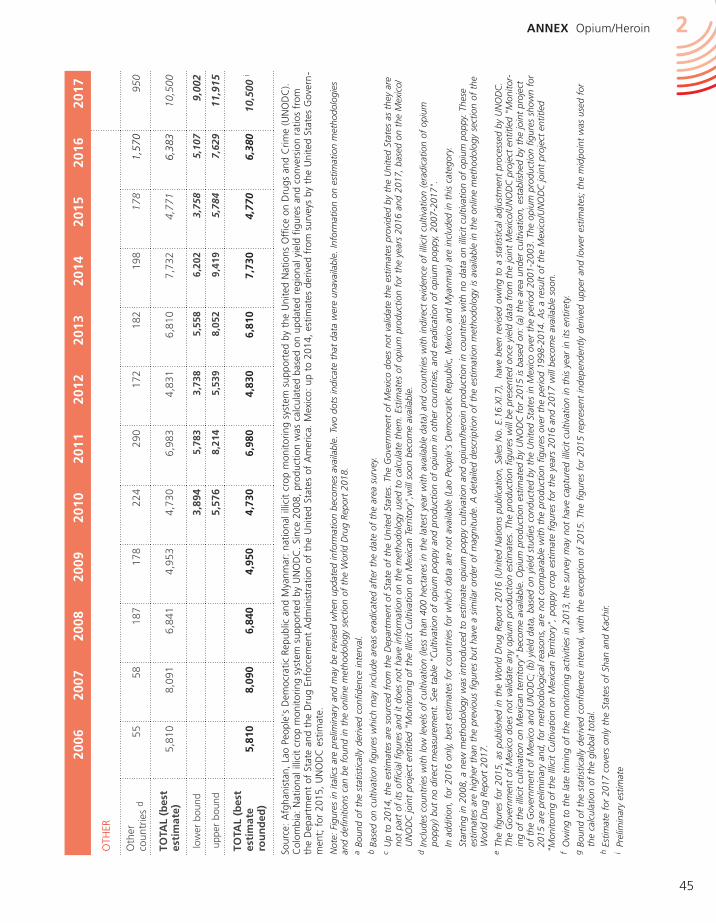
45
ANNEX Opium/Heroin 2
Sour
ce:
Afg
hani
stan
, La
o Pe
ople
's D
emoc
ratic
Rep
ublic
and
Mya
nmar
: na
tiona
l illi
cit
crop
mon
itorin
g sy
stem
sup
port
ed b
y th
e U
nite
d N
atio
ns O
ffic
e on
Dru
gs a
nd C
rime
(UN
OD
C).
Col
ombi
a: N
atio
nal i
llici
t cr
op m
onito
ring
syst
em s
uppo
rted
by
UN
OD
C.
Sinc
e 20
08,
prod
uctio
n w
as c
alcu
late
d ba
sed
on u
pdat
ed r
egio
nal y
ield
fig
ures
and
con
vers
ion
ratio
s fr
om
the
Dep
artm
ent
of S
tate
and
the
Dru
g En
forc
emen
t A
dmin
istr
atio
n of
the
Uni
ted
Stat
es o
f A
mer
ica.
Mex
ico:
up
to 2
014,
est
imat
es d
eriv
ed f
rom
sur
veys
by
the
Uni
ted
Stat
es G
over
n-
men
t; f
or 2
015,
UN
OD
C e
stim
ate.
Not
e: F
igur
es in
ital
ics
are
prel
imin
ary
and
may
be
revi
sed
whe
n up
date
d in
form
atio
n be
com
es a
vaila
ble.
Tw
o do
ts in
dica
te t
hat
data
wer
e un
avai
labl
e. In
form
atio
n on
est
imat
ion
met
hodo
logi
es
and
defin
ition
s ca
n be
fou
nd in
the
onl
ine
met
hodo
logy
sec
tion
of t
he W
orld
Dru
g Re
port
201
8.a
Bou
nd o
f th
e st
atis
tical
ly d
eriv
ed c
onfid
ence
inte
rval
.b
Base
d on
cul
tivat
ion
figur
es w
hich
may
incl
ude
area
s er
adic
ated
aft
er t
he d
ate
of t
he a
rea
surv
ey.
c U
p to
201
4, t
he e
stim
ates
are
sou
rced
fro
m t
he D
epar
tmen
t of
Sta
te o
f th
e U
nite
d St
ates
. Th
e G
over
nmen
t of
Mex
ico
does
not
val
idat
e th
e es
timat
es p
rovi
ded
by t
he U
nite
d St
ates
as
they
are
no
t pa
rt o
f its
off
icia
l fig
ures
and
it d
oes
not
have
info
rmat
ion
on t
he m
etho
dolo
gy u
sed
to c
alcu
late
the
m.
Estim
ates
of
opiu
m p
rodu
ctio
n fo
r th
e ye
ars
2016
and
201
7, b
ased
on
the
Mex
ico/
UN
OD
C jo
int
proj
ect
entit
led
"Mon
itorin
g of
the
Illic
it C
ultiv
atio
n on
Mex
ican
Ter
ritor
y",w
ill s
oon
beco
me
avai
labl
e.d
Incl
udes
cou
ntrie
s w
ith lo
w le
vels
of
culti
vatio
n (le
ss t
han
400
hect
ares
in t
he la
test
yea
r w
ith a
vaila
ble
data
) an
d co
untr
ies
with
indi
rect
evi
denc
e of
illic
it cu
ltiva
tion
(era
dica
tion
of o
pium
po
ppy)
but
no
dire
ct m
easu
rem
ent.
See
tab
le "
Cul
tivat
ion
of o
pium
pop
py a
nd p
rodu
ctio
n of
opi
um in
oth
er c
ount
ries,
and
era
dica
tion
of o
pium
pop
py,
2007
-201
7".
In
add
ition
, fo
r 20
16 o
nly,
bes
t es
timat
es f
or c
ount
ries
for
whi
ch d
ata
are
not
avai
labl
e (L
ao P
eopl
e's
Dem
ocra
tic R
epub
lic,
Mex
ico
and
Mya
nmar
) ar
e in
clud
ed in
thi
s ca
tego
ry.
St
artin
g in
200
8, a
new
met
hodo
logy
was
intr
oduc
ed t
o es
timat
e op
ium
pop
py c
ultiv
atio
n an
d op
ium
/her
oin
prod
uctio
n in
cou
ntrie
s w
ith n
o da
ta o
n ill
icit
culti
vatio
n of
opi
um p
oppy
. Th
ese
estim
ates
are
hig
her
than
the
pre
viou
s fig
ures
but
hav
e a
sim
ilar
orde
r of
mag
nitu
de.
A d
etai
led
desc
riptio
n of
the
est
imat
ion
met
hodo
logy
is a
vaila
ble
in t
he o
nlin
e m
etho
dolo
gy s
ectio
n of
the
W
orld
Dru
g Re
port
201
7.e
The
fig
ures
for
201
5, a
s pu
blis
hed
in t
he W
orld
Dru
g Re
port
201
6 (U
nite
d N
atio
ns p
ublic
atio
n, S
ales
No.
E.1
6.X
I.7),
hav
e be
en r
evis
ed o
win
g to
a s
tatis
tical
adj
ustm
ent
proc
esse
d by
UN
OD
C.
The
Gov
ernm
ent
of M
exic
o do
es n
ot v
alid
ate
any
opiu
m p
rodu
ctio
n es
timat
es.
The
prod
uctio
n fig
ures
will
be
pres
ente
d on
ce y
ield
dat
a fr
om t
he jo
int
Mex
ico/
UN
OD
C p
roje
ct e
ntitl
ed "
Mon
itor-
ing
of t
he il
licit
culti
vatio
n on
Mex
ican
ter
ritor
y" b
ecom
e av
aila
ble.
Opi
um p
rodu
ctio
n es
timat
ed b
y U
NO
DC
for
201
5 is
bas
ed o
n: (
a) t
he a
rea
unde
r cu
ltiva
tion,
est
ablis
hed
by t
he jo
int
proj
ect
of t
he G
over
nmen
t of
Mex
ico
and
UN
OD
C;
(b)
yiel
d da
ta,
base
d on
yie
ld s
tudi
es c
ondu
cted
by
the
Uni
ted
Stat
es in
Mex
ico
over
the
per
iod
2001
-200
3. T
he o
pium
pro
duct
ion
figur
es s
how
n fo
r 20
15 a
re p
relim
inar
y an
d, f
or m
etho
dolo
gica
l rea
sons
, ar
e no
t co
mpa
rabl
e w
ith t
he p
rodu
ctio
n fig
ures
ove
r th
e pe
riod
1998
-201
4. A
s a
resu
lt of
the
Mex
ico/
UN
OD
C jo
int
proj
ect
entit
led
"M
onito
ring
of t
he Il
licit
Cul
tivat
ion
on M
exic
an T
errit
ory"
, po
ppy
crop
est
imat
e fig
ures
for
the
yea
rs 2
016
and
2017
will
bec
ome
avai
labl
e so
on.
f O
win
g to
the
late
tim
ing
of t
he m
onito
ring
activ
ities
in 2
013,
the
sur
vey
may
not
hav
e ca
ptur
ed il
licit
culti
vatio
n in
thi
s ye
ar in
its
entir
ety.
g B
ound
of
the
stat
istic
ally
der
ived
con
fiden
ce in
terv
al,
with
the
exc
eptio
n of
201
5. T
he f
igur
es f
or 2
015
repr
esen
t in
depe
nden
tly d
eriv
ed u
pper
and
low
er e
stim
ates
; th
e m
idpo
int
was
use
d fo
r th
e ca
lcul
atio
n of
the
glo
bal t
otal
.h
Estim
ate
for
2017
cov
ers
only
the
Sta
tes
of S
han
and
Kac
hir.
i Pr
elim
inar
y es
timat
e
2006
2007
2008
2009
2010
2011
2012
2013
2014
2015
2016
2017
OTH
ER
Oth
er
coun
trie
s d
5558
187
178
224
290
172
182
198
178
1,57
095
0
TOTA
L (b
est
esti
mat
e)5,
810
8,09
16,
841
4,95
34,
730
6,98
34,
831
6,81
07,
732
4,77
16,
383
10,5
00
low
er b
ound
3,89
45,
783
3,73
85,
558
6,20
23,
758
5,10
79,
002
upp
er b
ound
5,
576
8,21
45,
539
8,05
29,
419
5,78
47,
629
11,9
15
TOTA
L (b
est
esti
mat
e ro
un
ded
) 5
,810
8
,090
6
,840
4
,950
4
,730
6
,980
4
,830
6
,810
7
,730
4
,770
6
,380
1
0,50
0 i
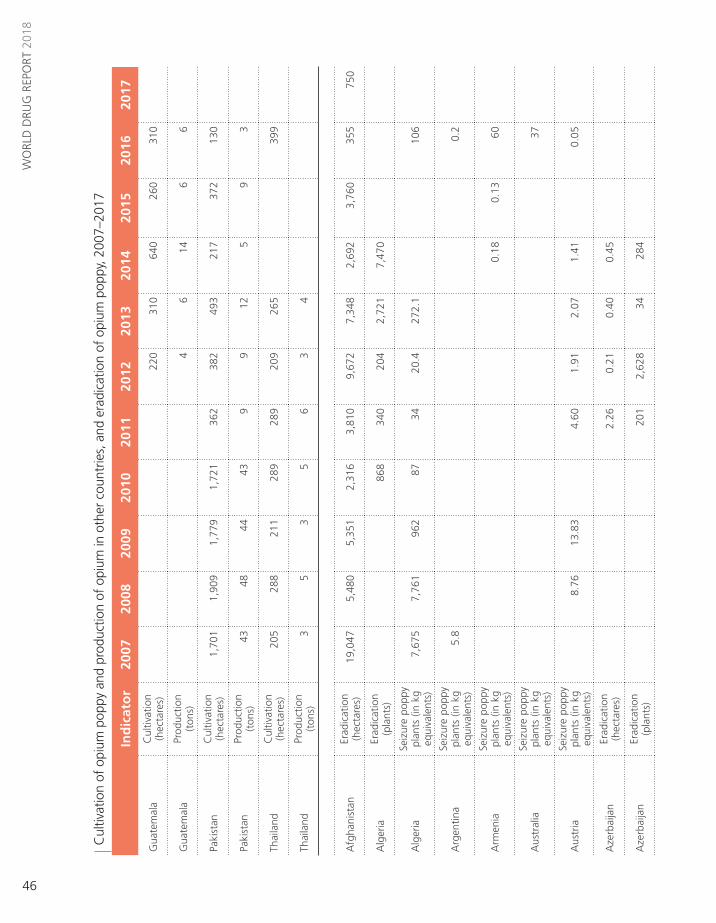
46
WO
RLD
DRU
G R
EPO
RT 2
018
Cul
tivat
ion
of o
pium
pop
py a
nd p
rodu
ctio
n of
opi
um in
oth
er c
ount
ries,
and
era
dica
tion
of o
pium
pop
py, 2
007–
2017
In
dic
ato
r20
0720
0820
0920
1020
1120
1220
1320
1420
1520
1620
17
Gua
tem
ala
Cul
tivat
ion
(hec
tare
s)22
031
064
026
031
0
Gua
tem
ala
Prod
uctio
n (t
ons)
46
146
6
Paki
stan
Cul
tivat
ion
(hec
tare
s)1,
701
1,90
91,
779
1,72
136
238
249
321
737
213
0
Paki
stan
Prod
uctio
n (t
ons)
4348
4443
99
125
93
Thai
land
Cul
tivat
ion
(hec
tare
s)20
528
821
128
928
920
926
539
9
Thai
land
Prod
uctio
n (t
ons)
35
35
63
4
Afg
hani
stan
Erad
icat
ion
(hec
tare
s)19
,047
5,48
05,
351
2,31
63,
810
9,67
27,
348
2,69
23,
760
355
750
Alg
eria
Erad
icat
ion
(pla
nts)
868
340
204
2,72
17,
470
Alg
eria
Seiz
ure
popp
y pl
ants
(in
kg
equi
vale
nts)
7,6
75
7,7
61
962
8734
20.4
272.
110
6
Arg
entin
aSe
izur
e po
ppy
plan
ts (
in k
g eq
uiva
lent
s)5.
80.
2
Arm
enia
Seiz
ure
popp
y pl
ants
(in
kg
equi
vale
nts)
0.1
8 0
.13
60
Aus
tral
ia
Seiz
ure
popp
y pl
ants
(in
kg
equi
vale
nts)
37
Aus
tria
Se
izur
e po
ppy
plan
ts (
in k
g eq
uiva
lent
s) 8
.76
13.
83
4.6
0 1
.91
2.0
7 1
.41
0.0
5
Aze
rbai
jan
Erad
icat
ion
(hec
tare
s)2.
260.
210.
400.
45
Aze
rbai
jan
Erad
icat
ion
(pla
nts)
201
2,62
834
284

47
ANNEX Opium/Heroin 2
In
dic
ato
r20
0720
0820
0920
1020
1120
1220
1320
1420
1520
1620
17
Bang
lade
shEr
adic
atio
n (h
ecta
res)
822
Bang
lade
shSe
izur
e po
ppy
plan
ts (
in k
g eq
uiva
lent
s) 1
45,0
21
Bela
rus
Erad
icat
ion
(hec
tare
s)14
5226
92
Bela
rus
Seiz
ure
popp
y pl
ants
(in
kg
equi
vale
nts)
59
81
51
94
Can
ada
Erad
icat
ion
(hec
tare
s)7
7
Can
ada
Erad
icat
ion
(pla
nts)
60,0
0060
,000
Can
ada
Seiz
ure
popp
y pl
ants
(in
kg
equi
vale
nts)
6600
9.3
7.3
85.9
Chi
naEr
adic
atio
n (h
ecta
res)
6
Col
ombi
aEr
adic
atio
n (h
ecta
res)
375
381
546
712
294
320
514
813
613
450
Cyp
rus
Seiz
ure
popp
y pl
ants
(in
kg
equi
vale
nts)
6
Cze
chia
Seiz
ure
popp
y pl
ants
(in
kg
equi
vale
nts)
40
Ecua
dor
Erad
icat
ion
(pla
nts)
74,5
5511
5,58
025
7,30
644
,200
4,02
5,80
02,
554,
865
2,02
3,38
518
3,57
31,
207,
147
Ecua
dor
Seiz
ure
popp
y pl
ants
(in
kg
equi
vale
nts)
7,4
56
11,
558
12,
865
2,2
10
185
,490
7
5,76
5
Egyp
tEr
adic
atio
n (h
ecta
res)
8912
198
222
13
9810
5
Egyp
tSe
izur
e po
ppy
plan
ts (
in k
g eq
uiva
lent
s)16
1
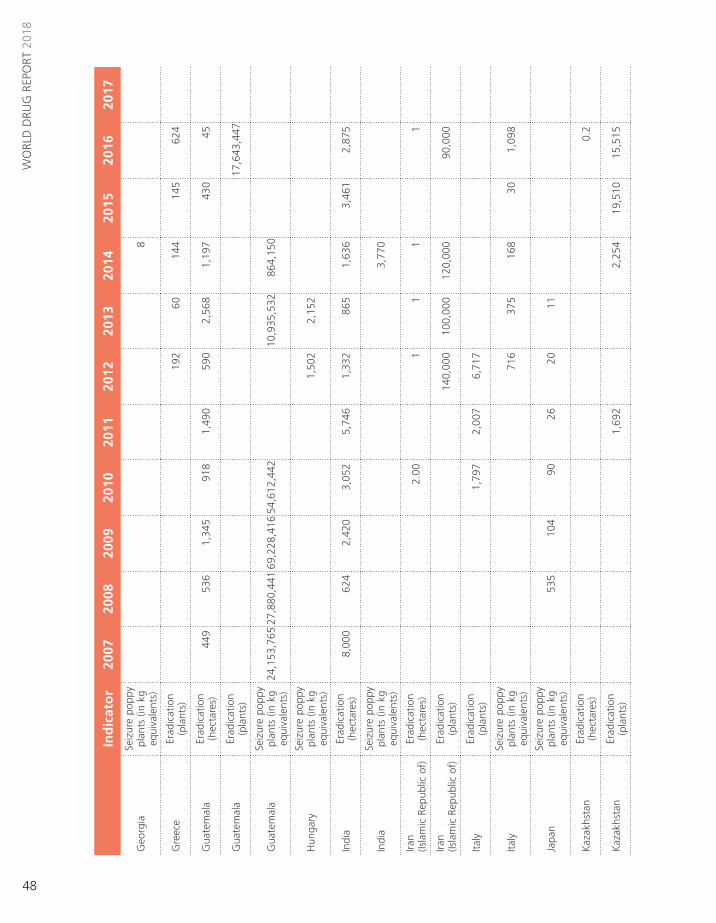
48
WO
RLD
DRU
G R
EPO
RT 2
018
In
dic
ato
r20
0720
0820
0920
1020
1120
1220
1320
1420
1520
1620
17
Geo
rgia
Seiz
ure
popp
y pl
ants
(in
kg
equi
vale
nts)
8
Gre
ece
Erad
icat
ion
(pla
nts)
192
6014
414
562
4
Gua
tem
ala
Erad
icat
ion
(hec
tare
s)44
953
61,
345
918
1,49
059
02,
568
1,19
743
045
Gua
tem
ala
Erad
icat
ion
(pla
nts)
17,6
43,4
47
Gua
tem
ala
Seiz
ure
popp
y pl
ants
(in
kg
equi
vale
nts)
24,1
53,7
65 2
7,88
0,44
1 69
,228
,416
54,
612,
442
10,9
35,5
32
864
,150
Hun
gary
Seiz
ure
popp
y pl
ants
(in
kg
equi
vale
nts)
1,5
02
2,1
52
Indi
aEr
adic
atio
n (h
ecta
res)
8,00
062
42,
420
3,05
25,
746
1,33
286
51,
636
3,46
12,
875
Indi
aSe
izur
e po
ppy
plan
ts (
in k
g eq
uiva
lent
s) 3
,770
Iran
(Is
lam
ic R
epub
lic o
f)Er
adic
atio
n (h
ecta
res)
2.0
0 1
1
1
1
Iran
(Isla
mic
Rep
ublic
of)
Erad
icat
ion
(pla
nts)
140,
000
100,
000
120,
000
90,0
00
Italy
Erad
icat
ion
(pla
nts)
1,79
72,
007
6,71
7
Italy
Seiz
ure
popp
y pl
ants
(in
kg
equi
vale
nts)
716
3
75
168
3
0 1
,098
Japa
nSe
izur
e po
ppy
plan
ts (
in k
g eq
uiva
lent
s) 5
35
104
9
0 2
6 2
0 1
1
Kaz
akhs
tan
Erad
icat
ion
(hec
tare
s)0.
2
Kaz
akhs
tan
Erad
icat
ion
(pla
nts)
1,69
22,
254
19,5
1015
,515
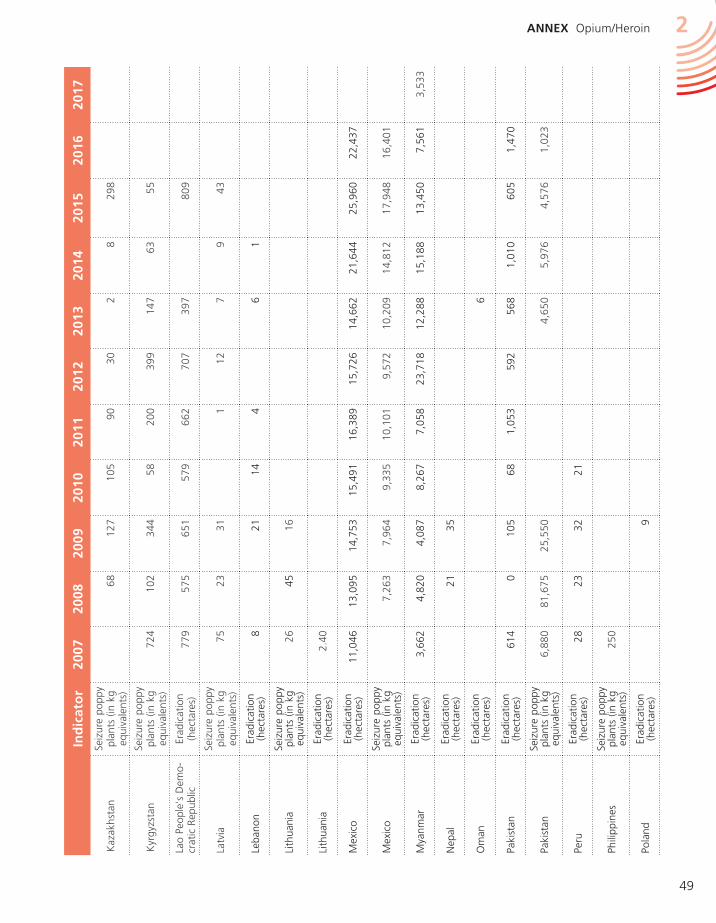
49
ANNEX Opium/Heroin 2
In
dic
ato
r20
0720
0820
0920
1020
1120
1220
1320
1420
1520
1620
17
Kaz
akhs
tan
Seiz
ure
popp
y pl
ants
(in
kg
equi
vale
nts)
68
127
1
05
90
30
2
8
298
Kyr
gyzs
tan
Seiz
ure
popp
y pl
ants
(in
kg
equi
vale
nts)
724
1
02
344
5
8 2
00
399
1
47
63
55
Lao
Peop
le's
Dem
o-cr
atic
Rep
ublic
Erad
icat
ion
(hec
tare
s)77
957
565
157
966
270
739
780
9
Latv
iaSe
izur
e po
ppy
plan
ts (
in k
g eq
uiva
lent
s) 7
5 2
3 3
1 1
1
2 7
9
4
3
Leba
non
Erad
icat
ion
(hec
tare
s)8
2114
46
1
Lith
uani
aSe
izur
e po
ppy
plan
ts (
in k
g eq
uiva
lent
s) 2
6 4
5 1
6
Lith
uani
aEr
adic
atio
n (h
ecta
res)
2.40
Mex
ico
Erad
icat
ion
(hec
tare
s)11
,046
13,0
9514
,753
15,4
9116
,389
15,7
2614
,662
21,6
4425
,960
22,4
37
Mex
ico
Seiz
ure
popp
y pl
ants
(in
kg
equi
vale
nts)
7,2
63
7,9
64
9,3
35
10,
101
9,5
72
10,
209
14,
812
17,
948
16,
401
Mya
nmar
Erad
icat
ion
(hec
tare
s)3,
662
4,82
04,
087
8,26
77,
058
23,7
1812
,288
15,1
8813
,450
7,56
13,
533
Nep
alEr
adic
atio
n (h
ecta
res)
2135
Om
anEr
adic
atio
n (h
ecta
res)
6
Paki
stan
Erad
icat
ion
(hec
tare
s)61
40
105
681,
053
592
568
1,01
060
51,
470
Paki
stan
Seiz
ure
popp
y pl
ants
(in
kg
equi
vale
nts)
6,8
80
81,
675
25,
550
4,6
50
5,9
76
4,5
76
1,0
23
Peru
Erad
icat
ion
(hec
tare
s)28
2332
21
Phili
ppin
es
Seiz
ure
popp
y pl
ants
(in
kg
equi
vale
nts)
250
Pola
ndEr
adic
atio
n (h
ecta
res)
9
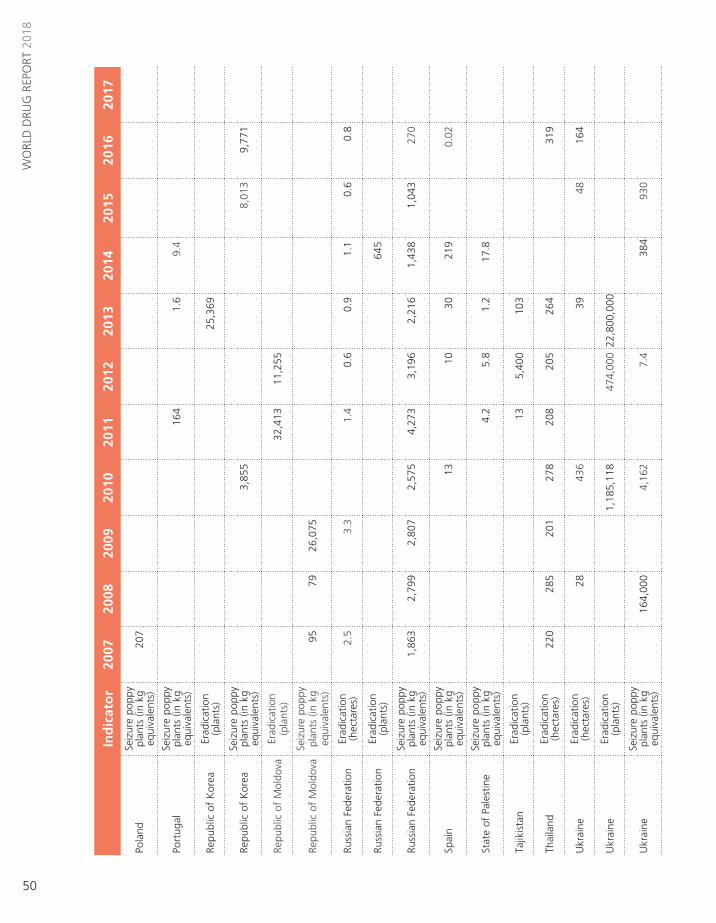
50
WO
RLD
DRU
G R
EPO
RT 2
018
In
dic
ato
r20
0720
0820
0920
1020
1120
1220
1320
1420
1520
1620
17
Pola
ndSe
izur
e po
ppy
plan
ts (
in k
g eq
uiva
lent
s)20
7
Port
ugal
Seiz
ure
popp
y pl
ants
(in
kg
equi
vale
nts)
164
1
.6
9.4
Repu
blic
of
Kor
eaEr
adic
atio
n (p
lant
s)25
,369
Repu
blic
of
Kor
eaSe
izur
e po
ppy
plan
ts (
in k
g eq
uiva
lent
s) 3
,855
8
,013
9
,771
Repu
blic
of
Mol
dova
Erad
icat
ion
(pla
nts)
32,4
1311
,255
Repu
blic
of
Mol
dova
Seiz
ure
popp
y pl
ants
(in
kg
equi
vale
nts)
95
79
26,
075
Russ
ian
Fede
ratio
nEr
adic
atio
n (h
ecta
res)
2.5
3.3
1.4
0.6
0.9
1.1
0.6
0.8
Russ
ian
Fede
ratio
nEr
adic
atio
n (p
lant
s)64
5
Russ
ian
Fede
ratio
nSe
izur
e po
ppy
plan
ts (
in k
g eq
uiva
lent
s) 1
,863
2
,799
2
,807
2
,575
4
,273
3
,196
2
,216
1
,438
1
,043
2
70
Spai
nSe
izur
e po
ppy
plan
ts (
in k
g eq
uiva
lent
s) 1
3 1
0 3
0 2
19
0.0
2
Stat
e of
Pal
estin
eSe
izur
e po
ppy
plan
ts (
in k
g eq
uiva
lent
s) 4
.2
5.8
1
.2
17.
8
Tajik
ista
nEr
adic
atio
n (p
lant
s)13
5,40
010
3
Thai
land
Erad
icat
ion
(hec
tare
s)22
028
520
127
820
820
526
431
9
Ukr
aine
Erad
icat
ion
(hec
tare
s)28
436
3948
164
Ukr
aine
Erad
icat
ion
(pla
nts)
1,18
5,11
847
4,00
022
,800
,000
Ukr
aine
Seiz
ure
popp
y pl
ants
(in
kg
equi
vale
nts)
164
,000
4
,162
7
.4
384
9
30

51
ANNEX Opium/Heroin 2
Glo
bal m
anuf
actu
re o
f he
roin
fro
m g
loba
l illi
cit
opiu
m p
rodu
ctio
n, 2
006–
2017
(ton
s)
Not
es:
The
calc
ulat
ion
show
s th
e po
tent
ial a
mou
nt o
f he
roin
tha
t co
uld
have
bee
n m
anuf
actu
red
out
of t
he o
pium
pro
duce
d in
a g
iven
yea
r; it
doe
s no
t ta
ke in
to a
ccou
nt c
hang
es in
opi
um
inve
ntor
ies,
whi
ch m
ay a
lso
be u
sed
for
the
man
ufac
ture
of
hero
in a
nd w
hich
may
be
impo
rtan
t. A
fgha
nist
an is
the
onl
y co
untr
y fo
r w
hich
the
pro
port
ion
of p
oten
tial o
pium
pro
duct
ion
not
con
-ve
rted
into
her
oin
with
in t
he c
ount
ry is
est
imat
ed.
For
all o
ther
cou
ntrie
s, f
or t
he p
urpo
ses
of t
his
tabl
e, it
is a
ssum
ed t
hat
all o
pium
pro
duce
d is
con
vert
ed in
to h
eroi
n. If
all
of t
he o
pium
pro
-du
ced
in A
fgha
nist
an in
201
6 ha
d be
en c
onve
rted
into
her
oin,
tot
al p
oten
tial h
eroi
n m
anfu
actu
re w
ould
hav
e am
ount
ed t
o 66
8 to
ns a
t th
e gl
obal
leve
l (51
0 to
ns in
Afg
hani
stan
).
The
amou
nt o
f he
roin
pro
duce
d in
Afg
hani
stan
is c
alcu
late
d us
ing
two
para
met
ers
that
may
cha
nge:
(a)
the
dis
trib
utio
n be
twee
n op
ium
tha
t is
not
pro
cess
ed a
nd o
pium
pro
cess
ed in
to h
eroi
n;
and
(b)
the
conv
ersi
on r
atio
into
her
oin.
The
firs
t pa
ram
eter
is in
dire
ctly
est
imat
ed,
base
d on
sei
zure
s of
opi
um v
ersu
s se
izur
es o
f he
roin
and
mor
phin
e re
port
ed b
y A
fgha
nist
an a
nd n
eigh
bour
ing
coun
trie
s. F
or 2
016,
thi
s ca
lcul
atio
n re
sults
in a
pro
port
ion
of 5
7 pe
r ce
nt o
f po
tent
ial o
pium
pro
duct
ion
in A
fgha
nist
an c
onve
rted
into
her
oin.
For
the
sec
ond
para
met
er,
from
200
5 to
201
3, a
co
nver
sion
rat
io o
f op
ium
to
mor
phin
e/he
roin
of
7:1
was
use
d, b
ased
on
inte
rvie
ws
cond
ucte
d w
ith A
fgha
n m
orph
ine/
hero
in “
cook
s”,
on a
n ac
tual
her
oin
prod
uctio
n ex
erci
se c
ondu
cted
by
two
(illit
erat
e) A
fgha
n he
roin
“co
oks”
, do
cum
ente
d by
the
Ger
man
Bun
desk
rimin
alam
t in
Afg
hani
stan
in 2
003
(pub
lishe
d in
Bul
letin
on
Nar
cotic
s, v
ol.
LVII,
Nos
. 1
and
2, 2
005,
pp.
11-
31)
and
Uni
ted
Nat
ions
Off
ice
on D
rugs
and
Crim
e (U
NO
DC
) st
udie
s on
the
mor
phin
e co
nten
t of
Afg
han
opiu
m (
12.3
per
cen
t ov
er t
he p
erio
d 20
10-2
012,
dow
n fr
om 1
5 pe
r ce
nt o
ver
the
perio
d 20
00-2
003)
. Fr
om 2
014
to 2
016,
a d
iffer
ent
appr
oach
to
the
conv
ersi
on w
as a
dopt
ed,
refle
ctin
g up
date
d in
form
atio
n on
mor
phin
e co
nten
t an
d a
diff
eren
t m
etho
d fo
r ta
king
pur
ity in
to a
ccou
nt.
The
rev
ised
ap
proa
ch u
ses
a ra
tio o
f 18
.5 k
g of
opi
um f
or 1
kg
of 1
00 p
er c
ent
pure
whi
te h
eroi
n hy
droc
hlor
ide
(see
Afg
hani
stan
Opi
um S
urve
y 20
14,
UN
OD
C,
Nov
embe
r 20
14);
base
d on
an
estim
ated
ex
port
qua
lity
of 5
1 pe
r ce
nt in
201
6, t
his
tran
slat
es in
to a
rat
io o
f 9.
5 kg
(ra
nge:
9-1
0 kg
) of
opi
um f
or 1
kg
of e
xpor
t-qu
ality
her
oin
(for
201
6).
For
mor
e de
tails
, se
e A
fgha
nist
an O
pium
Sur
vey
2016
(U
NO
DC
, O
ctob
er 2
016)
. Fo
r co
untr
ies
othe
r th
an A
fgha
nist
an,
a “t
radi
tiona
l” c
onve
rsio
n ra
tio o
f op
ium
to
hero
in o
f 10
:1 is
use
d. T
he r
atio
s w
ill b
e ad
just
ed w
hen
impr
oved
info
rmat
ion
beco
mes
ava
ilabl
e. F
igur
es in
ital
ics
are
prel
imin
ary
and
may
be
revi
sed
whe
n up
date
d in
form
atio
n be
com
es a
vaila
ble.
For
2017
, ne
w e
vide
nce
has
beco
me
avai
labl
e of
hig
her
purit
ies
of h
eroi
n pr
oduc
ed in
Afg
hani
stan
. Ra
nges
in t
he r
epor
ted
figur
es r
efle
ct d
iffer
ent
purit
ies
and
the
uppe
r an
d lo
wer
bou
nds
of
the
95%
con
fiden
ce in
terv
al a
roun
d op
ium
pro
duct
ion
estim
ates
in A
fgha
nist
an in
201
7. F
or m
ore
info
rmat
ion,
see
the
Afg
hani
stan
Opi
um S
urve
y 20
17 (
UN
OD
C,
May
201
8).
* H
eroi
n m
anuf
actu
re e
stim
ated
at
expo
rt p
urity
.
Sour
ce:
Uni
ted
Nat
ions
Off
ice
on D
rugs
and
Crim
e an
nual
rep
ort
ques
tionn
aire
, go
vern
men
t re
port
s, r
epor
ts o
f re
gion
al b
odie
s, a
nd in
tern
atio
nal n
arco
tics
cont
rol s
trat
egy
repo
rts
of
the
Uni
ted
Stat
es o
f A
mer
ica.
In
dic
ato
r20
0720
0820
0920
1020
1120
1220
1320
1420
1520
1620
17
Uzb
ekis
tan
Erad
icat
ion
(hec
tare
s)1.
01.
00.
30.
30.
3
Uzb
ekis
tan
Seiz
ure
popp
y pl
ants
(in
kg
equi
vale
nts)
169
138
687
896
413
330
336
406
205
863
Vie
t N
amEr
adic
atio
n (h
ecta
res)
3899
3138
3525
1918
2006
2007
2008
2009
2010
2011
2012
2013
2014
2015
2016
2017
Tota
l p
ote
nti
al
op
ium
pro
du
ctio
n
5,8
10
8,0
91
6,8
41
4,9
53
4,7
30
6,9
83
4,8
31
6,8
10
7,7
23
4,7
71
6,3
83
10,
500
Pote
ntia
l opi
um n
ot
proc
esse
d in
to h
eroi
n 1
,786
3
,078
2
,360
1
,680
1
,728
3
,400
1
,850
2
,600
2
,450
1
,360
2
,510
1
,100
-1,4
00
Pote
ntia
l opi
um
proc
esse
d in
to h
eroi
n 4
,024
5
,012
4
,481
3
,273
3
,002
3
,583
2
,981
4
,210
5
,273
3
,411
3
,873
9
,100
-9,4
00
Tota
l p
ote
nti
al
her
oin
man
ufa
ctu
re *
553
6
86
600
4
27
383
4
67
377
5
55
542
3
27
408
7
00-1
,050
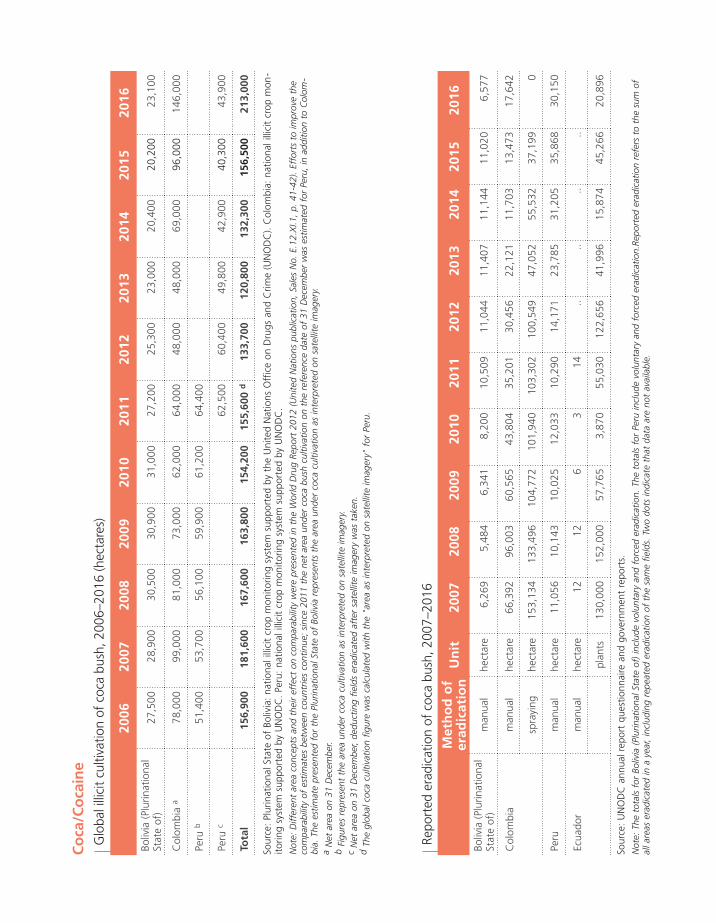
Repo
rted
era
dica
tion
of c
oca
bush
, 200
7–20
16
Sour
ce:
UN
OD
C a
nnua
l rep
ort
ques
tionn
aire
and
gov
ernm
ent
repo
rts.
Not
e: T
he t
otal
s fo
r Bo
livia
(Pl
urin
atio
nal S
tate
of)
incl
ude
volu
ntar
y an
d fo
rced
era
dica
tion.
The
tot
als
for
Peru
incl
ude
volu
ntar
y an
d fo
rced
era
dica
tion.
Repo
rted
era
dica
tion
refe
rs t
o th
e su
m o
f al
l are
as e
radi
cate
d in
a y
ear,
incl
udin
g re
peat
ed e
radi
catio
n of
the
sam
e fie
lds.
Tw
o do
ts in
dica
te t
hat
data
are
not
ava
ilabl
e.
Glo
bal i
llici
t cu
ltiva
tion
of c
oca
bush
, 200
6–20
16 (h
ecta
res)
Sour
ce:
Plur
inat
iona
l Sta
te o
f Bo
livia
: na
tiona
l illi
cit
crop
mon
itorin
g sy
stem
sup
port
ed b
y th
e U
nite
d N
atio
ns O
ffic
e on
Dru
gs a
nd C
rime
(UN
OD
C).
Col
ombi
a: n
atio
nal i
llici
t cr
op m
on-
itorin
g sy
stem
sup
port
ed b
y U
NO
DC
. Pe
ru:
natio
nal i
llici
t cr
op m
onito
ring
syst
em s
uppo
rted
by
UN
OD
C.
Not
e: D
iffer
ent
area
con
cept
s an
d th
eir
effe
ct o
n co
mpa
rabi
lity
wer
e pr
esen
ted
in t
he W
orld
Dru
g Re
port
201
2 (U
nite
d N
atio
ns p
ublic
atio
n, S
ales
No.
E.1
2.X
I.1,
p. 4
1-42
). Ef
fort
s to
impr
ove
the
com
para
bilit
y of
est
imat
es b
etw
een
coun
trie
s co
ntin
ue;
sinc
e 20
11 t
he n
et a
rea
unde
r co
ca b
ush
culti
vatio
n on
the
ref
eren
ce d
ate
of 3
1 D
ecem
ber
was
est
imat
ed f
or P
eru,
in a
dditi
on t
o C
olom
-bi
a. T
he e
stim
ate
pres
ente
d fo
r th
e Pl
urin
atio
nal S
tate
of
Boliv
ia r
epre
sent
s th
e ar
ea u
nder
coc
a cu
ltiva
tion
as in
terp
rete
d on
sat
ellit
e im
ager
y.a
Net
are
a on
31
Dec
embe
r.
b Fi
gure
s re
pres
ent
the
area
und
er c
oca
culti
vatio
n as
inte
rpre
ted
on s
atel
lite
imag
ery.
c
Net
are
a on
31
Dec
embe
r, de
duct
ing
field
s er
adic
ated
aft
er s
atel
lite
imag
ery
was
tak
en.
d
The
glob
al c
oca
culti
vatio
n fig
ure
was
cal
cula
ted
with
the
"ar
ea a
s in
terp
rete
d on
sat
ellit
e im
ager
y" f
or P
eru.
Co
ca/C
oca
ine
20
0620
0720
0820
0920
1020
1120
1220
1320
1420
1520
16
Boliv
ia (
Plur
inat
iona
l St
ate
of)
27,5
0028
,900
30,5
0030
,900
31,0
0027
,200
25,3
0023
,000
20,4
0020
,200
23,
100
Col
ombi
a a
78,0
0099
,000
81,0
0073
,000
62,0
0064
,000
48,0
0048
,000
69,0
0096
,000
146
,000
Peru
b51
,400
53,7
0056
,100
59,9
0061
,200
64,4
00
Peru
c62
,500
60,4
0049
,800
42,9
0040
,300
43,
900
Tota
l15
6,90
0 18
1,60
0 16
7,60
0 16
3,80
0 15
4,20
0 15
5,60
0 d
133,
700
120,
800
132,
300
156,
500
213,
000
Met
ho
d o
f er
adic
atio
nU
nit
2007
2008
2009
2010
2011
2012
2013
2014
2015
2016
Boliv
ia (
Plur
inat
iona
l St
ate
of)
man
ual
hect
are
6,26
95,
484
6,34
18,
200
10,5
0911
,044
11,4
0711
,144
11,0
206,
577
Col
ombi
am
anua
lhe
ctar
e66
,392
96,0
0360
,565
43,8
0435
,201
30,4
5622
,121
11,7
0313
,473
17,6
42
spra
ying
hect
are
153,
134
133,
496
104,
772
101,
940
103,
302
100,
549
47,0
5255
,532
37,1
990
Peru
man
ual
hect
are
11,0
5610
,143
10,0
2512
,033
10,2
9014
,171
23,7
8531
,205
35,8
6830
,150
Ecua
dor
man
ual
hect
are
1212
63
14..
....
..
plan
ts13
0,00
015
2,00
057
,765
3,87
055
,030
122,
656
41,9
9615
,874
45,2
6620
,896

53
ANNEX Coca/Cocaine 2
Pote
ntia
l man
ufac
ture
of
100
per
cent
pur
e co
cain
e, 2
006–
2016
(ton
s)
Sour
ce:
Plur
inat
iona
l Sta
te o
f Bo
livia
: ow
n ca
lcul
atio
ns b
ased
on
coca
leaf
yie
ld s
urve
ys b
y th
e U
nite
d N
atio
ns O
ffic
e on
Dru
gs a
nd C
rime
(UN
OD
C)
(Yun
gas
de L
a Pa
z) a
nd s
cien
tific
st
udie
s by
the
Dru
g En
forc
emen
t A
dmin
istr
atio
n of
the
Uni
ted
Stat
es o
f A
mer
ica
(Cha
pare
). C
olom
bia:
UN
OD
C/G
over
nmen
t of
Col
ombi
a. P
eru:
ow
n ca
lcul
atio
ns b
ased
on
coca
leaf
to
coc
aine
con
vers
ion
ratio
fro
m s
cien
tific
stu
dies
by
the
Dru
g En
forc
emen
t A
dmin
istr
atio
n. D
etai
led
info
rmat
ion
on t
he o
ngoi
ng r
evis
ion
of c
onve
rsio
n ra
tios
and
coca
ine
labo
rato
ry
effic
ienc
y is
ava
ilabl
e in
the
Wor
ld D
rug
Repo
rt 2
010
(Uni
ted
Nat
ions
pub
licat
ion,
Sal
es N
o. E
.10.
XI.1
3),
p. 2
49.
a
Con
vers
ion
of a
reas
und
er c
oca
culti
vatio
n in
to c
oca
leaf
and
the
n in
to c
ocai
ne h
ydro
chlo
ride,
tak
ing
yiel
ds,
amou
nts
of c
oca
leaf
use
d fo
r lic
it pu
rpos
es a
nd c
ocai
ne la
bora
tory
eff
icie
ncy
into
acco
unt.
Not
es:
Ow
ing
to a
lack
of
upda
ted
conv
ersi
on f
acto
rs in
Bol
ivia
(Pl
urin
atio
nal S
tate
of)
and
Per
u, n
o fin
al e
stim
ates
of
the
leve
l of
coca
ine
prod
uctio
n ca
n be
pro
vide
d. W
ith r
espe
ct t
o da
ta p
ub-
lishe
d in
the
Wor
ld D
rug
Repo
rt 2
016
(Uni
ted
Nat
ions
pub
licat
ion,
Sal
es N
o. E
.16.
XI.7
), th
e fo
llow
ing
amen
dmen
ts h
ave
been
mad
e: (
a) d
ata
for
Col
ombi
a (2
005-
2008
) ha
ve b
een
revi
sed
in o
rder
to
ens
ure
a co
nsis
tent
impl
emen
tatio
n of
rev
isio
ns t
o th
e m
etho
dolo
gy,
affe
ctin
g th
e w
ay c
oca
prod
uctio
n is
cal
cula
ted,
for
the
ent
ire t
ime
serie
s 20
05-2
015
(for
det
ails
, se
e C
olom
bia
Coc
a C
ulti
-va
tion
Surv
ey R
epor
t 20
14 (
UN
OD
C,
2015
) an
d C
olom
bia
Surv
ey o
f te
rrito
ries
affe
cted
by
illic
it cr
ops
2015
, A
nnex
3 (
UN
OD
C 2
016)
); (b
) to
tals
for
200
9-20
12 b
ased
on
"old
" an
d "n
ew"
conv
er-
sion
rat
ios
have
bee
n re
vise
d to
rec
tify
min
or in
accu
raci
es in
dat
a pr
oces
sing
. Fi
gure
s in
ital
ics
are
subj
ect
to r
evis
ion.
Tw
o do
ts in
dica
te t
hat
data
are
not
ava
ilabl
e. In
form
atio
n on
est
imat
ion
met
hodo
logi
es a
nd d
efin
ition
s ca
n be
fou
nd in
the
onl
ine
met
hodo
logy
sec
tion
of t
he W
orld
Dru
g Re
port
201
8.
2006
2007
2008
2009
2010
2011
2012
2013
2014
2015
2016
Boliv
ia
(Plu
rinat
iona
l sta
te o
f)94
10
4 11
3..
....
....
....
..
Col
ombi
a80
9 68
3 47
1 48
8 42
438
433
329
044
264
686
6
Peru
280
290
302
....
....
....
....
Tota
l b
ased
on
"o
ld"
con
vers
ion
rat
ios
a 1
,183
1
,077
8
86
920
8
62
815
7
38
662
7
46
937
1
,198
Tota
l b
ased
on
"n
ew"
con
vers
ion
rat
ios
a 1
,381
1
,317
1
,143
1
,188
1
,134
1
,090
9
97
902
9
43
1,1
25
1,4
10

54
WO
RLD
DRU
G R
EPO
RT 2
018
Can
nabi
s cu
ltiva
tion,
pro
duct
ion
and
erad
icat
ion,
late
st y
ear
avai
labl
e fr
om t
he p
erio
d 20
11–2
016
Can
nab
is
Yea
rC
ou
ntr
yPr
od
uct
Ou
tdo
ors
/in
do
ors
Are
a
cult
ivat
ed
(ha)
Are
a
erad
icat
ed
(ha)
Har
vest
able
ar
ea (
ha)
Pro
du
ctio
n
(to
ns)
Plan
ts
erad
icat
edSi
tes
er
adic
ated
2012
Afg
hani
stan
resi
nou
tdoo
rs 1
0,00
0 1
,400
2016
Alb
ania
herb
outd
oors
2,5
36,2
88
5,2
05
2014
Alg
eria
resi
nou
tdoo
rs 2
,522
2016
Arm
enia
herb
outd
oors
0.50
a0.
500.
0075
720
2016
Aus
tral
iahe
rbin
door
s31
,266
408
2016
Aus
tral
iahe
rbou
tdoo
rs22
,257
1,02
1
2015
Aus
tria
herb
outd
oors
3.00
a3.
000.
00
2014
Aze
rbai
jan
herb
outd
oors
17.5
0 a17
.50
0.00
14,8
8919
5
2013
Aze
rbai
jan
herb
outd
oors
23.9
5 a23
.95
0.00
263.
968,
469
151
2015
Baha
mas
herb
outd
oors
17,2
70
2011
Bang
lade
shhe
rbou
tdoo
rs54
,244
2012
Bang
lade
shhe
rbou
tdoo
rs39
,848
2013
Bang
lade
shhe
rbou
tdoo
rs35
,012
2014
Bang
lade
shhe
rbou
tdoo
rs35
,988
2015
Bang
lade
shhe
rbou
tdoo
rs39
,967
2016
Bang
lade
shhe
rbou
tdoo
rs47
,104
2017
Bang
lade
shhe
rbou
tdoo
rs69
,989
2016
Bela
rus
herb
outd
oors
123.
801,
945
2016
Bela
rus
herb
indo
ors
28
2015
Belg
ium
herb
indo
ors
345,
518
1,16
4
2015
Belg
ium
herb
outd
oors
4,88
593
2015
Beliz
ehe
rbou
tdoo
rs50
,897
2016
Boliv
ia (
Plur
inat
iona
l St
ate
of)
herb
outd
oors
14.6
035
2016
Bosn
ia a
nd
Her
zego
vina
herb
outd
oors
1,68
0.00
2016
Bosn
ia a
nd
Her
zego
vina
herb
indo
ors
39.0
0
2014
Braz
ilhe
rbou
tdoo
rs44
.01
1,3
64,3
16
2015
Bulg
aria
herb
indo
ors
323
2015
Bulg
aria
herb
outd
oors
37.7
79,
488

55
ANNEX Cannabis 2
Yea
rC
ou
ntr
yPr
od
uct
Ou
tdo
ors
/in
do
ors
Are
a
cult
ivat
ed
(ha)
Are
a
erad
icat
ed
(ha)
Har
vest
able
ar
ea (
ha)
Pro
du
ctio
n
(to
ns)
Plan
ts
erad
icat
edSi
tes
er
adic
ated
2016
Chi
lehe
rbin
door
s26
,988
2,74
0
2016
Chi
lehe
rbou
tdoo
rs58
,950
264
2016
Chi
nahe
rbou
tdoo
rs9.
801,
390,
000
2016
Col
ombi
ahe
rbou
tdoo
rs13
5.00
2016
Cos
ta R
ica
herb
outd
oors
17.5
92,
122,
244
201
2016
Cos
ta R
ica
herb
indo
ors
678.
005
2016
Côt
e d'
Ivoi
rehe
rbou
tdoo
rs5
2016
Cze
chia
herb
indo
ors
53,5
4922
9
2016
Cze
chia
herb
outd
oors
4,11
1
2014
Dom
inic
an R
epub
liche
rbou
tdoo
rs6.
00 a
6.00
0.00
0.21
111
8
2016
Ecua
dor
herb
outd
oors
224
34
2015
Egyp
the
rb/r
esin
outd
oors
140.
00
2016
El S
alva
dor
herb
outd
oors
1.00
227
25
2014
Fran
cehe
rbou
tdoo
rs15
8,59
283
7
2015
Ger
man
yhe
rbin
door
s13
5,92
578
6
2015
Ger
man
yhe
rbou
tdoo
rs 9
,136
12
7
2016
Gre
ece
herb
indo
ors
16,
554
2016
Gre
ece
herb
oudo
ors
39,
151
2016
Gua
tem
ala
herb
outd
oors
9.00
3,1
38,2
98
427
2015
Guy
ana
herb
outd
oors
20.0
09.
4010
.60
1,00
0.00
419
,700
19
2016
Hon
dura
she
rbin
door
s 7
2
2016
Hon
dura
she
rbou
door
s 2
4,25
3 19
2016
Chi
na,
Hon
g K
ong
SAR
herb
indo
ors
329
1
2016
Hun
gary
herb
indo
ors
5,00
03
2016
Hun
gary
herb
outd
oors
2,00
020
2013
Icel
and
herb
indo
ors
6,65
232
3
2016
Indi
ahe
rbou
tdoo
rs3,
414.
74
2016
Indo
nesi
ahe
rbou
tdoo
rs48
2.00
a48
2.00
0.00
2016
Irela
ndhe
rbin
door
s7,
273
2014
Italy
herb
indo
ors
51,5
3463
9
2014
Italy
herb
outd
oors
70,1
251,
134
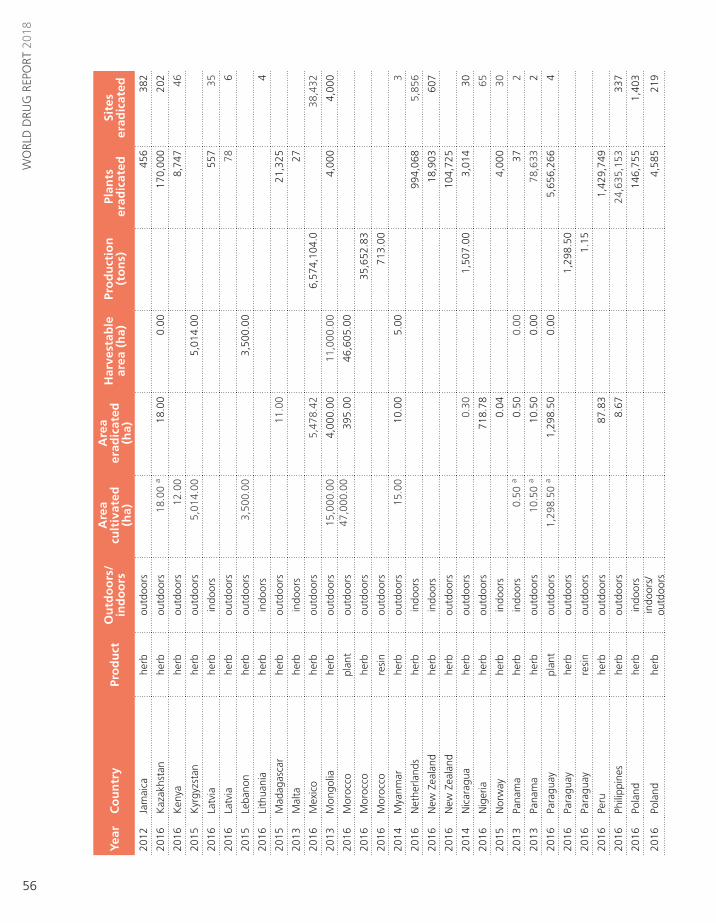
56
WO
RLD
DRU
G R
EPO
RT 2
018
Yea
rC
ou
ntr
yPr
od
uct
Ou
tdo
ors
/in
do
ors
Are
a
cult
ivat
ed
(ha)
Are
a
erad
icat
ed
(ha)
Har
vest
able
ar
ea (
ha)
Pro
du
ctio
n
(to
ns)
Plan
ts
erad
icat
edSi
tes
er
adic
ated
2012
Jam
aica
herb
outd
oors
456
382
2016
Kaz
akhs
tan
herb
outd
oors
18.0
0 a
18.0
00.
0017
0,00
020
2
2016
Ken
yahe
rbou
tdoo
rs12
.00
8,74
746
2015
Kyr
gyzs
tan
herb
outd
oors
5,01
4.00
5,01
4.00
2016
Latv
iahe
rbin
door
s55
735
2016
Latv
iahe
rbou
tdoo
rs78
6
2015
Leba
non
herb
outd
oors
3,50
0.00
3,50
0.00
2016
Lith
uani
ahe
rbin
door
s4
2015
Mad
agas
car
herb
outd
oors
11.0
021
,325
2013
Mal
tahe
rbin
door
s27
2016
Mex
ico
herb
outd
oors
5,47
8.42
6,57
4,10
4.0
38,4
32
2013
Mon
golia
herb
outd
oors
15,0
00.0
04,
000.
0011
,000
.00
4,00
04,
000
2016
Mor
occo
plan
tou
tdoo
rs47
,000
.00
395.
0046
,605
.00
2016
Mor
occo
herb
outd
oors
35,6
52.8
3
2016
Mor
occo
resi
nou
tdoo
rs71
3.00
2014
Mya
nmar
herb
outd
oors
15.0
010
.00
5.00
3
2016
Net
herla
nds
herb
indo
ors
994,
068
5,85
6
2016
New
Zea
land
herb
indo
ors
18,9
0360
7
2016
New
Zea
land
herb
outd
oors
104,
725
2014
Nic
arag
uahe
rbou
tdoo
rs0.
301,
507.
003,
014
30
2016
Nig
eria
herb
outd
oors
718.
7865
2015
Nor
way
herb
indo
ors
0.04
4,00
030
2013
Pana
ma
herb
indo
ors
0.50
a0.
500.
0037
2
2013
Pana
ma
herb
outd
oors
10.5
0 a
10.5
00.
0078
,633
2
2016
Para
guay
plan
tou
tdoo
rs1,
298.
50 a
1,29
8.50
0.00
5,65
6,26
64
2016
Para
guay
herb
outd
oors
1,29
8.50
2016
Para
guay
resi
nou
tdoo
rs1.
15
2016
Peru
herb
outd
oors
87.8
31,
429,
749
2016
Phili
ppin
eshe
rbou
tdoo
rs8.
6724
,635
,153
337
2016
Pola
ndhe
rbin
door
s14
6,75
51,
403
2016
Pola
ndhe
rbin
door
s/
outd
oors
4,58
521
9

57
ANNEX Cannabis 2
Yea
rC
ou
ntr
yPr
od
uct
Ou
tdo
ors
/in
do
ors
Are
a
cult
ivat
ed
(ha)
Are
a
erad
icat
ed
(ha)
Har
vest
able
ar
ea (
ha)
Pro
du
ctio
n
(to
ns)
Plan
ts
erad
icat
edSi
tes
er
adic
ated
2013
Repu
blic
of
Kor
eahe
rbou
tdoo
rs8,
072
2014
Repu
blic
of
Mol
dova
herb
outd
oors
100
.00
59.0
041
.00
10,0
00.0
020
0,54
8
2014
Repu
blic
of
Mol
dova
herb
indo
ors
41.0
0
2016
Rom
ania
herb
indo
ors
1,43
341
2016
Rom
ania
herb
outd
oors
6.99
42
2016
Russ
ian
Fede
ratio
nhe
rbou
tdoo
rs7.
61 a
7.61
0.00
68.6
41,
143
2016
Russ
ian
Fede
ratio
nhe
rbin
door
s0.
6678
8
2015
Serb
iahe
rbou
tdoo
rs0.
05
2013
Sier
ra L
eone
herb
outd
oors
190.
0019
0.00
190
3
2016
Slov
akia
herb
indo
ors
385
2014
Slov
enia
herb
indo
ors
9,22
311
820
14Sl
oven
iahe
rbou
tdoo
rs1,
844
2015
Spai
nhe
rbin
door
s24
4,77
210
820
15Sp
ain
herb
outd
oors
135,
074
4420
14Su
dan
herb
outd
oors
8.00
a8.
000.
0034
5.00
2014
Swaz
iland
herb
outd
oors
1,50
0.00
1,06
9.50
430.
503,
000,
000
210
2014
Swed
enhe
rbin
door
s10
,000
5620
15Sw
eden
herb
outd
oors
182.
0020
16Sw
itzer
land
herb
indo
ors
11,3
8683
2012
Tajik
ista
nhe
rbou
tdoo
rs2,
180,
121
2016
Thai
land
herb
outd
oors
1.00
a1.
000.
007.
501
2015
Trin
idad
and
Tob
ago
herb
outd
oors
0.31
375,
925
5820
12U
gand
ahe
rbou
tdoo
rs15
0.00
88.0
062
.00
520
16U
krai
nehe
rbou
tdoo
rs91
.00
a91
.00
0.00
2016
Uni
ted
Stat
es
of A
mer
ica
herb
indo
ors
406,
125
1,86
5
2016
Uni
ted
Stat
es
of A
mer
ica
herb
outd
oors
4,94
0,59
65,
513
2016
Uru
guay
herb
indo
ors
661
2016
Uzb
ekis
tan
herb
outd
oors
0.20
a0.
200.
0058
620
15V
iet
Nam
herb
oudo
ors
1.00
Sour
ce:
Uni
ted
Nat
ions
Off
ice
on D
rugs
and
Crim
e an
nual
rep
ort
ques
tionn
aire
, go
vern
men
t re
port
s an
d an
d in
tern
atio
nal n
arco
tics
cont
rol s
trat
egy
repo
rts
of t
he U
nite
d St
ates
of
Am
eric
a.a
Are
a id
entif
ied
by t
he a
utho
ritie
s fo
r er
adic
atio
n.


59
GLOSSARY
amphetamine-type stimulants — a group of substances composed of synthetic stimulants controlled under the Convention on Psychotropic Substances of 1971 and from the group of substances called amphetamines, which includes amphetamine, methamphetamine, methcathinone and the “ecstasy”-group substances (3,4-methylenedioxymethamphetamine (MDMA) and its analogues).amphetamines — a group of amphetamine-type stimulants that includes amphetamine and methamphetamine.annual prevalence — the total number of people of a given age range who have used a given drug at least once in the past year, divided by the number of people of the given age range, and expressed as a percentage.coca paste (or coca base) — an extract of the leaves of the coca bush. Purification of coca paste yields cocaine (base and hydrochloride).“crack” cocaine — cocaine base obtained from cocaine hydrochloride through conversion processes to make it suitable for smoking.cocaine salt — cocaine hydrochloride.drug use — use of controlled psychoactive substances for non-medical and non-scientific purposes, unless otherwise specified.new psychoactive substances — substances of abuse, either in a pure form or a preparation, that are not controlled under the Single Convention on Narcotic Drugs of 1961 or the 1971 Convention, but that may pose a public health threat. In this context, the term “new” does not necessarily refer to new inventions but to substances that have recently become available.opiates — a subset of opioids comprising the various products derived from the opium poppy plant, includ-ing opium, morphine and heroin.opioids — a generic term applied to alkaloids from opium poppy (opiates), their synthetic analogues (mainly prescription or pharmaceutical opioids) and compounds synthesized in the body.problem drug users — people who engage in the high-risk consumption of drugs; for example, people who inject drugs, people who use drugs on a daily basis
and/or people diagnosed with drug use disorders (harmful use or drug dependence), based on clinical criteria as contained in the Diagnostic and Statistical Manual of Mental Disorders (fifth edition) of the American Psychiatric Association, or the International Classification of Diseases and Related Health Problems (tenth revision) of the World Health Organization. people who suffer from drug use disorders/people with drug use disorders — a subset of people who use drugs. People with drug use disorders need treatment, health and social care and rehabilitation. Harmful use of sub-stances and dependence are features of drug use disorders. harmful use of substances — defined in the International Statistical Classification of Diseases and Related Health Problems (tenth revision) as a pattern of use that causes damage to physical or mental health.dependence — defined in the International Statistical Classification of Diseases and Related Health Problems (tenth revision) as a cluster of physiological, behav-ioural and cognitive phenomena in which the use of a substance or a class of substances takes on a much higher priority for a given individual than other behav-iours that once had greater value. A central descriptive characteristic of dependence syndrome is the desire (often strong, sometimes overpowering) to take psy-choactive drugs.substance or drug use disorders — the Diagnostic and Statistical Manual of Mental Disorders (fifth edition) of the American Psychiatric Association also refers to “drug or substance use disorder” as patterns of symp-toms resulting from the use of a substance despite experiencing problems as a result of using substances. Depending on the number of symptoms identified, substance use disorder may vary from moderate to severe.prevention of drug use and treatment of drug use disorders — the aim of “prevention of drug use” is to prevent or delay the initiation of drug use, as well as the tran-sition to drug use disorders. Once a person develops a drug use disorder, treatment, care and rehabilitation are needed.
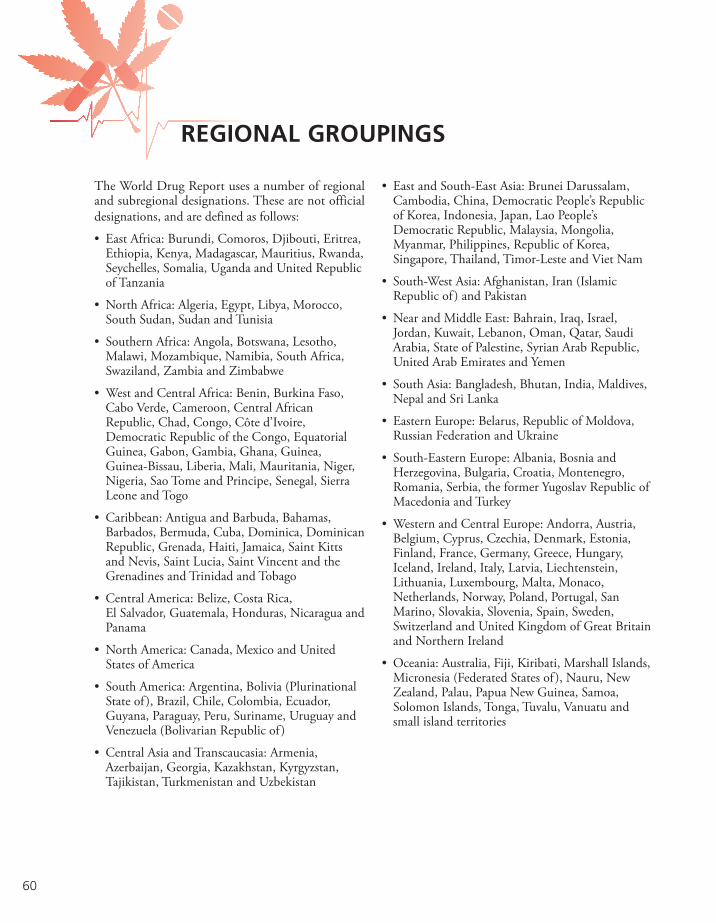
60
REGIONAL GROUPINGS
• East and South-East Asia: Brunei Darussalam, Cambodia, China, Democratic People’s Republic of Korea, Indonesia, Japan, Lao People’s Democratic Republic, Malaysia, Mongolia, Myanmar, Philippines, Republic of Korea, Singapore, Thailand, Timor-Leste and Viet Nam
• South-West Asia: Afghanistan, Iran (Islamic Republic of ) and Pakistan
• Near and Middle East: Bahrain, Iraq, Israel, Jordan, Kuwait, Lebanon, Oman, Qatar, Saudi Arabia, State of Palestine, Syrian Arab Republic, United Arab Emirates and Yemen
• South Asia: Bangladesh, Bhutan, India, Maldives, Nepal and Sri Lanka
• Eastern Europe: Belarus, Republic of Moldova, Russian Federation and Ukraine
• South-Eastern Europe: Albania, Bosnia and Herzegovina, Bulgaria, Croatia, Montenegro, Romania, Serbia, the former Yugoslav Republic of Macedonia and Turkey
• Western and Central Europe: Andorra, Austria, Belgium, Cyprus, Czechia, Denmark, Estonia, Finland, France, Germany, Greece, Hungary, Iceland, Ireland, Italy, Latvia, Liechtenstein, Lithuania, Luxembourg, Malta, Monaco, Netherlands, Norway, Poland, Portugal, San Marino, Slovakia, Slovenia, Spain, Sweden, Switzerland and United Kingdom of Great Britain and Northern Ireland
• Oceania: Australia, Fiji, Kiribati, Marshall Islands, Micronesia (Federated States of ), Nauru, New Zealand, Palau, Papua New Guinea, Samoa, Solomon Islands, Tonga, Tuvalu, Vanuatu and small island territories
The World Drug Report uses a number of regional and subregional designations. These are not official designations, and are defined as follows:
• East Africa: Burundi, Comoros, Djibouti, Eritrea, Ethiopia, Kenya, Madagascar, Mauritius, Rwanda, Seychelles, Somalia, Uganda and United Republic of Tanzania
• North Africa: Algeria, Egypt, Libya, Morocco, South Sudan, Sudan and Tunisia
• Southern Africa: Angola, Botswana, Lesotho, Malawi, Mozambique, Namibia, South Africa, Swaziland, Zambia and Zimbabwe
• West and Central Africa: Benin, Burkina Faso, Cabo Verde, Cameroon, Central African Republic, Chad, Congo, Côte d’Ivoire, Democratic Republic of the Congo, Equatorial Guinea, Gabon, Gambia, Ghana, Guinea, Guinea-Bissau, Liberia, Mali, Mauritania, Niger, Nigeria, Sao Tome and Principe, Senegal, Sierra Leone and Togo
• Caribbean: Antigua and Barbuda, Bahamas, Barbados, Bermuda, Cuba, Dominica, Dominican Republic, Grenada, Haiti, Jamaica, Saint Kitts and Nevis, Saint Lucia, Saint Vincent and the Grenadines and Trinidad and Tobago
• Central America: Belize, Costa Rica, El Salvador, Guatemala, Honduras, Nicaragua and Panama
• North America: Canada, Mexico and United States of America
• South America: Argentina, Bolivia (Plurinational State of ), Brazil, Chile, Colombia, Ecuador, Guyana, Paraguay, Peru, Suriname, Uruguay and Venezuela (Bolivarian Republic of )
• Central Asia and Transcaucasia: Armenia, Azerbaijan, Georgia, Kazakhstan, Kyrgyzstan, Tajikistan, Turkmenistan and Uzbekistan

9 789211 483048
ISBN 978-92-1-148304-8
Following last year’s 20th anniversary edition, the World Drug Report 2018 is again presented in a special five-booklet format designed to enhance reader friendliness while maintaining the wealth of information contained within.
Booklet 1 summarizes the content of the four subsequent substantive booklets and presents policy implications drawn from their findings. Booklet 2 provides a global overview of the latest estimates of and trends in the supply, use and health consequences of drugs. Booklet 3 examines current estimates of and trends in the cultivation, production and consumption of the three plant-based drugs (cocaine, opiates and cannabis), reviews the latest developments in cannabis policies and provides an analysis of the global synthetic drugs market, including new psychoactive substances. Booklet 4 looks at the extent of drug use across age groups, particularly among young and older people, by reviewing the risks and vulnerabilities to drug use in young people, the health and social consequences they experience and their role in drug supply, as well as highlighting issues related to the health care needs of older people who use drugs. Finally, Booklet 5 focuses on the specific issues related to drug use among women, including the social and health consequences of drug use and access to treatment by women with drug use disorders; it also discusses the role played by women in the drug supply chain.
Like all previous editions, the World Drug Report 2018 is aimed at improving the understanding of the world drug problem and contributing towards fostering greater international cooperation for countering its impact on health and security.
The statistical annex is published on the UNODC website: https://www.unodc.org/wdr2018


![The Body (2009) Guide to HIV Drug Resistance [booklet]](https://static.fdocuments.in/doc/165x107/61fb4ea02e268c58cd5c9e30/the-body-2009-guide-to-hiv-drug-resistance-booklet.jpg)