
Global Ocean Monitoring: Recent Evolution, Current … · 12/7/2018 · Global Ocean Monitoring:...
61
Global Ocean Monitoring: Recent Evolution, Current Status, and Predictions Prepared by Climate Prediction Center, NCEP/NOAA August 9, 2018 http://www.cpc.ncep.noaa.gov/products/GODAS/ This project to deliver real-time ocean monitoring products is implemented by CPC in cooperation with NOAA's Ocean Observing and Monitoring Division (OOMD)
Transcript of Global Ocean Monitoring: Recent Evolution, Current … · 12/7/2018 · Global Ocean Monitoring:...

Global Ocean Monitoring: Recent Evolution, Current Status, and
Predictions
Prepared by
Climate Prediction Center, NCEP/NOAA
August 9, 2018
http://www.cpc.ncep.noaa.gov/products/GODAS/ This project to deliver real-time ocean monitoring products is implemented
by CPC in cooperation with NOAA's Ocean Observing and Monitoring Division (OOMD)

Outline
• Overview
• Recent highlights
– Pacific/Arctic Ocean
– Indian Ocean
– Atlantic Ocean
– Global SST Predictions
• TIW-related Sea Surface Salinity(SSS) signals observed from the new CPC pentad SSS product
• ENSO conditions compared with historical events and predictions
• AMO-related North Atlantic temperature and Ocean Heat Content 2

Overview Pacific Ocean
ENSO-neutral conditions continued in Jul 2018.
Positive subsurface anomaly weakened along the thermocline in
the equatorial central-eastern Pacific.
NOAA “ENSO Diagnostic Discussion” continuously issue El Nino
watch on 9 Aug 2018.
SST-based PDO switched to a positive phase in July 2018, while
heat content-based PDO continued in negative phase.
Indian Ocean
Negative SSTAs dominated across the equatorial Indian Ocean.
Atlantic Ocean
NOAA 2018 Atlantic Hurricane Season Outlook revision suggest
the chance of below-normal Atlantic hurricane season is 60%.
Positive NAO has persisted since Apr 2018 with NAOI=+1.4 in
July 2018.
The North Atlantic “cold blob” in 2014-16 was comparable to that
before 1996, and its strength weakened substantially during
2017-18.
3

Global Oceans
4

Global SST Anomaly (0C) and Anomaly Tendency
Fig. G1. Sea surface temperature anomalies (top) and anomaly tendency (bottom). Data are derived from the
NCEP OI SST analysis, and anomalies are departures from the 1981-2010 base period means.
- SST were slightly above average across most of the Eq. Pacific and eastern Eq. Atlantic oceans.
- Strong positive SSTAs persisted in
the western N. Pacific.
- Horseshoe/tripole-like SSTA
pattern continued in the N. Atlantic.
- SSTAs were small in the tropical Indian Ocean.
- Positive SSTA tendencies dominated near the central-eastern equatorial Pacific.
- Negative SSTA tendencies
were seen in the NW Pacific and NW Atlantic.
5
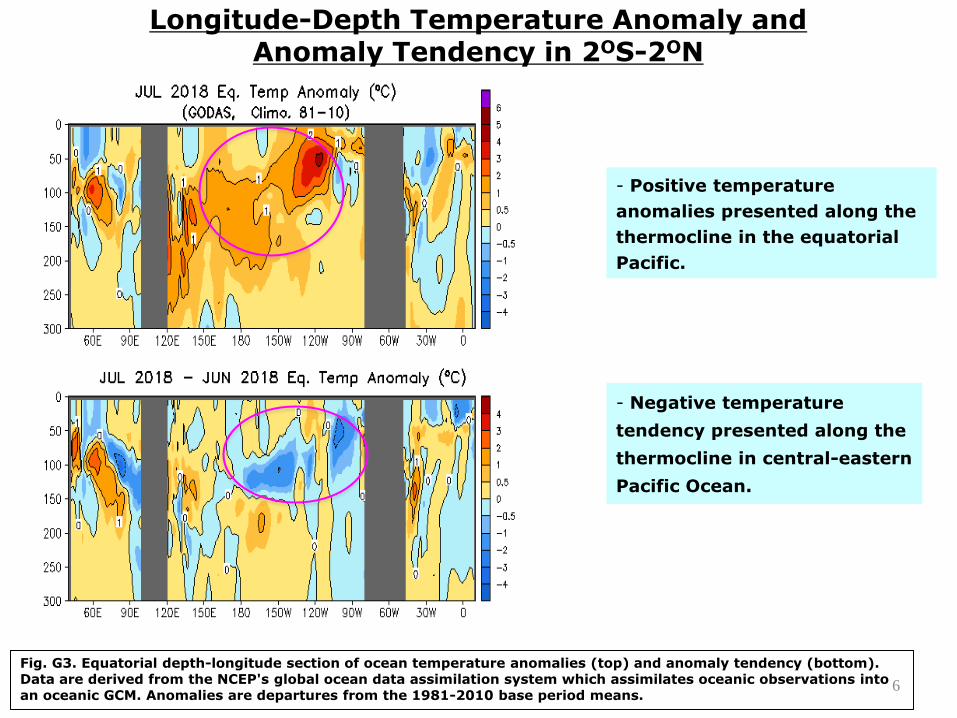
- Positive temperature
anomalies presented along the
thermocline in the equatorial
Pacific.
Longitude-Depth Temperature Anomaly and Anomaly Tendency in 2OS-2ON
Fig. G3. Equatorial depth-longitude section of ocean temperature anomalies (top) and anomaly tendency (bottom).
Data are derived from the NCEP's global ocean data assimilation system which assimilates oceanic observations into
an oceanic GCM. Anomalies are departures from the 1981-2010 base period means.
- Negative temperature
tendency presented along the
thermocline in central-eastern
Pacific Ocean.
6
Tropical Pacific Ocean and ENSO Conditions
7

• Negative (positive) SSS anomaly
presented west (east )of 140E
during 2010, 2011, 2016,2017 La
Nina events.
• Strong positive (negative) SSS
anomaly presented west (east) of
160E during 2015 El Nino events
• Negative SSS anomaly continued in
the far western Pacific in Jul 2018.
NOTE: Since June 2015, the Blended Analysis of
Surface Salinity (BASS) SSS is from in situ, SMOS
and SMAP; before June 2015, BASS SSS is from in
situ, SMOS and Aquarius.
Monthly Sea Surface Salinity (SSS) Anomaly across Equatorial Pacific
SSS anomaly [5S-5N]
8
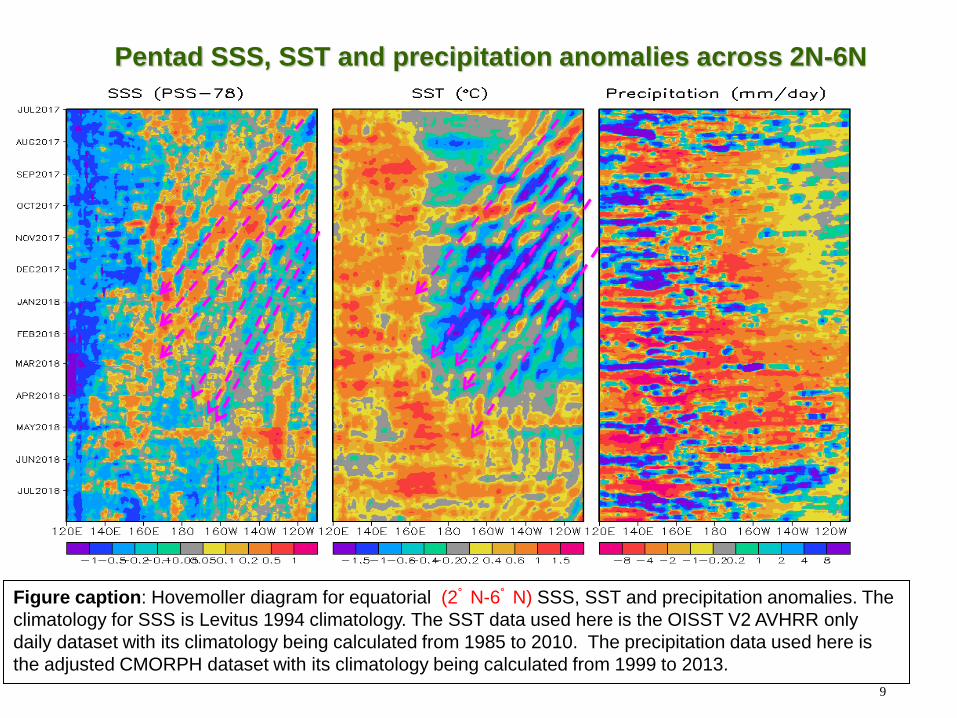
Pentad SSS, SST and precipitation anomalies across 2N-6N
Figure caption: Hovemoller diagram for equatorial (2°N-6°N) SSS, SST and precipitation anomalies. The
climatology for SSS is Levitus 1994 climatology. The SST data used here is the OISST V2 AVHRR only
daily dataset with its climatology being calculated from 1985 to 2010. The precipitation data used here is
the adjusted CMORPH dataset with its climatology being calculated from 1999 to 2013.
9

TIW-related SSS and SST anomalies
Seasonal TIW-related SST variance 0-4N
(Adapted from Wen et al. 2012)
- The new CPC pentad SSS product is
able to capture meso-scale dynamical
features on sub-monthly time scale.
11
Wen,C, Y.Xue, A.Kumar, 2012: Ocean–Atmosphere Characteristics of Tropical Instability Waves
Simulated in the NCEP Climate Forecast System Reanalysis. J. Climate, 25, 6409–6425.
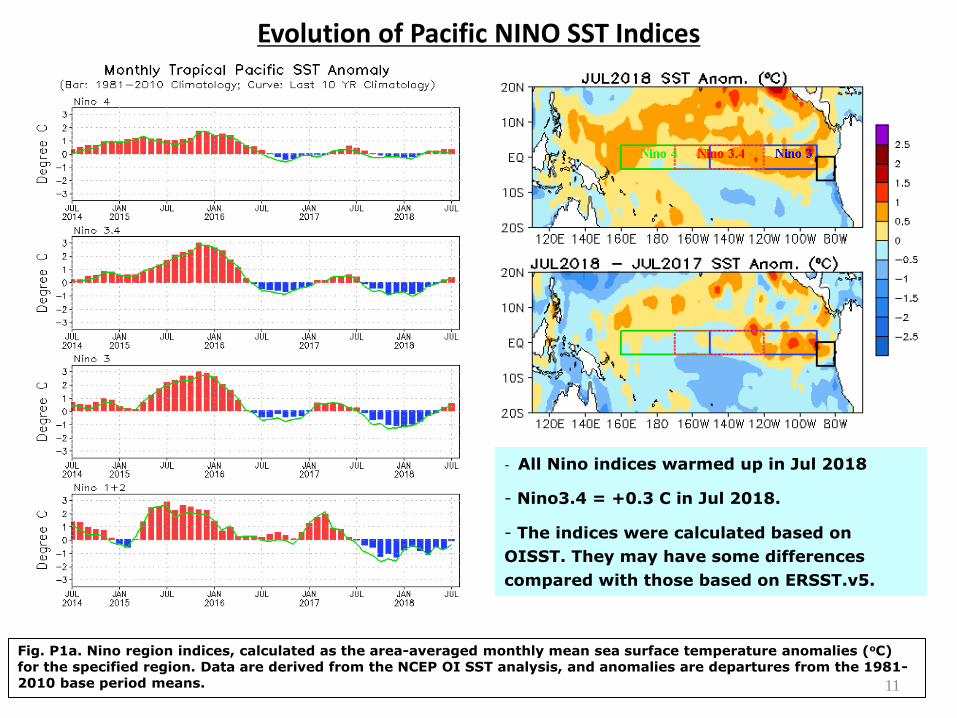
Evolution of Pacific NINO SST Indices
- All Nino indices warmed up in Jul 2018
- Nino3.4 = +0.3 C in Jul 2018.
- The indices were calculated based on
OISST. They may have some differences
compared with those based on ERSST.v5.
Fig. P1a. Nino region indices, calculated as the area-averaged monthly mean sea surface temperature anomalies (oC)
for the specified region. Data are derived from the NCEP OI SST analysis, and anomalies are departures from the 1981-2010 base period means. 11
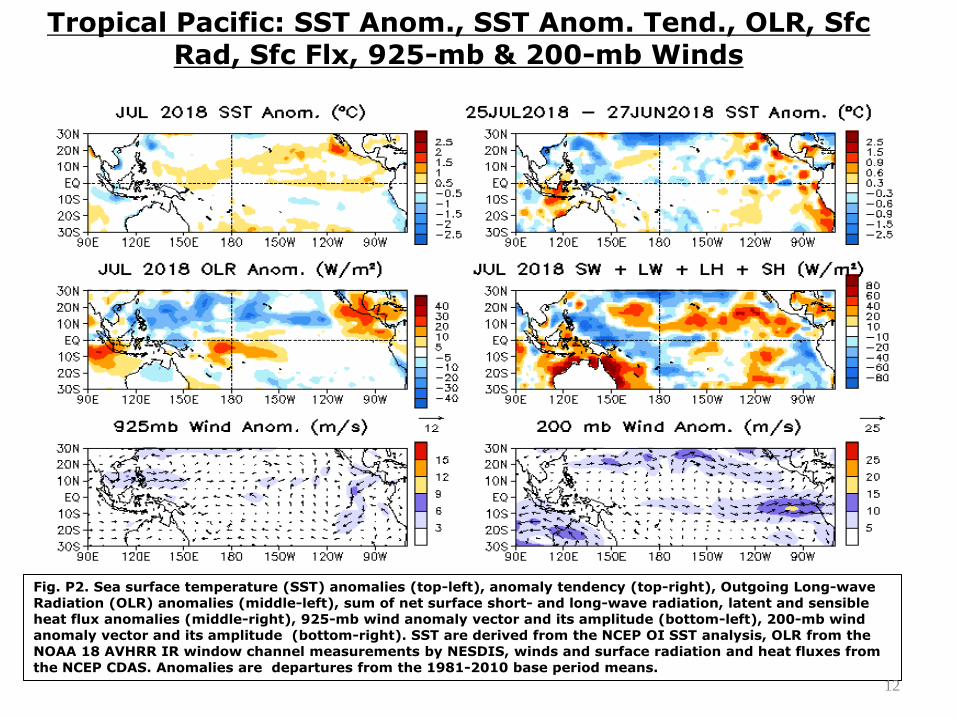
Tropical Pacific: SST Anom., SST Anom. Tend., OLR, Sfc Rad, Sfc Flx, 925-mb & 200-mb Winds
Fig. P2. Sea surface temperature (SST) anomalies (top-left), anomaly tendency (top-right), Outgoing Long-wave
Radiation (OLR) anomalies (middle-left), sum of net surface short- and long-wave radiation, latent and sensible
heat flux anomalies (middle-right), 925-mb wind anomaly vector and its amplitude (bottom-left), 200-mb wind
anomaly vector and its amplitude (bottom-right). SST are derived from the NCEP OI SST analysis, OLR from the
NOAA 18 AVHRR IR window channel measurements by NESDIS, winds and surface radiation and heat fluxes from
the NCEP CDAS. Anomalies are departures from the 1981-2010 base period means.
12
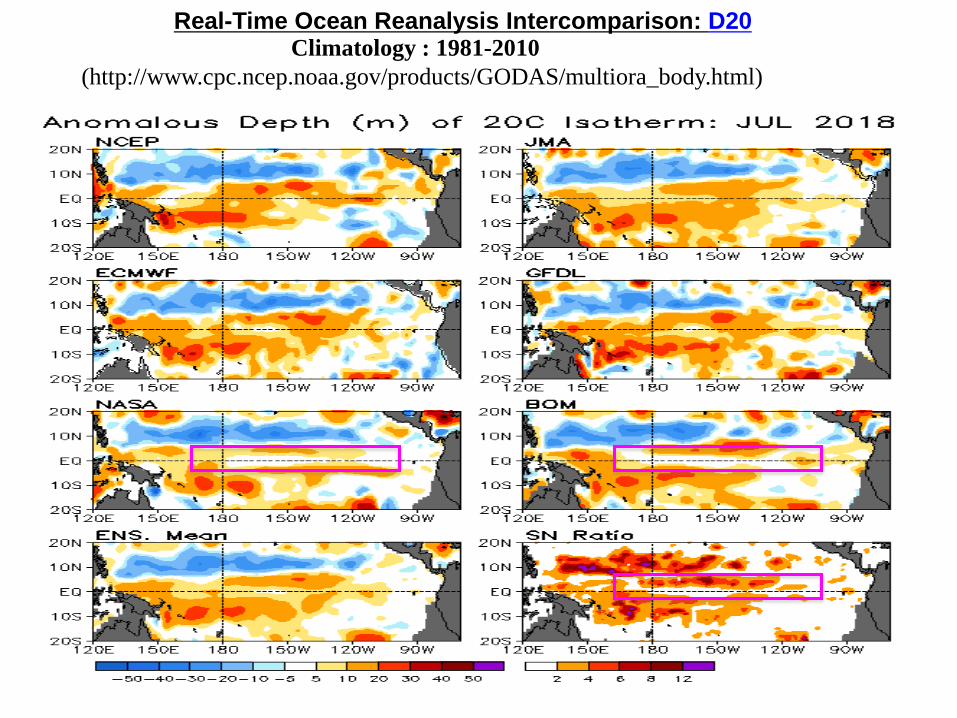
Climatology : 1981-2010
(http://www.cpc.ncep.noaa.gov/products/GODAS/multiora_body.html)
Real-Time Ocean Reanalysis Intercomparison: D20
13

Evolution of Equatorial Pacific Surface Zonal Current Anomaly (cm/s)
-Westward
anomalous currents
dominated in the
central-eastern
Pacific in Jul 2018.
14

NINO3.4 Heat Budget
Huang, B., Y. Xue, X. Zhang, A. Kumar, and M. J. McPhaden, 2010 : The NCEP GODAS ocean analysis of the tropical Pacific mixed layer heat budget on seasonal to interannual time scales, J. Climate., 23, 4901-4925.
Qu: Zonal advection; Qv: Meridional advection;
Qw: Vertical entrainment; Qzz: Vertical diffusion
Qq: (Qnet - Qpen + Qcorr)/ρcph; Qnet = SW + LW + LH +SH;
Qpen: SW penetration; Qcorr: Flux correction due to relaxation to OI SST
- Observed SSTA tendencies
(dT/dt; dotted black line) switched to negative in the second half of Jul 2018. - Zonal advection (Qu) was negative and the rest of dynamical terms (Qv, Qw+Qzz) remained positive.
15 15
16
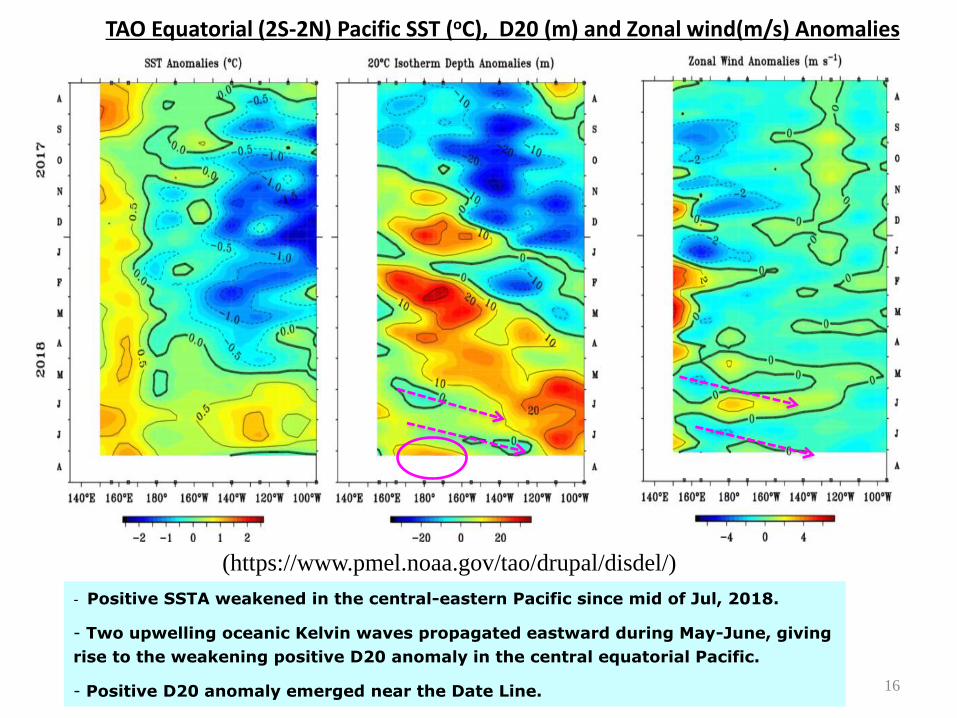
TAO Equatorial (2S-2N) Pacific SST (oC), D20 (m) and Zonal wind(m/s) Anomalies
(https://www.pmel.noaa.gov/tao/drupal/disdel/)
- Positive SSTA weakened in the central-eastern Pacific since mid of Jul, 2018.
- Two upwelling oceanic Kelvin waves propagated eastward during May-June, giving
rise to the weakening positive D20 anomaly in the central equatorial Pacific.
- Positive D20 anomaly emerged near the Date Line.
17
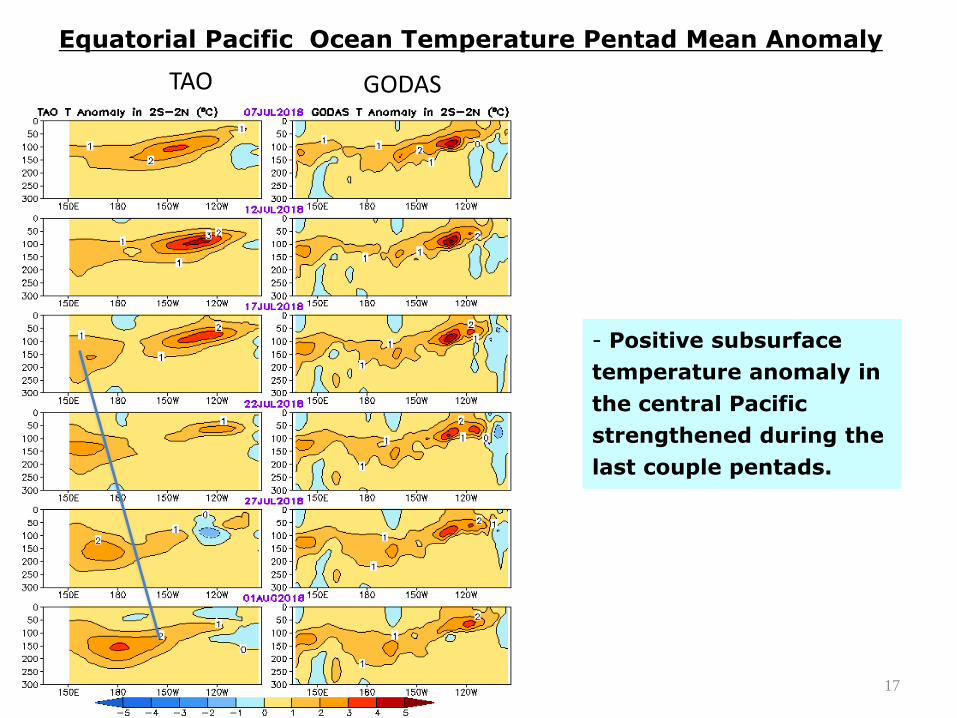
Equatorial Pacific Ocean Temperature Pentad Mean Anomaly
TAO GODAS
- Positive subsurface
temperature anomaly in
the central Pacific
strengthened during the
last couple pentads.
North Pacific & Arctic Oceans
18

19
Last Three Month SST, SLP and 925hp Wind Anomalies
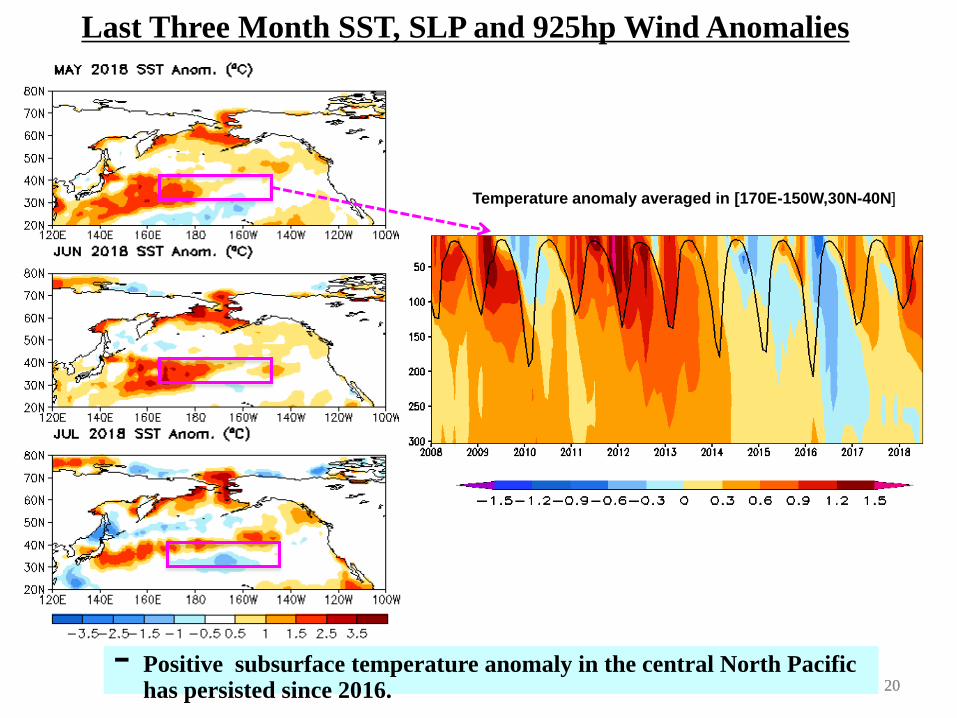
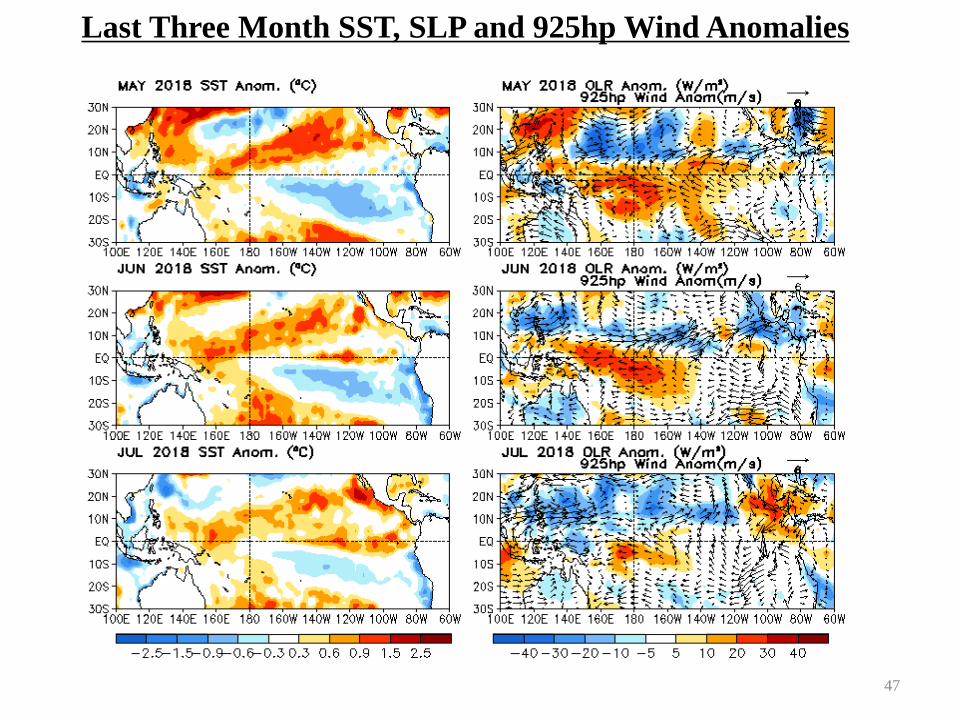
- Distribution of SST anomalies between 20°-50°N varied month by month, owing to the high frequency changes in the atmospheric circulation. 19
20
Last Three Month SST, SLP and 925hp Wind Anomalies
- Positive subsurface temperature anomaly in the central North Pacific has persisted since 2016.
Temperature anomaly averaged in [170E-150W,30N-40N]
20
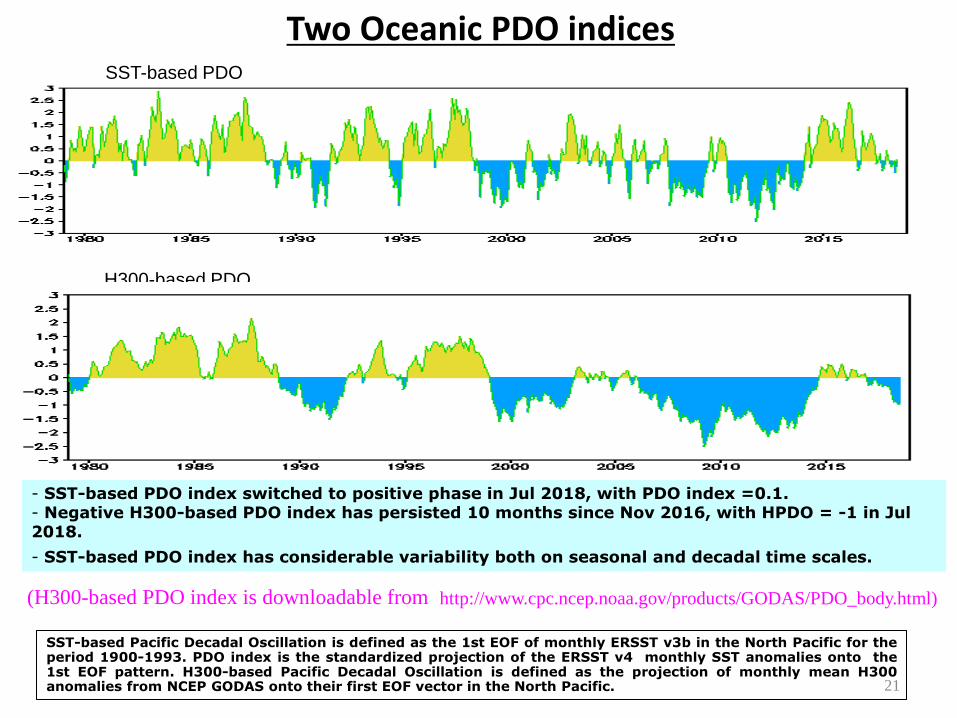
Two Oceanic PDO indices
SST-based Pacific Decadal Oscillation is defined as the 1st EOF of monthly ERSST v3b in the North Pacific for the period 1900-1993. PDO index is the standardized projection of the ERSST v4 monthly SST anomalies onto the 1st EOF pattern. H300-based Pacific Decadal Oscillation is defined as the projection of monthly mean H300 anomalies from NCEP GODAS onto their first EOF vector in the North Pacific.
- SST-based PDO index switched to positive phase in Jul 2018, with PDO index =0.1. - Negative H300-based PDO index has persisted 10 months since Nov 2016, with HPDO = -1 in Jul 2018.
- SST-based PDO index has considerable variability both on seasonal and decadal time scales.
21
SST-based PDO
H300-based PDO
(H300-based PDO index is downloadable from http://www.cpc.ncep.noaa.gov/products/GODAS/PDO_body.html)
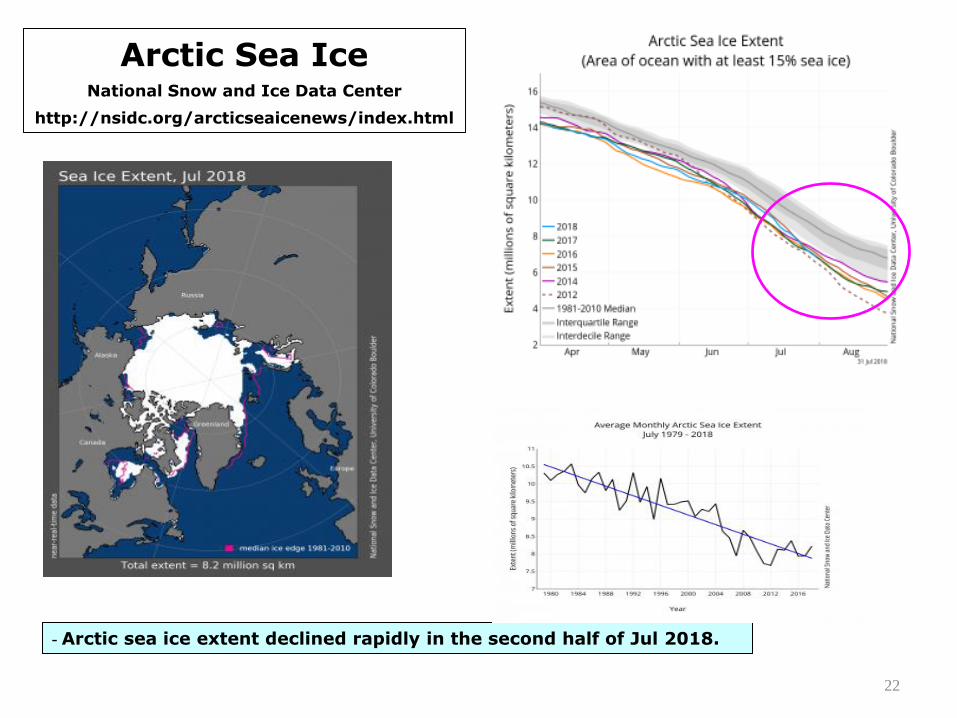
Arctic Sea Ice National Snow and Ice Data Center
http://nsidc.org/arcticseaicenews/index.html
- Arctic sea ice extent declined rapidly in the second half of Jul 2018.
22
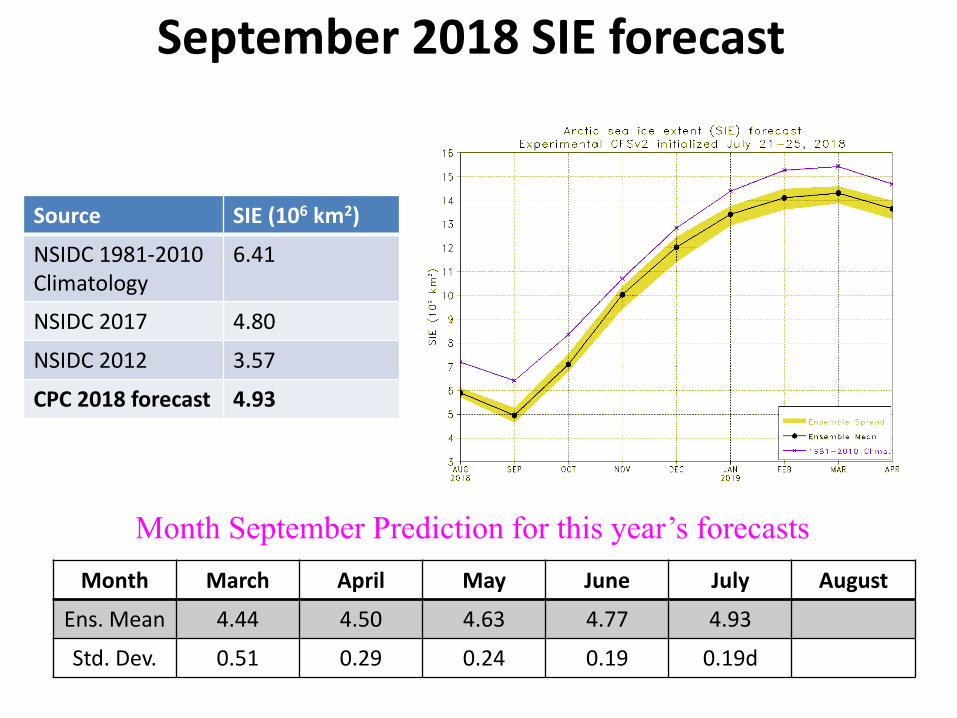
September 2018 SIE forecast
Source SIE (106 km2)
NSIDC 1981-2010 Climatology
6.41
NSIDC 2017 4.80
NSIDC 2012 3.57
CPC 2018 forecast 4.93
Month March April May June July August
Ens. Mean 4.44 4.50 4.63 4.77 4.93
Std. Dev. 0.51 0.29 0.24 0.19 0.19d
Month to Month September Prediction for this year’s forecasts

Indian Ocean
24
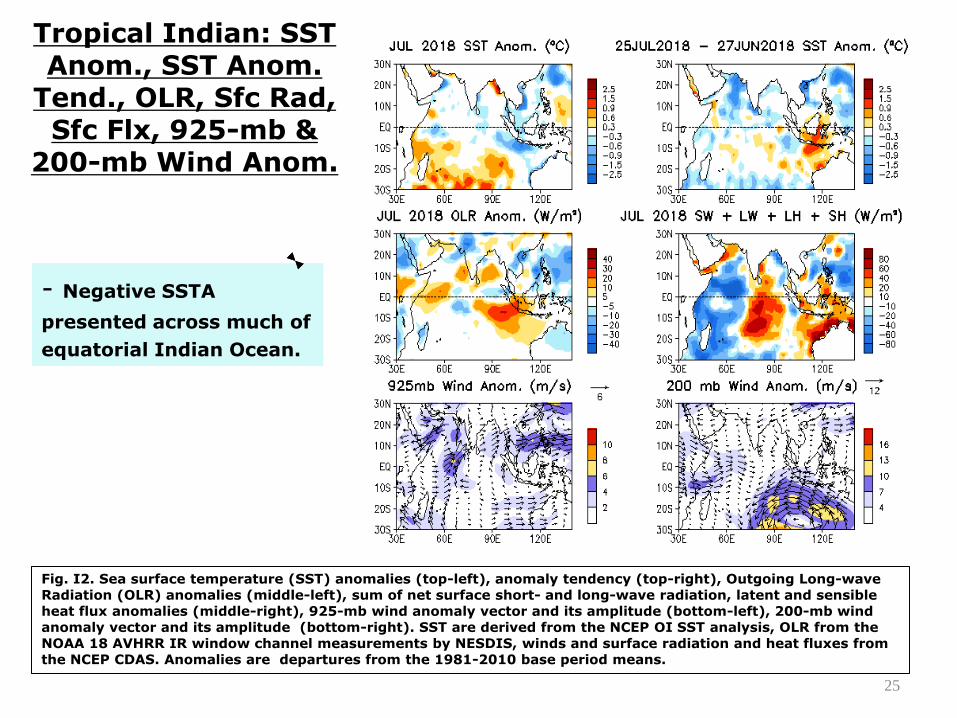
- Negative SSTA
presented across much of
equatorial Indian Ocean.
Tropical Indian: SST Anom., SST Anom.
Tend., OLR, Sfc Rad, Sfc Flx, 925-mb &
200-mb Wind Anom.
Fig. I2. Sea surface temperature (SST) anomalies (top-left), anomaly tendency (top-right), Outgoing Long-wave
Radiation (OLR) anomalies (middle-left), sum of net surface short- and long-wave radiation, latent and sensible
heat flux anomalies (middle-right), 925-mb wind anomaly vector and its amplitude (bottom-left), 200-mb wind
anomaly vector and its amplitude (bottom-right). SST are derived from the NCEP OI SST analysis, OLR from the
NOAA 18 AVHRR IR window channel measurements by NESDIS, winds and surface radiation and heat fluxes from
the NCEP CDAS. Anomalies are departures from the 1981-2010 base period means.
25
Tropical and North Atlantic Ocean
26

Evolution of Tropical Atlantic SST Indices
Fig. A1a. Tropical Atlantic Variability region indices, calculated as the area-averaged monthly mean sea surface
temperature anomalies (ºC) for the TNA [60ºW-30ºW, 5ºN-20ºN], TSA [30ºW-10ºE, 20ºS-0] and ATL3 [20ºW-0,
2.5ºS-2.5ºN] regions, and Meridional Gradient Index, defined as differences between TNA and TSA. Data are derived from the NCEP OI SST analysis, and anomalies are departures from the 1981-2010 base period means.
- Both negative TNA and the gradient
mode (TNA-TSA) weakened slightly in
Jul 2018.
- The SST in the eastern tropical N
Atlantic in Jul 2018 was about 2 degree
colder than that in Jul 2017 .
27
MM

28
Tropical Atlantic:
SST, SST Anom. Tend., OLR, Sfc Rad, Sfc Flx, TCHP, 925-mb/200-mb Winds anom.
28

2018 Atlantic Hurricane Season Outlook Update
29
Atlantic 2018 prediction
(issued on May 24)
Updated on Aug 9
1981-2010 Observations
(By Aug 9)
Named storms (10-16 ) 9-13 12 4
Hurricanes (5-9 ) 4-7 6 2
Major hurricanes (1-4 ) 0-2 3 0
https://en.wikipedia.org/wiki/2018_
Atlantic_hurricane_season
30
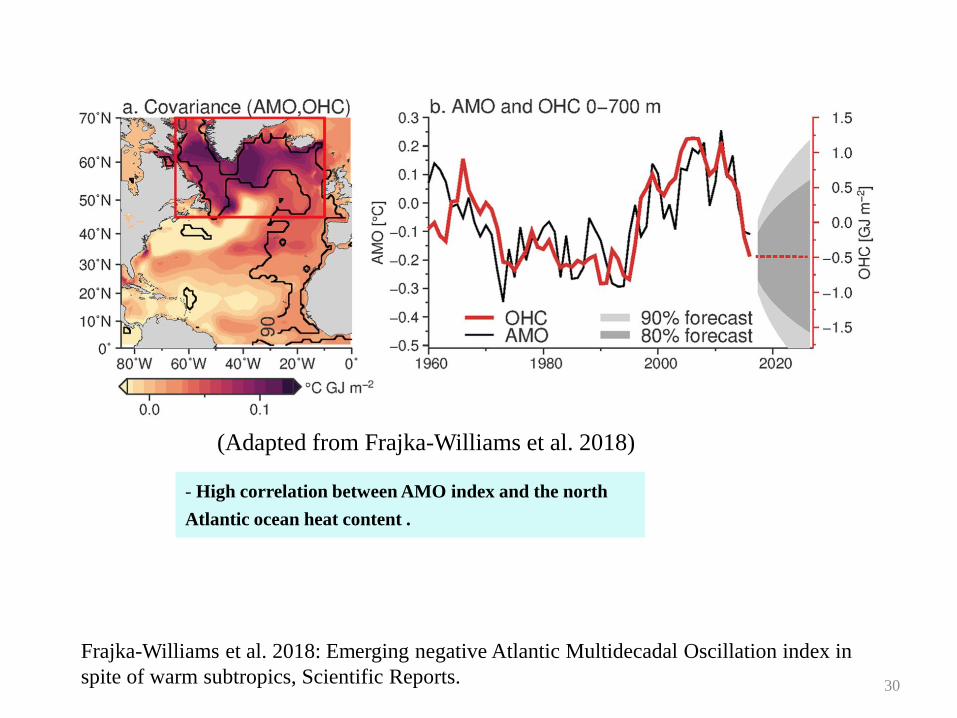
Frajka-Williams et al. 2018: Emerging negative Atlantic Multidecadal Oscillation index in
spite of warm subtropics, Scientific Reports.
- High correlation between AMO index and the north
Atlantic ocean heat content .
(Adapted from Frajka-Williams et al. 2018)

31
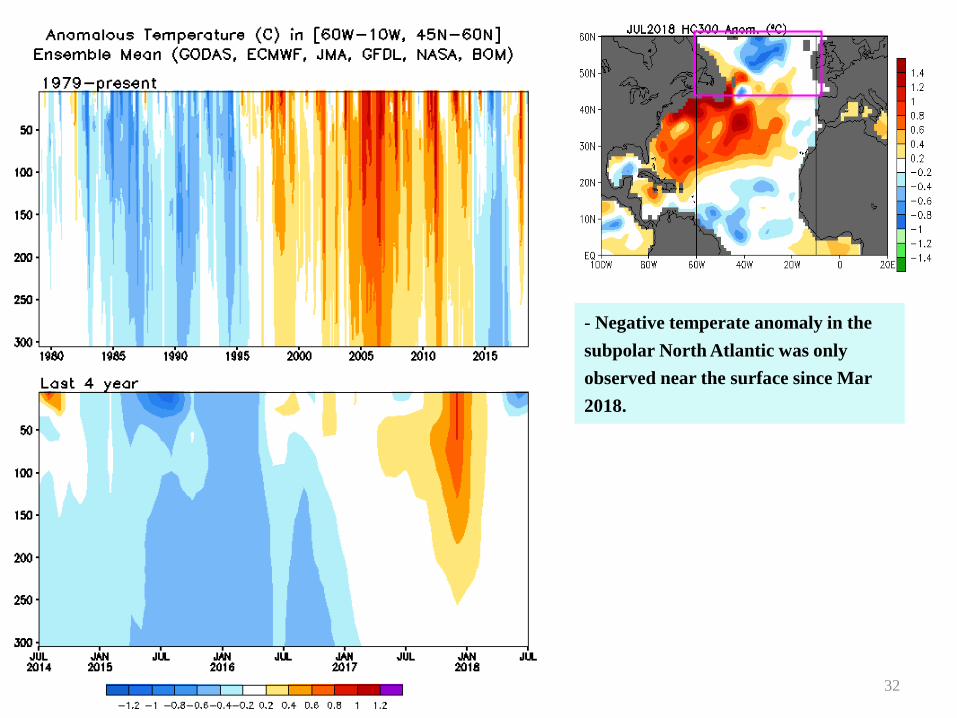
- HC300 anomaly has a
tripole/horseshoe pattern with positive
in the mid- latitudes and negative in
lower and higher latitudes.
-The “cold blob” in the subpolar gyre
in 2014-2016 was comparable to that
before 1996.
- The “cold blob” weakened
substantially during 2017-2018.
32
- Negative temperate anomaly in the
subpolar North Atlantic was only
observed near the surface since Mar
2018.

NAO and SST Anomaly in North Atlantic
Fig. NA2. Monthly standardized NAO index (top) derived from monthly standardized 500-mb height anomalies
obtained from the NCEP CDAS in 20ºN-90ºN (http://www.cpc.ncep.noaa.gov). Time-Latitude section of SST
anomalies averaged between 80ºW and 20ºW (bottom). SST are derived from the NCEP OI SST analysis, and
anomalies are departures from the 1981-2010 base period means.
- NAO was in a positive phase with
NAOI= +1.4 in Jul 2018.
- SSTA has a tripole/horseshoe pattern
with positive in the mid- latitudes and
negative in lower and higher latitudes,
which resembled the late 2014 and
2015 period.
33
ENSO and Global SST Predictions
34

- The majority of models favor El Nino development by early fall with about 65% chance.
- NOAA “ENSO Diagnostic Discussion” on 9 Aug 2018 continuously issue El Nino watch and state "There is ~60% chance of El Niño in the Northern Hemisphere fall 2018 (September-November), increasing to ~70% during winter 2018-19. ”
35

Individual Model Forecasts and Oceanic IC conditions
JMA: Nino3, IC/updated = 10 Jul 2018
36
Australia: Nino3.4, IC= 29 Jul 2018
- NASA, BOM ocean initial conditions had cold biases along the thermocline in the equatorial western-central Pacific, which are consistent with their ENSO-neutral predictions.
37
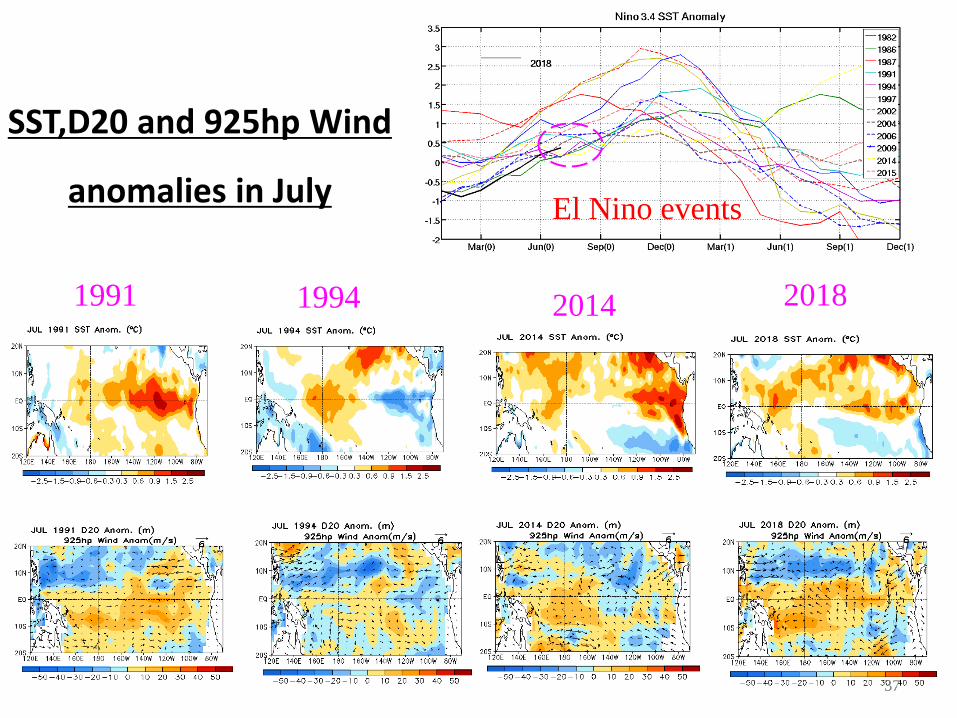
SST,D20 and 925hp Wind
anomalies in July
1991 1994 2014 2018
El Nino events
37

38
SST,D20 and 925hp Wind
anomalies in July
1992 1993 2012 2018
Neutral years
38

39
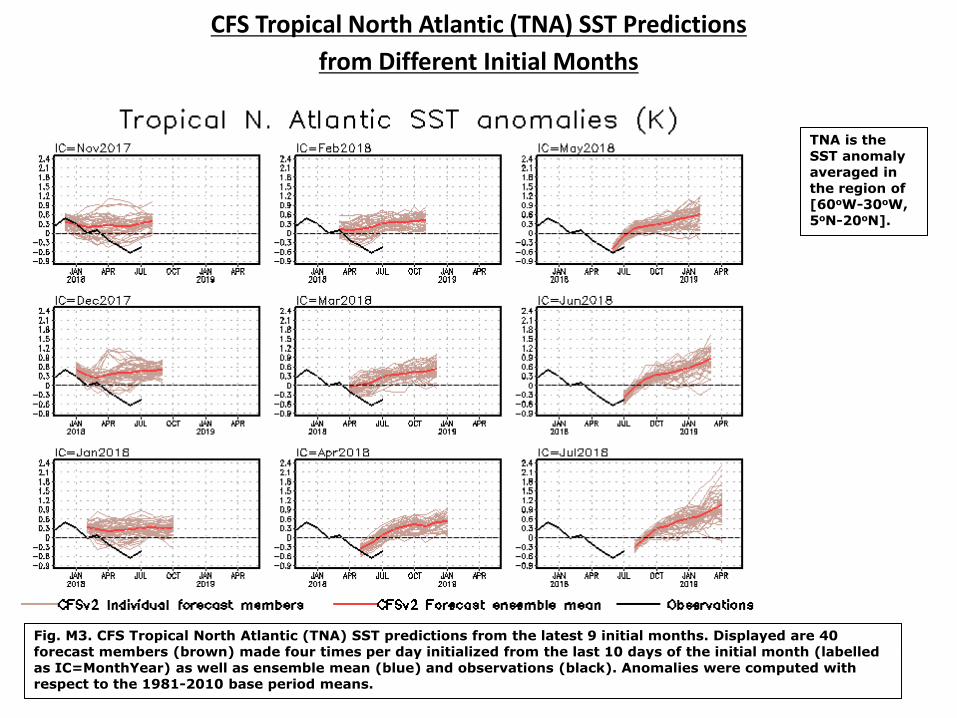
CFS Tropical North Atlantic (TNA) SST Predictions
from Different Initial Months
TNA is the
SST anomaly
averaged in
the region of
[60oW-30oW,
5oN-20oN].
Fig. M3. CFS Tropical North Atlantic (TNA) SST predictions from the latest 9 initial months. Displayed are 40
forecast members (brown) made four times per day initialized from the last 10 days of the initial month (labelled
as IC=MonthYear) as well as ensemble mean (blue) and observations (black). Anomalies were computed with
respect to the 1981-2010 base period means.
40
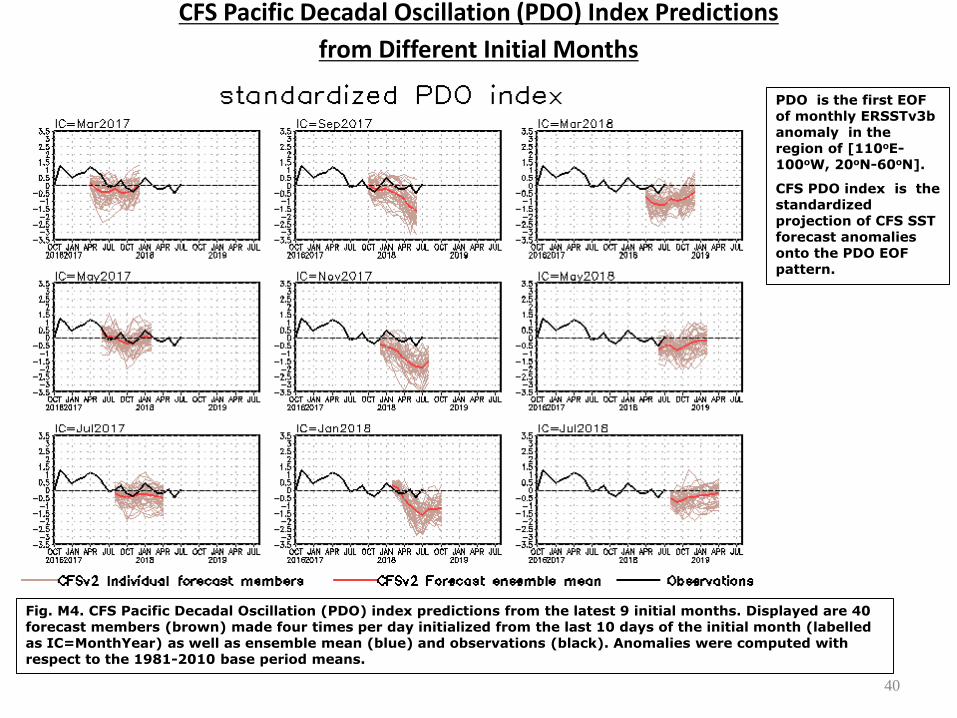
CFS Pacific Decadal Oscillation (PDO) Index Predictions
from Different Initial Months
PDO is the first EOF
of monthly ERSSTv3b
anomaly in the
region of [110oE-
100oW, 20oN-60oN].
CFS PDO index is the
standardized
projection of CFS SST
forecast anomalies
onto the PDO EOF
pattern.
Fig. M4. CFS Pacific Decadal Oscillation (PDO) index predictions from the latest 9 initial months. Displayed are 40
forecast members (brown) made four times per day initialized from the last 10 days of the initial month (labelled
as IC=MonthYear) as well as ensemble mean (blue) and observations (black). Anomalies were computed with
respect to the 1981-2010 base period means.

Acknowledgements
41
• Dr. Zeng-Zhen Hu and Arun Kumar: reviewed PPT, and
provided insight and constructive suggestions and comments
• Drs. Li Ren and Pingping Xie: Provided SSS slides
• Dr. Emily Becker: Provided NMME plot
• Dr. Wanqiu Wang: Provided Sea Ice prediction slides

Back up
42
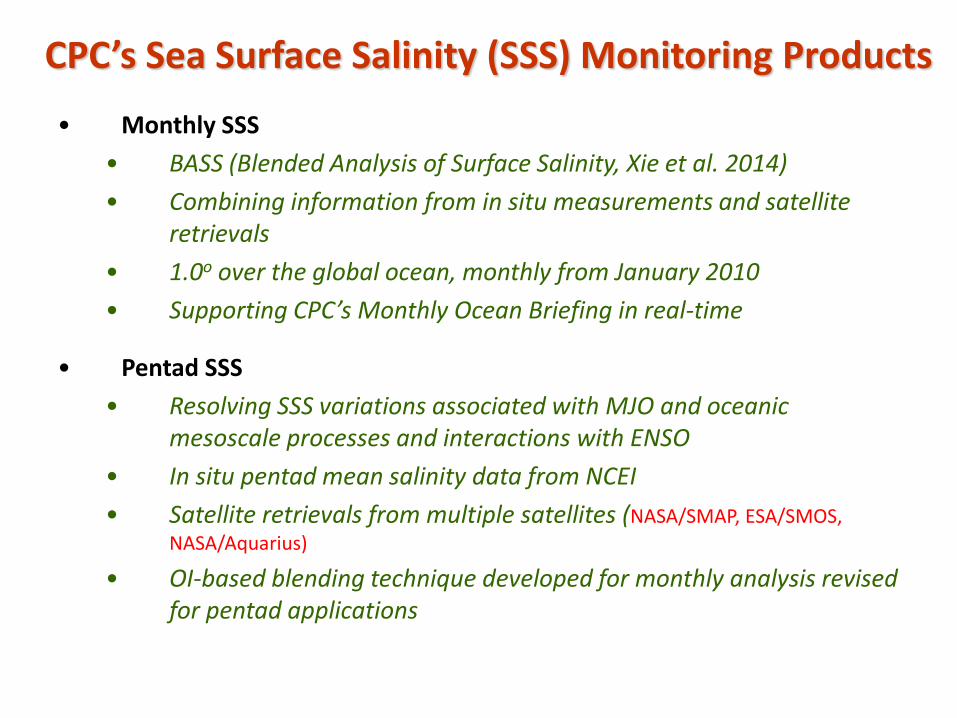
CPC’s Sea Surface Salinity (SSS) Monitoring Products
• Monthly SSS
• BASS (Blended Analysis of Surface Salinity, Xie et al. 2014)
• Combining information from in situ measurements and satellite retrievals
• 1.0o over the global ocean, monthly from January 2010
• Supporting CPC’s Monthly Ocean Briefing in real-time
• Pentad SSS
• Resolving SSS variations associated with MJO and oceanic mesoscale processes and interactions with ENSO
• In situ pentad mean salinity data from NCEI
• Satellite retrievals from multiple satellites (NASA/SMAP, ESA/SMOS,
NASA/Aquarius)
• OI-based blending technique developed for monthly analysis revised for pentad applications

Primary Features of the Pentad Global SSS Monitoring Package
• Refined Resolution
• daily updated pentad
• Spatial resolution kept at 1.0olat/lon due to restriction in inputs
• Reduced Production Latency
• 2 days after the ending date for each pentad
• Composed of SSS , E, P, and E-P
• SSS: BASS/Pentad (in situ – Satellite Blended Analysis)
• E: CFSR Evaporation adjusted against OAFlux
• P: Bias Corrected CMORPH satellite precipitation
estimates
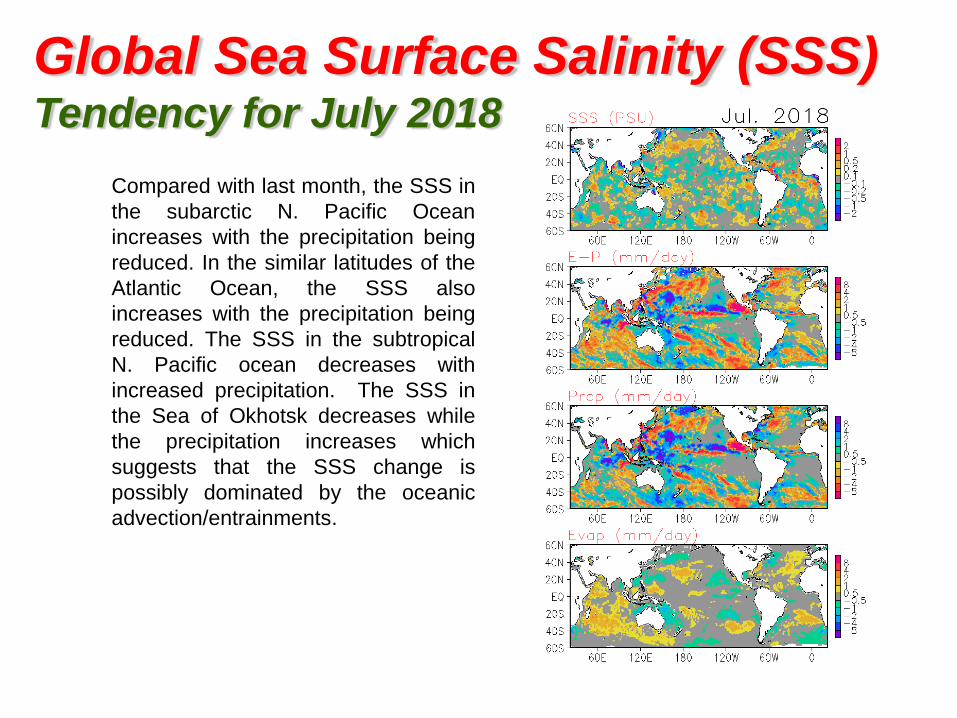
Compared with last month, the SSS in
the subarctic N. Pacific Ocean
increases with the precipitation being
reduced. In the similar latitudes of the
Atlantic Ocean, the SSS also
increases with the precipitation being
reduced. The SSS in the subtropical
N. Pacific ocean decreases with
increased precipitation. The SSS in
the Sea of Okhotsk decreases while
the precipitation increases which
suggests that the SSS change is
possibly dominated by the oceanic
advection/entrainments.
Global Sea Surface Salinity (SSS) Tendency for July 2018

Equatorial (2S-2N) Pacific SST (oC), Surface Zonal Wind (m/s) and HC300 (oC) Anomalies
46
47
Last Three Month SST, SLP and 925hp Wind Anomalies
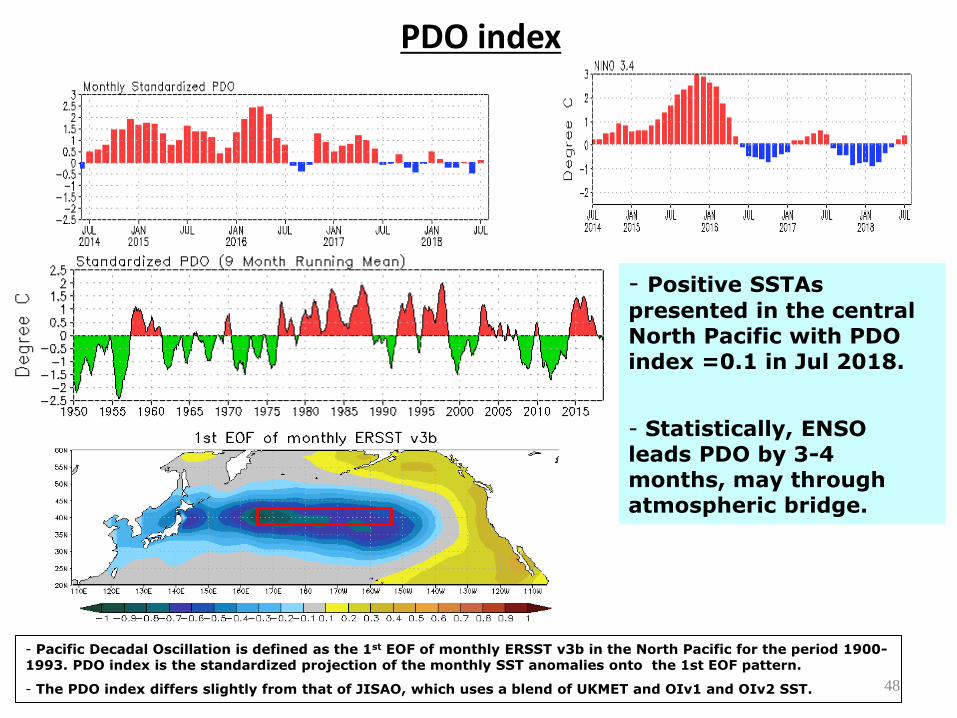
PDO index
- Pacific Decadal Oscillation is defined as the 1st EOF of monthly ERSST v3b in the North Pacific for the period 1900-1993. PDO index is the standardized projection of the monthly SST anomalies onto the 1st EOF pattern.
- The PDO index differs slightly from that of JISAO, which uses a blend of UKMET and OIv1 and OIv2 SST.
- Positive SSTAs
presented in the central North Pacific with PDO index =0.1 in Jul 2018.
- Statistically, ENSO leads PDO by 3-4 months, may through atmospheric bridge.
48

North America Western Coastal Upwelling
- Area below (above) black line indicates climatological upwelling (downwelling) season.
- Climatologically upwelling season progresses from Mayil to July along the west coast of North America from 36ºN to 57ºN.
Fig. NP2. Total (top) and anomalous (bottom) upwelling
indices at the 15 standard locations for the western coast of
North America. Upwelling indices are derived from the vertical
velocity of the NCEP's global ocean data assimilation system, and are calculated as integrated vertical volume transport at
50 meter depth from each location to its nearest coast point
(m3/s/100m coastline). Anomalies are departures from the
1981-2010 base period pentad means.
- Both anomalous upwelling and
downwelling were small.
49
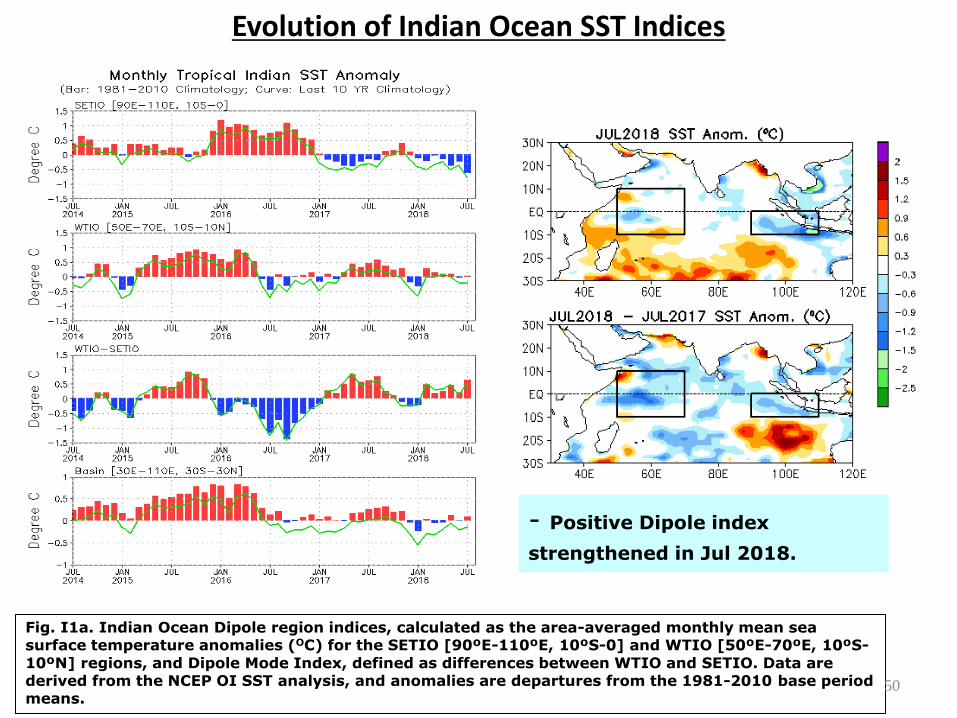
Evolution of Indian Ocean SST Indices
Fig. I1a. Indian Ocean Dipole region indices, calculated as the area-averaged monthly mean sea surface temperature anomalies (OC) for the SETIO [90ºE-110ºE, 10ºS-0] and WTIO [50ºE-70ºE, 10ºS-
10ºN] regions, and Dipole Mode Index, defined as differences between WTIO and SETIO. Data are derived from the NCEP OI SST analysis, and anomalies are departures from the 1981-2010 base period means.
- Positive Dipole index
strengthened in Jul 2018.
50

CPC’s Markov Model NINO3.4 Forecast
(http://www.cpc.ncep.noaa.gov/products/people/yxue/ENSO_forecast_clim81-10_godas.html)
51
52
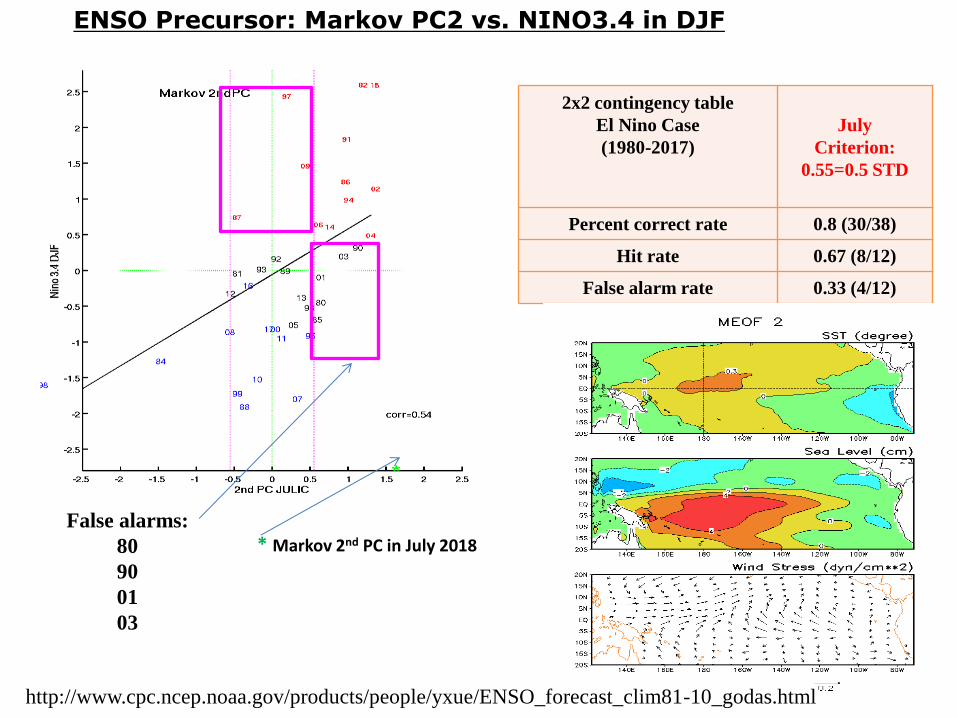
ENSO Precursor: Markov PC2 vs. NINO3.4 in DJF
* Markov 2nd PC in July 2018
2x2 contingency table
El Nino Case
(1980-2017)
July
Criterion:
0.55=0.5 STD
Percent correct rate 0.8 (30/38)
Hit rate 0.67 (8/12)
False alarm rate 0.33 (4/12)
False alarms:
80
90
01
03
http://www.cpc.ncep.noaa.gov/products/people/yxue/ENSO_forecast_clim81-10_godas.html
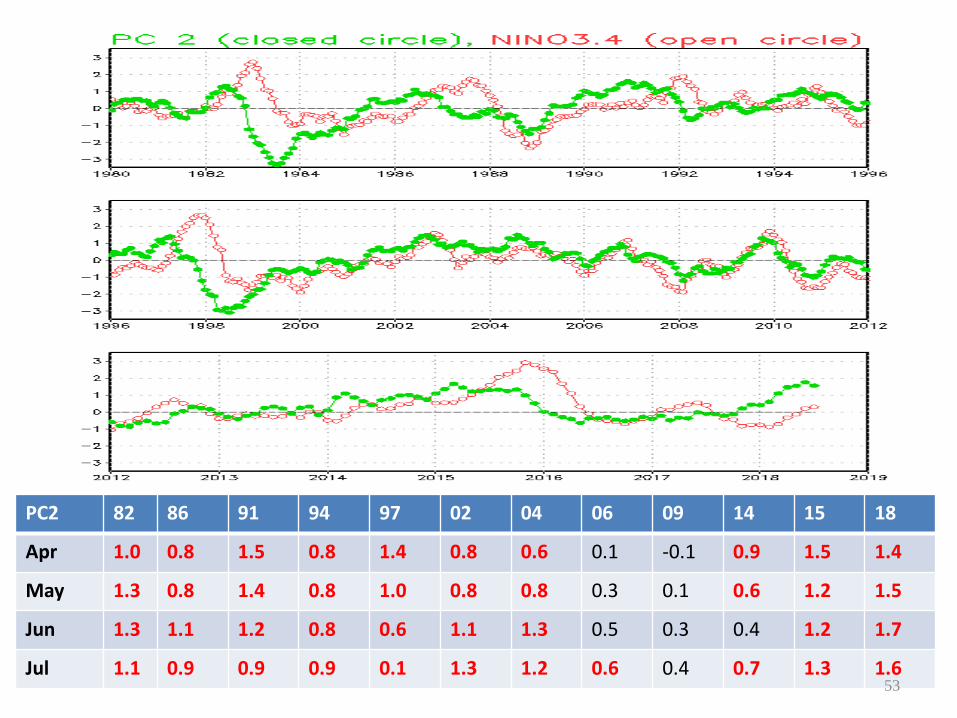
PC2 82 86 91 94 97 02 04 06 09 14 15 18
Apr 1.0 0.8 1.5 0.8 1.4 0.8 0.6 0.1 -0.1 0.9 1.5 1.4
May 1.3 0.8 1.4 0.8 1.0 0.8 0.8 0.3 0.1 0.6 1.2 1.5
Jun 1.3 1.1 1.2 0.8 0.6 1.1 1.3 0.5 0.3 0.4 1.2 1.7
Jul 1.1 0.9 0.9 0.9 0.1 1.3 1.2 0.6 0.4 0.7 1.3 1.6
?
53

WWV in July
2x2 contingency table
El Nino Case
(1980-2017)
July
Criterion:
3.83 = 0.5 STD
Percent correct rate 0.8 (30/38)
Hit rate 0.75 (9/12)
False alarm rate 0.36(5/14)
ENSO Precursor: Warm Water Volume (WWV) vs. NINO3.4 in DJF
* WWV in July 2018
False alarms:
85
89
03
08
12
Data downloadable from http://www.cpc.ncep.noaa.gov/products/GODAS/multiora_body.html 54
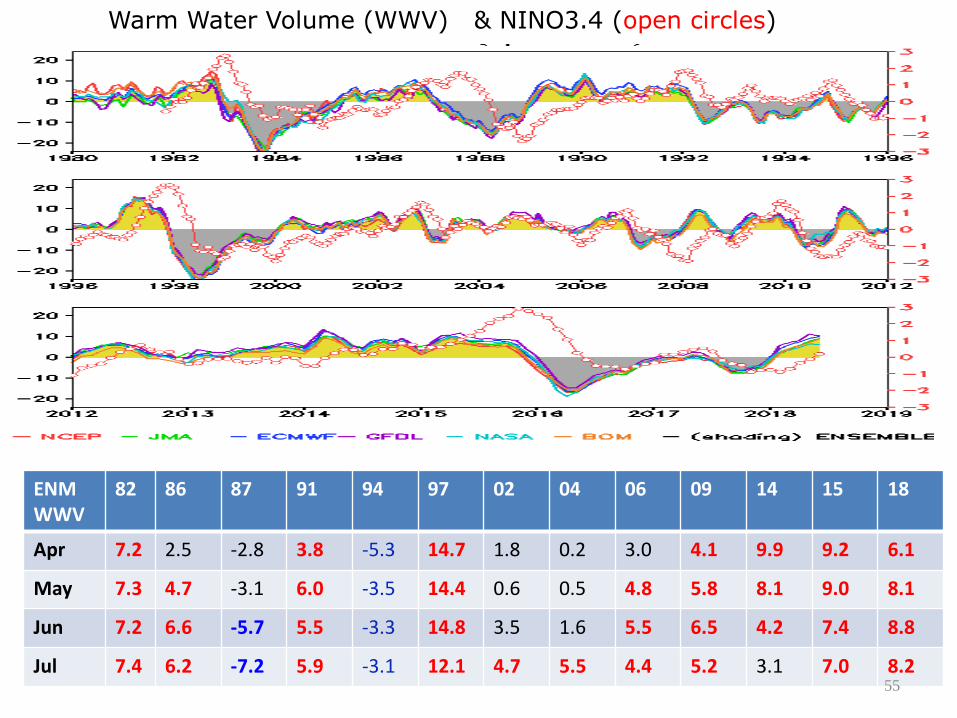
ENM WWV
82 86 87 91 94 97 02 04 06 09 14 15 18
Apr 7.2 2.5 -2.8 3.8 -5.3 14.7 1.8 0.2 3.0 4.1 9.9 9.2 6.1
May 7.3 4.7 -3.1 6.0 -3.5 14.4 0.6 0.5 4.8 5.8 8.1 9.0 8.1
Jun 7.2 6.6 -5.7 5.5 -3.3 14.8 3.5 1.6 5.5 6.5 4.2 7.4 8.8
Jul 7.4 6.2 -7.2 5.9 -3.1 12.1 4.7 5.5 4.4 5.2 3.1 7.0 8.2
Warm Water Volume (WWV) & NINO3.4 (open circles)
55

CTP in July
2x2 contingency table
El Nino Case
(1980-2017)
July
Criterion:
3.7 = 0.5 STD
Percent correct rate 0.74 (28/38)
Hit rate 0.5 (6/12)
False alarm rate 0.4 (4/10)
ENSO Precursor: Central Tropical Pacific D20 (CTP) vs. NINO3.4 in DJF
* CTP in July 2018
False alarms:
80
90
92
03
Data downloadable from http://www.cpc.ncep.noaa.gov/products/GODAS/multiora_body.html
56

ENM CTP
82 86 91 94 97 02 04 06 09 14 15 18
Apr 8.9 0.9 9.8 -3.6 16.3 2.7 3.2 -2.5 -5.3 9.7 15.4 4.1
May 9.3 1.8 8.9 -1.1 15.7 3.0 6.2 -1.0 -2.5 7.4 11.9 7.2
Jun 8.6 5.0 7.6 -0.6 14.2 5.5 4.6 0.4 0.9 2.9 11.0 6.0
Jul 8.3 2.4 7.6 -0.8 10.3 6.8 10.4 2.1 1.8 1.4 11.2 6.8
Central Tropical Pacific (CTP) Index & NINO3.4 (open circles)
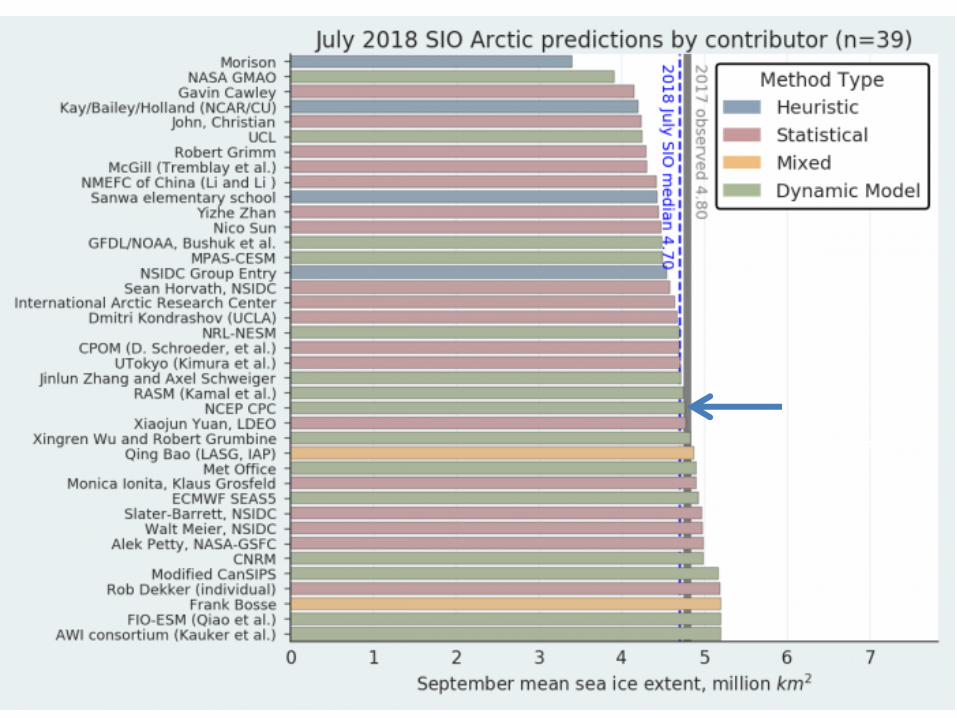
NCEP
CPC 4.77
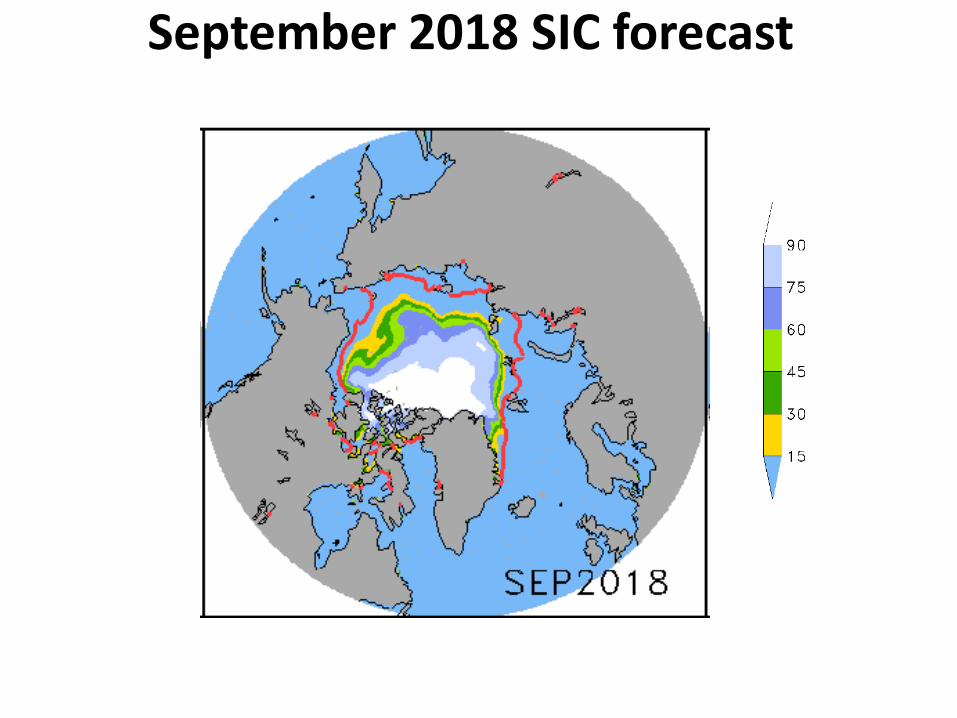
September 2018 SIC forecast
60
CFS Tropical North Atlantic (TNA) SST Predictions
from Different Initial Months
TNA is the
SST anomaly
averaged in
the region of
[60oW-30oW,
5oN-20oN].
Fig. M3. CFS Tropical North Atlantic (TNA) SST predictions from the latest 9 initial months. Displayed are 40
forecast members (brown) made four times per day initialized from the last 10 days of the initial month (labelled
as IC=MonthYear) as well as ensemble mean (blue) and observations (black). Anomalies were computed with
respect to the 1981-2010 base period means.

61
CFS Pacific Decadal Oscillation (PDO) Index Predictions
from Different Initial Months
PDO is the first EOF
of monthly ERSSTv3b
anomaly in the
region of [110oE-
100oW, 20oN-60oN].
CFS PDO index is the
standardized
projection of CFS SST
forecast anomalies
onto the PDO EOF
pattern.
Fig. M4. CFS Pacific Decadal Oscillation (PDO) index predictions from the latest 9 initial months. Displayed are 40
forecast members (brown) made four times per day initialized from the last 10 days of the initial month (labelled
as IC=MonthYear) as well as ensemble mean (blue) and observations (black). Anomalies were computed with
respect to the 1981-2010 base period means.


