Global Ocean Monitoring: Recent Evolution, Current Status, … · Indian Ocean Atlantic Ocean ......
50
Global Ocean Monitoring: Recent Evolution, Current Status, and Predictions Prepared by Climate Prediction Center, NCEP/NOAA January 9, 2018 http://www.cpc.ncep.noaa.gov/products/GODAS/ This project to deliver real-time ocean monitoring products is implemented by CPC in cooperation with NOAA's Ocean Observing and Monitoring Division (OOMD)
Transcript of Global Ocean Monitoring: Recent Evolution, Current Status, … · Indian Ocean Atlantic Ocean ......
Global Ocean Monitoring: Recent Evolution, Current Status, and
Predictions
Prepared by Climate Prediction Center, NCEP/NOAA
January 9, 2018
http://www.cpc.ncep.noaa.gov/products/GODAS/ This project to deliver real-time ocean monitoring products is implemented
by CPC in cooperation with NOAA's Ocean Observing and Monitoring Division (OOMD)
Outline • Overview
• Recent highlights
Pacific/Arctic Ocean
Indian Ocean
Atlantic Ocean
• Global SST predictions
Two ENSO precursor indices calculated from six ocean reanalyses available for downloading
The ‘double-dip’ 16-17-18 La Niña compared with other ‘double-dip’ La Niñas
Historical subsurface warming near the Gulf Stream around 40oN
2

Overview
3
Pacific Ocean La Niña conditions persisted in Dec 2017, and the 2016-2018
event was the 7th ‘double-dip’ La Niña since 1950. Most of models suggested the weak La Niña conditions would
continue at least through the early spring 2018. Arctic sea ice extent in Dec 2017 ranked the second lowest since
1979.
Indian Ocean Indian Ocean Dipole index was near average in Dec 2017.
Atlantic Ocean
Strong positive SST anomaly has persisted near the Gulf Stream around 40oN in the past few years
The warming extended from the surface to at least 300m in depth, and was warmest since 1979 based on the ensemble mean of six ocean reanalyses

Global Oceans
4

- Negative (positive) SSTA persisted in the central-eastern (western) equatorial Pacific. - Positive SSTA dominated in North Pacific, North Atlantic, mid-latitude South Ocean. - Negative SSTA presented in S.E. Indian Ocean, S.E. Pacific and subtropical South Atlantic.
Global SST Anomaly (0C) and Anomaly Tendency
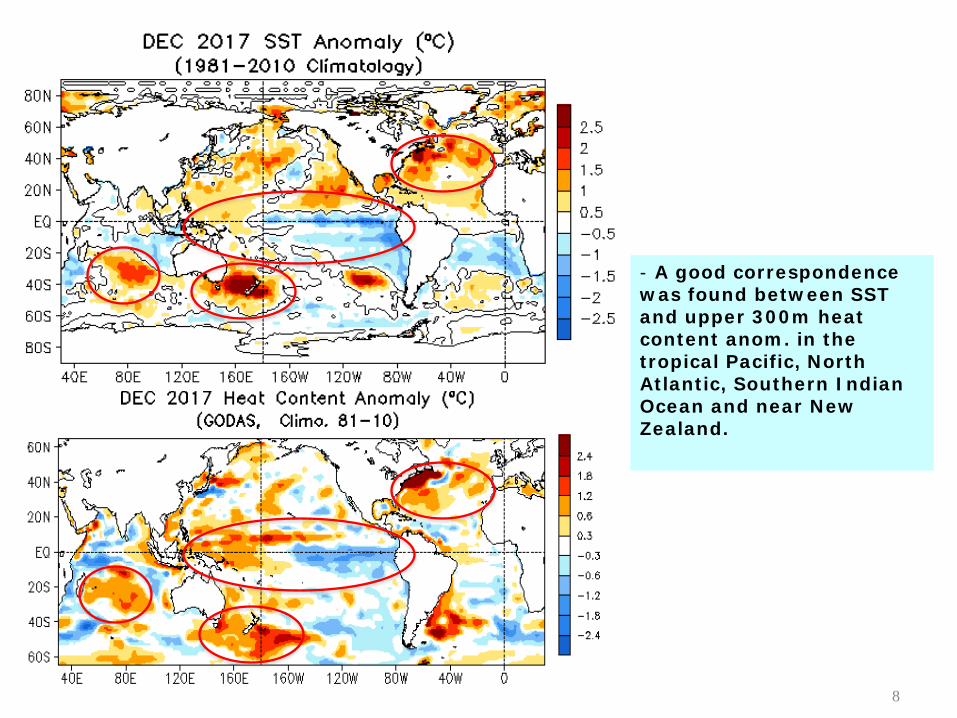
Fig. G1. Sea surface temperature anomalies (top) and anomaly tendency (bottom). Data are derived from the NCEP OI SST analysis, and anomalies are departures from the 1981-2010 base period means.
- Negative SSTA tendency was observed in W. Indian Ocean, and most of South Atlantic.
5

- Negative (positive) SSS anom. dominated over the Maritime Continents (eq. central Pacific), consistent with the La Niña conditions. - E-P anom. was consistent with SSS anom.
Blended Analysis of Surface Salinity (BASS) V0.Z (Xie et al. 2014; ftp.cpc.ncep.noaa.gov/precip/BASS) Precipitation: CMORPH adjusted satellite precipitation estimates Evaporation: Adjusted CFS Reanalysis 6
Global Sea Surface Salinity and E-P Anomaly

Longitude-Depth Temperature Anomaly and Anomaly Tendency in 2OS-2ON
Fig. G3. Equatorial depth-longitude section of ocean temperature anomalies (top) and anomaly tendency (bottom). Data are derived from the NCEP's global ocean data assimilation system which assimilates oceanic observations into an oceanic GCM. Anomalies are departures from the 1981-2010 base period means.
- Positive (negative) temperature anom. presented in the western Pacific (central-eastern Pacific).
- Strong positive temperature anom. presented in the eastern Indian Ocean.
- Subsurface temperature tendency was positive near the thermocline in the western-central equatorial Pacific, indicating enhancement and eastward extension of warm anom.
- Positive tendency dominated in the eastern Indian Ocean.
7
8
- A good correspondence was found between SST and upper 300m heat content anom. in the tropical Pacific, North Atlantic, Southern Indian Ocean and near New Zealand.

9
- For upper 300m heat content anom., the SN Ratio is larger than 2 in the tropical Pacific, North Atlantic, and Southern Indian Ocean, indicating anom. in those regions are likely reliable.
Real-Time Ocean Reanalysis Intercomparison: H300 Anom. (http://www.cpc.ncep.noaa.gov/products/GODAS/multiora_body.html)
-The signal-to-noise ratio (SN Ratio) is defined as the ratio of absolute value of ensemble mean anom. and ensemble spread.

Tropical Pacific Ocean and ENSO Conditions
10

Evolution of Pacific NINO SST Indices
- All Nino indices were below-average in Dec 2017.
- Nino3.4 weakened slightly in Dec 2017, with Nino34 = -0.8oC.
- Compared with last Dec, the eq. eastern Pacific and southeastern subtropical Pacific was much cooler in Dec 2017.
- The indices were calculated based on OISST. They may have some differences compared with those based on ERSST.v5.
Fig. P1a. Nino region indices, calculated as the area-averaged monthly mean sea surface temperature anomalies (oC) for the specified region. Data are derived from the NCEP OI SST analysis, and anomalies are departures from the 1981-2010 base period means. 11
12
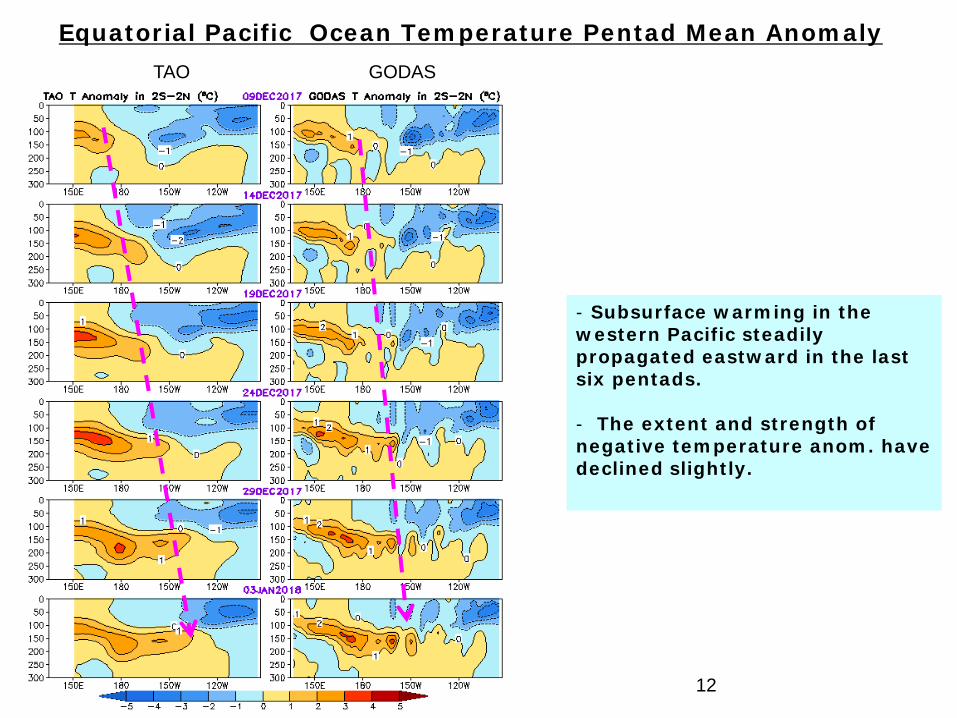
Equatorial Pacific Ocean Temperature Pentad Mean Anomaly
- Subsurface warming in the western Pacific steadily propagated eastward in the last six pentads.
- The extent and strength of negative temperature anom. have declined slightly.
TAO GODAS

Equatorial Pacific SST (oC), HC300 (oC), u850 (m/s) Anomalies
- Positive HC300A in W. Pacific extended eastward, while negative HC300A in the central-eastern Pacific weakened slightly in Dec 2017.
- Westerly wind anomalies enhanced in Dec 2017, probably associated with MJO activity.
- The 2016-2018 is the 7th ‘double-dip’ La Niña since 1950 according to the ERSSTv5 ONI index (http://origin.cpc.ncep.noaa.gov/products/analysis_monitoring/ensostuff/ONI_v5.php).
13
CPC MJO Indices
14
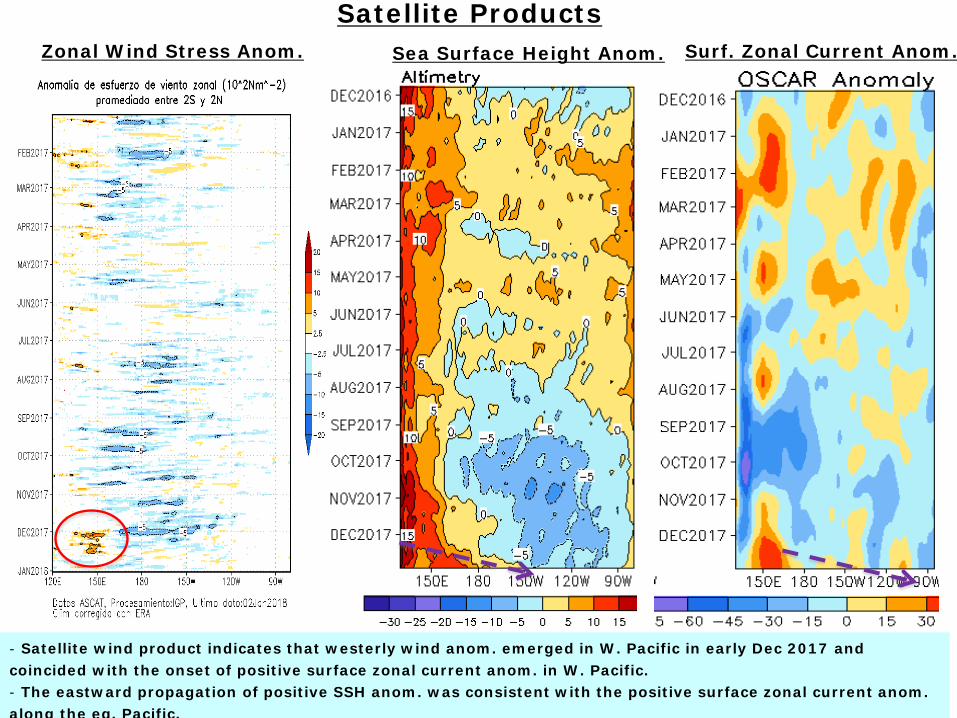
Zonal Wind Stress Anom. Sea Surface Height Anom.
Satellite Products Surf. Zonal Current Anom.
- Satellite wind product indicates that westerly wind anom. emerged in W. Pacific in early Dec 2017 and coincided with the onset of positive surface zonal current anom. in W. Pacific. - The eastward propagation of positive SSH anom. was consistent with the positive surface zonal current anom. along the eq. Pacific.

NINO3.4 Heat Budget
Huang, B., Y. Xue, X. Zhang, A. Kumar, and M. J. McPhaden, 2010 : The NCEP GODAS ocean analysis of the tropical Pacific mixed layer heat budget on seasonal to interannual time scales, J. Climate., 23, 4901-4925.
Qu: Zonal advection; Qv: Meridional advection; Qw: Vertical entrainment; Qzz: Vertical diffusion Qq: (Qnet - Qpen + Qcorr)/ρcph; Qnet = SW + LW + LH +SH; Qpen: SW penetration; Qcorr: Flux correction due to relaxation to OI SST
- Both observed SSTA tendency (dT/dt; dotted black line) and total budget tendency (RHS; solid black line) in Nino3.4 region switched to positive in Dec 2017, indicating decaying La Niña conditions. - Zonal advection Qu and vertical advection and vertical diffusion Qw+Qzz contributed to the positive SSTA tendency in Dec 2017.
15

16
Comparison of Equatorial Pacific SST Anom. (oC) in Four ‘Double-Dip’ La Niñas (83-85, 07-09, 10-12 and 16-18)

Comparison of Equatorial Pacific SST Anom. (oC) with weak ‘Double-Dip’ (95-97) and strong ‘Triple-Dip’ La Niñas (98-01)
- The winter 96/97 did not quite meet the criterion for La Niña, accordion to the ERSSTv5 ONI index (http://origin.cpc.ncep.noaa.gov/products/analysis_monitoring/ensostuff/ONI_v5.php).

18
- Negative D20 anom. in Apr 83, Apr 07, Apr 10 and Apr 16 were favorable for development of the first year La Niña. - However, positive D20 anom. in Apr 08 and Apr 11 were not favorable for development of the second year La Niña.
Comparison of Equatorial Pacific D20 Anom. (m) in Four ‘Double-Dip’ La Niñas (83-85, 07-09, 10-12 and 16-18)

Comparison of Equatorial Pacific D20 Anom. (m) with weak ‘Double-Dip’ (95-97) and strong ‘Triple-Dip’ La Niñas (98-01)

20
- Easterly wind anom. in Apr 84, Apr 08, Apr 11 and Apr 17 were all favorable for development of the second year La Niña.
Comparison of Equatorial Pacific U850 Anom. (m/s) in Four ‘Double-Dip’ La Niñas (83-85, 07-09, 10-12 and 16-18)
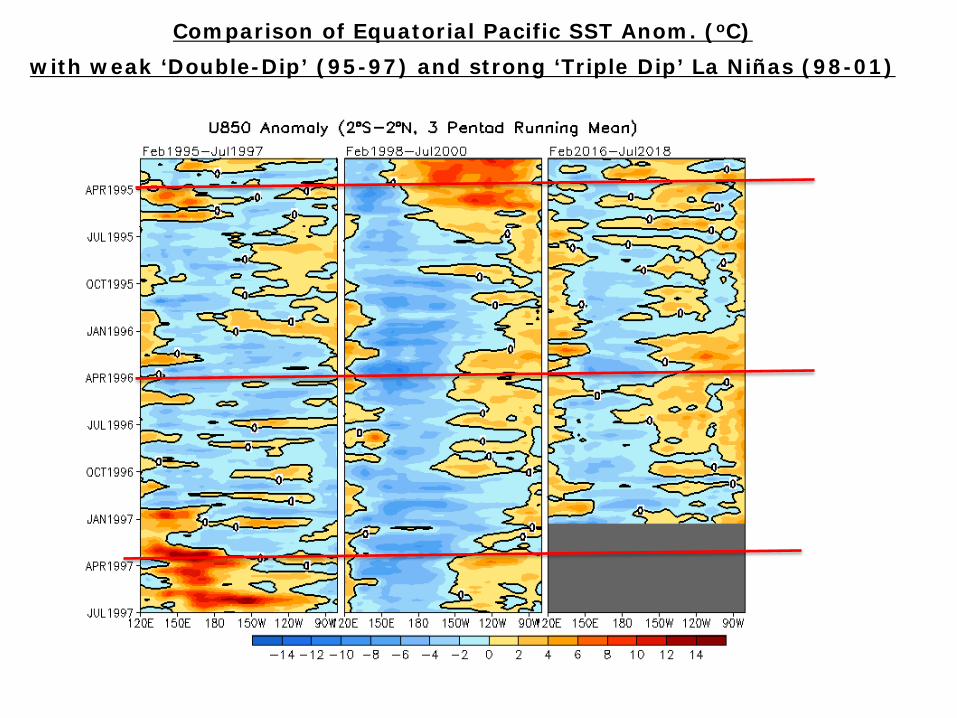
Comparison of Equatorial Pacific SST Anom. (oC) with weak ‘Double-Dip’ (95-97) and strong ‘Triple Dip’ La Niñas (98-01)

North Pacific & Arctic Oceans
22
23
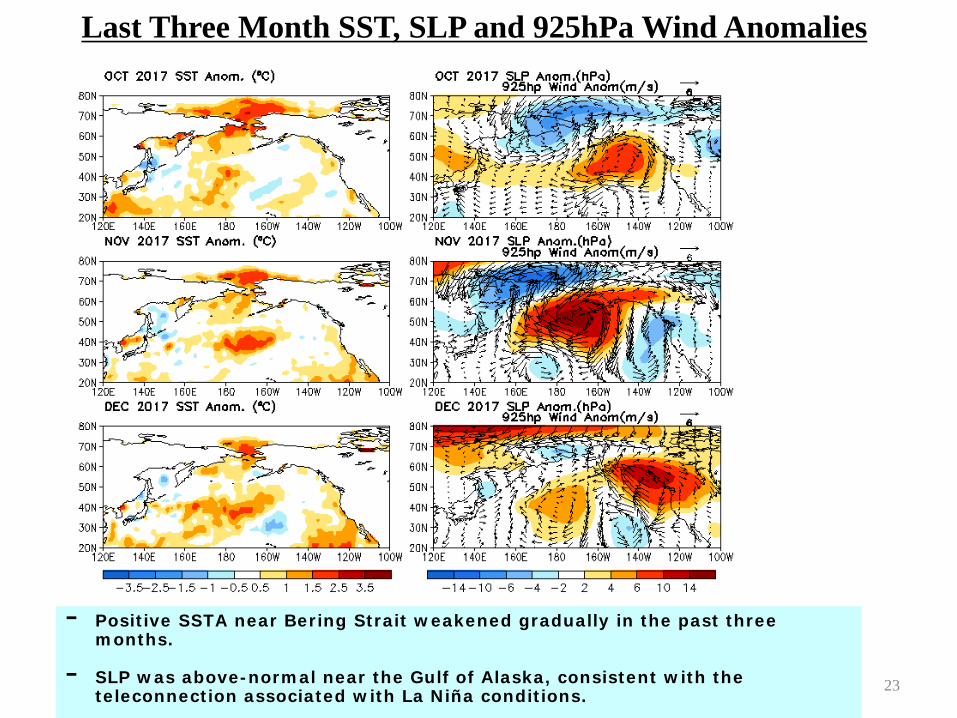
Last Three Month SST, SLP and 925hPa Wind Anomalies
- Positive SSTA near Bering Strait weakened gradually in the past three months. - SLP was above-normal near the Gulf of Alaska, consistent with the teleconnection associated with La Niña conditions.

North America Western Coastal Upwelling
- Area below (above) black line indicates climatological upwelling (downwelling) season.
- Climatologically upwelling season progresses from March to July along the west coast of North America from 36ºN to 57ºN.
Fig. NP2. Total (top) and anomalous (bottom) upwelling indices at the 15 standard locations for the western coast of North America. Upwelling indices are derived from the vertical velocity of the NCEP's global ocean data assimilation system, and are calculated as integrated vertical volume transport at 50 meter depth from each location to its nearest coast point (m3/s/100m coastline). Anomalies are departures from the 1981-2010 base period pentad means.
- Anomalous upwelling dominated between 36N-48N in Dec 2017, owing to the northwesterly wind anom. near the coast.
24
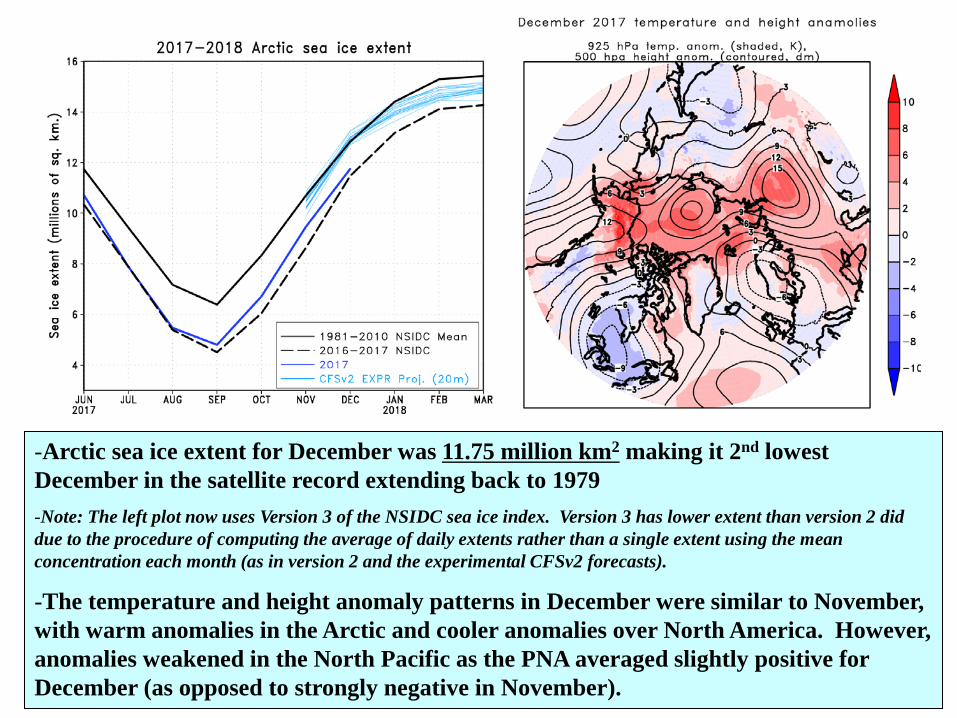
-Arctic sea ice extent for December was 11.75 million km2 making it 2nd lowest December in the satellite record extending back to 1979 -Note: The left plot now uses Version 3 of the NSIDC sea ice index. Version 3 has lower extent than version 2 did due to the procedure of computing the average of daily extents rather than a single extent using the mean concentration each month (as in version 2 and the experimental CFSv2 forecasts).
-The temperature and height anomaly patterns in December were similar to November, with warm anomalies in the Arctic and cooler anomalies over North America. However, anomalies weakened in the North Pacific as the PNA averaged slightly positive for December (as opposed to strongly negative in November).

Indian Ocean
26

Evolution of Indian Ocean SST Indices
Fig. I1a. Indian Ocean Dipole region indices, calculated as the area-averaged monthly mean sea surface temperature anomalies (OC) for the SETIO [90ºE-110ºE, 10ºS-0] and WTIO [50ºE-70ºE, 10ºS-10ºN] regions, and Dipole Mode Index, defined as differences between WTIO and SETIO. Data are derived from the NCEP OI SST analysis, and anomalies are departures from the 1981-2010 base period means.
- All indices were near normal in Dec 2017.
- SSTA were weak north of 10oS, but relatively strong, having a dipole pattern south of 10oS.
27

Tropical Indian: SST Anom., SST Anom.
Tend., OLR, Sfc Rad, Sfc Flx, 925-mb &
200-mb Wind Anom.
Fig. I2. Sea surface temperature (SST) anomalies (top-left), anomaly tendency (top-right), Outgoing Long-wave Radiation (OLR) anomalies (middle-left), sum of net surface short- and long-wave radiation, latent and sensible heat flux anomalies (middle-right), 925-mb wind anomaly vector and its amplitude (bottom-left), 200-mb wind anomaly vector and its amplitude (bottom-right). SST are derived from the NCEP OI SST analysis, OLR from the NOAA 18 AVHRR IR window channel measurements by NESDIS, winds and surface radiation and heat fluxes from the NCEP CDAS. Anomalies are departures from the 1981-2010 base period means.
28
- Negative SSTA tendency dominated over most of the tropical Indian Ocean.
- The cooling in N.W. Indian Ocean was likely driven by surface heat fluxes, which were consistent with strong wind anom. in the region.

Tropical and North Atlantic Ocean
29
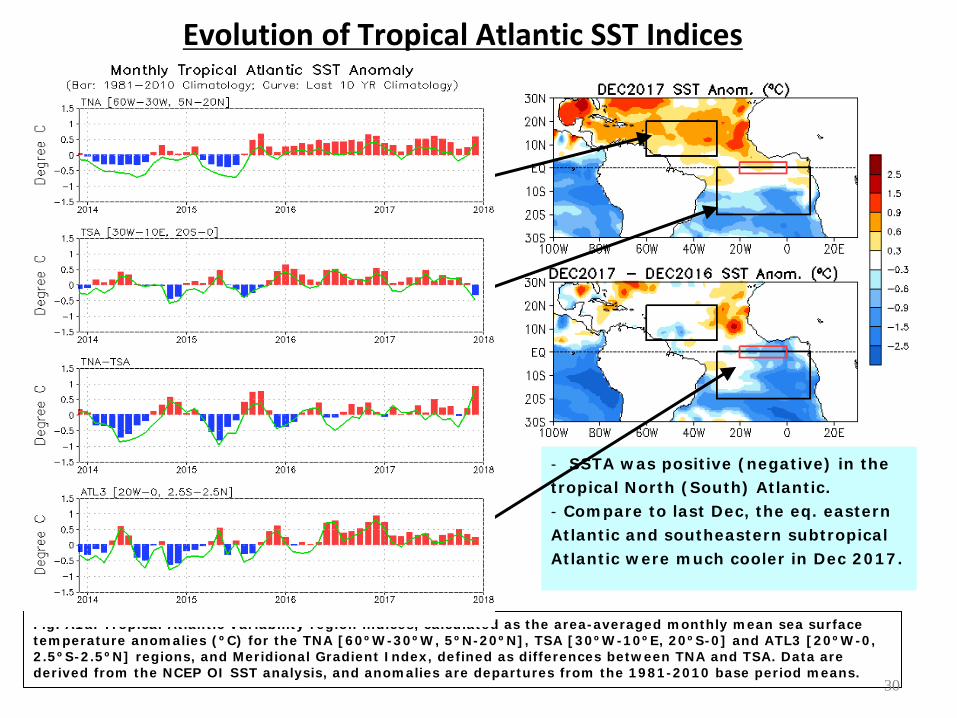
Evolution of Tropical Atlantic SST Indices
Fig. A1a. Tropical Atlantic Variability region indices, calculated as the area-averaged monthly mean sea surface temperature anomalies (ºC) for the TNA [60ºW-30ºW, 5ºN-20ºN], TSA [30ºW-10ºE, 20ºS-0] and ATL3 [20ºW-0, 2.5ºS-2.5ºN] regions, and Meridional Gradient Index, defined as differences between TNA and TSA. Data are derived from the NCEP OI SST analysis, and anomalies are departures from the 1981-2010 base period means.
- SSTA was positive (negative) in the tropical North (South) Atlantic. - Compare to last Dec, the eq. eastern Atlantic and southeastern subtropical Atlantic were much cooler in Dec 2017.
30

31
Last Three Month SST, SLP and 925hPa Wind Anomalies

32
Real-Time Ocean Reanalysis Intercomparison: Temp Anom. Average in 35N-45N (http://www.cpc.ncep.noaa.gov/products/GODAS/multiora_body.html)
Anom. in the box [70W-50W, 35N-45N] appears reliable
GODAS was too warm compared to other ocean reanalyses

33
- The warm anom. in [70W-50W, 35N-45N] started around 2012, and has reached the maximum strength in 2016. - The warm anom. extended from the surface to at least 300m, and was the warmest since 1979.

NAO and SST Anomaly in North Atlantic
Fig. NA2. Monthly standardized NAO index (top) derived from monthly standardized 500-mb height anomalies obtained from the NCEP CDAS in 20ºN-90ºN (http://www.cpc.ncep.noaa.gov). Time-Latitude section of SST anomalies averaged between 80ºW and 20ºW (bottom). SST are derived from the NCEP OI SST analysis, and anomalies are departures from the 1981-2010 base period means.
- Warm anom. dominated in N. Atlantic in Dec 2017.
34

ENSO and Global SST Predictions
35
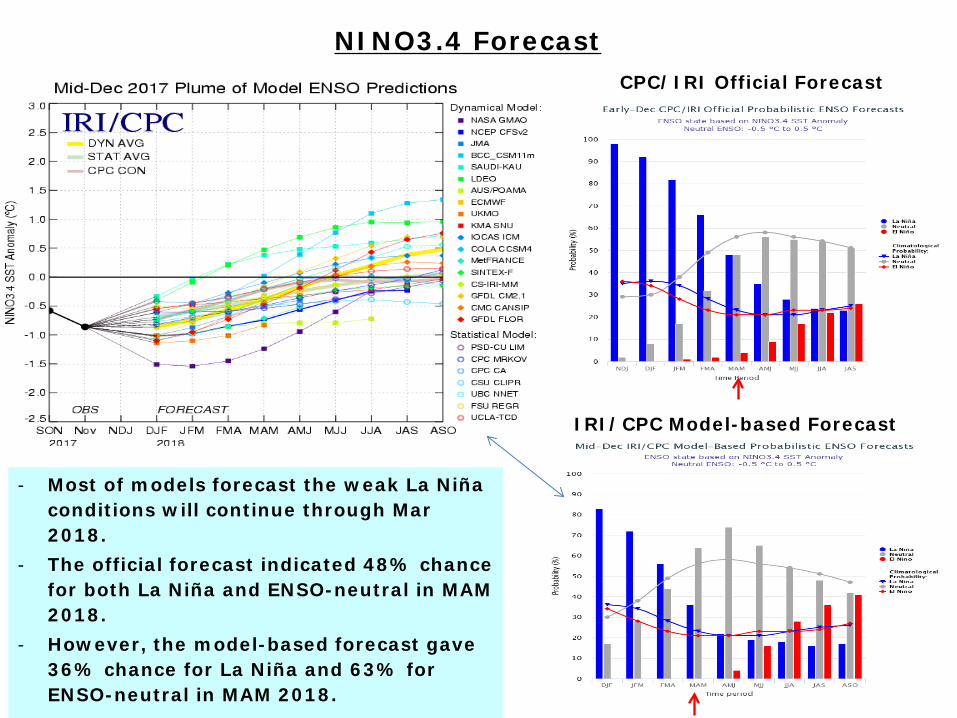
- Most of models forecast the weak La Niña conditions will continue through Mar 2018.
- The official forecast indicated 48% chance for both La Niña and ENSO-neutral in MAM 2018.
- However, the model-based forecast gave 36% chance for La Niña and 63% for ENSO-neutral in MAM 2018.
NINO3.4 Forecast
36
CPC/IRI Official Forecast
IRI/CPC Model-based Forecast

37
Real-Time Ocean Reanalysis Intercomparison: D20 Anom. (http://www.cpc.ncep.noaa.gov/products/GODAS/multiora_body.html)

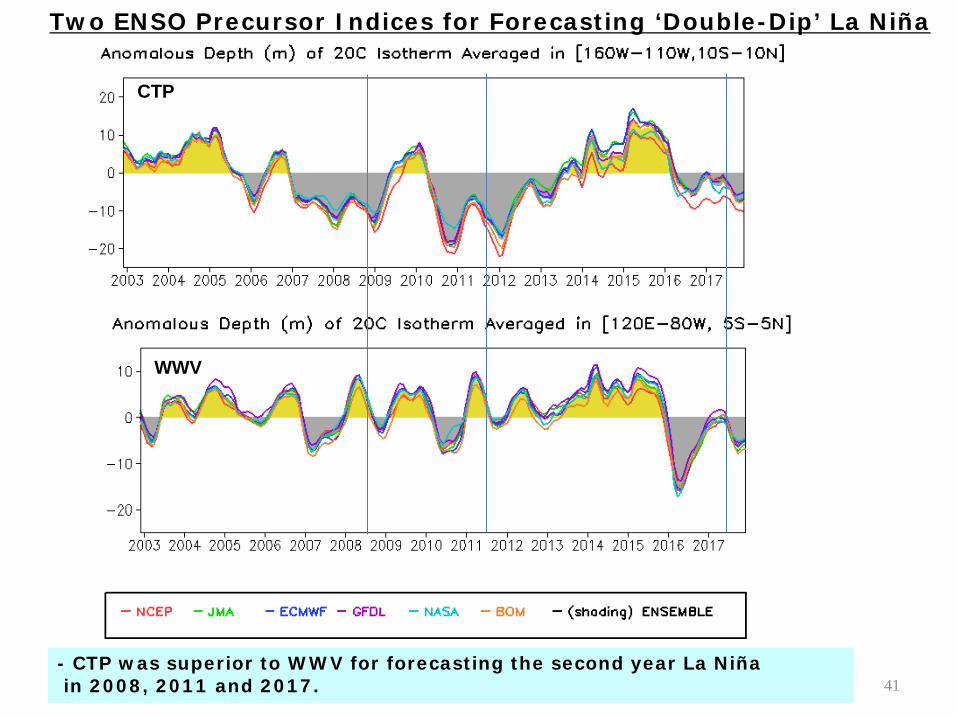
Two ENSO Precursor Indices Derived from D20 Anom.
- Warm Water Volume (WWV) index is defined as the averaged D20 anom. in [120ºE-80ºW, 5ºS-5ºN] (Meinen and McPhaden 2000).
Monthly WWV indices, calculated from six ocean reanalyses, can be downloaded at http://www.cpc.ncep.noaa.gov/products/GODAS/multiora/index/wwv_current.txt
- Central Tropical Pacific (CTP) index is defined as the averaged D20 anom. in [160ºW-110ºW, 10ºS-10ºN]
(Wen et al. 2014). Monthly CTP indices, calculated from six ocean reanalyses, can be downloaded at http://www.cpc.ncep.noaa.gov/products/GODAS/multiora/index/ctp_current.txt
CTP WWV
Ensemble Mean of NCEP, JMA, ECMWF, GFDL, NASA and BOM
CTP

Contingency Tables for La Niña Prediction (1980-2016)
Percent correct Hit Rate False Alarm
La Nina Criterion: Index <= - 0.5 Standard Deviation (black lines)
- The CTP precursor predicted La Niña condition as early as Apr 2017. It predicted La Niña consistently from Aug-Nov 2017 I.C. with more than 90% hit rate. - However, the WWV precursor predicted La Niña condition consistently from Aug-Nov 2017 with 50% hit rate.
NINO3.4 Target Season: DJF
IC month IC month IC month

40
IRI/CPC NINO3.4 Plume Apr17 I.C. May17 I.C. Jun17 I.C.
Jul17 I.C. Aug17 I.C. Sep17 I.C.
41
WWV
CTP
Two ENSO Precursor Indices for Forecasting ‘Double-Dip’ La Niña
- CTP was superior to WWV for forecasting the second year La Niña in 2008, 2011 and 2017.

Acknowledgements
42
• Drs. Caihong Wen, Zeng-Zhen Hu and Arun Kumar: Prepared the slides, reviewed the PPT, and provided insight and constructive suggestions and comments
• Drs. Thomas Collow and Wanqiu Wang: Provided the sea ice prediction slides
• Drs. Li Ren and Pingping Xie: Provided the SSS slides

Data Sources and References
• Optimal Interpolation SST (OI SST) version 2 (Reynolds et al. 2002) • Extended Reconstructed Sea Surface Temperature (ERSST) v5 (Huang et al. 2017)
• NCEP CDAS winds, surface radiation and heat fluxes (Kalnay et al. 1996)
• NESDIS Outgoing Long-wave Radiation
• NDBC TAO data (http://tao.ndbc.noaa.gov)
• PMEL TAO equatorial temperature analysis
• NCEP’s Global Ocean Data Assimilation System temperature, heat content, currents (Behringer and Xue 2004)
• Aviso Altimetry Sea Surface Height from CMEMS
• Ocean Surface Current Analyses – Realtime (OSCAR)
• Real-time Ocean Reanalysis Intercomparison Project
Please send your comments and suggestions to [email protected]. Thanks! 43

Backup Slides

Tropical Pacific: SST Anom., SST Anom. Tend., OLR, Sfc Rad, Sfc Flx, 925-mb & 200-mb Winds
Fig. P2. Sea surface temperature (SST) anomalies (top-left), anomaly tendency (top-right), Outgoing Long-wave Radiation (OLR) anomalies (middle-left), sum of net surface short- and long-wave radiation, latent and sensible heat flux anomalies (middle-right), 925-mb wind anomaly vector and its amplitude (bottom-left), 200-mb wind anomaly vector and its amplitude (bottom-right). SST are derived from the NCEP OI SST analysis, OLR from the NOAA 18 AVHRR IR window channel measurements by NESDIS, winds and surface radiation and heat fluxes from the NCEP CDAS. Anomalies are departures from the 1981-2010 base period means.
45

• New Update: The BASS 0.Z is released in July 2017 with the SSS from recently launched SMAP being integrated into the system. In BASS 0.Z, since June 2015, the blended SSS analysis is from in situ, SMOS and SMAP. Please report to us any suspicious data issues!
• The positive SSS anomaly in the western equatorial Pacific Ocean continued and expanded to a larger area. The negative SSS anomaly in the Indonesian equatorial Pacific continues with an increased precipitation and decreased evaporation. In the North Pacific subarctic region, the negative salinity became stronger along the storm track. Within the same latitudes, the North Atlantic SSS became negative as well. In the Bay of Bengal, the SSS became positive while the precipitation increased in the east basin and decreased in the west basin.
• Data used SSS : Blended Analysis of Surface Salinity (BASS) V0.Z (a CPC-NESDIS/NODC-NESDIS/STAR joint effort) (Xie et al. 2014) ftp.cpc.ncep.noaa.gov/precip/BASS Precipitation: CMORPH adjusted satellite precipitation estimates Evaporation: Adjusted CFS Reanalysis
Global Sea Surface Salinity (SSS) Anomaly for December 2017

Compared with last month, the SSS in the Bay of Bengal significantly increased except a small region in the northern part while the freshwater input increased in the eastern basin and decreased in the western basin. The SSS in the western equatorial Pacific continues increasing. In the storm track region of N. Pacific Ocean, the SSS decreased. The SSS decreased in the most of the North Atlantic Ocean, particularly in the equatorial and west basin of subarctic region.
Global Sea Surface Salinity (SSS) Tendency for December 2017

Global Sea Surface Salinity (SSS) Anomaly Evolution over Equatorial Pacific
• Hovemoller diagram for equatorial SSS anomaly (10°S-10°N);
• In the equatorial Pacific Ocean, from 120°E to 150°E, the negative SSS signal continues in this month. The positive SSS anomaly signal in the central equatorial Pacific Ocean extended to the east across the dateline until 140°W. Weaker negative signals is shown east of 140°W.
NOTE: Since June 2015, the BASS SSS is from in situ, SMOS and SMAP; before June 2015,The BASS SSS is from in situ, SMOS and Aquarius.
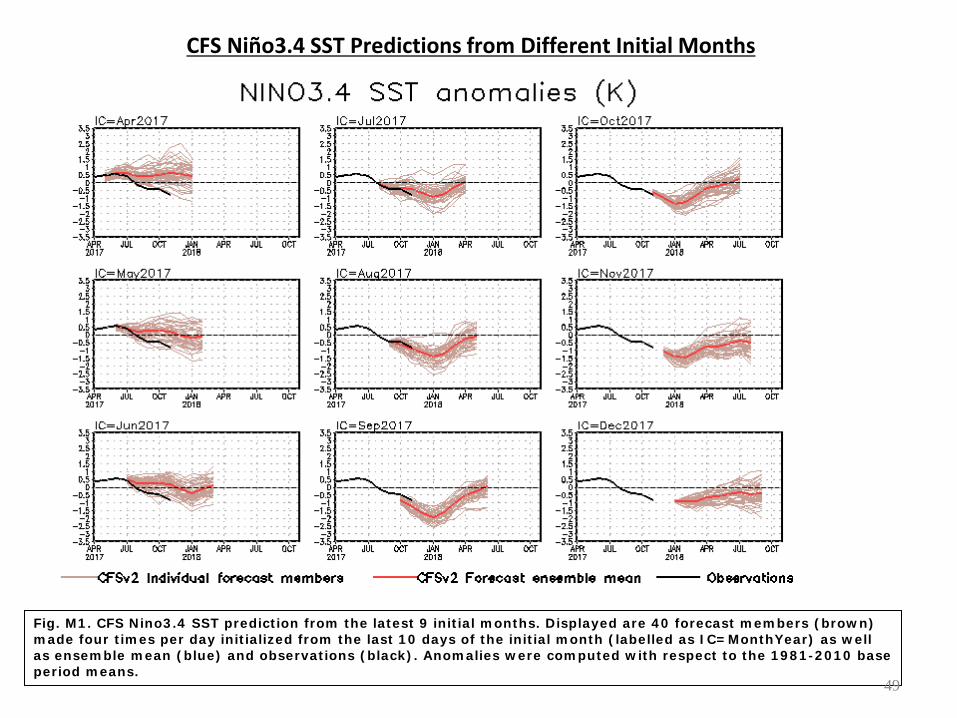
CFS Niño3.4 SST Predictions from Different Initial Months
Fig. M1. CFS Nino3.4 SST prediction from the latest 9 initial months. Displayed are 40 forecast members (brown) made four times per day initialized from the last 10 days of the initial month (labelled as IC=MonthYear) as well as ensemble mean (blue) and observations (black). Anomalies were computed with respect to the 1981-2010 base period means.
49
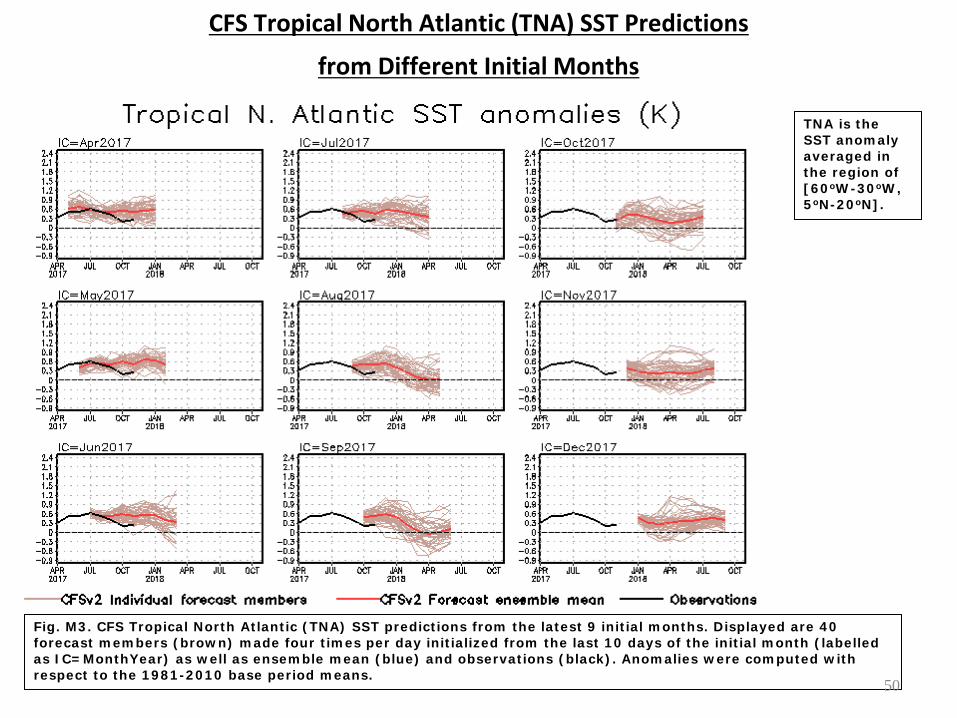
CFS Tropical North Atlantic (TNA) SST Predictions
from Different Initial Months
TNA is the SST anomaly averaged in the region of [60oW-30oW, 5oN-20oN].
Fig. M3. CFS Tropical North Atlantic (TNA) SST predictions from the latest 9 initial months. Displayed are 40 forecast members (brown) made four times per day initialized from the last 10 days of the initial month (labelled as IC=MonthYear) as well as ensemble mean (blue) and observations (black). Anomalies were computed with respect to the 1981-2010 base period means.
50


![SOEST | School of Ocean and Earth Science and Technology ......variable down flow 8 Kays and Crawford [1980] for Earth, or calculated down flow for Mars V c mean channel velocity calculated](https://static.fdocuments.in/doc/165x107/60bc0df34ecf1b7fbb5f4db0/soest-school-of-ocean-and-earth-science-and-technology-variable-down-flow.jpg)