Global Mega Trends & Innovation Trends and Implications … · Global Mega Trends & Innovation...
32
1 M82C-MT M82C-MT Global Mega Trends & Innovation Trends and Implications to Business, Society and Cultures September 2015
Transcript of Global Mega Trends & Innovation Trends and Implications … · Global Mega Trends & Innovation...

1 M82C-MT M82C-MT
Global Mega Trends & Innovation Trends
and Implications to Business, Society and Cultures
September 2015

2 M82C-MT
About Frost & Sullivan
Growth Learning Solutions
Mega Trends
Visionary Innovation
Serving our Clients
Through the Growth Cycle
Market Research
Technology Insight & Foresight Growth Consulting
Growth
Implementation

3 M82C-MT
Mega Trends
4 M82C-MT
Global Mega Trends
Urbanization –
City as a
Customer
Smart is the New
Green
Social Trends: Gen Y,
Middle Bulge, She-
conomy,
Geosocialization
Connectivity and
Convergence
Bricks and Clicks
Innovating to Zero
New Business
Models: Value for
Many
Economy: Beyond
BRIC: The Next
Game Changers
Future
Infrastructure
Development
Health, Wellness
and Well Being
Future of Mobility Future of Energy
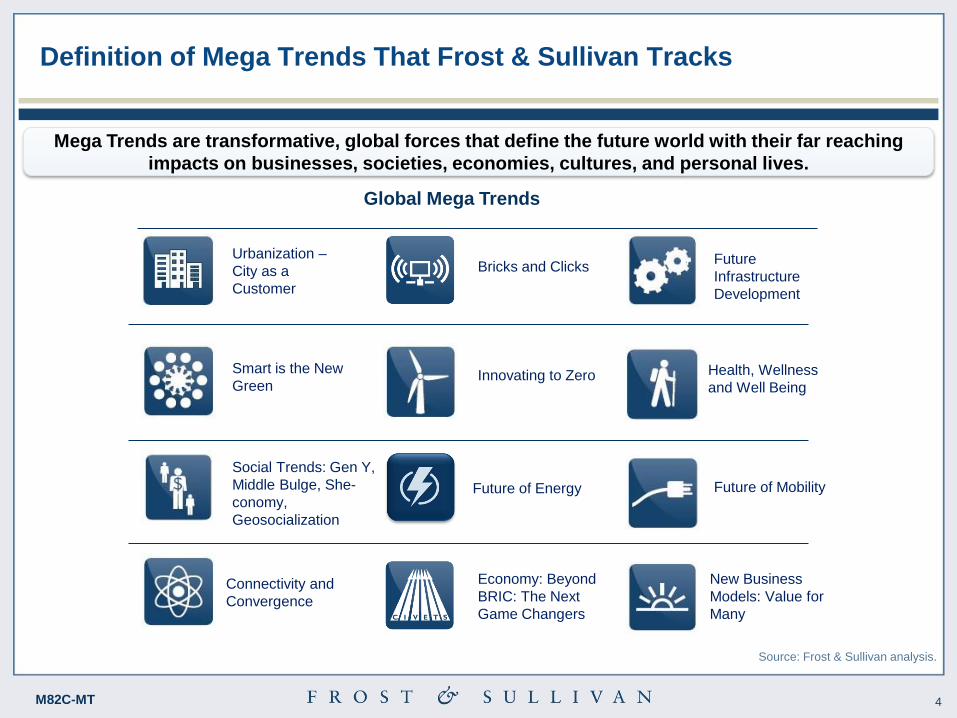
Mega Trends are transformative, global forces that define the future world with their far reaching
impacts on businesses, societies, economies, cultures, and personal lives.
Definition of Mega Trends That Frost & Sullivan Tracks
Source: Frost & Sullivan analysis.
5 M82C-MT
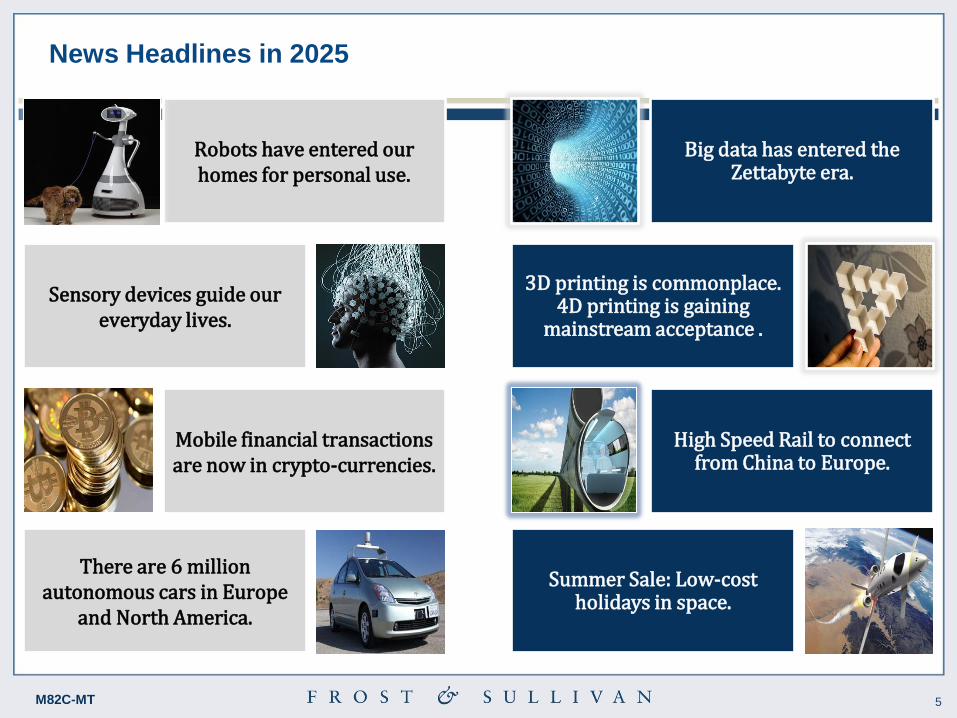
News Headlines in 2025
Robots have entered our homes for personal use.
Sensory devices guide our everyday lives.
Mobile financial transactions are now in crypto-currencies.
Big data has entered the Zettabyte era.
3D printing is commonplace. 4D printing is gaining
mainstream acceptance .
High Speed Rail to connect from China to Europe.
There are 6 million autonomous cars in Europe
and North America.
Summer Sale: Low-cost holidays in space.
6 M82C-MT
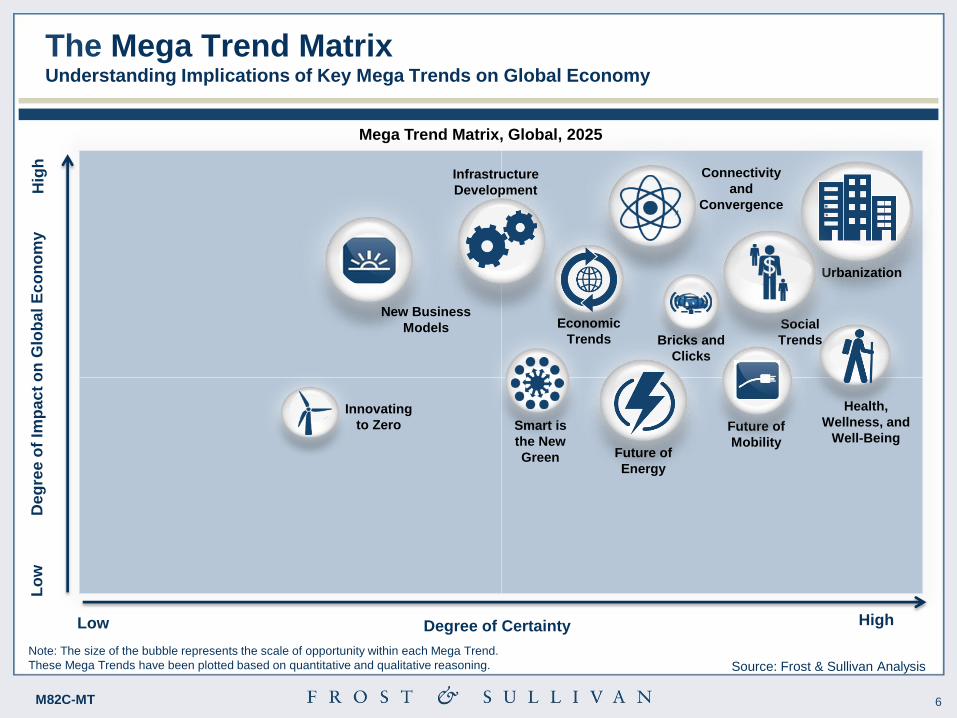
The Mega Trend Matrix Understanding Implications of Key Mega Trends on Global Economy
Note: The size of the bubble represents the scale of opportunity within each Mega Trend.
These Mega Trends have been plotted based on quantitative and qualitative reasoning. Source: Frost & Sullivan Analysis
Low Degree of Certainty
Deg
ree
of
Imp
ac
t o
n G
lob
al
Ec
on
om
y
Lo
w
Hig
h
High
Urbanization
Innovating
to Zero
Health,
Wellness, and
Well-Being
Connectivity
and
Convergence
Bricks and
Clicks
Infrastructure
Development
Smart is
the New
Green Future of
Energy
Future of
Mobility
Social
Trends
Economic
Trends
New Business
Models
Mega Trend Matrix, Global, 2025

7 M82C-MT
Transformational Shift #1 - Connected Living Digital solutions for a connected life expected to create a market potential of $731.70 billion by 2020
Connected Work
Connected Home
Connected City
Internet
Economy*
$14.7 Trillion
Global
GDP
$107.2
Trillion
Connected
Living Market
$731.70 billion
*Average based on data reported by OECD economies and BRIC nations as a percentage of GDP.
31%
54%
15%
Connected Living Market Potential, 2020
Connected Living describes a world in which consumers use many different devices to experience compelling new services that
integrate video, voice, and data services to provide access and ubiquitous connectivity anytime and anywhere.
• Home Automation • Smart Meters and Smart
Thermostats • Intelligent Lighting • Remote monitoring and
control • Home health - Remote
diagnostics; wearable health devices
• Mobility - Mobile email, enterprise mobile apps, people locator, bring your own device,
• Communication - unified messaging, remote desktop access,
• Networking - Web-based project collaboration tools,
• eGovernance • eCitizens • Smart transportation cards • E-learning • Mobile banking • Digital classroom, Remote
education service, Digital library
Connected Home Connected Work Connected City
Connected Living
Source: Frost & Sullivan analysis.

8 M82C-MT
Transformational Shift #2 – Big Data Deluge Digital content is doubling every 18 months - 90% of the data in the world today has been created in the
last two years alone
2012 2020
1.2
Zettabyte
100.2
Zettabyte
Database
Data Warehouse
ERPs
CRMs
Systems
Web blogs
Social Media
Audio, Video
Excel, CSV
Online
Structured Data Unstructured Data
Social Sentiment
Analysis Data Analytics
Marketing
Optimization -
Micromarketing
Open Innovation Discovery and
Navigation IT Economics
Security
Intelligence
Asset
Management Data Visualization
+40% /
Year
Types of Data-Enabled Services
Big Data Creates New Value Propositions for Businesses
Cloud-connected cars Facebook Personalized
Marketing
Nissan is looking at
analytics on sensor data
and telematics to improve
self-diagnostics
Facebook analyses location
data to reach more customers
with personalized, targeted
products
Smart Factories Emergency Responses
Pepsi’s Latin American
division merged customer,
logistics, and manufacturing
data to significantly improve
its plant operations
During Superstorm Sandy,
2012, Twitter hashtags
were analysed to find out
where power, fuel, food and
water were urgently needed.
Big Data
Big Data is growing at
40% annually
Data Traffic per Year, Global, 2012 and 2020
Source: IBM, Cisco, Frost & Sullivan Analysis
Big Data, Sources & Types of Services, 2014

9 M82C-MT
Transformational Shift #3 – Smart Cities Smart cities to create huge business opportunities with a market value of $1.565 trillion by 2020
Smart Diamond to define Smart city
Smart cities are cities built on “Smart‖ and ―Intelligent‖ solutions and technology that will lead to
adoption of at least 5 out of the 8 following smart parameters. Smart energy, Smart building, Smart
mobility, Smart healthcare, Smart infrastructure, Smart technology, Smart governance and Smart citizens
4G
Smart
Energy
Smart
Building
Smart
Citizen
Smart
Technology
Smart
Healthcare
Smart
Mobility
Smart
Governance
Smart Infrastructure
Smart City Market by Segments1, Global, 2020
20.93
14.11
16.65 13.75
9.09
15.26
10.21
Smart Governance andSmart Education
Smart Security
Smart Energy
Smart Infrastructure
Smart Transportation
Smart Healthcare
Smart Building
$1.5
trillion
1 Smart citizen and smart technology is covered in other segments such as governance and infrastructure
2 Smart Education includes eLearning services for schools, universities, enterprises, and government entities.
3 Smart Infrastructure includes sensor networks, digital management of water utilities not included in other segments.
2
3
Source: IBM, Cisco, Frost & Sullivan Analysis

10 M82C-MT
Transformational Shift #4 – Wearable Computing Electronic devices that can be worn by the bearer, incorporating advanced computing technologies
Wearable Devices
Market (2020)
$11.2 Billion
Wearable
Healthcare
Market (2020) $5.45 Billion
Remote
Monitoring
(2020)
$1.2 Billion
Timeline
2012
Nike Fuel Bands
(Fitness & Healthcare)
2013
Google Glass
(Consumer Electronics)
2014
Samsung Smart Watch
(Consumer Electronics)
2015 (expected)
Apple iWatch
(Consumer Electronics)
Source: Frost & Sullivan
• Future of wearable technology will be
characterized by its functionality, design and
non-intrusiveness
• Wearables are moving away from the face and
wrists and onto glasses, clothes and jewellery

11 M82C-MT
2000s 2014 2015 2016 2016+ 2016+ 2016 2015 2014 2000s
Eye
Facial
Voice
Touch
Gesture
Gaze
controlled
Games
uMoove
Mobile Eye
Scroll phones
Tobii Eye
Tracking
Analytics
cars
PayPal – Pay
with Face
Amscreen
Face
Scanners
Tactical
Identification
System
Google 411
Voice
Search
Windows
Speech
Recognition
Siri -
Personal
Assistant
AMOLED
Touch
Screens
Holographic
Touchscreen
Kinect
Gesture
Gaming
Leapmotion
Computer
Control
Snapdrago
mobile
technology
Transformational Shift #5 – Sensorization of Things Multi-Factor sensory-based trackers revolutionise the field of personal devices
The radial timeline diagram depicts which products are impacted in the next decade by sensory
tracking technology in consumer electronics
Sensory Tracking
Technology in
Consumers
Devices
Source: Frost & Sullivan Analysis

12 M82C-MT
Transformational Shift #6 – Sharing Economy Facilitators and intermediaries take the new form of peer-to-peer / people-to-people marketplace as
the phenomenon of shared economy rises, underlined by online convenience and benefits in savings
Car Sharing
E.g. Zipcar
Clothes Sharing
E.g. Rent-the-runway
Money Sharing
E.g. Lending Club
Goods Sharing
E.g. Ziloc
Space Sharing
E.g. Airbnb
Sharing
Economy Market
Potential1:
$155 Billion by
2020
1Calculations based on Airbnb study on money value of shared economy
Key Commodities Shared and Market Potential Forms of Sharing and Implications
Renting
Swapping
Reusing
Distributing
Lending
Circular
Economy
Crowdsourcing
e-Marketplaces
Source: Frost & Sullivan Analysis

13 M82C-MT
Circular economy refers to an industrial economy, which on contrary to the traditional linear economy, reclaims the
used materials and recycles it as secondary raw materials for new products.
Transformational Shift #7 – Circular Economy Circular Economy to promote efficient use of resources, cleaner production and support resource
optimization and an opportunity in excess of $1 trillion for the global economy.
Suppliers
Manufacturers
Retailers
Consumers
Landfill / Waste Management
Linear
Economy
Circular
Economy
Reuse /
Redistribute
Refurbish /
Remanufacture
Recycle
$700 billion
in consumer
goods material
savings
$1.8 trillion
per annum
savings in
avoiding waste in
textiles
$1.5 billion in
collecting
household food
waste annually in
UK
Savings in reusing /
refurbishing /
recycling
Source: ESA, Ellen MacArthur Foundation, Frost and Sullivan

14 M82C-MT
Transformational Shift #8 –3D Printing The consumer and commercial products are expected to account for 28% of 3D printing revenues by
2020
$1.1 Billion $7.1 Billion
2009
2020
Global 3D Printing Market, Segment Breakdown,
2009 and 2020
Total Market ($Billion)
By Industry (% Share)
Source: Frost & Sullivan Analysis
•Human Organs
•Medical Devices
•Body Tissues
•Nano-medicine
•Pharmaceuticals
Healthcare
•Concept Modeling
•Prototypes
•Spare Parts
•End-use Parts
•Tooling
Automotive
•Manufacturing On-demand
•Cutting Tools
•Customization
•Domestic Production
3D Printed Products in Key Industries
3D printing is a computer-driven additive manufacturing
technology used for producing the final product from a
digital model by laying down successive layers of material.
Design Print Finish
Manufacturing
3D printing begins
with creating a digital
model of the object,
usually using CAD
software
The 3D printer slices
model into numerous
digital cross-sections, and
automatically builds the
model using materials like
thermoplastics
The final 3D printed
object is then cleaned
to remove overhung
material and is
polished for final use
28%
20%
4% 12%
15%
16%
5%
Consumer & Commercial
Automotive
Architecture
Industrial Application
Aerospace & Defense
Medical and Dental
Other
15 M82C-MT
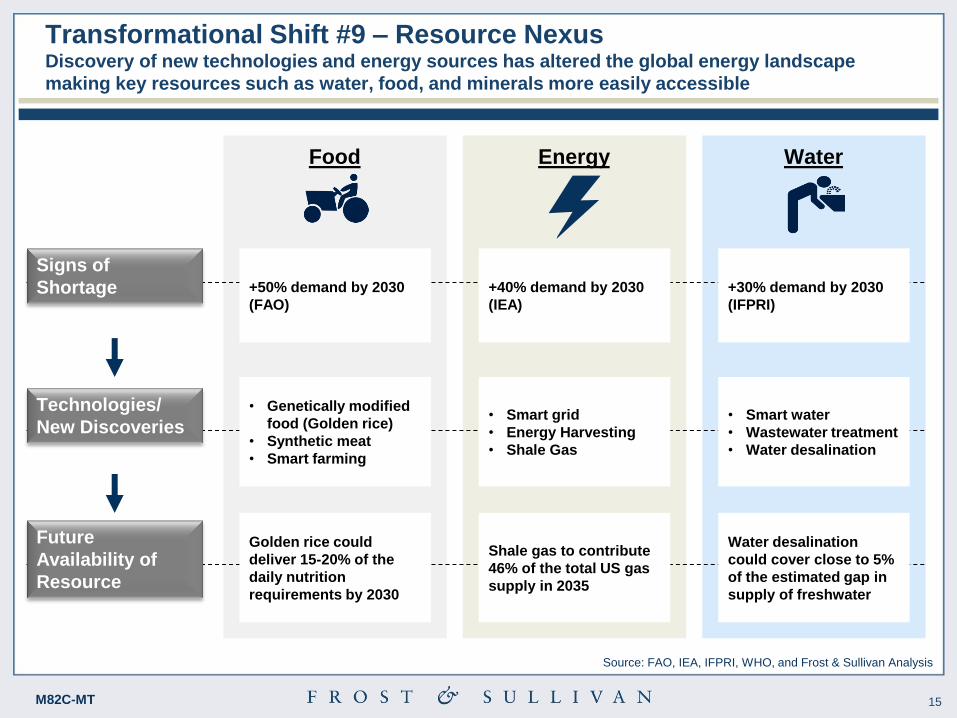
Transformational Shift #9 – Resource Nexus Discovery of new technologies and energy sources has altered the global energy landscape
making key resources such as water, food, and minerals more easily accessible
Signs of
Shortage
Technologies/
New Discoveries
Future
Availability of
Resource
+30% demand by 2030
(IFPRI)
• Smart water
• Wastewater treatment
• Water desalination
Water desalination
could cover close to 5%
of the estimated gap in
supply of freshwater
+40% demand by 2030
(IEA)
• Smart grid
• Energy Harvesting
• Shale Gas
Shale gas to contribute
46% of the total US gas
supply in 2035
+50% demand by 2030
(FAO)
• Genetically modified
food (Golden rice)
• Synthetic meat
• Smart farming
Golden rice could
deliver 15-20% of the
daily nutrition
requirements by 2030
Water Energy Food
Source: FAO, IEA, IFPRI, WHO, and Frost & Sullivan Analysis

16 M82C-MT
Transformational Shift #10 – Rise of the Robots Robots priced between $1,566 and $4,699 could enter our personal lives commercializing the personal
robots market by 2020
2004 2013
ASIMO = $150,000 LUNA = $1,000
Commercialization of Robotics Steep fall in personal robots ownership prices from $150,000 to $1,000
Source: Frost & Sullivan Analysis
• Non-commercial
• Not for sale
• Available only on lending
basis
• Commercial
• Currently available on auction
basis
• Expected to retail between $1,000
and $3,000
Robotics for Elderly Care: Assisted Living
Robots as Teaching Assistants
Robots for household care
Robots as Nannies
Robots for companionship
Robots as personal assistants
Robots at Home (Personal Robot Applications)
2010
$1.29
billion
2020
$17.39
billion
Global Personal Robots Market

17 M82C-MT
Connectivity & Convergence

18 M82C-MT
Connected Living—Breakdown by Segments Connected City leads with an estimated market potential of $392 Billion by 2020; Smart Governance
and Education services will contribute 50% of growth in this segment
2012 Market Segments ($ Billion)
Source: Frost & Sullivan Analysis.
Home
Work
City
2020
*Unified Communication
Products and Solutions
Communication*
Enterprise Social Software
Education
Transportation
Energy
Media and entertainment
Health
Automation and control
Enterprise Mobility
Governance
Banking and Financial
2.35
2.76
26.2
3.48
48.01
36
32.2
28
21.1
0.72
26.90
8.61
5.41
73.10
20.11
145.02
118
99.7
80
76.9
10.44
94.50
Connected Home Total 29.65 111.0
Connected Work Total 74.92 228.44
Connected City Total 122 392.24
Connected Living Total 226.83 731.70
Connected Living Market: Market Size Breakdown by Segments, Global, 2020
19 M82C-MT
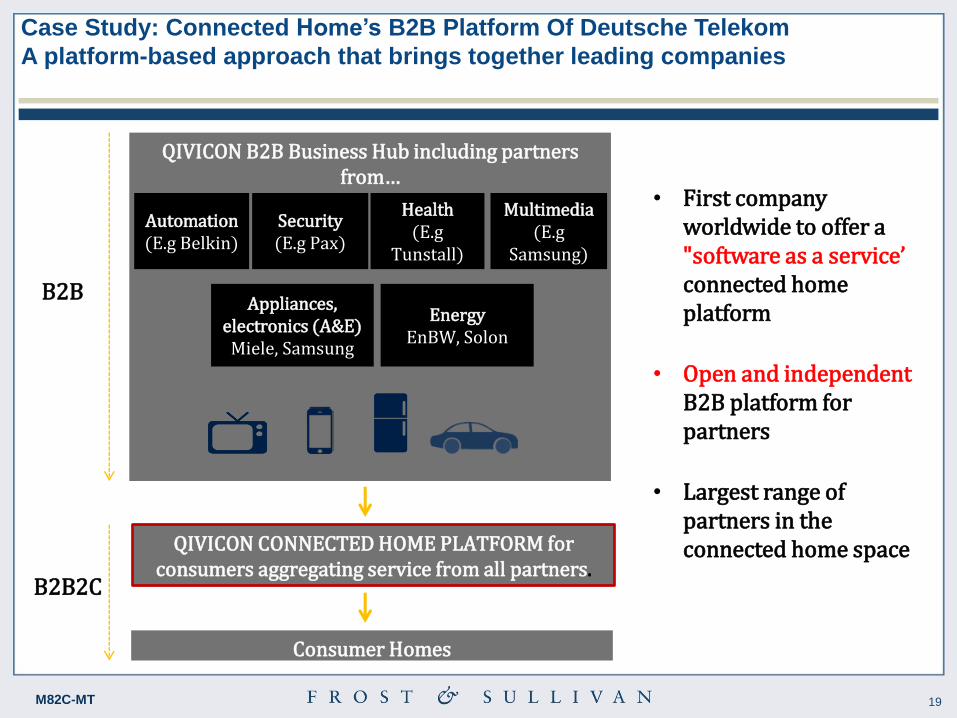
QIVICON B2B Business Hub including partners from…
Health (E.g
Tunstall)
Multimedia (E.g
Samsung)
Automation (E.g Belkin)
Security (E.g Pax)
Energy EnBW, Solon
Appliances, electronics (A&E) Miele, Samsung
QIVICON CONNECTED HOME PLATFORM for consumers aggregating service from all partners.
Consumer Homes
B2B
B2B2C
Case Study: Connected Home‘s B2B Platform Of Deutsche Telekom
A platform-based approach that brings together leading companies
• First company worldwide to offer a "software as a service’ connected home platform
• Open and independent B2B platform for partners
• Largest range of partners in the connected home space

20 M82C-MT
Gamification - solutions to generate $8 billion globally within a decade,
driven by increasing need for consumer engagement
20%
16%
14%
10% 10%
Games SocialNetworking
Enetrtainment Maps/Navigation Video
Consumer App Usage Patterns, Global, 2012
Gamification – a customer interaction approach to design behaviours, develop skills and engage customers
Uses
•Mobile and tablet
applications
•Software programs
•Educational tools
Predicted areas of impact
•Employee performance
•Education
•Personal development
•Customer engagement
platforms
The use of game
mechanics and
design in non game
context to impact
engagement and
outcome
Current enablers
•Mobile
•Cloud
•Social networking
•Location based
services
Future enablers
•Gesture control
•Augmented reality
Source: Deloitte, Google Trends, Frost & Sullivan Analysis.
Gamification Market, Global, 2012-2020, ($ billion)
0.2 0.4 0.9
1.8
3.2
4.9
6.6
7.5
8.3
2012 2013 2014 2015 2016 2017 2018 2019 2020

21 M82C-MT
Implication: Connectivity Is Pushing Convergence Connectivity will Accelerate Convergence of Industries, Products, Technologies and Competition
INDUSTRIES
PRODUCTS
Car Unmanned Technology Autonomous Cars
TECHNOLOGIES
Building Technologies Smart Automation Smart Home Hubs
Space Industry Solar Industry Space Based Solar
Power
1
3
2
Source: Frost & Sullivan analysis Image Source:: ̀ Creative Commons and Dreamstime.
22 M82C-MT
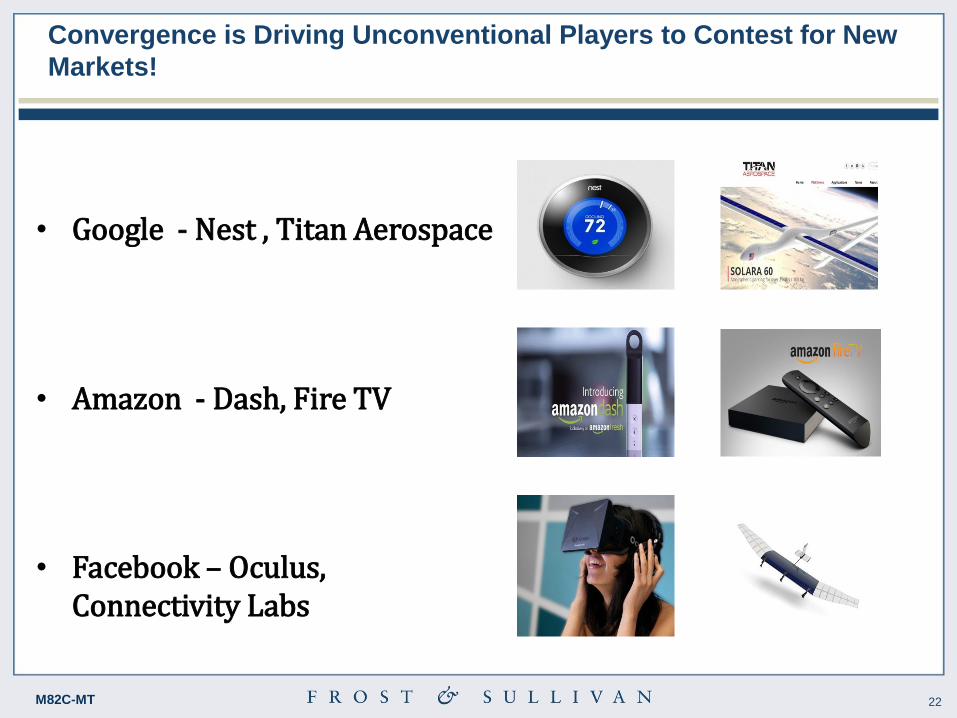
Convergence is Driving Unconventional Players to Contest for New
Markets!
• Google - Nest , Titan Aerospace
• Amazon - Dash, Fire TV
• Facebook – Oculus, Connectivity Labs
23 M82C-MT
Technologies Driving Innovation

24 M82C-MT
Innovation driven future world! We look at ―technology cluster ↔ market ↔ trend‖ interplay to evaluate and pick top 50
technologies (for a given year) from a larger pool of 500+ technology capabilities
Social Trends
Innovating to Zero
Health, Wellness,
& Well-Being
Innovation Ecosystem
Drivers
Markets Mega Trends
Technology Clusters
Information &Communication Technologies
Healthcare

25 M82C-MT
Top 50 Technologies - Selection Methodology
Global Tracking of
500+ Technologies
Across 9 Technology
Clusters
Step 1
IP Activity
Funding
Market Potential
Megatrend Impact
Global Adoption Potential
Industry/ Application Impact
Step 2 Selection of assessment criteria
Weights assigned to each criteria based on
relative importance
Scoring and ranking of each technology on
each criteria to determine ‗Intensity of
Impact‘
‘Year of Impact ‘
score
‘Intensity of
Impact’ score
A
B
Step 3
Su
b-C
on
stru
cts
Top-50 Technologies
Innovation Index Constructs

26 M82C-MT
Global Top 50
Technologies
Nanomedicine Follow-on Biologics Cancer Immunotherapy Synthetic Biology Stem Cell Therapeutics Metabolomics
Big Wind Power Floating LNG Hydraulic Fracking Heat Pumps Li-based Batteries
Solid Waste Up-cycling Desalination Advanced Filtration Air filtration Smart Metering
Wearable Electronics Wireless Charging Printed/Flexible Electronics Smart Haptics & Touch OLED Displays
Polymer Chameleons Self-healing Materials Biochemicals Superhydrophobic Coatings Antimicrobial Coatings Carbon Fibers Lightweight Composites
Lifelogging Touchless Sensing Energy Harvesting Sensor Fusion Machine to Machine
3D Printing Atomic Layer Deposition Multi-material Joining Composites Manufacturing
Digital Tomosynthesis Bio-NEMS Health Informatics Neuromodulation Techniques
Augmented Reality XaaS Platform Dark Data Cognitive Analytics
Information & Communication Technology
Health & Wellness
Sustainable Energy
Clean & Green Environment
Microelectronics
Materials & Coatings Sensors & Controls
Medical Device & Imaging Technology
Advanced Manufacturing & Automation
Context-Aware Computing Predictive Data Analysis Neuromorphic Computing Virtual Reality

27 M82C-MT
Interesting signals associated with Top 50 Technologies Identifying and evaluating macro/micro signals (past, present, forecasted) associated with the
technologies is key to understanding true potential and future impact on markets and industries
Ma
rket
Po
ten
tia
l P
ate
nt
Ac
tivit
y
Fu
nd
ing
C
on
ve
rge
nc
e
$2.8 T over 5 years $120+ B in
2013
175K patents awarded
over last 3 years
Average impact
across
5 industries and
3 Mega Trends

28 M82C-MT
Conclusion:
Impact of The Transformational Shifts
& The Emerging Industries

29 M82C-MT
Top Ten Transformational Shifts by 2020
1
2
3
6
5
9
8
4
7
Connected
Living Big Data
Clouds
Smart Cities
Sharing
Economy
Rise of
Personal
Robotics Sensorization
of Things
Resource
Nexus
Circular
Economy
Wearable
Computing
3D Printing
While all Mega Trends are important, the selection and raking of these trends indicate which seismic
shifts will have particular relevance in shaping the landscape in which the world will evolve this decade.
Impact on Future Products and Services Measured based on most impact on future products and services capabilities resulting in new convergent and
radical devices
Minor Conservative Radical
Gro
wth
Att
rac
tive
nes
s
Assessed b
ased o
n m
ark
et attra
ctiveness in t
erm
s o
f re
venue /
ship
ment.
Hig
h
Lo
w
Source: Frost & Sullivan analysis.
10
30 M82C-MT
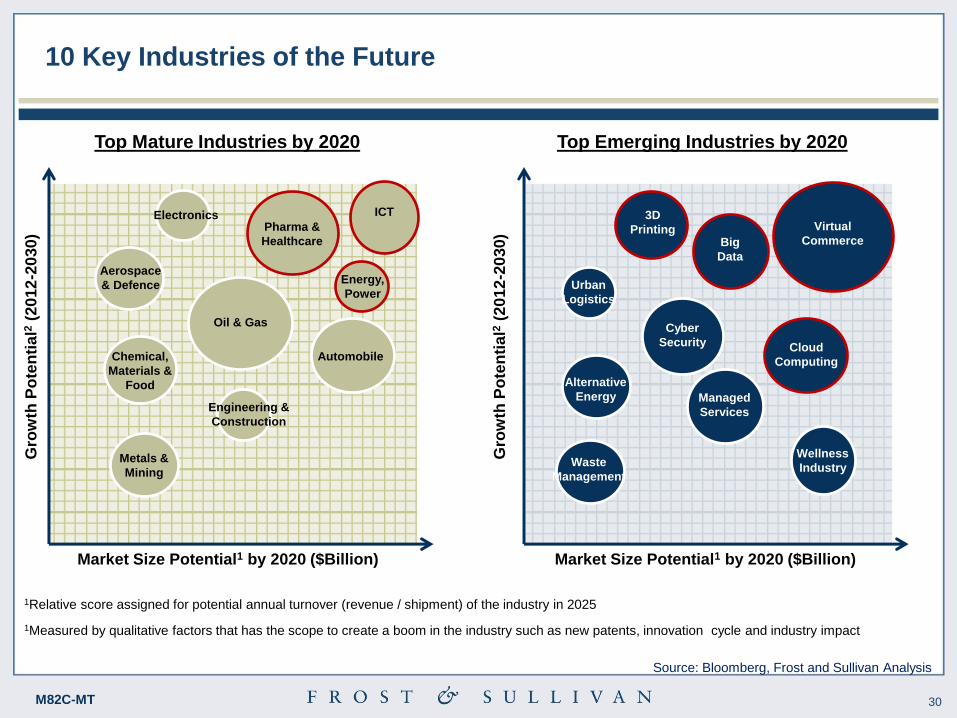
10 Key Industries of the Future
Market Size Potential1 by 2020 ($Billion)
Gro
wth
Po
ten
tia
l2 (
20
12
-20
30)
Market Size Potential1 by 2020 ($Billion)
Gro
wth
Po
ten
tia
l2 (
20
12
-20
30)
Top Mature Industries by 2020 Top Emerging Industries by 2020
1Relative score assigned for potential annual turnover (revenue / shipment) of the industry in 2025
1Measured by qualitative factors that has the scope to create a boom in the industry such as new patents, innovation cycle and industry impact
Source: Bloomberg, Frost and Sullivan Analysis
Oil & Gas
Pharma &
Healthcare
Chemical,
Materials &
Food
ICT
Automobile
Metals &
Mining
Energy,
Power
Aerospace
& Defence
Engineering &
Construction
Electronics Virtual
Commerce Big
Data
3D
Printing
Cloud
Computing
Cyber
Security
Managed
Services
Wellness
Industry
Urban
Logistics
Alternative
Energy
Waste
Management

31 M82C-MT
‗Innovative Convergence‘ Drives Solutions!

32 M82C-MT
Thank You !
Iain Jawad Director Strategic Partnerships
(+44) (0)20 7343 8311
“We Accelerate Growth”


![[Trends]03 mega trends](https://static.fdocuments.in/doc/165x107/58e918e61a28ab6e0e8b58d9/trends03-mega-trends.jpg)