Global market leader in chemical distribution - Brenntag · Portrait oF brenntaG Brenntag is the...
56
GLOBAL MARKET LEADER IN CHEMICAL DISTRIBUTION Interim Report for the first quarter January 1 to March 31, 2010 Q1
Transcript of Global market leader in chemical distribution - Brenntag · Portrait oF brenntaG Brenntag is the...

Global market leader in chemical distributionInterim Report for the first quarter January 1 to March 31, 2010
Q1
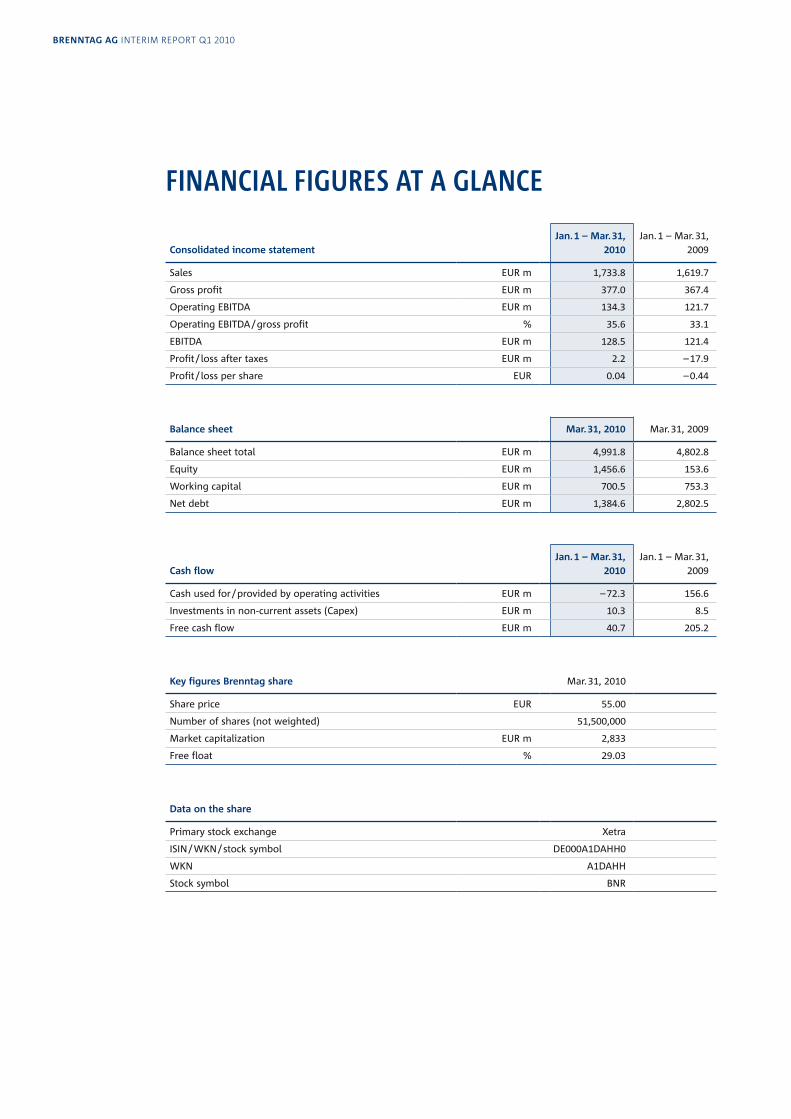
Consolidated income statementJan. 1 – Mar. 31,
2010Jan. 1 – Mar. 31,
2009
Sales EUR m 1,733.8 1,619.7
Gross profit EUR m 377.0 367.4
Operating EBITDA EUR m 134.3 121.7
Operating EBITDA / gross profit % 35.6 33.1
EBITDA EUR m 128.5 121.4
Profit / loss after taxes EUR m 2.2 – 17.9
Profit / loss per share EUR 0.04 – 0.44
Balance sheet Mar. 31, 2010 Mar. 31, 2009
Balance sheet total EUR m 4,991.8 4,802.8
Equity EUR m 1,456.6 153.6
Working capital EUR m 700.5 753.3
Net debt EUR m 1,384.6 2,802.5
Cash flowJan. 1 – Mar. 31,
2010Jan. 1 – Mar. 31,
2009
Cash used for / provided by operating activities EUR m – 72.3 156.6
Investments in non-current assets (Capex) EUR m 10.3 8.5
Free cash flow EUR m 40.7 205.2
Key figures Brenntag share Mar. 31, 2010
Share price EUR 55.00
Number of shares (not weighted) 51,500,000
Market capitalization EUR m 2,833
Free float % 29.03
Data on the share
Primary stock exchange Xetra
ISIN / WKN / stock symbol DE000A1DAHH0
WKN A1DAHH
Stock symbol BNR
Financial FiGures at a Glance
BRenntag ag InterIm report Q1 2010

Portrait oF brenntaG
Brenntag is the global market leader in full-line chemical distribution. Linking chemical manufacturers and chemical users, Brenntag provides business-to-business distribution solutions for industrial and specialty chemicals globally. With over 10,000 products and a vast supplier base, Brenntag offers one-stop shop solutions to more than 150,000 customers. The value-added services include just-in-time delivery, product mixing, formulation, repackaging, inventory management, drum return handling as well as technical services. We aim to be the preferred full-line chemical distributor and partner of choice for our customers and suppliers.
debut oF the brenntaG shareThe IPO of Brenntag AG took place as scheduled in the first quarter of 2010 on March 29, 2010 with 10.5 million
new shares from a capital increase, 2.5 million shares from the holdings of the selling shareholder and 1.95 mil-
lion shares from a greenshoe option being offered. Inter ested investors could subscribe the share at their bank in
the period from March 16 to March 26, 2010. The price range was EUR 46.00 to EUR 56.00. After multiple over-
subscription, the issue price was set at EUR 50.00. Through the full exercise of the greenshoe option, the free float
is currently 29.03 %.
On March 29, 2010, the Brenntag share was traded for the first time on the Frankfurt stock exchange in the Prime
Standard segment. Trading started at EUR 51.10 and thus 2.2 % higher than the issue price. On March 31, 2010, the
share price was EUR 55.00.
content 2 TO OUR SHAREHOlDERS 7 GROUP INTERIM MANAGEMENT REPORT
29 INTERIM CONSOlIDATED FINANCIAl STATEMENTS 46 FURTHER INFORMATION
1

to our shareholders
CEO LETTEr
Brenntag is pleased to provide you with its first interim report as a listed company. We have come a long way from
an egg wholesale business, founded in 1874, to the leading provider of business-to-business distribution solutions
in the chemical distribution sector.
Entering the chemical distribution business nearly a hundred years ago in Germany, we took our first step outside
Germany in 1966 when acquiring a Belgian company. Serious expansion in the United States began in the 1980s,
in 2000 we made our entry into the latin American market and in 2008 Brenntag became the only truly global
chemical distributor with its entry into the Asia Pacific market. While Brenntag has become a world-class inter-
national company with operations in more than 60 countries, it remains headquartered in Mülheim, Germany,
with deep roots in the Ruhr area.
After this long history and significantly accelerated growth in the past two decades, the listing on the German
stock exchange was the next logical step for Brenntag. Against the backdrop of a difficult IPO market, our initial
public offering was carried out according to our plan. The first few trading days on the stock exchange were also
encouraging as Brenntag finished the first quarter 2010 with a share price increase of 10 %. This was only possible
due to the confidence which you – the owners of this company – have placed in us. On behalf of the entire man-
agement board, I would like to thank you for this confidence!
As previously announced, we used the proceeds from the capital increase to repay debt and increase our financial
flexibility which in turn will allow us to vigorously pursue the execution of our growth strategy.
Although the listing process absorbed significant management board capacity, the Brenntag business continued
to run smoothly. This was possible due to our organization’s excellent execution skills and the depth of our senior
management team, some 120 strong, who manage the day-to-day business. As a chemical distributor we add
substantial value to the supply chain between chemical producers and chemical users. We purchase and store
larger-scale quantities of industrial and specialty chemicals, often repackaging them into smaller quantities, and
then sell and deliver them in less-than-truckload quantities to our 150,000 + customers. By offering in excess of
10,000 products – a full-line of chemicals – and value-added services such as just-in-time delivery, product mixing,
formulation, inventory management, drum return handling and technical support, we aim to be the partner of
choice for our customers and suppliers. Even more importantly, we expect to be the market leader in safety and
environmental issues related to our business.
In the first quarter 2010 this resulted in a gross profit of EUR 377.0 million and an operating EBITDA of EUR 134.3 mil-
lion, exceeding the previous year’s first quarter results by 2.6 % and 10.4 % respectively.
2
BRenntag ag InterIm report Q1 2010
In line with longer term trends, Asia Pacific as well as the latin American markets were fast growing areas during
the first quarter. In our latin American region, first quarter 2010 operating gross profit increased by 7.8 % over the
previous year and operating EBITDA increased by 5.2 %. The Asia Pacific region showed even stronger growth,
increasing operating gross profit by 58.1 % and operating EBITDA by 162.5 %. In our other business segments
the business developed satisfactorily. Ongoing efficiency measures and a resilient customer industries mix led to
satisfying results.
Our ongoing growth strategy consists of both organic growth and acquisition initiatives. For organic growth, the
main pillars are
continuous growth of the local businesses directed by highly entrepreneurial local managers,
continuous processes to benefit from the outsourcing of chemical manufacturers’ smaller customers to chemical
distributors,
while serving all manufacturing industries, focusing on higher growth end market industries such as food,
personal care, water treatment, oil and gas, paints / coatings and pharmaceutical, and
global/key accounts, the multi-location accounts for which we have significant strengths.
With regard to external growth, we plan to continue our long-term acquisition path that has three main goals:
expanding the geographic coverage, building up scale and efficiencies in existing regions as well as improving our
full-line product portfolio in targeted customer industries. Acquisitions are driven by a full-time, dedicated corporate
team, who gather and assess global data to determine which candidates meet our strategic and financial objectives.
Due to this structured process, we have been able to complete and successfully integrate 92 acquisitions since 1991.
Accordingly, we expect to be able to continue executing value-enhancing acquisitions.
As for the outlook for the remainder of 2010, we believe the overall economy will continue its modest recovery.
With the aid of this recovery, we expect to be able to exceed the strong results achieved in the last year. On
the cost side, the efficiency measures initiated in 2009 should be fully developed during 2010. Finally, we have
reinvigorated our acquisition activity after a brief hiatus during the economic uncertainties of 2009. Furthermore,
we will establish a continuous process of transparent communication with our shareholders and the financial
community. To achieve this, we have established an investor relations team which is available to answer all your
questions about Brenntag. All contact details can be found at the end of this report.
We are looking forward to continuing Brenntag’s successful trajectory and working for you!
Thanks again for your support.
Mülheim an der Ruhr, May 6, 2010
Stephen R. Clark
Chief Executive Officer
3
to ouR shaReholDeRs Group InterIm manaGement report InterIm ConsolIdated FInanCIal statements Further InFormatIon
CEO letter
BrEnnTag On ThE STOCk MarkET
the IPo of BRenntag ag
The Brenntag floatation took place on the Frankfurt stock exchange on March 29, 2010. Brenntag thus managed
to keep to an ambitious timetable. The public offering in Germany and luxembourg as well as the private placing
with institutional investors outside Germany and luxembourg took place between March 16 and March 26, 2010.
A consortium of eight national and international banks managed the process. The price range was EUR 46.00 to
EUR 56.00. Interest in the Brenntag share was particularly high among institutional investors and consequently
the offering was oversubscribed multiple times. The issue price was set at EUR 50.00.
The offering comprised a total of 14.95 million shares. 10.5 million shares came from a capi tal increase, whose
proceeds flowed directly to Brenntag. In addition, 2.5 million shares came from the holdings of the selling share-
holder and 1.95 million shares by way of overal lotments in connection with a greenshoe option granted to the
underwriting banks by the selling shareholder. The issue volume (including overallotments) thus totalled
EUR 747.5 million and allowed Brenntag to complete one of the biggest initial public offerings in Europe in recent
years. Of the total sum, the company received EUR 525.0 million gross, i.e. before deduction of transaction costs,
from the capital increase.
The new Brenntag share started trading at EUR 51.10, a pleasing 2.2 % increase on the issue price of EUR 50.00. At
the end of the first day of trading, the Brenntag share had gained 8 % to close at EUR 54.00. The volume traded on
the first day was also particularly high with some 2.5 million shares changing hands. The exercise of the greenshoe
option marked the end of the stabilization period on March 31, 2010. No stabilization measures were necessary.
Therefore the greenshoe was exercised early and resulted in a free float of 29.03 %.
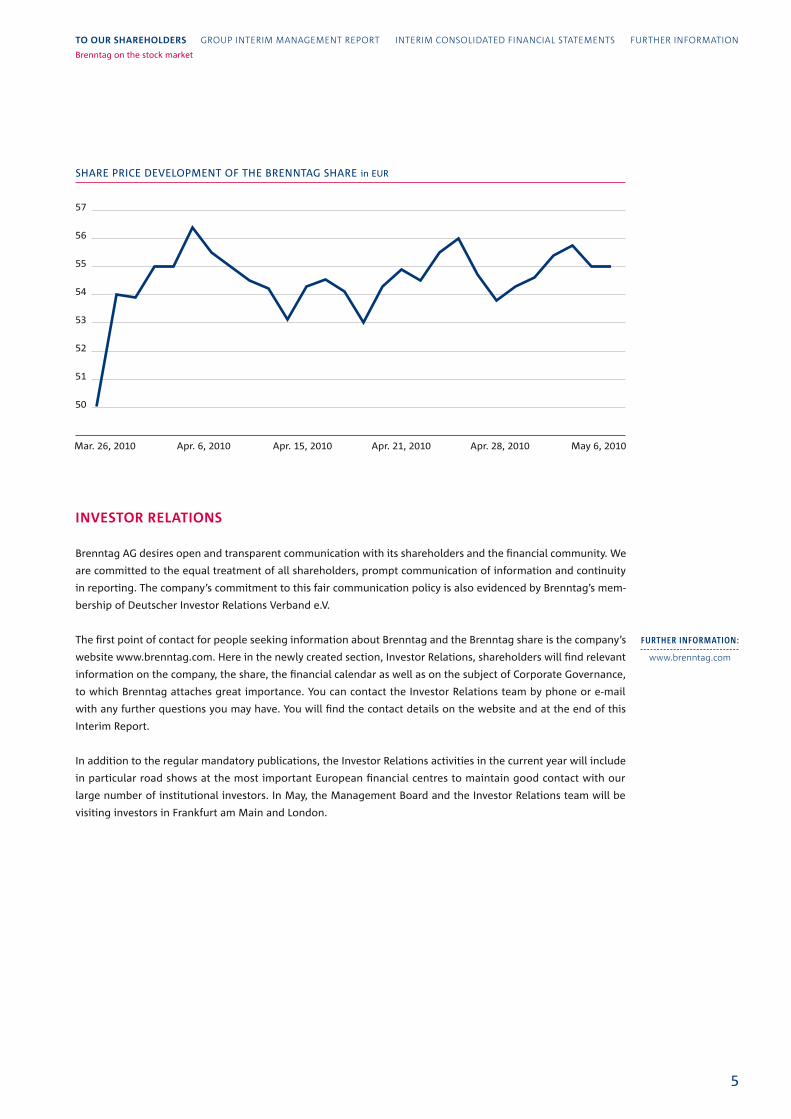
DeveloPMent of the shaRe PRICe
The Brenntag share finished the first quarter – which, since it was first listed on March 29, 2010, only consisted of
three trading days – at a price of EUR 55.00 and thus with a gain of 10 % over the issue price.
The general market development was volatile. Economic data with partly nega tive, but also very positive implica-
tions alternated with reports of the financial problems of some euro countries or of the economic impact of the
volcanic eruption in Iceland. The difference between the DAX high and low in the period between the IPO and
May 6, 2010 was 11 %; with the MDAX, it was 13 %. This trading range on the still new Brenntag share was at 13 %.
After the first turbulent days of trading, the daily volume of Brenntag shares traded stabilized at about 191,000
shares. Projected over a month, some 26 % of the free float is traded in a month. Four designated sponsors ensure
that there is adequate liquidity in the share and that buy and sell orders can be carried out.
4
BRenntag ag InterIm report Q1 2010
Further inFormation:
www.brenntag.com
InvestoR RelatIons
Brenntag AG desires open and transparent communication with its shareholders and the financial community. We
are committed to the equal treatment of all shareholders, prompt communication of information and continuity
in reporting. The company’s commitment to this fair communication policy is also evidenced by Brenntag’s mem-
bership of Deutscher Investor Relations Verband e.V.
The first point of contact for people seeking information about Brenntag and the Brenntag share is the company’s
website www.brenntag.com. Here in the newly created section, Inves tor Relations, shareholders will find relevant
information on the company, the share, the financial calendar as well as on the subject of Corporate Governance,
to which Brenntag attaches great importance. You can contact the Investor Relations team by phone or e-mail
with any further questions you may have. You will find the contact details on the website and at the end of this
Interim Report.
In addition to the regular mandatory publications, the Investor Relations activities in the cur rent year will include
in particular road shows at the most important European financial centres to maintain good contact with our
large number of institutional investors. In May, the Management Board and the Investor Relations team will be
visiting investors in Frankfurt am Main and london.
SHARE PRICE DEVElOPMENT OF THE BRENNTAG SHARE in EUR
57
56
55
54
53
52
51
50
Mar. 26, 2010 Apr. 6, 2010 Apr. 15, 2010 Apr. 21, 2010 Apr. 28, 2010 May 6, 2010495051525354555657
5
to ouR shaReholDeRs Group InterIm manaGement report InterIm ConsolIdated FInanCIal statements Further InFormatIon
Brenntag on the stock market

shaReholDeR stRuCtuRe
Brenntag AG has a free float of 29.03 %, which is 14.95 million shares of the total share capital of 51.5 million
shares. 70.97 % or 36.55 million shares are held by the previous owner, Brachem Acquisition S.C.A., luxembourg,
who has given a commitment that it will not sell any shares without consent of the syndicate banks in the first
six months after the IPO. We have so far received no notifica tion that any other shareholders hold more than 3 %
of the shares.
Below you will find the most important information on the Brenntag share:
Key figures and master data on the share Mar. 31, 2010
Share price EUR 55.00
Number of shares (unweighted) 51.500.000
Market capitalization EUR m 2,833
Free float % 29.03
Free float market capitalization EUR m 822
Most important stock exchange Xetra
ISIN DE000A1DAHH0
WKN A1DAHH
Trading symbol BNR
SHAREHOlDER STRUCTURE as of May 07, 2010 in %
70.97 % Brachem Acquisition S.C.A.
29.03 % Free float
Further inFormation:
www.brenntag.com
6
BRenntag ag InterIm report Q1 2010
GrouP interim manaGement rePortfrom January 1 to March 31, 2010
8 Business and economic environment
8 Business activities and Group structure
9 Corporate strategy
10 Overall economy and situation in the industry
11 Business performance
11 Major events impacting on business
11 Statement by the management on business performance
12 Results of operations and financial condition
12 Results of operations
12 Business performance of the Brenntag Group
14 Business performance in the segments
19 Development of free cash flow
19 Financial position
19 Financing
20 Cash flow
21 Investments
22 Financial and assets position
24 employees
24 subsequent events
24 Risk report
25 Risk management system
26 Opportunities and risks
28 forecast report
7
Brenntag on the stock market
to ouR shaReholDeRs gRouP InteRIM ManageMent RePoRt InterIm ConsolIdated FInanCIal statements Further InFormatIon

BuSinESS and ECOnOMiC EnvirOnMEnT
BusIness aCtIvItIes anD gRouP stRuCtuRe
Brenntag is the global market leader in full-line chemical distribution in terms of sales. Head quartered in Mülheim
an der Ruhr, Germany, the company operates a global network with more than 400 locations in over 60 countries.
With over 10,000 products and a highly diverse supplier base, Brenntag offers one-stop-shop solutions to more
than 150,000 customers.
Brenntag serves as an intermediary between chemical producers, suppliers, on the one hand, and the users of
chemicals, customers, on the other, thus permitting efficient manage ment of the value added chain. Brenntag
buys industrial and specialty chemicals in bulk from its suppliers, stores them in its own and leased distribution
centres, packs them into the quanti ties the customers require and delivers them, typically in less-than-truckloads.
In addi tion, Brenntag offers its customers other value-added services such as just-in-time delivery, product mixing
and blending, repackaging, inventory management, drum return handling as well as technical support. Our broad
customer base makes us an attractive partner for chemical producers wishing to launch new products on the mar-
ket and reach a large number of potential users of a chemical.
As the group’s holding company, Brenntag AG is responsible for the strategy of the Brenntag Group, risk manage-
ment and central financing. Further central departments attached to Brenntag AG are Corporate Communications,
Investor Relations, Corporate Development, Group Accounting, Controlling, Tax, legal Affairs, M & A, HR and IT.
In addition to Brenntag AG, the consolidated financial statements include 29 domestic (December 31, 2009: 29) and
146 foreign (December 31, 2009: 148) fully consolidated subsidiaries and special purpose entities. Five associates
(December 31, 2009: five) are ac counted for at equity.
The business of the Brenntag Group is decentrally organized to be able to react more quickly to the market and
our customers’ needs. Responsibility for operational business lies with the regionally structured segments: Europe,
North America, latin America and Asia / Pacific as well as all other segments. In addition to the headquarter functions
for the entire Group, all other segments also includes the activities of Brenntag International Chemicals, which
buys and sells chemi cals in bulk on an international scale without regional boundaries. The following graph gives
an overview of the global network of the Brenntag Group:
8
BRenntag ag InterIm report Q1 2010

CoRPoRate stRategy
We have set out to be the chemical distributor of choice for our customers and strategic suppliers. We concentrate
on steady and profitable growth. Our strategy is geared to en hancing our products and service offering capabili-
ties by actively pursuing both organic and external growth and maintaining our ongoing focus on profitability
and returns.
focus on enhancing our product and service offering capabilities through organic growth and acquisitionsThe scale and scope of our worldwide operations enable us to leverage our key strengths to further enhance our
product and service offering capabilities through active organic growth. In addition, we continue to seek acquisition
opportunities that assist us in implementing our overall strategy.
Our strategic initiatives around the world follow the guiding principles:
intense customer orientation
full-line product portfolio focused on less-than-truckload deliveries
complete geographic coverage
accelerated growth in target markets
continued commitment to the principles of responsible care and responsible distribu tion
north america Q1 2010
Sales EUR m 545.2
Operating gross profit EUR m 134.7
Operating EBITDA EUR m 56.4
Employees 1) 3,332
latin america Q1 2010
Sales EUR m 164.1
Operating gross profit EUR m 31.8
Operating EBITDA EUR m 10.1
Employees 1) 1,208
europe Q1 2010
Sales EUR m 927.4
Operating gross profit EUR m 211.5
Operating EBITDA EUR m 70.4
Employees 1) 6,053
asia / Pacific Q1 2010
Sales EUR m 18.5
Operating gross profit EUR m 4.9
Operating EBITDA EUR m 2.1
Employees 1) 182
Figures excluding all other segments which, in addition to various holding companies, covers the international activities of Brenntag International Chemicals.
1) Number of employees determined on the basis of full-time equivalents.
9
to our shareholders gRouP InteRIM ManageMent RePoRt InterIm ConsolIdated FInanCIal statements Further InFormatIon
Business and economic environment

focus on profitability and returnsOn the basis of our entrepreneurial culture, excellence in execution and our superior busi ness model, we also
strive to further improve gross profits, EBITDA, cash flow and return on assets. The strategic initiatives outlined
above are aimed at improving our profitability and returns by leveraging our scale and scope, both organically and
through acquisitions. In ad dition, we focus on specific cost initiatives to further improve profitability and returns.
oveRall eConoMy anD sItuatIon In the InDustRy
The current economic data indicate that the global economy is continuing its recovery in the spring of 2010,
although the pace of expansion varies greatly from region to region. In some emerging economies, above all in
Asia, the growth rates are very high, whilst the economic performance of the industrial countries is less robust as
it is mainly driven by expansive mone tary policy and the pick-up in demand from Asia. Overall, economic growth
in the indus trial countries as a whole can be expected to be slow this year. Economic indicators on macro economic
development for the first quarter of 2010 have yet to be published, but provi sional statistics on industrial output
for the first months of the year show the trends in the differ ent economic regions.
In the eurozone, economic growth slowed again towards the end of 2009. After moderate growth in the third
quarter, real gross domestic product stagnated in the fourth quarter. In the industrial sector, the indicators avail-
able for the beginning of the year indicate that the situa tion has slightly improved. For example, industrial output
throughout the EU rose in January by 1.7 % compared with the previous month and by a further 0.7 % in February.
In the first two months, production was 2.1 % up on the same period in 2009, the main momentum for growth
coming from some West European countries, whilst industrial output declined in the Nordic countries as well as
Spain and Greece. In Eastern Europe the drivers of growth were Poland, Hungary and the Czech Republic.
The US economy continued to recover after pulling out of the recession in the autumn of 2009. After growth of 1.7 %
in the last quarter of 2009, industrial production expanded by 1.9 % in the first three months of 2010 compared
with the previous quarter. Growth was 2.4 % compared with the first three months of 2009. This growth was
accompanied by rising demand for raw and auxiliary materials, which was also reflected in the increasing volumes
of chemicals sold. Canadian industrial activity showed only slight growth due to the unfavourable development of
the Canadian dollar against the US dollar and the weak development in the energy sector. After growing by 0.5 %
in December, industrial output expanded by 1.3 % in January compared with the previous month. In comparison
to January of 2009, however, production shrank by 1.9 %.
In latin America, the economic upswing has increasingly picked up speed since last summer. Industrial activity in
the region has particularly benefited from the growing demand from Asia for raw materials and rising raw material
prices. Therefore, industrial production in the first quarter is expected to have risen by 14 % in Brazil and by 6 % in
Mexico compared with the same pre-year quarter. The market conditions for chemical distributors thus further
improved in the first quarter of 2010 compared with the fourth quarter and above all compared with the first
quarter of 2009. However, the uncertain political situation in Venezuela in conjunction with the devaluation of the
local currency has had a negative impact on the business climate there.
10
BRenntag ag InterIm report Q1 2010

In the emerging economies of Asia, economic recovery already started in mid-2009 and was stronger than in the
industrial countries. The sharp expansion of production and demand con tinued at the beginning of the year. The
region’s gross domestic product in the first quarter is expected to have grown by 9 % compared with the same
quarter of 2009. A main driver of this development is industrial production, which is likely to have increased by 18 %.
BuSinESS PErfOrManCE
MaJoR events IMPaCtIng on BusIness
For the Brenntag Group, the first quarter of 2010 was dominated by the IPO, which took place on the Frankfurt
stock exchange on March 29, 2010. The issue price of the Brenntag share was set at EUR 50.00.
The offering comprised a total of 14.95 million shares. Of this figure, 10.5 million came from a capital increase, the
proceeds of which totalling EUR 525.0 million gross, i.e. before deduction of transaction costs, flowed directly to
Brenntag. In addition, 4.45 million shares came from the holdings of the selling shareholder, Brachem Acquisition
S.C.A., luxembourg including the overallotments from the greenshoe option. Thus the issue volume (including
the greenshoe exercise) totalled EUR 747.5 million.
Brachem Acquisition S.C.A., luxembourg, now holds 36.55 million shares or 70.97 % of the total share capi tal of
51.5 million shares. The free float share is 29.03 %.
The funds which flowed to the company from the capital increase were used to repay in full the borrowings under
the Mezzanine Facility Agreement (EUR 438.6 million as of December 31, 2009) on March 31, 2010 including the
outstanding inter est. A further EUR 69.0 million is to be used for early repay ment of part of the borrowings under
the Second lien Facility Agreement of the syndicated loan.
Moreover, the shareholder loan from Brachem Acquisition S.C.A., luxembourg, including in terest accrued up to
March 28, 2010 was contributed to equity after offsetting of receivables from Brachem Acquisition S.C.A, luxembourg.
The additional paid-in capital thus increased by EUR 714.9 million, which enabled us to considerably strengthen
our equity base and corre spondingly reduce net debt.
stateMent By the ManageMent on BusIness PeRfoRManCe
The business environment of the Brenntag Group showed a slight recovery in all regions compared with the reces-
sion in the first quarter of 2009, although the extent of the recovery varied.
Against this background, we managed to considerably increase revenues compared with the first quarter of 2009,
above all driven by significantly higher volumes. The operating gross profit did not increase at the same rate as
sales. The development of op erating gross profit was also affected by the slightly higher share of high-volume but
lower-margin business in the product mix.
11
to our shareholders gRouP InteRIM ManageMent RePoRt InterIm ConsolIdated FInanCIal statements Further InFormatIon
Business and economic environmentBusiness performance
In 2009, we introduced a number of initiatives to lower costs. On the one hand, we reduced the headcount and
thus also personnel expenses and, on the other hand, we took a close look at all other operating costs. Further-
more, we analyzed and further improved our internal structures and processes. We are now reaping the benefits
in lower costs compared with the first quarter of 2009 as these measures take full effect.
Against an increase in gross profit we managed to keep the operating expenses stable which resulted in a significant
operating EBITDA growth.
Trade working capital rose compared with the low level at the end of 2009, mainly due to the growth of sales. We
managed to limit the increase based on further improved efficiency in working capital management.
Investment in property, plant and equipment increased slightly compared with the same pre-year quarter. Due to
our business model the investment level is rather low and highly flexible.
Given the overall economic environment the development of our business, the results of operations and the financial
condition of the company were highly positive.
The most important event in the first quarter of 2010 was the IPO of Brenntag AG which en abled us to strengthen
our equity base and reduce net debt. We are convinced that we are very well positioned to continue growing both
organically and through acquisitions.
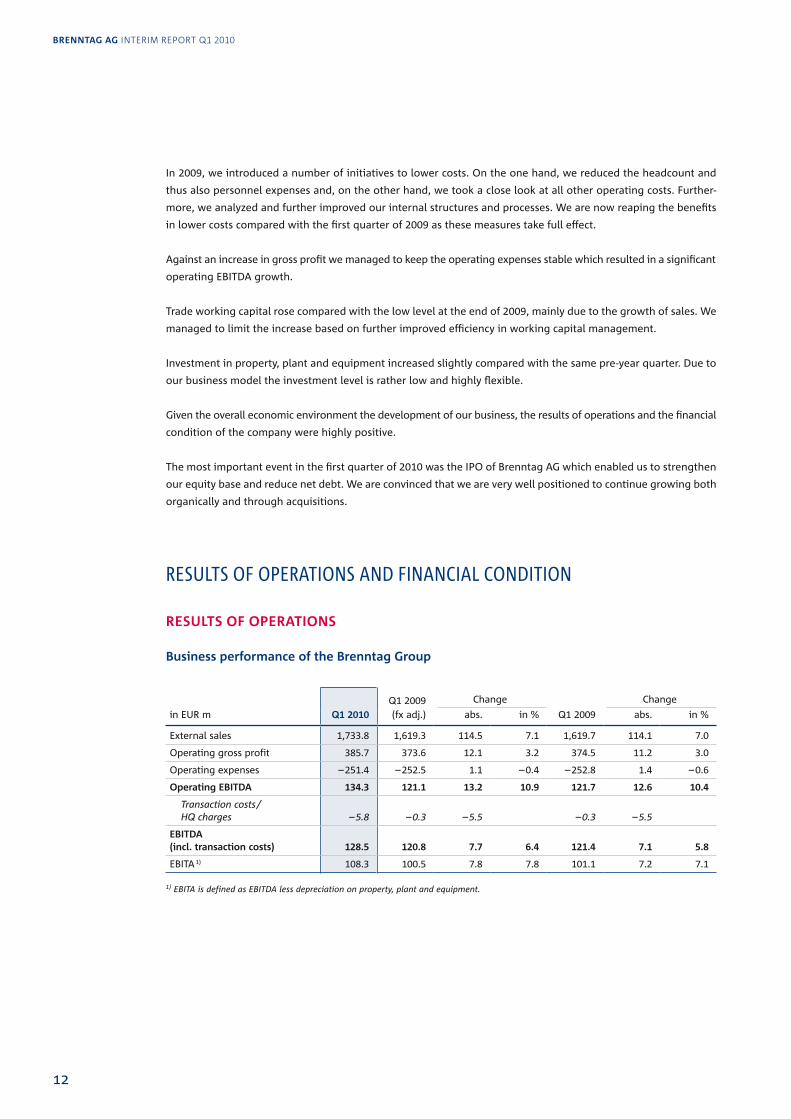
rESuLTS Of OPEraTiOnS and finanCiaL COndiTiOn
Results of oPeRatIons
Business performance of the Brenntag group
in EUR m Q1 2010Q1 2009 (fx adj.)
Change
Q1 2009
Change
abs. in % abs. in %
External sales 1,733.8 1,619.3 114.5 7.1 1,619.7 114.1 7.0
Operating gross profit 385.7 373.6 12.1 3.2 374.5 11.2 3.0
Operating expenses – 251.4 – 252.5 1.1 – 0.4 – 252.8 1.4 – 0.6
operating eBItDa 134.3 121.1 13.2 10.9 121.7 12.6 10.4
Transaction costs / HQ charges – 5.8 – 0.3 – 5.5 – 0.3 – 5.5
eBItDa (incl. transaction costs) 128.5 120.8 7.7 6.4 121.4 7.1 5.8
EBITA 1) 108.3 100.5 7.8 7.8 101.1 7.2 7.1
1) EBITA is defined as EBITDA less depreciation on property, plant and equipment.
12
BRenntag ag InterIm report Q1 2010
The measure of our results mainly used for control of the Brenntag Group is EBITDA. The segments are controlled
on the basis of operating EBITDA, which is the operating profit/loss as recorded in the consolidated income state-
ment plus amortization of intangible assets and depreciation of property, plant and equipment, adjusted for the
follow ing items:
transaction costs: costs connected with restructuring and refinancing under com pany law, particularly the
IPO in 2010. They are eliminated for purposes of man agement reporting to permit proper presentation of the
operating performance and comparability on segment level.
headquarters charges: certain intercompany charges imposed on the operating com panies. Operating compa-
nies cannot be held responsible for the amount that they are charged. So these charges are eliminated for
purposes of management re porting. On Group level they net to zero.
I. EBITDA
The Brenntag Group posted EBITDA of EUR 128.5 million in the reporting period. That is an in crease of 5.8 % com-
pared with the previous period or 6.4 % on a constant currency basis. Adjusted for transaction costs and headquarter
charges, the operating EBITDA was EUR 134.3 million. That is an increase of 10.4 % compared with the previous
year or 10.9 % on a con stant currency basis. We managed to achieve this in a slightly brightening economic climate
which was reflected in higher sales volumes. Furthermore, we profited from the cost-cutting measures introduced
in 2009, which are now taking full effect.
II. Sales, volumes and prices
In the reporting period, the Group recorded external sales of EUR 1,733.8 million, an increase of 7.0 % on the
figure for 2009 or 7.1 % on a constant currency basis. This sales growth is mainly due to higher volumes sold on
the basis of lower average selling prices year on year. In the first quarter 2010 the average selling price was
roughly in line with the 2009 year-end level.
III. Operating gross profit
In the reporting period, the Group recorded an operating gross profit of EUR 385.7 million, which was 3.0 % higher
than in the previous period or 3.2 % on a constant currency basis. This in crease is also due to higher sales volumes.
IV. Operating expenses
In the reporting period, operating expenses (excluding interest, the result from investments, taxes, depreciation,
amortization and transaction costs) were slightly lower than in the previous period (0.6 % and 0.4 % on the basis
of constant exchange rates). Although we saw a rise in volume-related expense, we benefited from the restructuring
and cost-cutting measures im plemented in 2009.
13
to our shareholders gRouP InteRIM ManageMent RePoRt InterIm ConsolIdated FInanCIal statements Further InFormatIon
Business performanceResults of operations and financial condition

V. Depreciation, amortization and financial result
In the reporting period, depreciation of property, plant and equipment and amortization of intangible assets
amounted to EUR 51.2 million and therefore remained roughly constant com pared with the previous year. Of this
figure, EUR 31.0 million relate to amortization of intangi ble assets, including in particular the amortization of the
customer base, which was capitalized as part of the purchase price allocation following the acquisition of the
Brenntag Group by the equity funds advised by BC Partners, Bain Capital and Goldman (EUR 25.8 million).
Deprecia tion of property, plant and equipment totalled EUR 20.2 million.
The finance costs in the first quarter 2010 were impacted by extraordinary expense of EUR 20.8 million in connec-
tion with the restructuring of the syndicated loan due to the IPO. Furthermore, the non-cash interest cost on the
shareholder loan was slightly higher due to compound interest effects. Adjusted for these effects, finance cost was
lower than in the first quarter of 2009.
In the previous year, the result of investments accounted for at equity includes the loss of EUR 12.7 million from
the sale of Staub & Co. Chemiehandelsgesellschaft mbH, Nuremberg. By contrast, the first quarter of 2010 shows
no such special influences.
VI. Profit before taxes
In the reporting period, the profit before taxes amounted to EUR 3.7 million, whereas in the prior period the com-
pany recorded a pre-tax loss of EUR 1.8 million. It has to be considered that the result of the first quarter 2010
includes IPO costs amounting to EUR 5.7 million net (i.e. net of amounts charged to Brachem Acquisition S.C.A.
luxembourg) as well as one-off costs amounting to EUR 20.8 million in connection with the restructuring of the
syndicated loan and in addition an amount of EUR 5.4 million resulting from the early termination of hedge
accounting for certain interest swaps. Furthermore the result of the first quarter 2010 includes interest expenses
amounting to EUR 17.0 million relating to the shareholder loan that was contributed to the additional paid-in
capital of Brenntag AG on March 28, 2010. Adjusted for these costs the profit before taxes would amount to
EUR 52.6 million.
VII. Income tax and net income
At EUR 1.5 million, income tax expense is well below the comparable figure for the previous year. The planned
Group tax rate for 2010 was applied when determining tax expense in the first quarter of 2010. This tax rate takes
the effects of the IPO into consideration.
Profit after taxes for the Group is EUR 2.2 million
Business performance in the segments
The picture for the first quarter 2010 by segment is as follows:
Brenntag group in EUR m total Europe
NorthAmerica
latinAmerica
Asia / Pacific
All other segments
External sales 1,733.8 927.4 545.2 164.1 18.5 78.6
Operating gross profit 385.7 211.5 134.7 31.8 4.9 2.8
Operating expenses – 251.4 – 141.1 – 78.3 – 21.7 – 2.8 – 7.5
operating eBItDa 134.3 70.4 56.4 10.1 2.1 – 4.7
14
BRenntag ag InterIm report Q1 2010

europe
in EUR m Q1 2010Q1 2009 (fx adj.)
Change
Q1 2009
Change
abs. in % abs. in %
External sales 927.4 861.7 65.7 7.6 846.6 80.8 9.5
Operating gross profit 211.5 201.3 10.2 5.1 198.3 13.2 6.7
Operating expenses – 141.1 – 142.1 1.0 – 0.7 – 140.3 – 0.8 0.6
operating eBItDa 70.4 59.2 11.2 18.9 58.0 12.4 21.4
I. Operating EBITDA
In the first quarter of 2010, the European companies posted operating EBITDA of EUR 70.4 mil lion. Thus operating
EBITDA rose compared with the same period of 2009 by 21.4 %. On a constant currency basis, the increase was
18.9 %. This result was achieved in an overall economic environment that showed moderate growth compared
with the previous year. The efforts of many European governments and central banks to stimulate aggregate
demand made a significant contribution to this development.
At regional level, our companies in the UK, Benelux and Italy reported a significant increase in operating EBITDA
of more than 20 %. In these companies, performance was driven by higher sales volumes which they managed to
translate into double-digit growth of operating gross profit. Furthermore, our Spanish company clearly exceeded
its operating EBITDA of the pre vious year, benefiting from the restructuring measures implemented in 2009.
II. Sales, volumes and prices
External sales in Europe rose compared with the same period of 2009 by 9.5 % to EUR 927.4 million, which is an
increase of 7.6 % on a constant currency basis. This development was driven by a significant increase in sales
volumes. On the one hand we saw an improvement in the overall economic climate compared with recession-
plagued first quarter of 2009. On the other hand, we estimate that we have managed to grow our market share.
The average selling price in the first quarter of 2010 was slightly lower than in the first quarter of 2009.
III. Operating gross profit
The operating gross profit in the first quarter of 2010 was EUR 211.5 million, which is an in crease over the same
period of 2009 of 6.7 % or 5.1 % on a constant currency basis. This increase was driven by the positive development
of sales volumes partly offset by the increased share of high-volume but low-margin products in the portfolio.
IV. Operating expenses
We saw an encouraging trend in operating expenses. At EUR 141.1 million, they were 0.6 % higher than the figure
for the first quarter of 2009, but on a constant currency basis in fact 0.7 % lower, although the business volume
measured by sales volumes increased significantly. The reduction in personnel expenses due to the lower head-
count compared with the first quarter of 2009 had the greatest impact. We also managed to reduce other major
cost cate gories. These cost savings are the result of restructuring measures implemented in 2009 that are now
taking full effect.
15
to our shareholders gRouP InteRIM ManageMent RePoRt InterIm ConsolIdated FInanCIal statements Further InFormatIon
Results of operations and financial condition

north america
in EUR m Q1 2010Q1 2009 (fx adj.)
Change
Q1 2009
Change
abs. in % abs. in %
External sales 545.2 544.8 0.4 0.1 564.6 – 19.4 – 3.4
Operating gross profit 134.7 136.4 – 1.7 – 1.2 141.2 – 6.5 – 4.6
Operating expenses – 78.3 – 80.6 2.3 – 2,9 – 83.3 5.0 – 6,0
operating eBItDa 56.4 55.8 0.6 1.1 57.9 – 1.5 – 2.6
I. Operating EBITDA
The North American companies posted operating EBITDA of EUR 56.4 million in the reporting period. Therefore,
the operating EBITDA was 2.6 % down on the high figure for the first quarter of 2009. On a constant currency basis,
the result for the first quarter of 2009 was even increased by 1.1 % or EUR 0.6 million.
This positive picture was seen in most regions. Especially the Great lakes and Southeast region as well as our
Specialty Chemicals business benefited from strong demand and turned-over business from suppliers. On the other
hand, the Oil and Gas business in North America had to cope with the development in the oil and gas industry.
II. Sales, volumes and prices
In the North America segment, we posted external sales of EUR 545.2 million in the reporting period. Compared
with the first quarter of 2009, this is a slight decrease of 3.4 %; on a constant currency basis, sales remained more
or less on a par with the previous year (0.1 %). The recovery of the US economy was re flected in growing demand
from our customers. However, the very high average selling price in the first quarter of 2009 returned to normal
over the course of 2009.
III. Operating gross profit
The operating gross profit of the North American companies totalled EUR 134.7 million in the first quarter of
2010, a decrease of 4.6 % compared with the same period in 2009. On a con stant currency basis, the operating
gross profit fell slightly by 1.2 %.
IV. Operating expenses
At EUR 78.3 million, operating expenses in the reporting period decreased by EUR 6.0 million com pared with
expenses in the first quarter of 2009. On a constant currency basis, operating costs were cut by 2.9 %. Against
higher sales volumes, the North American companies managed to fully take advantage of the savings generated
by the restructuring measures initiated in 2009.
16
BRenntag ag InterIm report Q1 2010

latin america
in EUR m Q1 2010Q1 2009 (fx adj.)
Change
Q1 2009
Change
abs. in % abs. in %
External sales 164.1 164.4 – 0.3 – 0.2 161.6 2.5 1.5
Operating gross profit 31.8 30.1 1.7 5.6 29.5 2.3 7.8
Operating expenses – 21.7 – 20.3 – 1.4 6.9 – 19.9 – 1.8 9.0
operating eBItDa 10.1 9.8 0.3 3.1 9.6 0.5 5.2
I. Operating EBITDA
Our companies in the latin America segment posted operating EBITDA of EUR 10.1 million in the first quarter of
2010. Therefore, they managed to record an increase of 5.2 % compared with the same period of 2009, or 3.1 % on
a constant currency basis.
The latin American economies appeared to be further stabilizing in the first quarter of 2010. After the recession
in 2009, most countries returned to a path of growth in terms of gross domestic product. This is particularly true
for our important markets in Brazil and Mexico. Vene zuela is, however, still suffering from the instable economic
and financial situation, espe cially the devaluation of the local currency against the US dollar.
II. Sales, volumes and prices
At EUR 164.1 million, the latin American companies recorded sales which were at the level of the same period in
2009 (1.5 % or – 0.2 % on a constant currency basis). While sales volumes increased, the average selling price was
slightly lower than in the first quar ter of 2009.
III. Operating gross profit
In the reporting period, operating gross profit of the latin American companies increased by 7.8 % (5.6 % on a
constant currency basis) to EUR 31.8 million as a result of higher sales vol umes compared with the previous year.
IV. Operating expenses
Operating expenses rose by 9.0 % (6.9 % on a constant currency basis) to EUR 21.7 million in the reporting period.
This rise was mainly due to higher volume-related expenses.
17
to our shareholders gRouP InteRIM ManageMent RePoRt InterIm ConsolIdated FInanCIal statements Further InFormatIon
Results of operations and financial condition
asia / Pacific
in EUR m Q1 2010Q1 2009 (fx adj.)
Change
Q1 2009
Change
abs. in % abs. in %
External sales 18.5 15.3 3.2 20.9 13.8 4.7 34.1
Operating gross profit 4.9 3.4 1.5 44.1 3.1 1.8 58.1
Operating expenses – 2.8 – 2.5 – 0.3 12.0 – 2.3 – 0.5 21.7
operating eBItDa 2.1 0.9 1.2 133.3 0.8 1.3 162.5
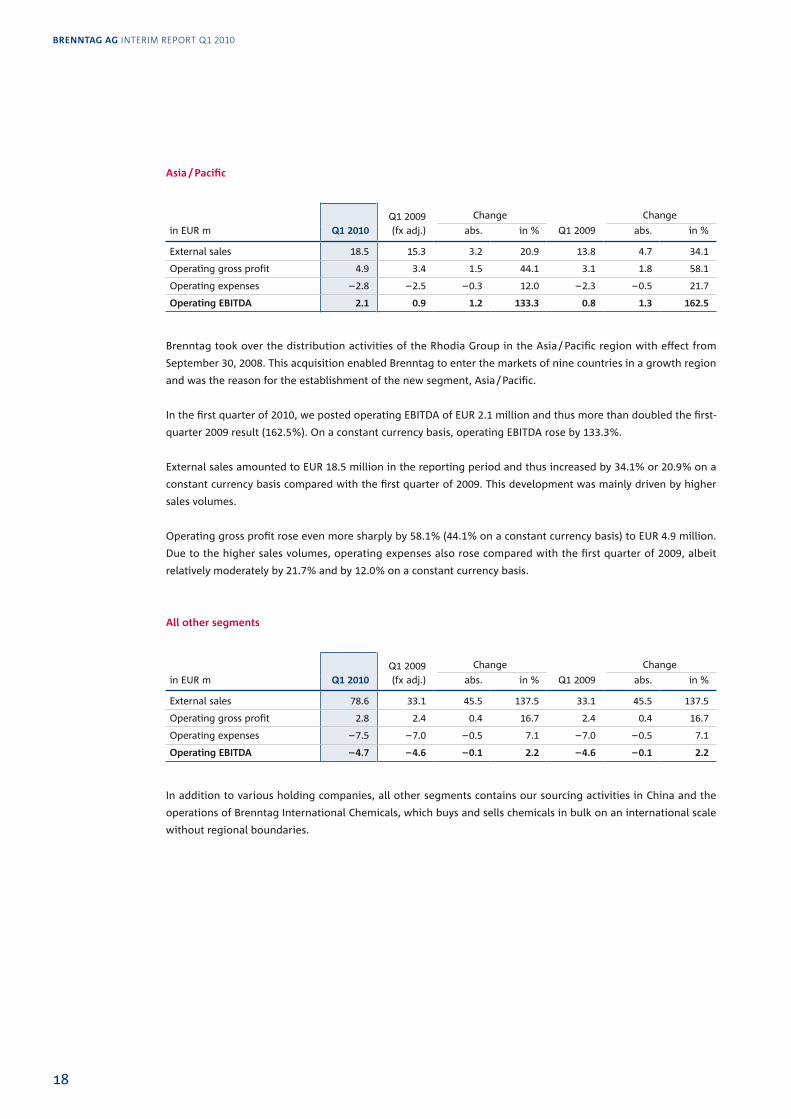
Brenntag took over the distribution activities of the Rhodia Group in the Asia / Pacific region with effect from
September 30, 2008. This acquisition enabled Brenntag to enter the markets of nine countries in a growth region
and was the reason for the establishment of the new segment, Asia / Pacific.
In the first quarter of 2010, we posted operating EBITDA of EUR 2.1 million and thus more than doubled the first-
quarter 2009 result (162.5 %). On a constant currency basis, operating EBITDA rose by 133.3 %.
External sales amounted to EUR 18.5 million in the reporting period and thus increased by 34.1 % or 20.9 % on a
constant currency basis compared with the first quarter of 2009. This development was mainly driven by higher
sales volumes.
Operating gross profit rose even more sharply by 58.1 % (44.1 % on a constant currency ba sis) to EUR 4.9 million.
Due to the higher sales volumes, operating expenses also rose com pared with the first quarter of 2009, albeit
relatively moderately by 21.7 % and by 12.0 % on a constant currency basis.
all other segments
in EUR m Q1 2010Q1 2009 (fx adj.)
Change
Q1 2009
Change
abs. in % abs. in %
External sales 78.6 33.1 45.5 137.5 33.1 45.5 137.5
Operating gross profit 2.8 2.4 0.4 16.7 2.4 0.4 16.7
Operating expenses – 7.5 – 7.0 – 0.5 7.1 – 7.0 – 0.5 7.1
operating eBItDa – 4.7 – 4.6 – 0.1 2.2 – 4.6 – 0.1 2.2
In addition to various holding companies, all other segments contains our sourcing activities in China and the
operations of Brenntag International Chemicals, which buys and sells chemicals in bulk on an international scale
without regional boundaries.
18
BRenntag ag InterIm report Q1 2010
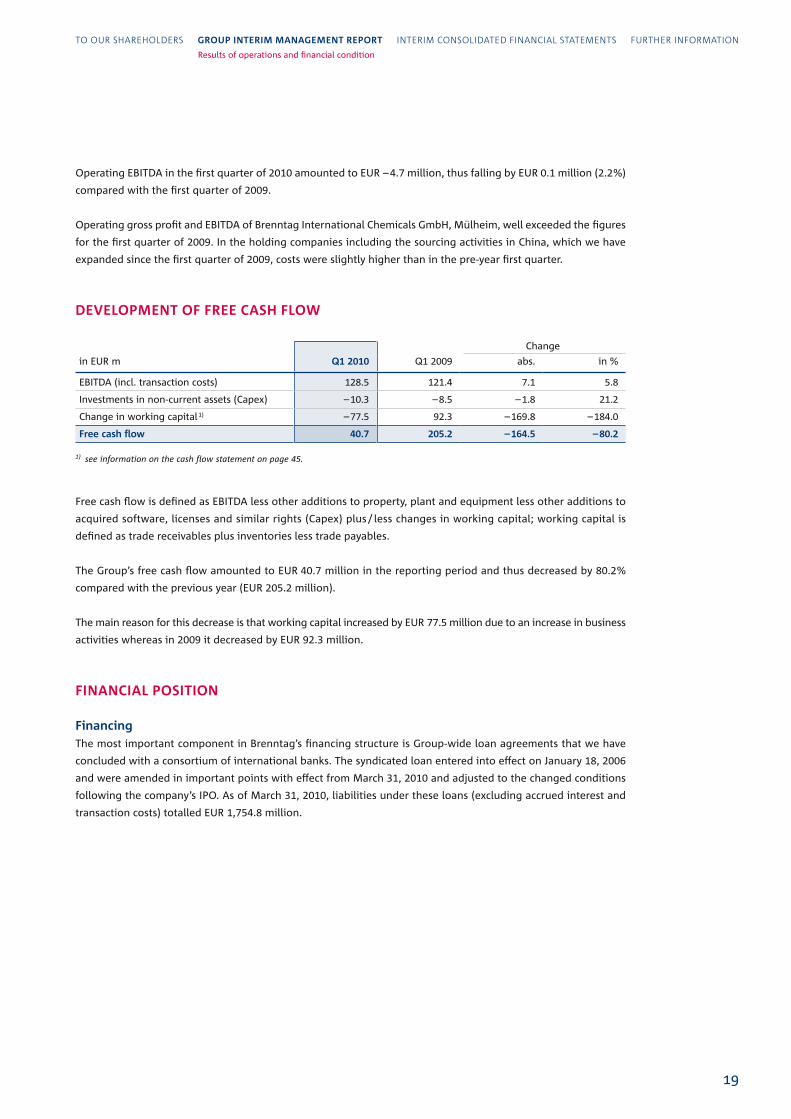
Operating EBITDA in the first quarter of 2010 amounted to EUR – 4.7 million, thus falling by EUR 0.1 million (2.2 %)
compared with the first quarter of 2009.
Operating gross profit and EBITDA of Brenntag International Chemicals GmbH, Mülheim, well exceeded the figures
for the first quarter of 2009. In the holding companies including the sourcing activities in China, which we have
expanded since the first quarter of 2009, costs were slightly higher than in the pre-year first quarter.
DeveloPMent of fRee Cash flow
in EUR m Q1 2010 Q1 2009
Change
abs. in %
EBITDA (incl. transaction costs) 128.5 121.4 7.1 5.8
Investments in non-current assets (Capex) – 10.3 – 8.5 – 1.8 21.2
Change in working capital 1) – 77.5 92.3 – 169.8 – 184.0
free cash flow 40.7 205.2 – 164.5 – 80.2
1) see information on the cash flow statement on page 45.
Free cash flow is defined as EBITDA less other additions to property, plant and equipment less other additions to
acquired software, licenses and similar rights (Capex) plus / less changes in working capital; working capital is
defined as trade receivables plus inventories less trade payables.
The Group’s free cash flow amounted to EUR 40.7 million in the reporting period and thus decreased by 80.2 %
compared with the previous year (EUR 205.2 million).
The main reason for this decrease is that working capital increased by EUR 77.5 million due to an increase in business
activities whereas in 2009 it decreased by EUR 92.3 million.
fInanCIal PosItIon
financingThe most important component in Brenntag’s financing structure is Group-wide loan agree ments that we have
concluded with a consortium of international banks. The syndi cated loan entered into effect on January 18, 2006
and were amended in important points with effect from March 31, 2010 and adjusted to the changed conditions
following the company’s IPO. As of March 31, 2010, liabilities under these loans (excluding accrued interest and
transaction costs) totalled EUR 1,754.8 million.
19
to our shareholders gRouP InteRIM ManageMent RePoRt InterIm ConsolIdated FInanCIal statements Further InFormatIon
Results of operations and financial condition

Our financing is largely provided by long-term financing instruments which are broken down into vari ous tranches
with different maturity dates. Our plans provide for the capital require ments for operating activities and invest-
ments in property, plant and equipment to be cov ered by the cash pro vided by operating activities so that no
further loans are necessary for the operating busi ness. As part of the syndicated loan, we also have a variable
credit line available to provide periodic liquidity.
Some of our subsidiaries are direct borrowers under the syndicated loan. Other subsidiaries obtain their financing
from intra-Group loans provided by other Brenntag compa nies. Two companies in luxembourg, which are
borrowers under the loan agreement, exist specifically for this purpose. All major Group companies are liable for
the liabilities under the syndicated loan and have pledged substantial parts of their assets as security in favour of
the lenders.
Alongside the syndicated loan, an international accounts receivable securitization programme is an important
component of Group funding. Eleven Brenntag companies in five countries reg ularly sell trade receivables as part
of this programme. We have financial liabilities of some EUR 177.0 million pursuant to this accounts receivable
securitization programme. Thanks to the flexibility of the agreements, we can raise new funds from this pro-
gramme at short notice when required. Towards the end of 2009, an agreement was reached with the banks
involved to extend the maturity date by two years so the programme will continue until January 2012. Fur ther-
more, some of our companies make use of credit lines with local banks on a minor scale in consultation with the
Group Treas ury department.
In our opinion, the credit lines and liquid funds available are adequate to cover the future liquidity needs of our
Group, even if requirements should change unexpectedly.
In connection with the IPO, the shareholder loan granted by the parent company of Brenntag AG, Brachem Acqui-
sition S.C.A., luxembourg, totalling EUR 714.9 million was contributed to the additional paid-in capital with effect
from March 29, 2010, thus strengthening the company’s equity base.
Cash flow
in EUR m Q1 2010 Q1 2009
Cash flow used for/provided by operating activities – 72.3 156.6
Cash used for investing activities – 18.0 – 23.4
Purchases of financial investments and other financial assets – 3.5 – 12.4
Purchases of other investments – 15.0 – 12.0
Proceeds from divestments 0.5 1.0
Cash provided by financing activities 138.2 24.7
Change in cash and cash equivalents 47.9 157.9
20
BRenntag ag InterIm report Q1 2010
The cash of the Group used for operating activities totalled EUR 72.3 million in the reporting pe riod. The decrease
compared with the previous year is mainly a result of the build-up of work ing capital which had fallen significantly
in the previous year due to decreased business activities. In addition, interest payments on the Mezzanine Facilities
repaid in full as part of the IPO also reduced the operating cash flow by EUR 64.2 million.
Cash used for investing activities totalled EUR 18.0 million. The funds were used for the purchase of consolidated
subsidiaries and other business units (EUR 2.3 million), finan cial assets (EUR 1.2 million) as well as for in vestments
in intangible assets and property, plant and equipment (EUR 15.0 million).
The cash used for financ ing activities includes cash inflows from the IPO (EUR 525.0 million less charges of EUR 6.6 mil-
lion) and cash outflows for the repayment of financial liabilities (EUR 388.2 million, including EUR 382.9 million for
early repayments of loans as part of the IPO).
InvestmentsIn the first quarter of 2010, investment in property, plant and equipment and intangible assets (excluding additions
from company acquisitions) led to a total cash outflow of EUR 15.0 million (prior period: EUR 12.0 million).
We regularly invest in the maintenance and replacement of the infrastructure we require to perform our services
such as warehouses, offices, trucks and vehicles of our field service as well as IT hardware for various systems.
As a market leader and a responsible chemicals distributor, we attach great importance to ensuring that our prop-
erty, plant and equipment meet health, safety and environmental re quirements.
Major investment projects in the reporting period were:
Modernization of loire Bretagne, France (EUR 0.3 million): The acids and lyes facilities at the site near Nantes
are being modernized. The investment will ensure that the facility meets the latest environmental and safety
requirements.
Warehouse in Swansea, UK (EUR 0.3 million): The warehouse is part of the de velopment of a successful base in
the region and will promote growth of volumes and margins in strategically important markets.
Bentivoglio site, Italy (EUR 0.4 million): Merger of two sites for the acids and lyes busi ness into one. The invest-
ment is to strengthen existing business and permit growth through efficiency improvements.
Santiago site, Chile (EUR 0.1 million): The interior facilities of the warehouse built in 2009 are being upgraded
for the storage of dangerous goods. So far external warehouses have been rented for dangerous goods. By
upgrading the new facility, Brenntag Chile intends to reduce warehouse rental costs.
21
to our shareholders gRouP InteRIM ManageMent RePoRt InterIm ConsolIdated FInanCIal statements Further InFormatIon
Results of operations and financial condition

fInanCIal anD assets PosItIon
in EUR m Mar. 31, 2010 in % Dec. 31, 2009 in %
assets
Current assets 2,255.7 45.2 1,966.3 42.3
Cash and cash equivalents 664.0 13.3 602.6 12.9
Trade receivables 997.5 20.0 831.4 17.9
Other receivables and assets 127.0 2.5 110.0 2.4
Inventories 467.2 9.4 422.3 9.1
non-current assets 2,736.1 54.8 2,687.5 57.7
Fixed assets 2,640.4 52.9 2,588.6 55.6
Receivables and other assets 95.7 1.9 98.9 2.1
total assets 4,991.8 100.0 4,653.8 100.0
liabilities and equity
Current liabilities 1,469.5 29.4 1,084.7 23.3
Borrowings 1,469.5 29.4 1,084.7 23.3
Provisions 55.9 1.1 56.1 1.2
Trade payables 764.2 15.3 655.6 14.1
Financial liabilities 310.1 6.2 61.5 1.3
Miscellaneous liabilities 339.3 6.8 311.5 6.7
equity and non-current liabilities 3,522.3 70.6 3,569.1 76.7
Equity 1,456.6 29.2 172.3 3.7
Borrowings 2,065.7 41.4 3,396.8 73.0
Provisions 200.6 4.0 193.9 4.2
Financial liabilities 1,738.5 34.8 3,077.0 66.1
Miscellaneous liabilities 126.6 2.6 125.9 2.7
total liabilities and equity 4,991.8 100.0 4,653.8 100.0
As of March 31, 2010, total assets had increased by 7.3 % to EUR 4,991.8 million (prior period: EUR 4,653.8 million).
The trade receivables of the Brenntag Group increased in the reporting period by 20.0 % to € 997.5 million (prior
period: EUR 831.4 million). This rise is due to higher sales revenue and exchange rate effects. The increase was
partly offset by a systematic receivables management.
The other current receivables and assets increased by 15.5 % to EUR 127.0 million in the report ing period (prior
period: EUR 110.0 million).
The inventories of the Brenntag Group rose by 10.6 % to EUR 467.2 million in the 2010 reporting period (prior
period: EUR 422.3 million). This was mainly due to higher sales. However, thanks to improved warehouse logistics,
we also managed to increase our inven tory turnover rate.
22
BRenntag ag InterIm report Q1 2010
The fixed assets of the Brenntag Group rose by 2.0 % or EUR 51.8 million to EUR 2,640.4 million (prior period:
EUR 2,588.6 million). The change was mainly a result of investments in non-current assets (Capex) of EUR 10.3 mil-
lion, depreciation and amortization of EUR 51.2 million and positive exchange rate effects of € 87.6 million.
The other non-current receivables and assets decreased in the reporting period by 3.2 % to EUR 95.7 million
(prior period: EUR 98.9 million). This development is mainly due to the offsetting of the receivables from Brachem
Acquisition S.C.A., luxembourg, against the shareholder loan granted to Brenntag AG by its parent company.
In the reporting period, trade payables increased by 16.6 % to EUR 764.2 million (prior period: EUR 655.6 mil lion)
as a result of higher sales and exchange rate effects.
The current financial liabilities rose by 248.6 to EUR 310.1 million (prior period: € 61.5 million), above all due to early
repayments of the Senior Facility Agreements totalling EUR 227.3 million that were made in April and May in line
with the requirements of the syndicated loan. The borrowings to be repaid were therefore shown as current.
The non-current financial liabilities fell in the reporting period by 1,338.5 or 43.5 % to EUR 1,738.5 million (prior
pe riod: € 3,077.0 million). This decrease resulted from both the reclassification of liabilities totalling EUR 227.3 million
under the Senior Facility Agreements to current liabilities and the contribution of the shareholder loan granted by
Brachem Acquisition S.C.A., luxem bourg, (EUR 702.2 million as at December 31, 2009) including interest accrued
up to March 28, 2010 to the additional paid-in capital of Brenntag AG. Furthermore, the decrease was due to the
repayment in full of the Mezzanine Facility Agreement totalling EUR 438.6 million on March 31, 2010 including
the interest accrued up to that date.
There were no significant changes in current and non-current provisions which totalled EUR 256.5 million (prior period:
EUR 250.0 million). This figure includes pension provisions of EUR 55.4 million (prior period: EUR 54.4 million).
As of March 31, 2010, the equity of the Brenntag Group totalled EUR 1,456.6 million (prior pe riod: EUR 172.3 mil-
lion). The increase in equity is mainly due to the contribution of the share holder loan of EUR 714.9 million to the
additional paid-in capital by the parent company, Brachem Acquisition S.C.A., luxembourg, and the issuance of
10.5 million new shares.
23
to our shareholders gRouP InteRIM ManageMent RePoRt InterIm ConsolIdated FInanCIal statements Further InFormatIon
Results of operations and financial condition

EMPLOyEES
As of March 31, 2010, Brenntag had 10.904 employees worldwide. The number of em ploy ees is determined on the
basis of full-time equivalents, i.e. part-time jobs are weighted accord ing to the number of hours worked.
The following table shows the number of employees per segment:
full-time equivalents (fte) Mar. 31, 2010 in % Dec. 31, 2009 in %
Europe 6,053 55.5 6,050 55.6
North America 3,332 30.6 3,321 30.6
latin America 1,208 11.1 1,199 11.0
Asia / Pacific 182 1.7 182 1.7
All other segments 129 1.1 124 1.1
Brenntag group 10,904 100.0 10,876 100.0
SuBSEquEnT EvEnTS
Of the EUR 525.0 million received as part of the capital increase through the issue of new shares, EUR 69.0 million
was used on April 15, 2010 for early repayment of part of the Second lien Facility Agreement of the syndicated
loan.
Furthermore, in April and May further early capital repayments of the Senior Facility Agree ments totalling
EUR 227.3 million were made in line with the provisions of the syndicated loan.
riSk rEPOrT
Our business policy is geared to steadily improving the efficiency and earning power of our Group. The Brenntag
Group and its companies are confronted with a large number of risks which may arise from their busi ness activities.
At the same time, these business activities do not only lead to risks but also to many opportunities to safeguard
and enhance the company’s competitiveness.
24
BRenntag ag InterIm report Q1 2010

RIsK ManageMent systeM
The risk management system of the Brenntag Group is an integral part of the planning, con trol and reporting
processes of all operational and legal units as well as the central functions. To identify, monitor and limit risks at
an early stage, our risk management system consists of risk reporting (an early detection system), controlling and
an internal monitoring system as well as individual meas ures to limit known risks and identify any additional risks
at an early stage.
Risk reporting (early detection system)We continue to identify and analyze risks in the Group companies and are continually improv ing internal work-
flows throughout the Group and the computer systems used.
The risk survey performed every six months is an important instrument for global risk management. In addition,
all units have been instructed to report any significant risks sud denly occurring to the head office of the Group.
Each risk stock-take is performed both cen trally and decentrally and gathers both quantitative data and qualitative
information on exist ing and possible risks. The risks are recorded at the place where the risks exist or staff with
the relevant qualifications to handle the risks work. Any risks which are identified are as sessed with regard to
their probability of occurrence and the potential damage. If a risk can be reliably counteracted by effective action,
only the residual risk after any counter measures initiated is described (net risk). The individual risks reported are
then consolidated for the Group and presented to the decision-makers. Special attention is paid to risks which are
identi fied as critical due to the combination of probability of occurrence and amount of loss.
ControllingOur central and decentralized controlling departments immediately process the information gained from the
monthly and quarterly reports and can thus identify and communicate risks and opportuni ties. In addition, the
decentralized departments regularly give a qualitative assessment of the company’s situation and the market in
quarterly reports. The Group report ing and monitoring system thus ensures that the decision-makers are provided
with the latest and above all cor rect information.
Internal monitoring systemAnother important part of risk management in the Brenntag Group is the internal monitoring system which consists
of the internal control system and the internal audit department.
The internal control system comprises all central and decentralized policies and regulations which the Management
Board and the regional and local managements lay down with the aim of ensuring
the effectiveness and efficiency of the workflows and processes,
the correctness and reliability of internal and external financial reporting as well as
the Group-wide observance of applicable laws and regulations.
25
to our shareholders gRouP InteRIM ManageMent RePoRt InterIm ConsolIdated FInanCIal statements Further InFormatIon
EmployeesSubsequent eventsRisk report

The internal control system with regard to the Group accounting process is ensured by an IFRS accounting manual
applicable throughout the Group and by the use of a uniform, stan dar dized reporting and consolidation software
containing comprehensive testing and valida tion routines. The auditors check in quarterly reviews of selected
companies that the regula tions laid down in the accounting ma nual have been observed. The security and proper
func tioning of the software used is confirmed by the auditors in the annual audits.
Both the efficiency of the workflows and processes and the effectiveness of the internal con trol systems set up in
the decentralized units as well as the reliability of the systems used are regularly examined by the internal audit
department. The results of these audits are reported immediately. Thus, we ensure that the Management is kept
continuously informed of any weaknesses and any resulting risks.
oPPoRtunItIes anD RIsKs
Projects are regularly initiated in all areas to maintain and strengthen the Group’s earning power. In addition to
cost optimization, these projects focus on exploiting sales opportunities.
To limit or entirely eliminate possible financial consequences of any risks which may occur, we have taken out
insurances to cover damage and liability risks.
In the following we have listed risks and opportunities which could influence the operational performance and
financial and earnings situation of the Brenntag Group. Furthermore, risks not identified so far which may have a
negative impact on our company may arise from unfore seen economic and political developments.
Market risks and opportunities: Economic downturns, including the current global finan cial and economic
crisis, may have a negative impact on our sales and operating gross profit in our main sales markets. The high
geographic di versification of our busi ness considerably re duces these risks. Further more, since our customers
come from many different branches and indus tries, the risks are spread.
The handling of and trading in chemicals are governed by a large number of regula tions and laws. Changes to
this regulatory framework (e.g. restrictions or new require ments) may lead to lower sales or involve higher
costs to satisfy these regulations. How ever, we also see ourselves in a better position here than smaller com-
petitors thanks to our size and the cen tral systems we have in place.
As far as the sales markets are concerned, we see great opportunities for the Brenn tag Group in the conclusion
of sales partnership agreements for new products or prod uct categories. The high density of our distribution
network and the professional or ganization at all levels of the Brenntag Group should be interesting for potential
part ners.
26
BRenntag ag InterIm report Q1 2010

financial risks and opportunities: Our business is exposed to exchange rate, interest rate, credit and price risks.
Due to the fact that we operate in countries with different currencies, changes in ex change rates may have
positive or negative effects on the results of the Group. In par ticular, any change in the euro / US dollar exchange
rate has a considerable impact as a major part of our busi ness is conducted in the US dollar area. We system-
atically monitor ex change rate risks on the basis of a Group-wide financial policy which lays down the ba sic
strategy, threshold values and hedging instruments to be used.
We limit credit risks for our cash investments by only doing business with banks and busi ness partners with
credit ratings we consider to be good. Payments are also han dled through such banks. Risks of uncollectible
receivables are reduced by conti nu ally monitoring the customers’ credit rating and payment behaviour and
setting appro pri ate credit limits. In addition, risks are limited by taking out credit insurances.
Brenntag’s financing structure is based on high external borrowings. However, the loan agreements we have
concluded cover these requirements in the long term. like comparable loan agreements, our syndicated loan
contains a number of customary covenants.
In our opinion, these covenants have been drawn up in such a manner that there would have to be a very
unusual development of business for Brenntag not to be able to meet them. The observance of the covenants
is regularly checked. Furthermore, sce nario calculations are made in order to be able to take suitable action at
an early stage if necessary. In the event of the Brenntag Group’s sustained breach of these covenants, the facility
agent appointed by the lenders may foreclose the loans, if he feels this move necessary to safeguard the lenders’
interests.
We hedge some of the risks by using derivative instruments, such as foreign ex change for wards, interest rate
and currency swaps or combined instruments. Finan cial risks are mainly hedged by the Treasury department at
the head offi ce of the Group. If individual companies hedge operational risks themselves, this is done in con-
sulta tion with and under the supervision of Group headquarters. This per mits a bal anc ing of risks throughout
the Group.
environmental and safety risks: Handling chemicals gives rise to risks which we coun ter by maintain ing a high
standard of safety precautions at our warehouses and filling stations and, where nec essary, improving them.
Environmental and safety risks are mo nitored on the basis of a uniform environmental and safety strategy as
well as through Group-wide standards set in regional manuals (health, safety and environ men tal protection).
Furthermore, we regularly inform our employees and cus tomers about how to handle chemicals safely and
about emergency procedures in the event of accidents.
27
to our shareholders gRouP InteRIM ManageMent RePoRt InterIm ConsolIdated FInanCIal statements Further InFormatIon
Risk report

fOrECaST rEPOrT
Most forecasts about the further development of the global economy are currently painting a cautiously optimistic
picture. The majority of national economies have now returned to a path of growth, albeit at a low level. Therefore,
GDP and industrial production are expected to show positive but subdued growth, driven in particular by the
government spending programmes introduced in 2009 and the expansive monetary policy of the central banks.
There are, however, a number of risks. For example, the development on the labour markets and therefore also
private consumer demand are uncertain. The state of public-sector budgets in some countries in Europe could
also have a negative impact on economic development. Therefore, it remains to be seen whether growth proves
to be sustainable.
We are expecting moderate growth of results. The improved overall economic environment should continue to
have a positive effect on sales revenue and thus also on operating gross profit. Furthermore, we are expecting a
moderate development of operating costs. We expect that the cost-efficiency measures initiated in 2009 are now
taking full effect. Overall, we are expecting moderate growth of EBITDA in 2010.
The IPO has strengthened the equity base and reduced net debt. This will have a positive effect on the financial
result and thus on the profit before tax.
Given the likely increase in the volume of business, we are also expecting a moderate rise in working capital and
investments in property, plant and equipment. In addition, we believe that the trend towards falling prices seen
in 2009 will only reverse to a certain extent. However, the effective management of our customer and supplier
relationships and our efforts to optimize warehouse logistics will curb the increase in working capital. Moreover,
we are expect ing investments in property, plant and equipment to be slightly lower than the level of deprecia tion.
In our opinion, the consolidation process in the market will continue. large distributors such as Brenntag with a
global market presence and a comprehensive product portfolio should benefit from this trend. We will further
strive to proactively take over distribution activities from suppliers and expand our market presence through
acquisitions.
Therefore, we will also continue to develop our product portfolio to suit the demands of the regional markets and
focus on access to new products and markets as well as growth seg ments. This includes the attractive customer
industries of water treatment, personal care, food and pharmaceuticals as well as the fields of adhesives, coatings,
paints and elastomers.
We are also aiming to expand business with global and pan-regional key accounts, which benefit particularly from
our broad geographical presence and our comprehensive product portfolio. Improving cost efficiency is also a
point of constant focus. Here we are currently concentrating particularly on our warehouse and transportation
logis tics.
28
BRenntag ag InterIm report Q1 2010

interim consolidated Financial statementsfrom January 1 to March 31, 2010
30 Consolidated Income statement (IFrs)
31 Consolidated statement of Comprehensive Income (IFrs)
32 Consolidated Balance sheet (IFrs)
34 Consolidated statement of Changes in equity (IFrs)
36 Consolidated Cash flow statement (IFrs)
37 Condensed notes (IFrs)
37 Key financial figures by segment
38 Group key financial figures
39 Preliminary remarks
39 Consolidation policies and methods
39 Standards applied
40 Scope of consolidation
40 Business combinations in accordance with IFRS 3
40 Currency translation
41 Information on the consolidated income statement,
balance sheet and cash flow statement
41 Other operating income
41 Other operating expenses
41 Finance income
41 Finance costs
42 Earnings per share
42 Financial liabilities
43 Other provisions
43 Equity
45 Information on the cash flow statement
45 Subsequent events
29
to our shareholders gRouP InteRIM ManageMent RePoRt InteRIM ConsolIDateD fInanCIal stateMents Further InFormatIon
Forecast report
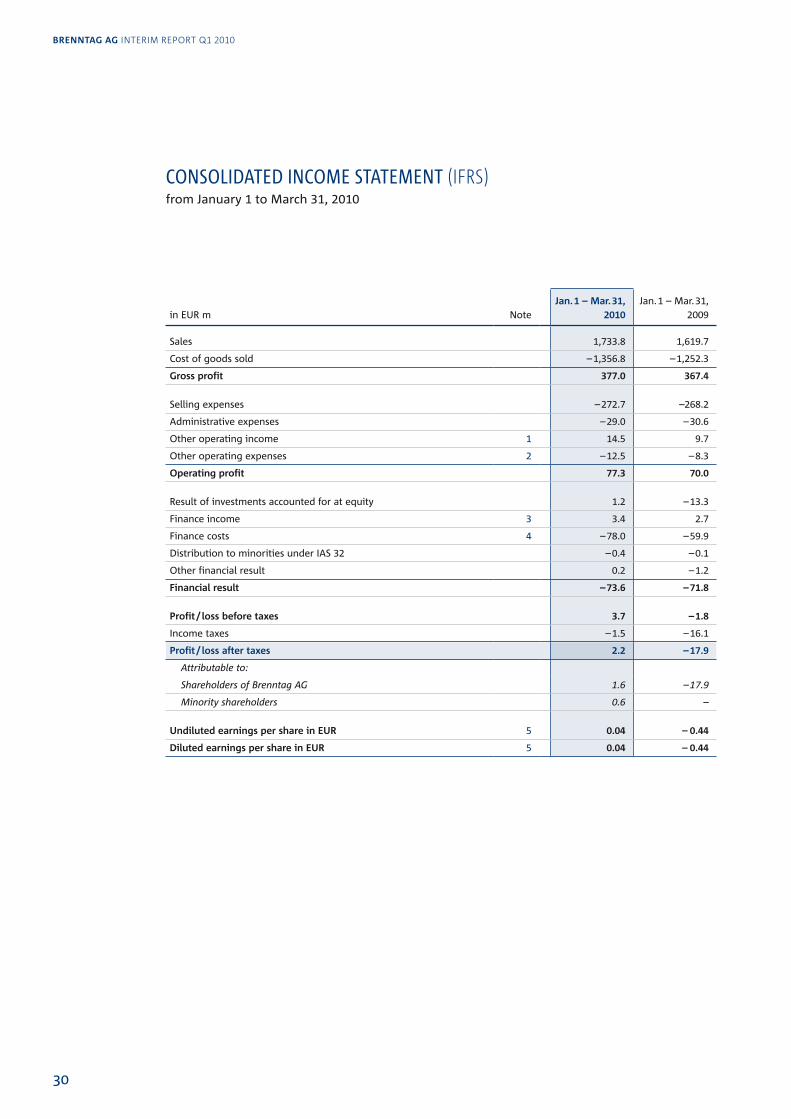
in EUR m NoteJan. 1 – Mar. 31,
2010Jan. 1 – Mar. 31,
2009
Sales 1,733.8 1,619.7
Cost of goods sold – 1,356.8 – 1,252.3
gross profit 377.0 367.4
Selling expenses – 272.7 –268.2
Administrative expenses – 29.0 – 30.6
Other operating income 1 14.5 9.7
Other operating expenses 2 – 12.5 – 8.3
operating profit 77.3 70.0
Result of investments accounted for at equity 1.2 – 13.3
Finance income 3 3.4 2.7
Finance costs 4 – 78.0 – 59.9
Distribution to minorities under IAS 32 – 0.4 – 0.1
Other financial result 0.2 – 1.2
financial result – 73.6 – 71.8
Profit / loss before taxes 3.7 – 1.8
Income taxes – 1.5 – 16.1
Profit / loss after taxes 2.2 – 17.9
Attributable to:
Shareholders of Brenntag AG 1.6 – 17.9
Minority shareholders 0.6 –
undiluted earnings per share in euR 5 0.04 – 0.44
Diluted earnings per share in euR 5 0.04 – 0.44
COnSOLidaTEd inCOME STaTEMEnT (IFRS)from January 1 to March 31, 2010
30
BRenntag ag InterIm report Q1 2010

Consolidated Income StatementConsolidated Statement of Comprehensive Income
COnSOLidaTEd STaTEMEnT Of COMPrEhEnSivE inCOME (IFRS)from January 1 to March 31, 2010
in EUR m Jan. 1 – Mar. 31,
2010Jan. 1 – Mar. 31,
2009
Profit / loss after tax 2.2 – 17.9
Change in exchange rate differences 51.9 8.6
Change in cash flow hedge reserve 4.4 – 7.2
Deferred tax on components of other comprehensive income – 1.4 1.8
other comprehensive income 54.9 3.2
total comprehensive income 57.1 – 14.7
Attributable to:
Shareholders of Brenntag AG 55.5 – 12.9
Minority shareholders 1.6 – 1.8
to our shareholders Group InterIm manaGement report InteRIM ConsolIDateD fInanCIal stateMents Further InFormatIon
31
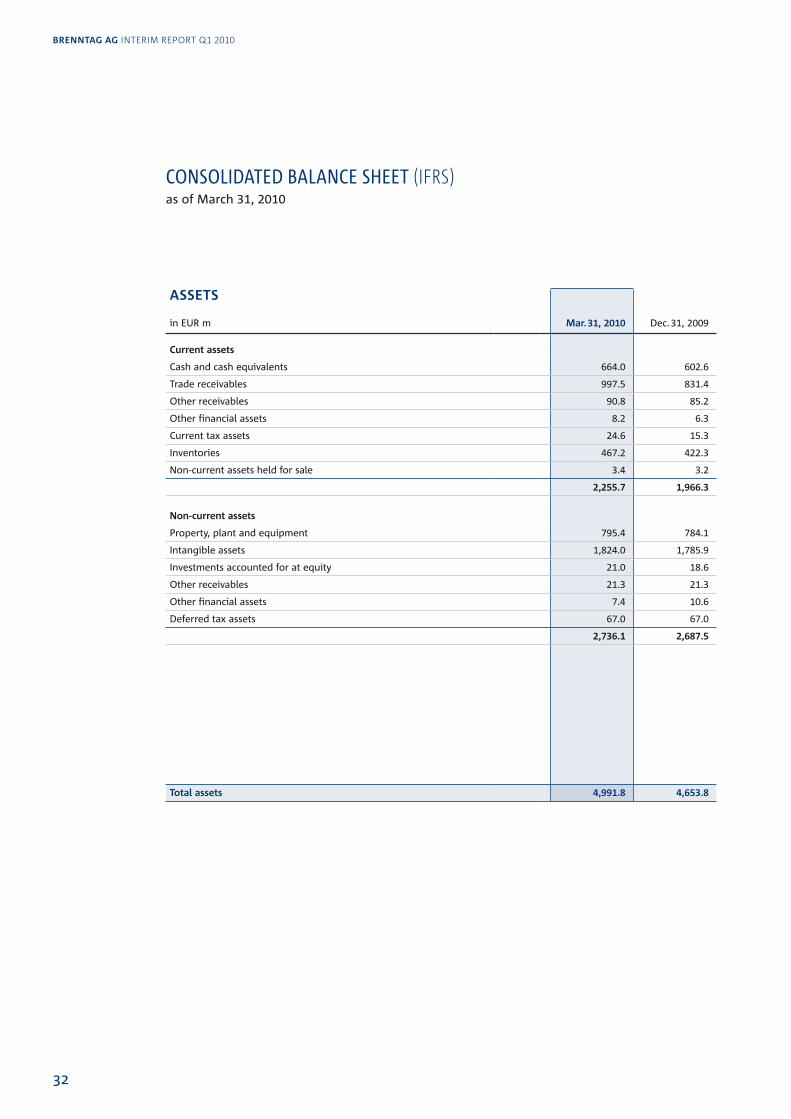
COnSOLidaTEd BaLanCE ShEET (IFRS)as of March 31, 2010
assets in EUR m Mar. 31, 2010 Dec. 31, 2009
Current assets
Cash and cash equivalents 664.0 602.6
Trade receivables 997.5 831.4
Other receivables 90.8 85.2
Other financial assets 8.2 6.3
Current tax assets 24.6 15.3
Inventories 467.2 422.3
Non-current assets held for sale 3.4 3.2
2,255.7 1,966.3
non-current assets
Property, plant and equipment 795.4 784.1
Intangible assets 1,824.0 1,785.9
Investments accounted for at equity 21.0 18.6
Other receivables 21.3 21.3
Other financial assets 7.4 10.6
Deferred tax assets 67.0 67.0
2,736.1 2,687.5
total assets 4,991.8 4,653.8
32
BRenntag ag InterIm report Q1 2010

Consolidated Balance Sheet
lIaBIlItIes anD eQuIty in EUR m Note Mar. 31, 2010 Dec. 31, 2009
Current liabilities
Trade payables 764.2 655.6
Financial liabilities 6 310.1 61.5
Other liabilities 338.3 309.0
Other provisions 7 55.9 56.1
Current tax liabilities 1.0 2.5
1,469.5 1,084.7
non-current liabilities
Financial liabilities 6 1,738.5 3,077.0
Other liabilities 1.9 1.7
Other provisions 7 145.2 139.5
Provisions for pensions and similar obligations 55.4 54.4
liabilities to minorities under IAS 32 2.5 2.1
Deferred tax liabilities 122.2 122.1
2,065.7 3,396.8
equity 8
Subscribed capital 1) 51.5 –
Additional paid-in capital 1,557.4 381.6
Retained earnings – 141.9 – 143.5
Other comprehensive income – 20.1 – 74.0
equity attributable to Brenntag shareholders 1,446.9 164.1
Equity attributable to minority shareholders 9.7 8.2
1,456.6 172.3
total liabilities and equity 4,991.8 4,653.8
1) Prior period EUR 25.0 k.
to our shareholders Group InterIm manaGement report InteRIM ConsolIDateD fInanCIal stateMents Further InFormatIon
33
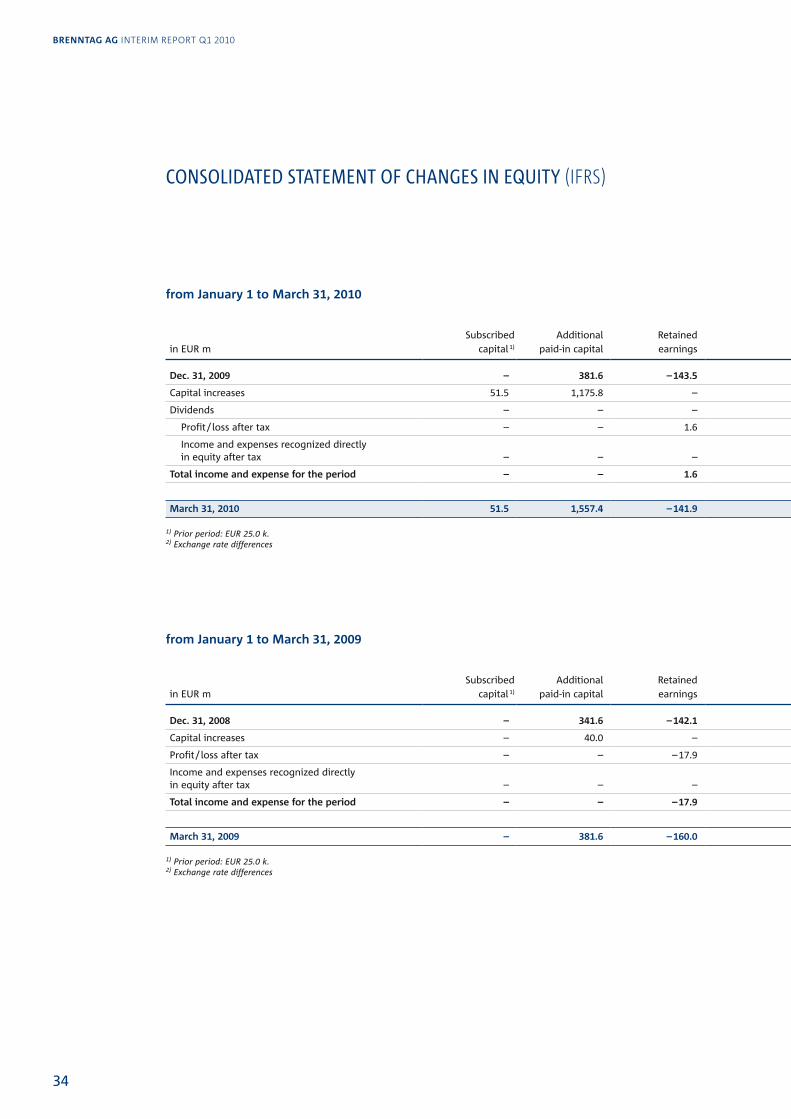
from January 1 to March 31, 2010
in EUR m
Subscribedcapital 1)
Additionalpaid-in capital
Retained earnings
Exchange rate differences
Cash flow hedge reserve Deferred tax
Equity attributable to Brenntag
shareholdersMinority interests equity
Dec. 31, 2009 – 381.6 – 143.5 – 56.5 – 26.7 9.2 164.1 8.2 172.3
Capital increases 51.5 1,175.8 – – – – 1,227.3 – 1,227.3
Dividends – – – – – – – – 0.1 – 0.1
Profit / loss after tax – – 1.6 – – – 1.6 0.6 2.2
Income and expenses recognized directly in equity after tax – – – 50.9 4.4 – 1.4 53.9 1.0 2) 54.9
total income and expense for the period – – 1.6 50.9 4.4 – 1.4 55.5 1.6 57.1
March 31, 2010 51.5 1,557.4 – 141.9 – 5.6 – 22.3 7.8 1,446.9 9.7 1,456.6
1) Prior period: EUR 25.0 k.2) Exchange rate differences
from January 1 to March 31, 2009
in EUR m
Subscribedcapital 1)
Additionalpaid-in capital
Retained earnings
Exchange rate differences
Cash flow hedge reserve Deferred tax
Equity attributable to Brenntag
shareholdersMinority interests equity
Dec. 31, 2008 – 341.6 – 142.1 – 63.7 – 25.3 8.4 118.9 9.4 128.3
Capital increases – 40.0 – – – – 40.0 – 40.0
Profit / loss after tax – – – 17.9 – – – – 17.9 – – 17.9
Income and expenses recognized directly in equity after tax – – – 10.4 – 7.2 1.8 5.0 – 1.8 2) 3.2
total income and expense for the period – – – 17.9 10.4 – 7.2 1.8 – 12.9 – 1.8 – 14.7
March 31, 2009 – 381.6 – 160.0 – 53.3 – 32.5 10.2 146.0 7.6 153.6
1) Prior period: EUR 25.0 k.2) Exchange rate differences
COnSOLidaTEd STaTEMEnT Of ChangES in EquiTy (IFRS)
34
BRenntag ag InterIm report Q1 2010

from January 1 to March 31, 2010
in EUR m
Subscribedcapital 1)
Additionalpaid-in capital
Retained earnings
Exchange rate differences
Cash flow hedge reserve Deferred tax
Equity attributable to Brenntag
shareholdersMinority interests equity
Dec. 31, 2009 – 381.6 – 143.5 – 56.5 – 26.7 9.2 164.1 8.2 172.3
Capital increases 51.5 1,175.8 – – – – 1,227.3 – 1,227.3
Dividends – – – – – – – – 0.1 – 0.1
Profit / loss after tax – – 1.6 – – – 1.6 0.6 2.2
Income and expenses recognized directly in equity after tax – – – 50.9 4.4 – 1.4 53.9 1.0 2) 54.9
total income and expense for the period – – 1.6 50.9 4.4 – 1.4 55.5 1.6 57.1
March 31, 2010 51.5 1,557.4 – 141.9 – 5.6 – 22.3 7.8 1,446.9 9.7 1,456.6
1) Prior period: EUR 25.0 k.2) Exchange rate differences
from January 1 to March 31, 2009
in EUR m
Subscribedcapital 1)
Additionalpaid-in capital
Retained earnings
Exchange rate differences
Cash flow hedge reserve Deferred tax
Equity attributable to Brenntag
shareholdersMinority interests equity
Dec. 31, 2008 – 341.6 – 142.1 – 63.7 – 25.3 8.4 118.9 9.4 128.3
Capital increases – 40.0 – – – – 40.0 – 40.0
Profit / loss after tax – – – 17.9 – – – – 17.9 – – 17.9
Income and expenses recognized directly in equity after tax – – – 10.4 – 7.2 1.8 5.0 – 1.8 2) 3.2
total income and expense for the period – – – 17.9 10.4 – 7.2 1.8 – 12.9 – 1.8 – 14.7
March 31, 2009 – 381.6 – 160.0 – 53.3 – 32.5 10.2 146.0 7.6 153.6
1) Prior period: EUR 25.0 k.2) Exchange rate differences
to our shareholders Group InterIm manaGement report InteRIM ConsolIDateD fInanCIal stateMents Further InFormatIon
35
Consolidated Statement of Changes in Equity
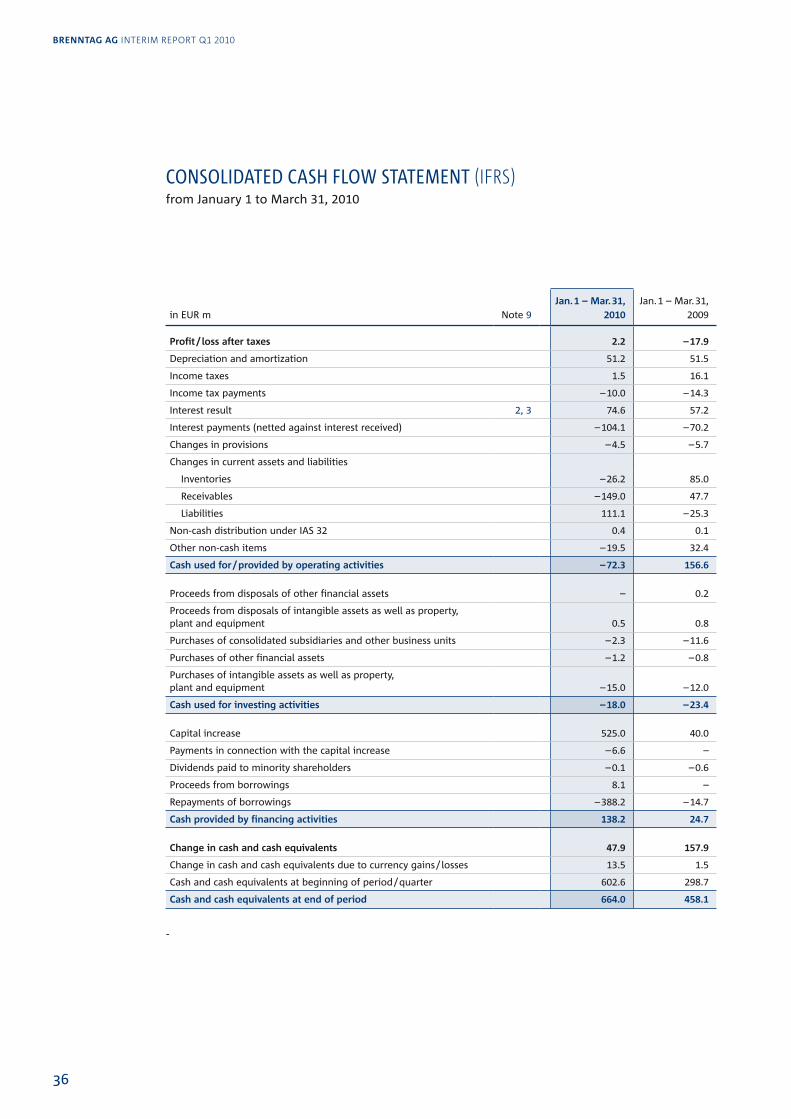
COnSOLidaTEd CaSh fLOW STaTEMEnT (IFRS)from January 1 to March 31, 2010
in EUR m Note 9Jan. 1 – Mar. 31,
2010Jan. 1 – Mar. 31,
2009
Profit / loss after taxes 2.2 – 17.9
Depreciation and amortization 51.2 51.5
Income taxes 1.5 16.1
Income tax payments – 10.0 – 14.3
Interest result 2, 3 74.6 57.2
Interest payments (netted against interest received) – 104.1 – 70.2
Changes in provisions – 4.5 – 5.7
Changes in current assets and liabilities
Inventories – 26.2 85.0
Receivables – 149.0 47.7
liabilities 111.1 – 25.3
Non-cash distribution under IAS 32 0.4 0.1
Other non-cash items – 19.5 32.4
Cash used for / provided by operating activities – 72.3 156.6
Proceeds from disposals of other financial assets – 0.2
Proceeds from disposals of intangible assets as well as property, plant and equipment 0.5 0.8
Purchases of consolidated subsidiaries and other business units – 2.3 – 11.6
Purchases of other financial assets – 1.2 – 0.8
Purchases of intangible assets as well as property, plant and equipment – 15.0 – 12.0
Cash used for investing activities – 18.0 – 23.4
Capital increase 525.0 40.0
Payments in connection with the capital increase – 6.6 –
Dividends paid to minority shareholders – 0.1 – 0.6
Proceeds from borrowings 8.1 –
Repayments of borrowings – 388.2 – 14.7
Cash provided by financing activities 138.2 24.7
Change in cash and cash equivalents 47.9 157.9
Change in cash and cash equivalents due to currency gains / losses 13.5 1.5
Cash and cash equivalents at beginning of period / quarter 602.6 298.7
Cash and cash equivalents at end of period 664.0 458.1
-
36
BRenntag ag InterIm report Q1 2010
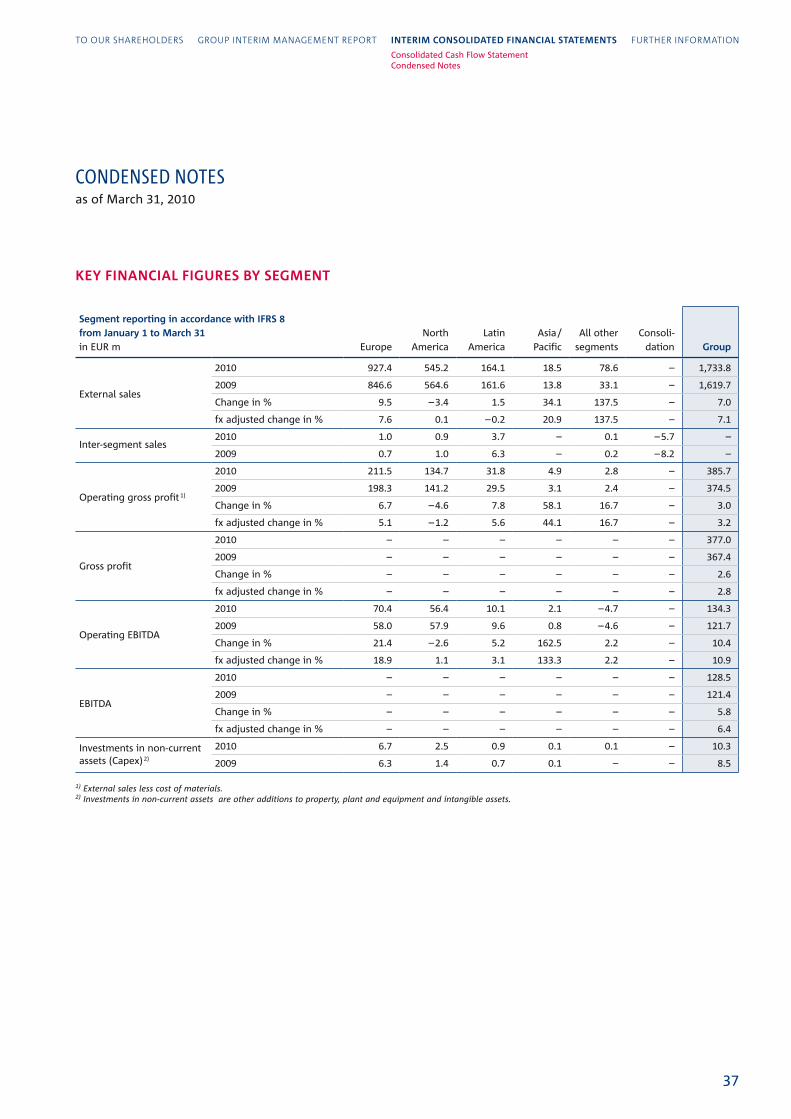
COndEnSEd nOTESas of March 31, 2010
Key fInanCIal fIguRes By segMent
segment reporting in accordance with IfRs 8 from January 1 to March 31in EUR m Europe
North America
latinAmerica
Asia / Pacific
All other segments
Consoli-dation group
External sales
2010 927.4 545.2 164.1 18.5 78.6 – 1,733.8
2009 846.6 564.6 161.6 13.8 33.1 – 1,619.7
Change in % 9.5 – 3.4 1.5 34.1 137.5 – 7.0
fx adjusted change in % 7.6 0.1 – 0.2 20.9 137.5 – 7.1
Inter-segment sales2010 1.0 0.9 3.7 – 0.1 – 5.7 –
2009 0.7 1.0 6.3 – 0.2 – 8.2 –
Operating gross profit 1)
2010 211.5 134.7 31.8 4.9 2.8 – 385.7
2009 198.3 141.2 29.5 3.1 2.4 – 374.5
Change in % 6.7 – 4.6 7.8 58.1 16.7 – 3.0
fx adjusted change in % 5.1 – 1.2 5.6 44.1 16.7 – 3.2
Gross profit
2010 – – – – – – 377.0
2009 – – – – – – 367.4
Change in % – – – – – – 2.6
fx adjusted change in % – – – – – – 2.8
Operating EBITDA
2010 70.4 56.4 10.1 2.1 – 4.7 – 134.3
2009 58.0 57.9 9.6 0.8 – 4.6 – 121.7
Change in % 21.4 – 2.6 5.2 162.5 2.2 – 10.4
fx adjusted change in % 18.9 1.1 3.1 133.3 2.2 – 10.9
EBITDA
2010 – – – – – – 128.5
2009 – – – – – – 121.4
Change in % – – – – – – 5.8
fx adjusted change in % – – – – – – 6.4
Investments in non-current assets (Capex) 2)
2010 6.7 2.5 0.9 0.1 0.1 – 10.3
2009 6.3 1.4 0.7 0.1 – – 8.5
1) External sales less cost of materials. 2) Investments in non-current assets are other additions to property, plant and equipment and intangible assets.
to our shareholders Group InterIm manaGement report InteRIM ConsolIDateD fInanCIal stateMents Further InFormatIon
37
Consolidated Cash Flow StatementCondensed Notes
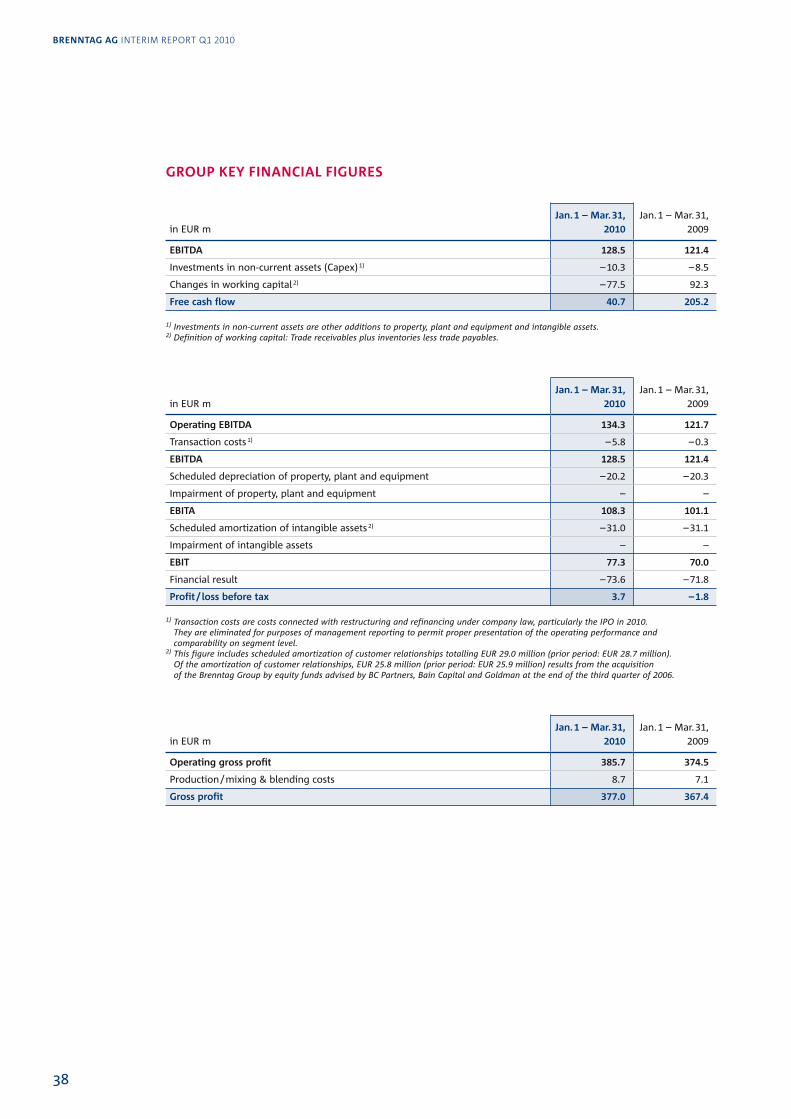
gRouP Key fInanCIal fIguRes
in EUR m
Jan. 1 – Mar. 31,2010
Jan. 1 – Mar. 31,2009
eBItDa 128.5 121.4
Investments in non-current assets (Capex) 1) – 10.3 – 8.5
Changes in working capital 2) – 77.5 92.3
free cash flow 40.7 205.2
1) Investments in non-current assets are other additions to property, plant and equipment and intangible assets. 2) Definition of working capital: Trade receivables plus inventories less trade payables.
in EUR m
Jan. 1 – Mar. 31,2010
Jan. 1 – Mar. 31,2009
operating eBItDa 134.3 121.7
Transaction costs 1) – 5.8 – 0.3
eBItDa 128.5 121.4
Scheduled depreciation of property, plant and equipment – 20.2 – 20.3
Impairment of property, plant and equipment – –
eBIta 108.3 101.1
Scheduled amortization of intangible assets 2) – 31.0 – 31.1
Impairment of intangible assets – –
eBIt 77.3 70.0
Financial result – 73.6 – 71.8
Profit / loss before tax 3.7 – 1.8
1) Transaction costs are costs connected with restructuring and refinancing under company law, particularly the IPO in 2010. They are eliminated for purposes of management reporting to permit proper presentation of the operating performance and comparability on segment level.
2) This figure includes scheduled amortization of customer relationships totalling EUR 29.0 million (prior period: EUR 28.7 million). Of the amortization of customer relationships, EUR 25.8 million (prior period: EUR 25.9 million) results from the acquisition of the Brenntag Group by equity funds advised by BC Partners, Bain Capital and Goldman at the end of the third quarter of 2006.
in EUR m
Jan. 1 – Mar. 31,2010
Jan. 1 – Mar. 31,2009
operating gross profit 385.7 374.5
Production / mixing & blending costs 8.7 7.1
gross profit 377.0 367.4
38
BRenntag ag InterIm report Q1 2010
PRelIMInaRy ReMaRKs
At the shareholders’ meeting of Brenntag Management GmbH on March 3, 2010, the share holders passed a reso-
lution to convert Brenntag Management GmbH into a stock corporation (Aktiengesellschaft) with the name
Brenntag AG. The conversion was entered in the commercial register of the local court of Duisburg (HRB 22178)
on March 11, 2010. On March 29, 2010 the capital of the company was increased by the issuance of 10.5 million
new shares in connection with the first listing of Brenntag AG on the regulated market of the Frankfurt stock
exchange (Prime Standard section).
ConsolIDatIon PolICIes anD MethoDs
standards appliedThese interim consolidated financial statements for the period from January 1 to March 31, 2010 have been
prepared in accordance with the requirements of IAS 34 (Interim Financial Reporting). The Notes are presented in
condensed form compared to the Notes to the con solidated financial statements at December 31, 2009.
With the exception of the Standards and Interpretations to be applied for the first time in the financial year starting
January 1, 2010, the same consolidation policies and methods have been applied as for the consolidated financial
statements at December 31, 2009. The provi sions for the virtual stock programme set up for the first time in the
2010 financial year for the members of the Management Board have been measured in accordance with IFRS 2
(Share-based Payment) on the basis of the fair value and taking the remaining term of the programme into
account. They are shown under other provisions for personnel ex penses.
Income taxes are recorded on the basis of the latest estimate of the corporate income tax rate expected for the
2010 financial year.
The first-time application of the revised IFRS 3 (Business Combinations) leads to material changes in the accounting
of business combinations. The new IFRS 3 does not allow the capitalization of costs directly attributable to the
business combination and introduces clearer requirements for the separation of a business combination from
other transactions. Further more, any subsequent changes in estimates of a contingent purchase price payable are
generally not to be recognized by ad justing goodwill but directly recognized as expense or income. In the case of
successive share acquisitions which lead to the control of an entity or in the case of the sale of shares with the loss
of con trol, the Standard requires the remeas urement of the shares already held in the first case and the remaining
shares in the second case at their fair value to affect net income.
The revised IAS 27 (Consolidated and Separate Financial Statements) stipulates that share acquisitions and sales
which have no influence on existing control are to be recognized di rectly in equity (economic entity approach).
The other Standards and Interpretations applied for the first time do not have any material effect on the presenta-
tion of the net assets, financial position and results of opera tions of the Brenntag Group.
Condensed Notes
to our shareholders Group InterIm manaGement report InteRIM ConsolIDateD fInanCIal stateMents Further InFormatIon
39
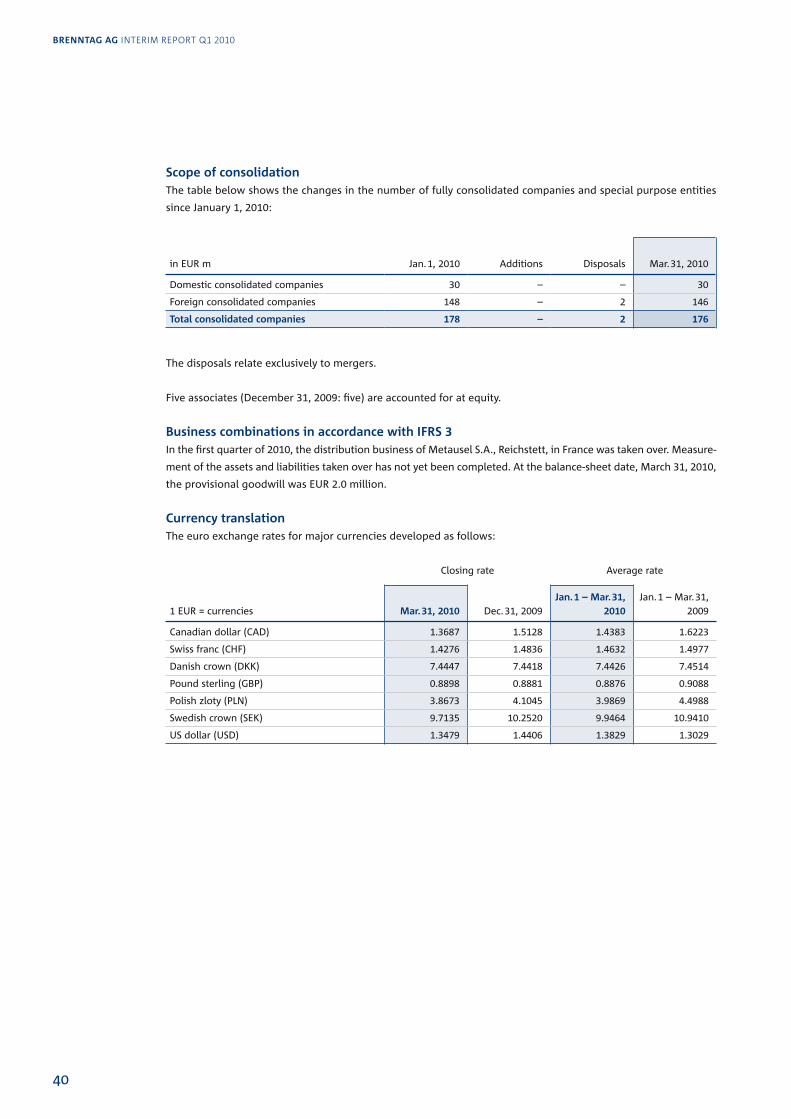
scope of consolidationThe table below shows the changes in the number of fully consolidated companies and spe cial purpose entities
since January 1, 2010:
in EUR m Jan. 1, 2010 Additions Disposals Mar. 31, 2010
Domestic consolidated companies 30 – – 30
Foreign consolidated companies 148 – 2 146
total consolidated companies 178 – 2 176
The disposals relate exclusively to mergers.
Five associates (December 31, 2009: five) are ac counted for at equity.
Business combinations in accordance with IfRs 3In the first quarter of 2010, the distribution business of Metausel S.A., Reichstett, in France was taken over. Measure-
ment of the assets and liabilities taken over has not yet been completed. At the balance-sheet date, March 31, 2010,
the pro visional goodwill was EUR 2.0 million.
Currency translationThe euro exchange rates for major currencies developed as follows:
Closing rate Average rate
1 EUR = currencies Mar. 31, 2010 Dec. 31, 2009Jan. 1 – Mar. 31,
2010Jan. 1 – Mar. 31,
2009
Canadian dollar (CAD) 1.3687 1.5128 1.4383 1.6223
Swiss franc (CHF) 1.4276 1.4836 1.4632 1.4977
Danish crown (DKK) 7.4447 7.4418 7.4426 7.4514
Pound sterling (GBP) 0.8898 0.8881 0.8876 0.9088
Polish zloty (PlN) 3.8673 4.1045 3.9869 4.4988
Swedish crown (SEK) 9.7135 10.2520 9.9464 10.9410
US dollar (USD) 1.3479 1.4406 1.3829 1.3029
40
BRenntag ag InterIm report Q1 2010
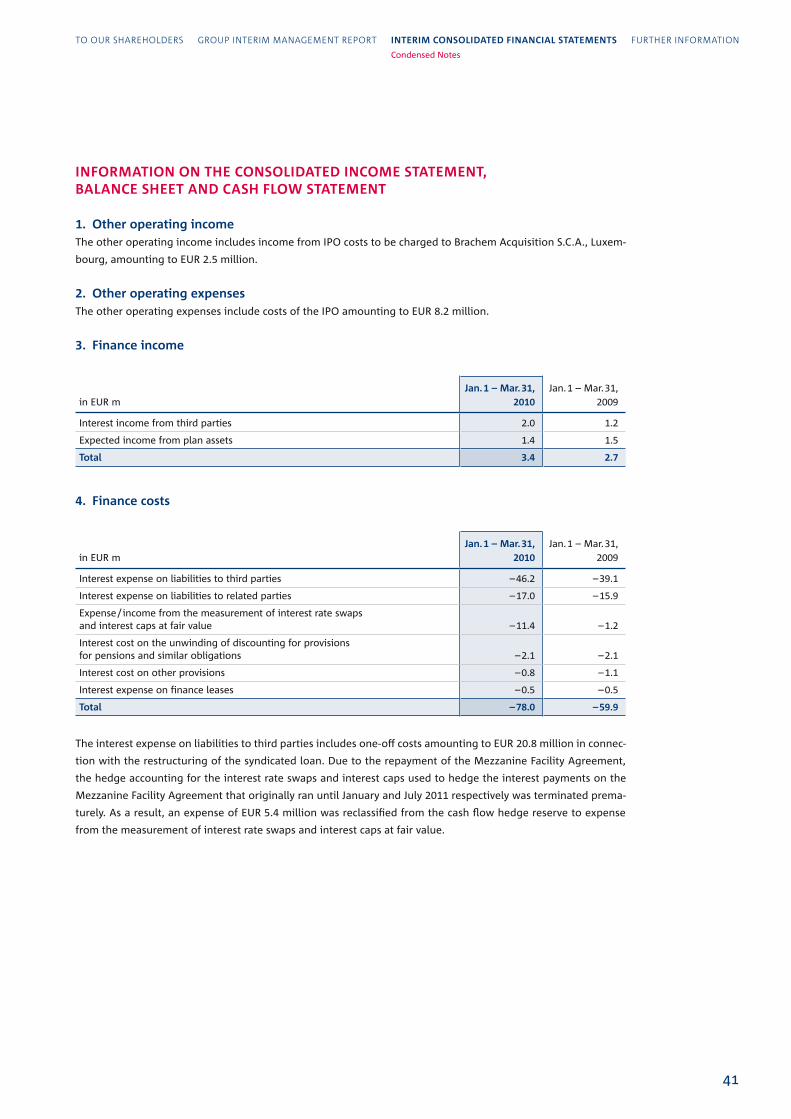
InfoRMatIon on the ConsolIDateD InCoMe stateMent, BalanCe sheet anD Cash flow stateMent
1. other operating incomeThe other operating income includes income from IPO costs to be charged to Brachem Acquisition S.C.A., luxem-
bourg, amounting to EUR 2.5 million.
2. other operating expensesThe other operating expenses include costs of the IPO amounting to EUR 8.2 million.
3. finance income
in EUR m
Jan. 1 – Mar. 31,2010
Jan. 1 – Mar. 31,2009
Interest income from third parties 2.0 1.2
Expected income from plan assets 1.4 1.5
total 3.4 2.7
4. finance costs
in EUR m
Jan. 1 – Mar. 31,2010
Jan. 1 – Mar. 31,2009
Interest expense on liabilities to third parties – 46.2 – 39.1
Interest expense on liabilities to related parties – 17.0 – 15.9
Expense / income from the measurement of interest rate swaps and interest caps at fair value – 11.4 – 1.2
Interest cost on the unwinding of discounting for provisions for pensions and similar obligations – 2.1 – 2.1
Interest cost on other provisions – 0.8 – 1.1
Interest expense on finance leases – 0.5 – 0.5
total – 78.0 – 59.9
The interest expense on liabilities to third parties includes one-off costs amounting to EUR 20.8 million in connec-
tion with the restructuring of the syndicated loan. Due to the repayment of the Mezzanine Facility Agreement,
the hedge accounting for the interest rate swaps and interest caps used to hedge the interest payments on the
Mezzanine Facility Agreement that origi nally ran until January and July 2011 respectively was terminated prema-
turely. As a result, an expense of EUR 5.4 million was reclassified from the cash flow hedge reserve to expense
from the measurement of interest rate swaps and interest caps at fair value.
Condensed Notes
to our shareholders Group InterIm manaGement report InteRIM ConsolIDateD fInanCIal stateMents Further InFormatIon
41
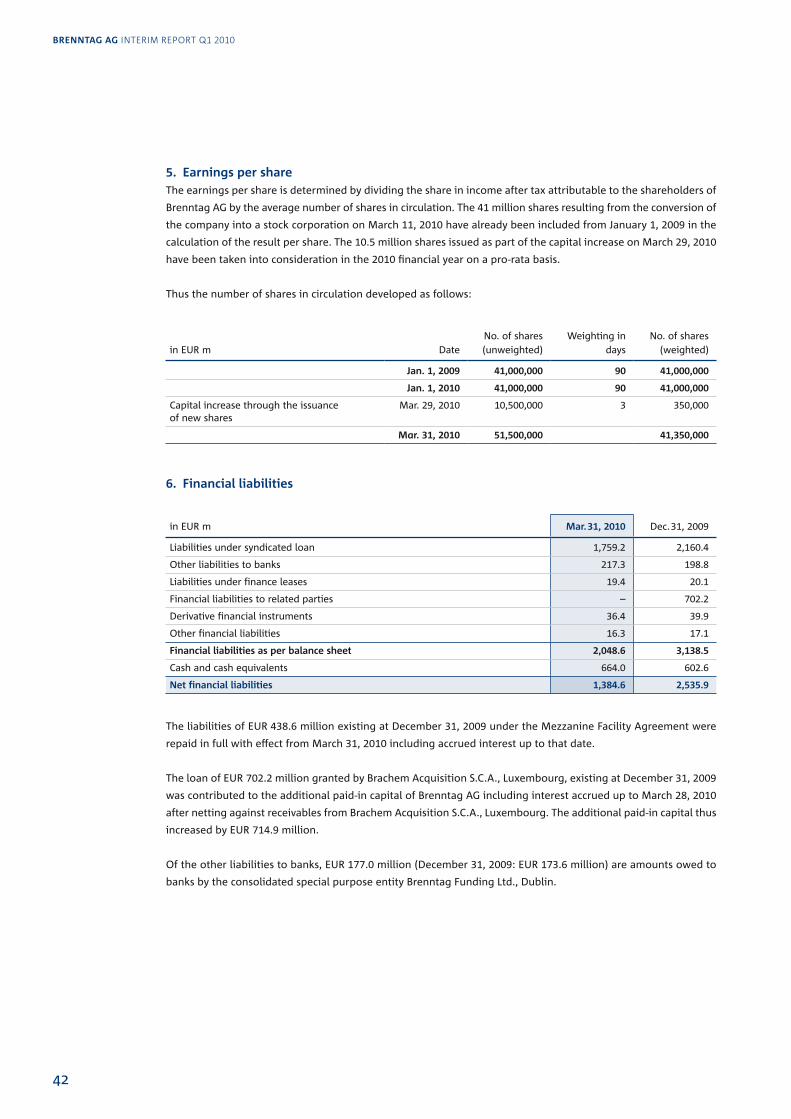
5. earnings per shareThe earnings per share is determined by dividing the share in income after tax attributable to the share holders of
Brenntag AG by the average number of shares in circulation. The 41 million shares resulting from the conversion of
the company into a stock corporation on March 11, 2010 have already been included from January 1, 2009 in the
calculation of the result per share. The 10.5 million shares issued as part of the capital increase on March 29, 2010
have been taken into consideration in the 2010 financial year on a pro-rata basis.
Thus the number of shares in circulation developed as follows:
in EUR m Date
No. of shares(unweighted)
Weighting in days
No. of shares (weighted)
Jan. 1, 2009 41,000,000 90 41,000,000
Jan. 1, 2010 41,000,000 90 41,000,000
Capital increase through the issuance of new shares
Mar. 29, 2010 10,500,000 3 350,000
Mar. 31, 2010 51,500,000 41,350,000
6. financial liabilities
in EUR m Mar. 31, 2010 Dec. 31, 2009
liabilities under syndicated loan 1,759.2 2,160.4
Other liabilities to banks 217.3 198.8
liabilities under finance leases 19.4 20.1
Financial liabilities to related parties – 702.2
Derivative financial instruments 36.4 39.9
Other financial liabilities 16.3 17.1
financial liabilities as per balance sheet 2,048.6 3,138.5
Cash and cash equivalents 664.0 602.6
net financial liabilities 1,384.6 2,535.9
The liabilities of EUR 438.6 million existing at December 31, 2009 under the Mezzanine Facility Agreement were
repaid in full with effect from March 31, 2010 including accrued interest up to that date.
The loan of EUR 702.2 million granted by Brachem Acquisition S.C.A., luxem bourg, existing at December 31, 2009
was contributed to the additional paid-in capital of Brenntag AG includ ing interest accrued up to March 28, 2010
after netting against receivables from Brachem Acquisition S.C.A., luxembourg. The additional paid-in capital thus
increased by EUR 714.9 million.
Of the other liabilities to banks, EUR 177.0 million (December 31, 2009: EUR 173.6 million) are amounts owed to
banks by the consolidated special purpose entity Brenntag Funding ltd., Dublin.
42
BRenntag ag InterIm report Q1 2010
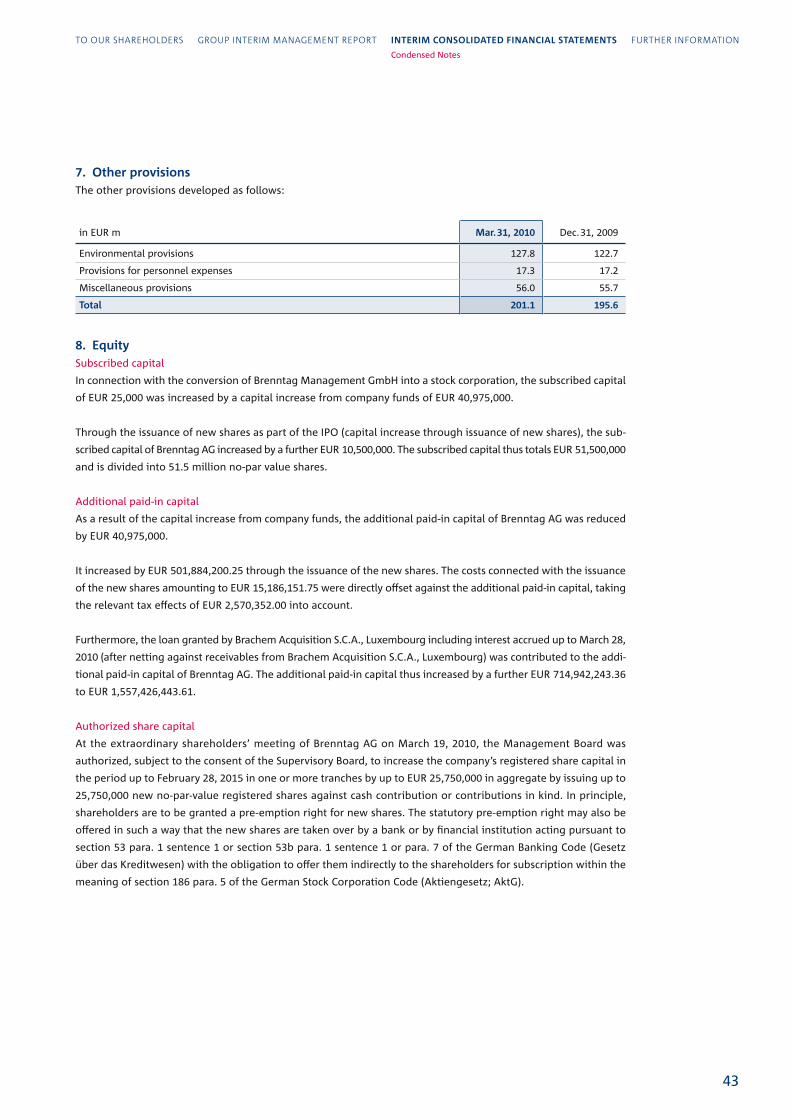
7. other provisionsThe other provisions developed as follows:
in EUR m Mar. 31, 2010 Dec. 31, 2009
Environmental provisions 127.8 122.7
Provisions for personnel expenses 17.3 17.2
Miscellaneous provisions 56.0 55.7
total 201.1 195.6
8. equitySubscribed capital
In connection with the conversion of Brenntag Management GmbH into a stock corporation, the subscribed capital
of EUR 25,000 was increased by a capital increase from company funds of EUR 40,975,000.
Through the issuance of new shares as part of the IPO (capital increase through issuance of new shares), the sub-
scribed capital of Brenntag AG increased by a further EUR 10,500,000. The subscribed capital thus totals EUR 51,500,000
and is divided into 51.5 million no-par value shares.
Additional paid-in capital
As a result of the capital increase from company funds, the additional paid-in capital of Brenntag AG was reduced
by EUR 40,975,000.
It increased by EUR 501,884,200.25 through the issuance of the new shares. The costs con nected with the issuance
of the new shares amounting to EUR 15,186,151.75 were directly off set against the additional paid-in capital, taking
the relevant tax effects of EUR 2,570,352.00 into account.
Furthermore, the loan granted by Bra chem Acquisition S.C.A., luxembourg including interest accrued up to March 28,
2010 (after netting against receivables from Brachem Acquisition S.C.A., luxembourg) was contributed to the addi-
tional paid-in capital of Brenntag AG. The additional paid-in capital thus increased by a further EUR 714,942,243.36
to EUR 1,557,426,443.61.
Authorized share capital
At the extraordinary shareholders’ meeting of Brenntag AG on March 19, 2010, the Man agement Board was
authorized, subject to the consent of the Supervisory Board, to increase the company’s registered share capital in
the period up to February 28, 2015 in one or more tranches by up to EUR 25,750,000 in aggregate by issuing up to
25,750,000 new no-par-value registered shares against cash contribution or contributions in kind. In principle,
shareholders are to be granted a pre-emption right for new shares. The statutory pre-emption right may also be
offered in such a way that the new shares are taken over by a bank or by financial institution acting pursuant to
section 53 para. 1 sentence 1 or section 53b para. 1 sentence 1 or para. 7 of the German Banking Code (Gesetz
über das Kreditwesen) with the obligation to offer them indirectly to the shareholders for subscription within the
meaning of section 186 para. 5 of the German Stock Corporation Code (Aktiengesetz; AktG).
Condensed Notes
to our shareholders Group InterIm manaGement report InteRIM ConsolIDateD fInanCIal stateMents Further InFormatIon
43

However, the Management Board is authorized, subject the consent of the Supervisory Board, to exclude the
statutory pre-emption right in relation to one or more increases of the share capital within the scope of the
authorized share capital
I. to exclude fractional amounts resulting from the subscription ratio from the statutory pre-emption right of the
shareholders;
II. in the case of increases of the share capital against contributions in kind in particular – but without limitation –
to acquire companies, divisions of companies or interests in companies;
III. in the case that the increase of the share capital is against contribution in cash and provided that the issue
price of the new shares is not substantially lower (within the meaning of sections 203 para. 1 and 2, 186
para. 3 sentence 4 AktG) than the stock exchange price for shares in the company of the same class and having
the same conditions already listed at the time of the final determination of the issue price and provided that
the amount of the share capital represented by the shares issued pur suant to this lit (III.) under the exclusion
of the statutory pre-emption right in accor dance with section 186 para. 3 sentence 4 AktG does not exceed
10 % of the share capital at the time of this authorization coming into effect or being exercised. Such amount of
the share capital shall include shares, which have been or are to be issued during the term of this authorized
share capital to fulfil conversion or option rights granted in connection with convertible bonds or warrants or
profit-sharing certificates with conversion or option rights to the extent that such bonds are issued or to be
is sued under the exclusion of the statutory pre-emption right by applying section 186 para. 3 sentence 4 AktG
mutatis mutandis. The said threshold of 10 % shall also in clude new or own shares of the company, which are
issued or transferred during the term of this authorized share capital on another legal basis while excluding
the pre-emption right pursuant to section 186 para. 3 sentence 4 AktG;
IV. to fulfil obligations of the company from convertible or option bonds or warrants or profit-sharing certificates
with conversion or option rights (or combinations of these instruments), which have been issued by the com-
pany or by majority-owned subsidi aries of the company and which provide for a conversion or option right or
an obliga tion to convert.
Conditional capital
At the extraordinary shareholders’ meeting of Brenntag AG on March 19, 2010, the Management Board was autho-
rized, subject to the consent of the Supervisory Board, to issue in one or more tranches until February 28, 2015
bearer or registered convertible or warrant-linked bonds as well as profit participation rights with option or conver-
sion rights with an ag gregate par value of up to EUR 2,000,000,000 with or without a limited term. Furthermore,
a resolution was passed to conditionally increase the share capital by up to EUR 20,500,000 through the issuance
of up to 20,500,000 new no-par-value registered shares with profit par ticipation rights from the beginning of the
business year in which they were issued. The con ditional capital increase serves to issue shares to the holders or
creditors of convertible or warrant-linked bonds as well as profit participation rights with option or conversion
rights which may be issued until February 28, 2015. The conditional capital increase may only be implemented to
the extent that option or conversion rights under bonds or warrants have been exercised or conversion obligations
under such warrants or bonds have to be fulfilled and to the extent that neither treasury shares nor new shares
from the authorized capital are being used to fulfil such claims.
44
BRenntag ag InterIm report Q1 2010

9. Information on the cash flow statementThe cash flow from operating activities decreased among other things as a result of an in crease in trade receiv-
ables of EUR 138.8 million (prior period: decrease in trade receivables of EUR 53.0 million) and increased due to the
increase in trade payables of EUR 86.2 million (prior period: decrease in trade payables of EUR 49.3 million). The
other non-cash items include write-downs on trade receivables and on inventories totalling EUR 1.3 million (prior
period: EUR 3.6 million).
in EUR m
Jan. 1 – Mar. 31,2010
Jan. 1 – Mar. 31,2009
Increase / decrease in inventories – 26.2 85.0
Increase / decrease in trade receivables – 138.8 53.0
Increase / decrease in trade payables 86.2 – 49.3
Write-downs on trade receivables and on inventories 1.3 3.6
Change in working capital – 77.5 92.3
The interest payments include both interest of EUR 64.2 million on the Mezzanine Facilities re paid early as part of
the IPO as well as payments of EUR 14.0 million for the restructuring of the syndicated loan. In addition, balancing
payments under interest-rate hedging are also taken into consideration in the interest payments.
Of the cash provided by financing activities, EUR 525.0 million (less withheld charges of EUR 6.6 million) is from the
IPO. At the same time, repayments of EUR 387.2 million (prior period: EUR 3.6 million) were made on the syndicated
loan. Of this figure, EUR 382.9 million related to the early repayment of the borrowings under Mezzanine Facility
Agreement as part of the IPO.
suBseQuent events
Of the EUR 525.0 million received through the issuance of new shares as part of the capital in crease, EUR 69.0 million
was used for early repayment of part of the Second lien Facility Agree ment of the syndicated loan on April 15, 2010.
Furthermore, in April and May further early repayments of the Senior Facility Agreements totalling EUR 227.3 million
were made in line with the provisions of the syndicated loan.
Mülheim an der Ruhr, May 6, 2010
Brenntag AG
The Management Board
Stephen R. Clark Jürgen Buchsteiner Steven E. Holland
Condensed Notes
to our shareholders Group InterIm manaGement report InteRIM ConsolIDateD fInanCIal stateMents Further InFormatIon
45
review rePort
to BRenntag ag
We have reviewed the condensed consolidated interim financial statements – comprising the statement of financial
position, income statement and statement of comprehensive income, cash flow statement, statement of changes
in equity and selected explanatory notes – and the interim group management report of Brenntag AG for the
period from January 1, 2010 to March 31, 2010 which are part of the quarterly financial report pursuant to
§ (Article) 37x Abs. (paragraph) 3 WpHG (”Wertpapierhandelsge setz”: German Securities Trading Act). The prepa-
ration of the condensed consolidated interim financial statements in accordance with the IFRS applicable to
interim financial reporting as adopted by the EU and of the interim group management report in accordance with
the provisions of the German Securi ties Trading Act applicable to interim group management reports is the
responsibility of the parent Com pany’s Board of Managing Directors. Our responsibility is to issue a review report
on the con densed consolidated interim financial statements and on the interim group management report based
on our review.
We conducted our review of the condensed consolidated interim financial statements and the interim group man-
agement report in accordance with German generally accepted standards for the review of financial statements
promulgated by the Institut der Wirtschaftsprüfer (Institute of Public Auditors in Germany) (IDW) and additionally
observed the International Standard on Review Engagements ”Re view of Interim Financial Information Performed
by the Independent Auditor of the Entity” (ISRE 2410). Those standards require that we plan and perform the
review so that we can preclude through critical evaluation, with moderate assurance, that the condensed consoli-
dated interim financial statements have not been prepared, in all material respects, in accordance with the IFRS
applicable to interim financial reporting as adopted by the EU and that the interim group management report has
not been prepared, in all material respects, in accordance with the provisions of the German Securities Trading
Act applicable to interim group management reports. A review is limited primarily to inquiries of com pany per-
sonnel and analytical procedures and therefore does not provide the assurance attainable in a financial statement
audit. Since, in accordance with our engagement, we have not performed a finan cial statement audit, we cannot
express an audit opinion.
Based on our review, no matters have come to our attention that cause us to presume that the con densed consoli-
dated interim financial statements have not been prepared, in all material respects, in accordance with the IFRS
applicable to interim financial reporting as adopted by the EU nor that the interim group management report has
not been prepared, in all material respects, in accordance with the provisions of the German Securities Trading
Act applicable to interim group management reports.
Düsseldorf, May 6, 2010
PricewaterhouseCoopers
Aktiengesellschaft
Wirtschaftsprüfungsgesellschaft
Klaus-Dieter Ruske Frank Hübner
Wirtschaftsprüfer Wirtschaftsprüfer
(German Public Auditor) (German Public Auditor)
46
BRenntag ag InterIm report Q1 2010
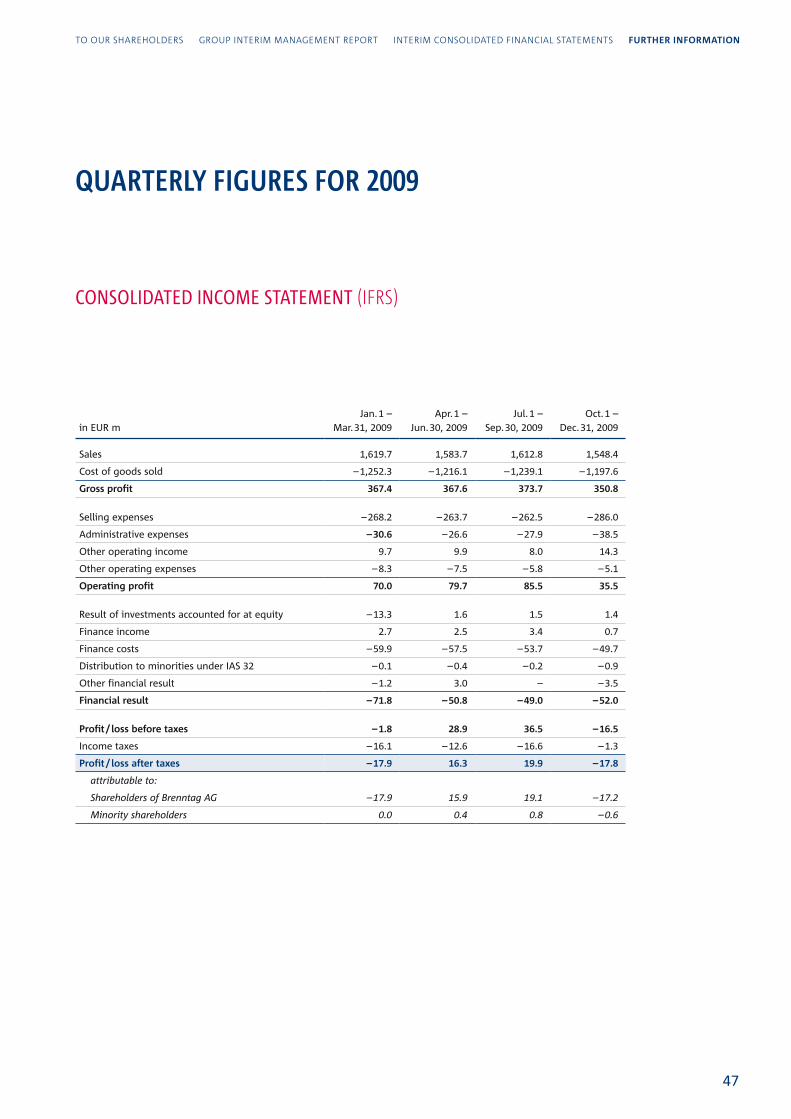
COnSOLidaTEd inCOME STaTEMEnT (IFRS)
Quarterly FiGures For 2009
in EUR mJan. 1 –
Mar. 31, 2009Apr. 1 –
Jun. 30, 2009Jul. 1 –
Sep. 30, 2009Oct. 1 –
Dec. 31, 2009
Sales 1,619.7 1,583.7 1,612.8 1,548.4
Cost of goods sold – 1,252.3 – 1,216.1 – 1,239.1 – 1,197.6
gross profit 367.4 367.6 373.7 350.8
Selling expenses – 268.2 – 263.7 – 262.5 – 286.0
Administrative expenses – 30.6 – 26.6 – 27.9 – 38.5
Other operating income 9.7 9.9 8.0 14.3
Other operating expenses – 8.3 – 7.5 – 5.8 – 5.1
operating profit 70.0 79.7 85.5 35.5
Result of investments accounted for at equity – 13.3 1.6 1.5 1.4
Finance income 2.7 2.5 3.4 0.7
Finance costs – 59.9 – 57.5 – 53.7 – 49.7
Distribution to minorities under IAS 32 – 0.1 – 0.4 – 0.2 – 0.9
Other financial result – 1.2 3.0 – – 3.5
financial result – 71.8 – 50.8 – 49.0 – 52.0
Profit / loss before taxes – 1.8 28.9 36.5 – 16.5
Income taxes – 16.1 – 12.6 – 16.6 – 1.3
Profit / loss after taxes – 17.9 16.3 19.9 – 17.8
attributable to:
Shareholders of Brenntag AG – 17.9 15.9 19.1 – 17.2
Minority shareholders 0.0 0.4 0.8 – 0.6
to our shareholders Group InterIm manaGement report InterIm ConsolIdated FInanCIal statements fuRtheR InfoRMatIon
47

COnSOLidaTEd BaLanCE ShEET (IFRS)
assets in EUR m Mar. 31, 2009 Jun. 30, 2009 Sep. 30, 2009 Dec. 31, 2009
Current assets
Cash and cash equivalents 458.1 556.4 588.7 602.6
Trade receivables 934.4 912.7 909.4 831.4
Other receivables 99.7 98.4 93.2 85.2
Other financial assets 13.3 8.1 8.7 6.3
Current tax assets 29.6 26.9 14.5 15.3
Inventories 472.7 417.5 417.4 422.3
Non-current assets held for sale 12.0 4.9 5.0 3.2
2,019.8 2,024.9 2,036.9 1,966.3
non-current assets
Property, plant and equipment 788.0 772.2 761.4 784.1
Intangible assets 1,899.6 1,845.3 1,796.5 1,785.9
Investments accounted for at equity 14.7 16.7 17.9 18.6
Other receivables 19.8 18.1 18.2 21.3
Other financial assets 9.1 9.7 11.1 10.6
Deferred tax assets 51.8 46.1 41.0 67.0
2,783.0 2,708.1 2,646.1 2,687.5
total assets 4,802.8 4,733.0 4,683.0 4,653.8
48
BRenntag ag InterIm report Q1 2010

lIaBIlItIes anD eQuIty in EUR m Mar. 31, 2009 Jun. 30, 2009 Sep. 30, 2009 Dec. 31, 2009
Current liabilities
Trade payables 653.8 683.3 697.2 655.6
Financial liabilities 77.8 131.7 56.9 61.5
Other liabilities 316.9 311.4 328.4 309.0
Other provisions 54.3 52.1 54.9 56.1
Current tax liabilities 27.4 13.9 18.5 2.5
1,130.2 1,192.4 1,155.9 1,084.7
non-current liabilities
Financial liabilities 3,182.8 3,059.2 3,049.0 3,077.0
Other liabilities 3.2 3.3 1.6 1.7
Other provisions 142.9 143.0 139.6 139.5
Provisions for pensions and similar obligations 52.1 53.3 53.4 54.4
liabilities to minorities under IAS 32 3.4 2.3 2.6 2.1
Deferred tax liabilities 134.6 119.6 106.6 122.1
3,519.0 3,380.7 3,352.8 3,396.8
equity
Subscribed capital 1) – – – –
Additional paid-in capital 381.6 381.6 381.6 381.6
Retained earnings – 160.0 – 144.1 – 125.0 – 143.5
Other comprehensive income – 75.6 – 84.7 – 91.0 – 74.0
equity attributable to Brenntag shareholders 146.0 152.8 165.6 164.1
Equity attributable to minority shareholders 7.6 7.1 8.7 8.2
153.6 159.9 174.3 172.3
total liabilities and equity 4,802.8 4,733.0 4,683.0 4,653.8
1) Prior period EUR 25.0 k.
to our shareholders Group InterIm manaGement report InterIm ConsolIdated FInanCIal statements fuRtheR InfoRMatIon
49
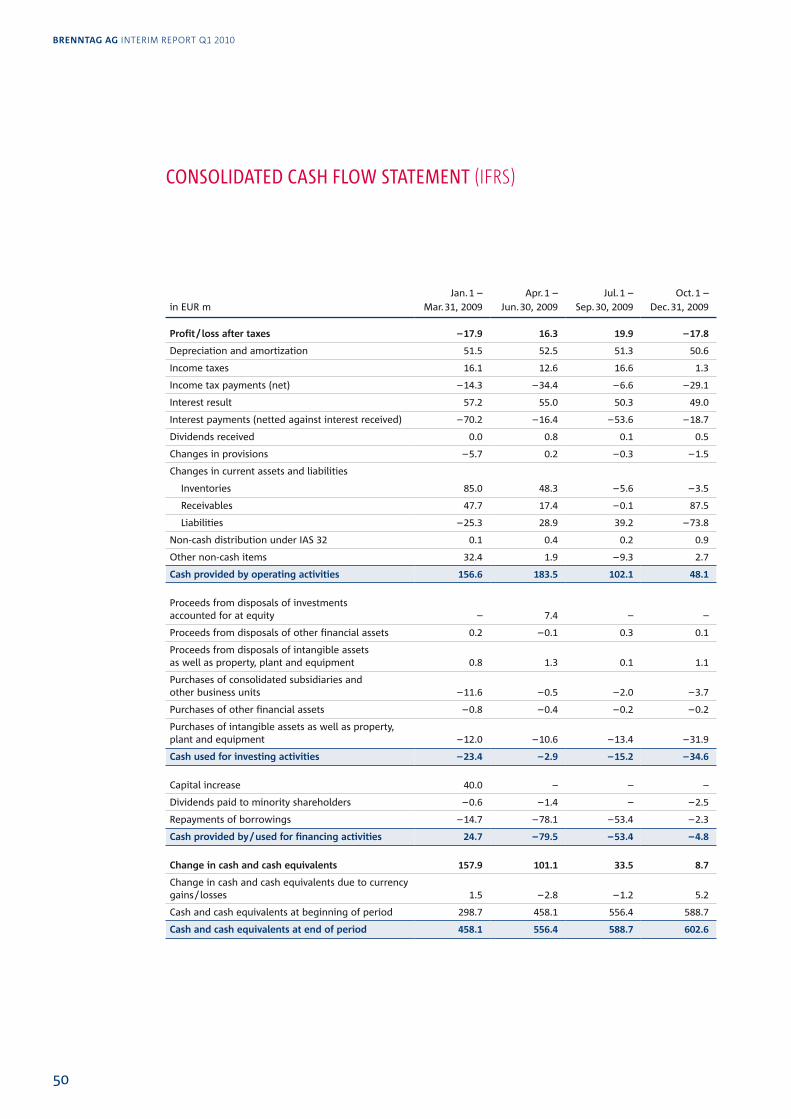
COnSOLidaTEd CaSh fLOW STaTEMEnT (IFRS)
in EUR mJan. 1 –
Mar. 31, 2009Apr. 1 –
Jun. 30, 2009Jul. 1 –
Sep. 30, 2009Oct. 1 –
Dec. 31, 2009
Profit / loss after taxes – 17.9 16.3 19.9 – 17.8
Depreciation and amortization 51.5 52.5 51.3 50.6
Income taxes 16.1 12.6 16.6 1.3
Income tax payments (net) – 14.3 – 34.4 – 6.6 – 29.1
Interest result 57.2 55.0 50.3 49.0
Interest payments (netted against interest received) – 70.2 – 16.4 – 53.6 – 18.7
Dividends received 0.0 0.8 0.1 0.5
Changes in provisions – 5.7 0.2 – 0.3 – 1.5
Changes in current assets and liabilities
Inventories 85.0 48.3 – 5.6 – 3.5
Receivables 47.7 17.4 – 0.1 87.5
liabilities – 25.3 28.9 39.2 – 73.8
Non-cash distribution under IAS 32 0.1 0.4 0.2 0.9
Other non-cash items 32.4 1.9 – 9.3 2.7
Cash provided by operating activities 156.6 183.5 102.1 48.1
Proceeds from disposals of investments accounted for at equity – 7.4 – –
Proceeds from disposals of other financial assets 0.2 – 0.1 0.3 0.1
Proceeds from disposals of intangible assets as well as property, plant and equipment 0.8 1.3 0.1 1.1
Purchases of consolidated subsidiaries and other business units – 11.6 – 0.5 – 2.0 – 3.7
Purchases of other financial assets – 0.8 – 0.4 – 0.2 – 0.2
Purchases of intangible assets as well as property, plant and equipment – 12.0 – 10.6 – 13.4 – 31.9
Cash used for investing activities – 23.4 – 2.9 – 15.2 – 34.6
Capital increase 40.0 – – –
Dividends paid to minority shareholders – 0.6 – 1.4 – – 2.5
Repayments of borrowings – 14.7 – 78.1 – 53.4 – 2.3
Cash provided by / used for financing activities 24.7 – 79.5 – 53.4 – 4.8
Change in cash and cash equivalents 157.9 101.1 33.5 8.7
Change in cash and cash equivalents due to currency gains / losses 1.5 – 2.8 – 1.2 5.2
Cash and cash equivalents at beginning of period 298.7 458.1 556.4 588.7
Cash and cash equivalents at end of period 458.1 556.4 588.7 602.6
50
BRenntag ag InterIm report Q1 2010
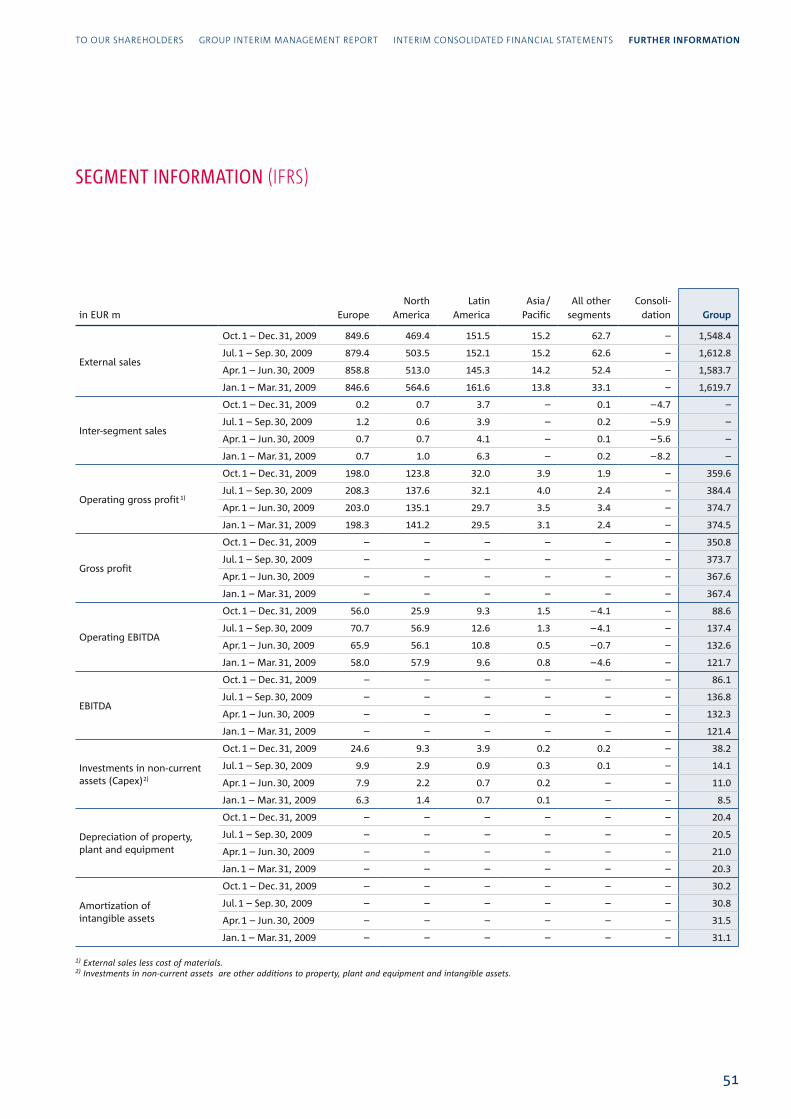
SEgMEnT infOrMaTiOn (IFRS)
in EUR m Europe
North America
latinAmerica
Asia / Pacific
All other segments
Consoli-dation group
External sales
Oct. 1 – Dec. 31, 2009 849.6 469.4 151.5 15.2 62.7 – 1,548.4
Jul. 1 – Sep. 30, 2009 879.4 503.5 152.1 15.2 62.6 – 1,612.8
Apr. 1 – Jun. 30, 2009 858.8 513.0 145.3 14.2 52.4 – 1,583.7
Jan. 1 – Mar. 31, 2009 846.6 564.6 161.6 13.8 33.1 – 1,619.7
Inter-segment sales
Oct. 1 – Dec. 31, 2009 0.2 0.7 3.7 – 0.1 – 4.7 –
Jul. 1 – Sep. 30, 2009 1.2 0.6 3.9 – 0.2 – 5.9 –
Apr. 1 – Jun. 30, 2009 0.7 0.7 4.1 – 0.1 – 5.6 –
Jan. 1 – Mar. 31, 2009 0.7 1.0 6.3 – 0.2 – 8.2 –
Operating gross profit 1)
Oct. 1 – Dec. 31, 2009 198.0 123.8 32.0 3.9 1.9 – 359.6
Jul. 1 – Sep. 30, 2009 208.3 137.6 32.1 4.0 2.4 – 384.4
Apr. 1 – Jun. 30, 2009 203.0 135.1 29.7 3.5 3.4 – 374.7
Jan. 1 – Mar. 31, 2009 198.3 141.2 29.5 3.1 2.4 – 374.5
Gross profit
Oct. 1 – Dec. 31, 2009 – – – – – – 350.8
Jul. 1 – Sep. 30, 2009 – – – – – – 373.7
Apr. 1 – Jun. 30, 2009 – – – – – – 367.6
Jan. 1 – Mar. 31, 2009 – – – – – – 367.4
Operating EBITDA
Oct. 1 – Dec. 31, 2009 56.0 25.9 9.3 1.5 – 4.1 – 88.6
Jul. 1 – Sep. 30, 2009 70.7 56.9 12.6 1.3 – 4.1 – 137.4
Apr. 1 – Jun. 30, 2009 65.9 56.1 10.8 0.5 – 0.7 – 132.6
Jan. 1 – Mar. 31, 2009 58.0 57.9 9.6 0.8 – 4.6 – 121.7
EBITDA
Oct. 1 – Dec. 31, 2009 – – – – – – 86.1
Jul. 1 – Sep. 30, 2009 – – – – – – 136.8
Apr. 1 – Jun. 30, 2009 – – – – – – 132.3
Jan. 1 – Mar. 31, 2009 – – – – – – 121.4
Investments in non-current assets (Capex) 2)
Oct. 1 – Dec. 31, 2009 24.6 9.3 3.9 0.2 0.2 – 38.2
Jul. 1 – Sep. 30, 2009 9.9 2.9 0.9 0.3 0.1 – 14.1
Apr. 1 – Jun. 30, 2009 7.9 2.2 0.7 0.2 – – 11.0
Jan. 1 – Mar. 31, 2009 6.3 1.4 0.7 0.1 – – 8.5
Depreciation of property, plant and equipment
Oct. 1 – Dec. 31, 2009 – – – – – – 20.4
Jul. 1 – Sep. 30, 2009 – – – – – – 20.5
Apr. 1 – Jun. 30, 2009 – – – – – – 21.0
Jan. 1 – Mar. 31, 2009 – – – – – – 20.3
Amortization of intangible assets
Oct. 1 – Dec. 31, 2009 – – – – – – 30.2
Jul. 1 – Sep. 30, 2009 – – – – – – 30.8
Apr. 1 – Jun. 30, 2009 – – – – – – 31.5
Jan. 1 – Mar. 31, 2009 – – – – – – 31.1
1) External sales less cost of materials. 2) Investments in non-current assets are other additions to property, plant and equipment and intangible assets.
to our shareholders Group InterIm manaGement report InterIm ConsolIdated FInanCIal statements fuRtheR InfoRMatIon
51
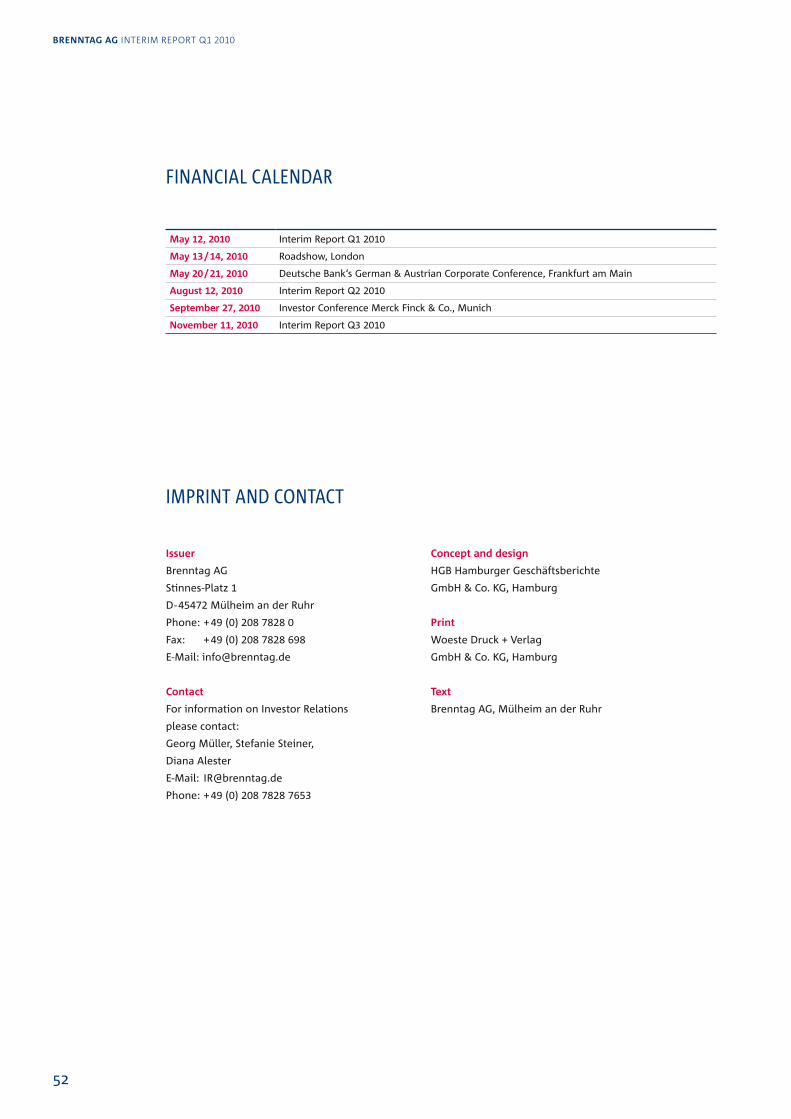
finanCiaL CaLEndar
iMPrinT and COnTaCT
May 12, 2010 Interim Report Q1 2010
May 13 / 14, 2010 Roadshow, london
May 20 / 21, 2010 Deutsche Bank‘s German & Austrian Corporate Conference, Frankfurt am Main
august 12, 2010 Interim Report Q2 2010
september 27, 2010 Investor Conference Merck Finck & Co., Munich
november 11, 2010 Interim Report Q3 2010
Issuer
Brenntag AG
Stinnes-Platz 1
D - 45472 Mülheim an der Ruhr
Phone: + 49 (0) 208 7828 0
Fax: + 49 (0) 208 7828 698
E-Mail: [email protected]
Contact
For information on Investor Relations
please contact:
Georg Müller, Stefanie Steiner,
Diana Alester
E-Mail: [email protected]
Phone: + 49 (0) 208 7828 7653
Concept and design
HGB Hamburger Geschäftsberichte
GmbH & Co. KG, Hamburg
Woeste Druck + Verlag
GmbH & Co. KG, Hamburg
text
Brenntag AG, Mülheim an der Ruhr
52
BRenntag ag InterIm report Q1 2010

Information on the Interim ReportThis translation is only a convenience translation. In case of any differences only the German version is binding.
Information on rounding Due to the commercial rounding minor differences may occur when using rounded amounts or rounded percentages.
DisclaimerThis report contains forward-looking statements. The words “anticipate”, “assume”, “believe”, “estimate”, “expect”, “intend” , “plan”, “project”, “may”, “should” and similar expressions are used to identify forward-looking statements. Forward-looking statements are statements that are not historical facts; instead they reflect our current views and expectations and the assumptions underlying them about future events.
These forward-looking statements are subject to many risks and uncertainties, including a lack of further improvement or a renewed deterioration of global economic conditions, in particular a renewed decline of consumer demand and investment activities in Western Europe for the United States, a down-turn in major Asian economies, a continuation of the tense situation in the credit and financial markets and other risks and uncertainties.
If any of these risks and uncertainties materialize or if the assumptions underlying any of our forward-looking statements are proving to be incorrect, our actual results may be materially different from those expressed or implied by such forward-looking statements. We do not intend or assume any obligation to update these forward-looking statements. Any forward-looking statement speaks only as of the date on which it is made.

Brenntag ag
Stinnes-Platz 1
45472 Mülheim an der Ruhr
Germany
Phone: + 49 (0) 208 7828 7653
Fax: + 49 (0) 208 7828 7755