Global Liquids Supply Outlook - Peak Watch
35
Strategic Advisors in Global Energy Global Liquids Supply Outlook Bob MacKnight Includes: OPEC and Non-OPEC Conventional, Tar Sands, Biofuels, and Others 26 March 2008
Transcript of Global Liquids Supply Outlook - Peak Watch
Strategic Advisors in Global Energy
Global Liquids Supply Outlook
Bob MacKnight
Includes: OPEC and Non-OPEC Conventional, Tar Sands, Biofuels, and Others
26 March 2008

Global Liquids Supply Outlook | Upstream Group | Page 2
0
20,000
40,000
60,000
80,000
100,000
120,00019
95
2000
2005
2010
2015
2020
Dai
ly P
rodu
ctio
n (m
b/d)
0
20,000
40,000
60,000
80,000
100,000
120,000
Non-OPEC Crude Non-OPEC Oil SandsNon-OPEC NGL & Condensate OPEC NGL1.1% Growth 1.7% Growth2.4% Growth
37-45 mmb/d46-58 mmb/d
Call on OPEC Crude
OPEC 33-36 mmb/d
The Dilemma - The Expected Growing Gap Between Global Demand and Global Non-OPEC Supply in the Next Decade

Global Liquids Supply Outlook | Upstream Group | Page 3
1965 1970 1975 1980 1985 1990 1995 2000 2005
USA RomaniaTunisiaPeru
Dem Rep CongoCameroon
Other EuropeEgypt
PakistanPapua New Guinea
SyriaUK
GabonUzbekistan
NorwayOman
New ZealandArgentina
CongoColombiaAustraliaYemen
DenmarkMexicoChad
CanadaBrunei
MalaysiaIndiaChina
Turkmenistan
The above bars show the onset and duration of documented production peaks or plateaus – tracking country life cycle shows an acceleration of the number of countries passing from peak to decline
Countries in the decline phase
Countries in the plateau phase
Onset of Plateau
Duration of Plateau
Onset of Decline
Non-OPEC Countries in Decline or in Plateau
Global Liquids Supply Outlook | Upstream Group | Page 4
0%
10%
20%
30%
40%
50%
60%
70%
80%
Chad
Papu
a New
Guine
aIndo
nesia
Uzbekistan
Cameroo
nCo
ngo
Syria
Peru
Roman
iaVe
nezuela
Oman
Egypt
Columbia
Norway
Gab
onTunisia
Yemen
New
Zealand
Dem
Rep
Con
goArgen
tina
Pakistan
Den
mark
Mexico
UK
Australia
% Reserve
Dep
letion
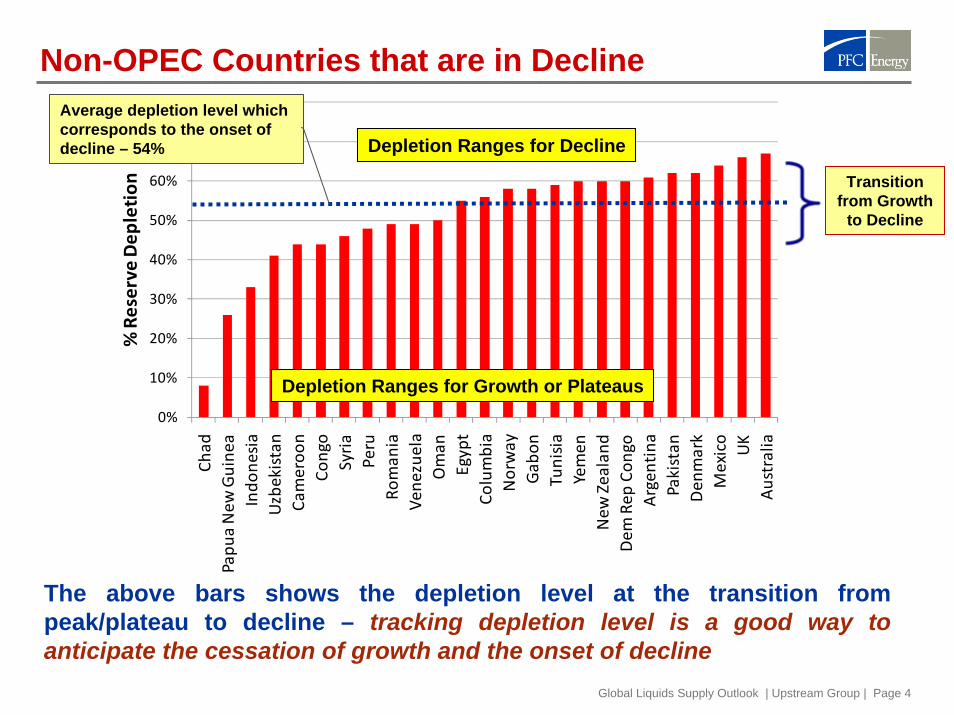
The above bars shows the depletion level at the transition from peak/plateau to decline – tracking depletion level is a good way to anticipate the cessation of growth and the onset of decline
Depletion Ranges for Decline
Depletion Ranges for Growth or Plateaus
Transition from Growth
to Decline
Average depletion level which corresponds to the onset of decline – 54%
Non-OPEC Countries that are in Decline
Global Liquids Supply Outlook | Upstream Group | Page 5
0%
10%
20%
30%
40%
50%
60%
70%
80%
Turkmenistan Malaysia India Brunei China
% Reserve
Dep
letion
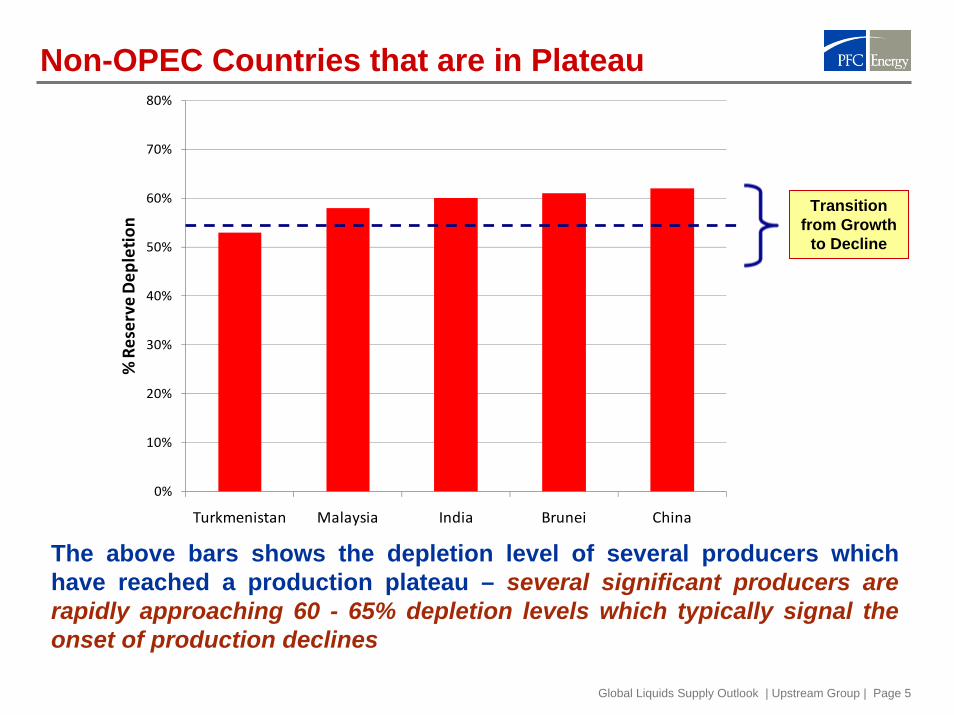
The above bars shows the depletion level of several producers which have reached a production plateau – several significant producers are rapidly approaching 60 - 65% depletion levels which typically signal the onset of production declines
Transition from Growth
to Decline
Non-OPEC Countries that are in Plateau

Global Liquids Supply Outlook | Upstream Group | Page 6
0%
10%
20%
30%
40%
50%
60%
70%
80%
% Reserve
Dep
letion
The above bars shows the depletion level of several producers, which have new discoveries and are considered very likely to increase production.
Transition from Growth
to Decline
Non-OPEC Countries with Production Growth

Global Liquids Supply Outlook | Upstream Group | Page 7
0
5,000
10,000
15,000
20,000
25,000
30,000
35,000
1965
1970
1975
1980
1985
1990
1995
2000
2005
2010
2015
2020
Dai
ly C
rude
Pro
duct
ion
(mb/
d)Global: Non-OPEC, Non-FSU, Non-Unconventional Crude
Supply Forecast (with Exploration)
P10e Forecast
P25e Forecast
P50e Forecast
P75e Forecast
P90e Forecast
PFC Energy’s models suggest that production has declined but reserve addition from exploration will keep production level above 25,000 million barrels per day until the middle of the next decade.
Possible production path if exploration results and decline rates fall at the more pessimistic end of the scale
Possible production path if exploration results and decline rates fall at the more optimistic end of the scale
Non-OPEC Crude Oil Forecast with Exploration (excluding NGLs, FSU, and Uncon. Heavy Oil)

Global Liquids Supply Outlook | Upstream Group | Page 8
FSU / Eastern Europe Crude Oil Production Forecast
0
2,000
4,000
6,000
8,000
10,000
12,000
14,000
16,000
18,000
1985
1990
1995
2000
2005
2010
2015
2020
2025
2030
Dai
ly C
rude
Pro
duct
ion
(mb/
d)FSU/ Eastern Europe Crude Supply Forecast (With Exploration)
P10e ForecastP25e ForecastP50e ForecastP75e ForecastP90e Forecast
When potential production from future exploration reserves is incorporated with current P1 and P2 reserves, total crude oil production is expected to peak within a range of 14,000 to 15,000 mb/d by the middle of the next decade.
Global Liquids Supply Outlook | Upstream Group | Page 9
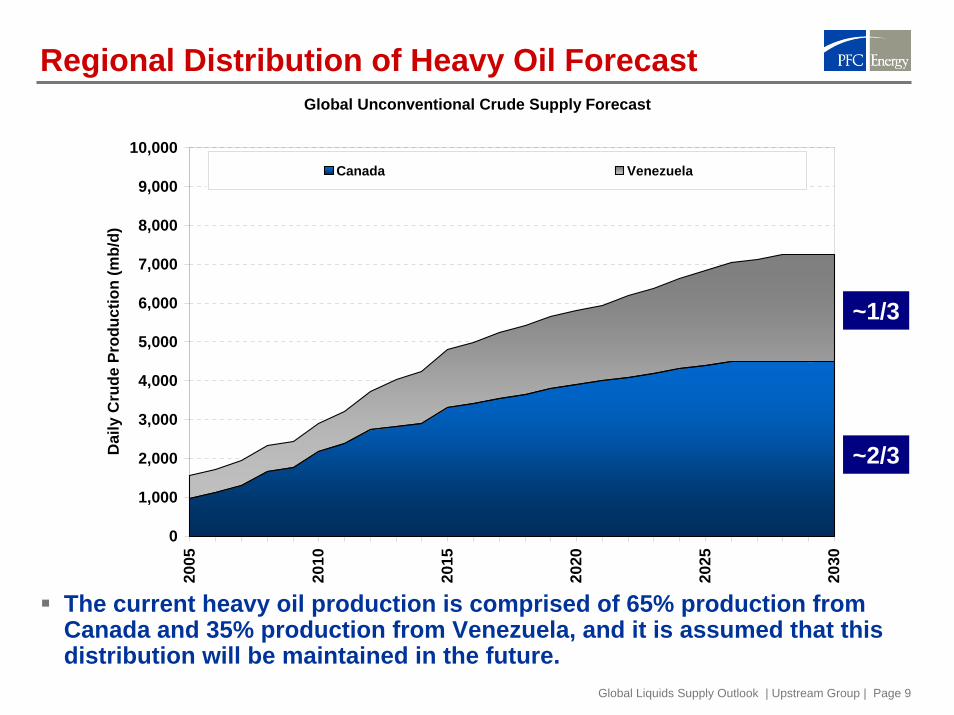
Regional Distribution of Heavy Oil Forecast
The current heavy oil production is comprised of 65% production from Canada and 35% production from Venezuela, and it is assumed that this distribution will be maintained in the future.
Global Unconventional Crude Supply Forecast
0
1,000
2,000
3,000
4,000
5,000
6,000
7,000
8,000
9,000
10,000
2005
2010
2015
2020
2025
2030
Dai
ly C
rude
Pro
duct
ion
(mb/
d)
Canada Venezuela
~2/3
~1/3
Global Liquids Supply Outlook | Upstream Group | Page 10
0
5,000
10,000
15,000
20,000
25,000
30,000
35,000
40,000
45,000
50,000
1985
1990
1995
2000
2005
2010
2015
2020
Dai
ly C
rude
Pro
duct
ion
(mb/
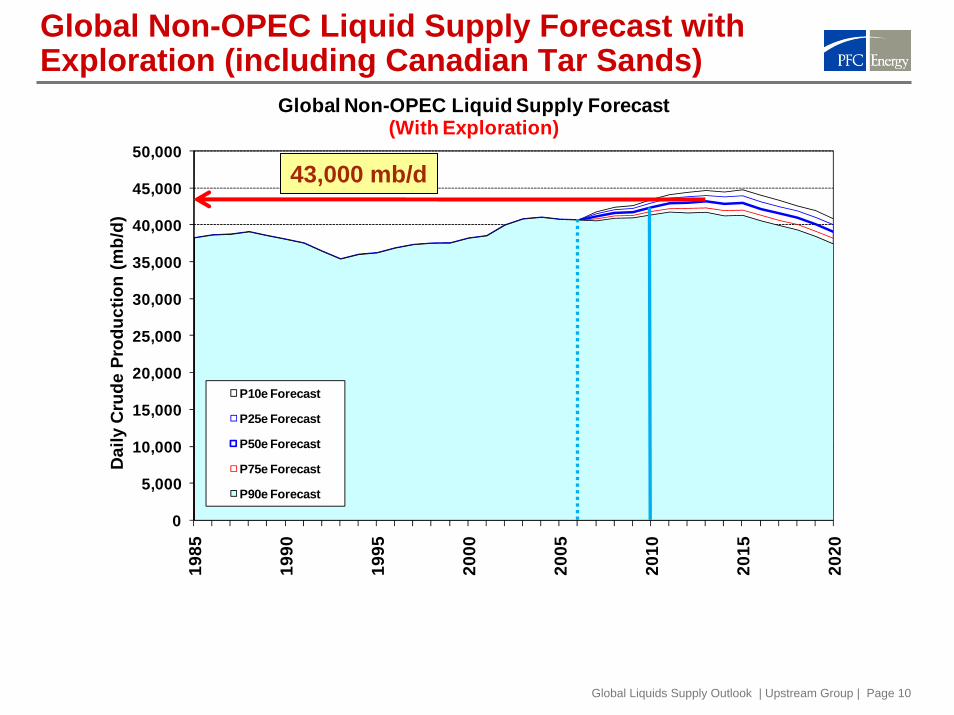
d)Global Non-OPEC Liquid Supply Forecast
(With Exploration)
P10e Forecast
P25e Forecast
P50e Forecast
P75e Forecast
P90e Forecast
43,000 mb/d
Global Non-OPEC Liquid Supply Forecast with Exploration (including Canadian Tar Sands)
Global Liquids Supply Outlook | Upstream Group | Page 11
Global Non-OPEC Liquids & OPEC Non-Quota Liquids Supply Forecast (With Exploration)
0
10,000
20,000
30,000
40,000
50,000
60,000
70,00019
85
1990
1995
2000
2005
2010
2015
2020
Dai
ly P
rodu
ctio
n (m
b/d)
Europe USA Middle EastAfrica Canada AustralAsiaLatin America FSU/EE Canada Unconventional HeavyOPEC & Non-OPEC NGL Biofuels GTLOil Shale
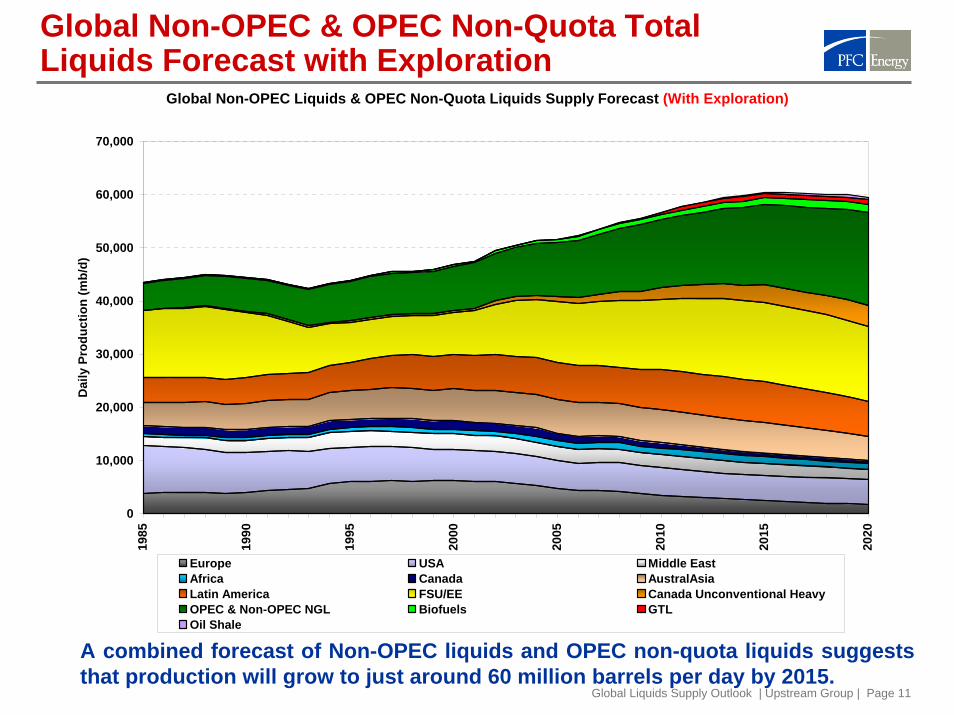
Global Non-OPEC & OPEC Non-Quota Total Liquids Forecast with Exploration
A combined forecast of Non-OPEC liquids and OPEC non-quota liquids suggests that production will grow to just around 60 million barrels per day by 2015.

Global Liquids Supply Outlook | Upstream Group | Page 12
0
10,000
20,000
30,000
40,000
50,000
60,000
70,000
1985
1990
1995
2000
2005
2010
2015
2020
Dai
ly C
rude
Pro
duct
ion
(mb/
d)Global Non-OPEC Liquid and OPEC Non-Quota Liquid Supply Forecast
(With Exploration)
P10e Forecast
P25e Forecast
P50e Forecast
P75e Forecast
P90e Forecast
A combined forecast of Non-OPEC crude, Non-OPEC NGLs, and OPEC Non-Quota NGLs suggests that, with exploration success, production will reach 60 million barrels per day with declines beginning towards the end of the next decade.
60,000 mb/d
Global Non-OPEC Liquid & OPEC Non-Quota Liquid Supply Forecast with Exploration
Global Liquids Supply Outlook | Upstream Group | Page 13
0
10,000
20,000
30,000
40,000
50,000
60,000
Wes
t Afr
ica
Latin
Am
eric
a
Non
-OPE
CN
orth
Afr
ica
/M
iddl
e Ea
st
Aus
tral
Asi
a
Wes
tern
Euro
pe
FSU
/Ea
ster
nEu
rope
Reserves Produced Post-1990
Reserves Discovered Post-1990
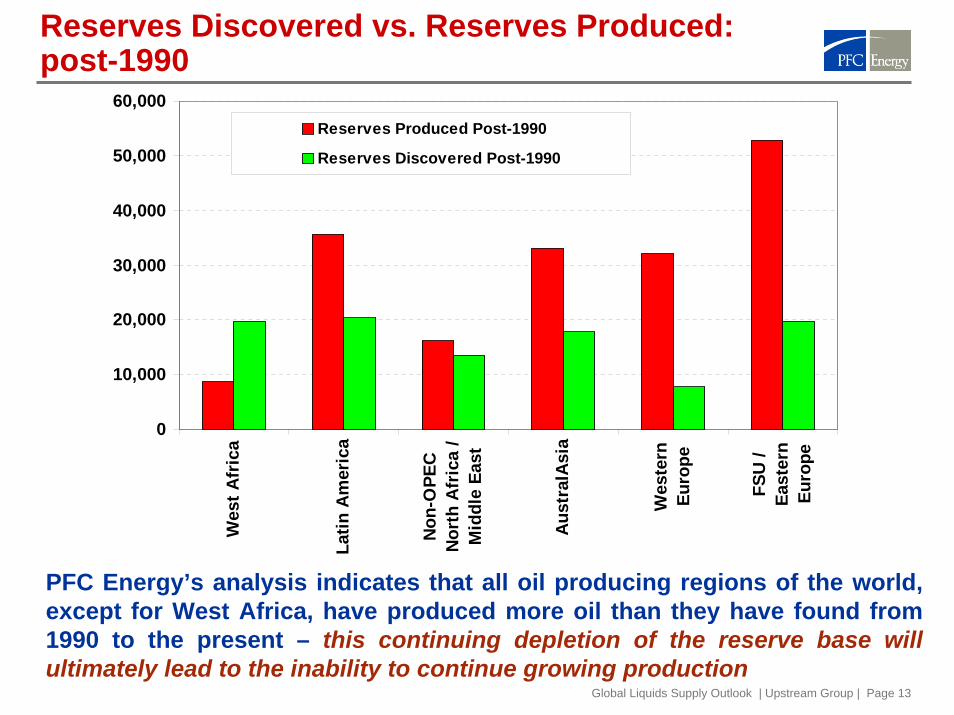
PFC Energy’s analysis indicates that all oil producing regions of the world, except for West Africa, have produced more oil than they have found from 1990 to the present – this continuing depletion of the reserve base will ultimately lead to the inability to continue growing production
Reserves Discovered vs. Reserves Produced: post-1990

Global Liquids Supply Outlook | Upstream Group | Page 14
0
5,000
10,000
15,000
20,000
25,000
30,000
35,000
40,000
1951-1960 1961-1970 1971-1980 1981-1990 1991-2005
Ave
rage
Ann
ual R
eser
ves
Dis
cove
red
(mm
bo)
In order to stabilize the depletion of Non – OPEC reserves we would need to start offsetting every barrel produced with a new barrel found (either through discovery or enhanced recovery) – given current and projected levels of consumption that means we would have to return to success levels typical of the period prior to 1980
Reserves Discovered Outside of North America
Average Annual Reserve Additions Decline Every Decade, yet Demand Increases Every Decade
Global Liquids Supply Outlook | Upstream Group | Page 15
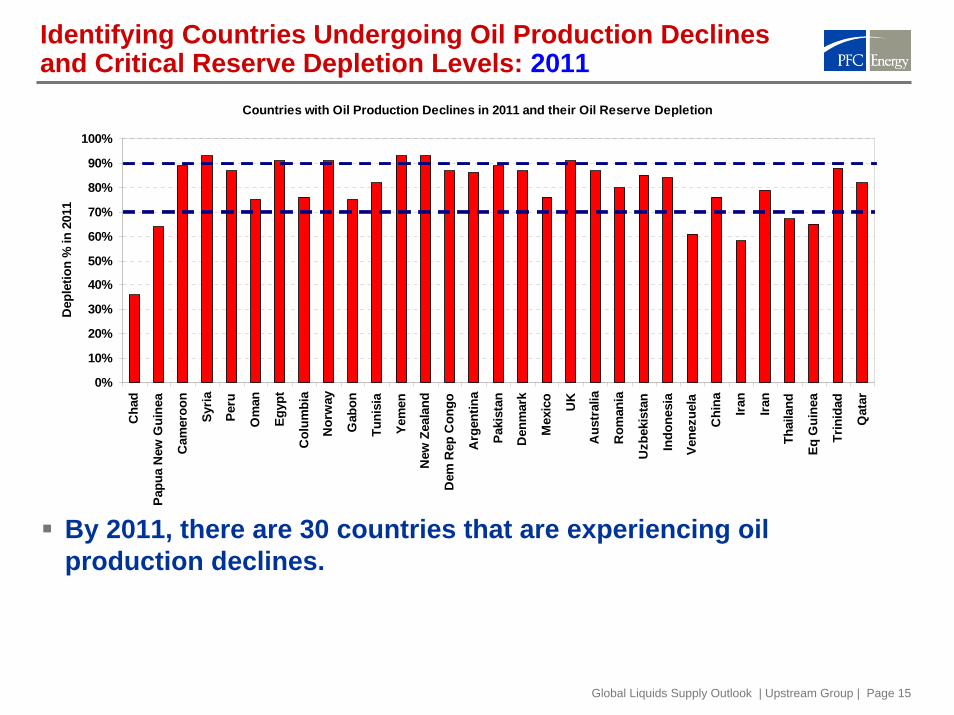
Identifying Countries Undergoing Oil Production Declines and Critical Reserve Depletion Levels: 2011
Countries with Oil Production Declines in 2011 and their Oil Reserve Depletion
0%
10%
20%
30%
40%
50%
60%
70%
80%
90%
100%C
had
Papu
a N
ew G
uine
a
Cam
eroo
n
Syria
Peru
Om
an
Egyp
t
Col
umbi
a
Nor
way
Gab
on
Tuni
sia
Yem
en
New
Zea
land
Dem
Rep
Con
go
Arg
entin
a
Paki
stan
Den
mar
k
Mex
ico
UK
Aus
tral
ia
Rom
ania
Uzb
ekis
tan
Indo
nesi
a
Vene
zuel
a
Chi
na Iran
Iran
Thai
land
Eq G
uine
a
Trin
idad
Qat
ar
Dep
letio
n %
in 2
011
By 2011, there are 30 countries that are experiencing oil production declines.

Global Liquids Supply Outlook | Upstream Group | Page 16
Countries Experiencing Oil Production Growth in 2011
Countries in Oil Production Growth: 2011
0%
10%
20%
30%
40%
50%
60%
70%
80%
90%
100%
Congo
Iraq
Maurita
nia
Brazil
Angola
VietnamEcua
dorAze
rbaij
anKaza
khstan
Russia
LibyaNige
riaSaudi A
rabia
United A
rab Emira
tes
Res
erve
Dep
letio
n %
In 2011, there are only 14 countries that have a sufficient oil reserve base to support production growth.

Global Liquids Supply Outlook | Upstream Group | Page 17
OPEC OutlookReserves and Production ForecastSaudi Arabia and Kuwait Crude Reserve Views

Global Liquids Supply Outlook | Upstream Group | Page 18
Concerns With OPEC Reserves
1. The Gulf members on the OPEC Group substantially increased theirofficially reported remaining reserve number during the early 1980s during the competition for OPEC quotas.
2. Since the mid 1980s OPEC countries in the Gulf has essentially kept their officially reported remaining reserve flat, despite the fact that all data bases and their own reporting indicate minor reserve additions through exploration.
3. OPEC keeps their remaining reserve numbers flat by arguing that for every barrel they produce they are able to offset this by adding a barrel through adjustments to reservoir parameters (porosity, water saturation, recovery factor, net to gross ratio, etc.).
4. When we track reserve additions through exploration and the depletion of those reserve through production, we see a much lower remaining reserve number than what is reported by OPEC.
Global Liquids Supply Outlook | Upstream Group | Page 19
Concerns With OPEC Reserves
5. The real issue here is that we really do not know what several key OPEC countries reserves really are because there is no way to independently verify them as we can in most non-OPEC countries where you have foreign companies doing the exploration and development.
6. The shape and style of these country’s remaining reserve profiles in the face of disappointing exploration results over the last 20 years and the fact that they almost exactly offset production with reserves through book keeping has to raise suspicions.
7. Our analysis suggests that OPEC overall has depleted approximately 40 percent of its reserve base with annual depletion levels running at 1 %/year (OPEC would argue that it is their policy to have 0% depletion) ….. If PFC’s estimated rate of depletion is correct then OPEC will reach the critical level of 60% in the later part of the next decade.
Global Liquids Supply Outlook | Upstream Group | Page 20
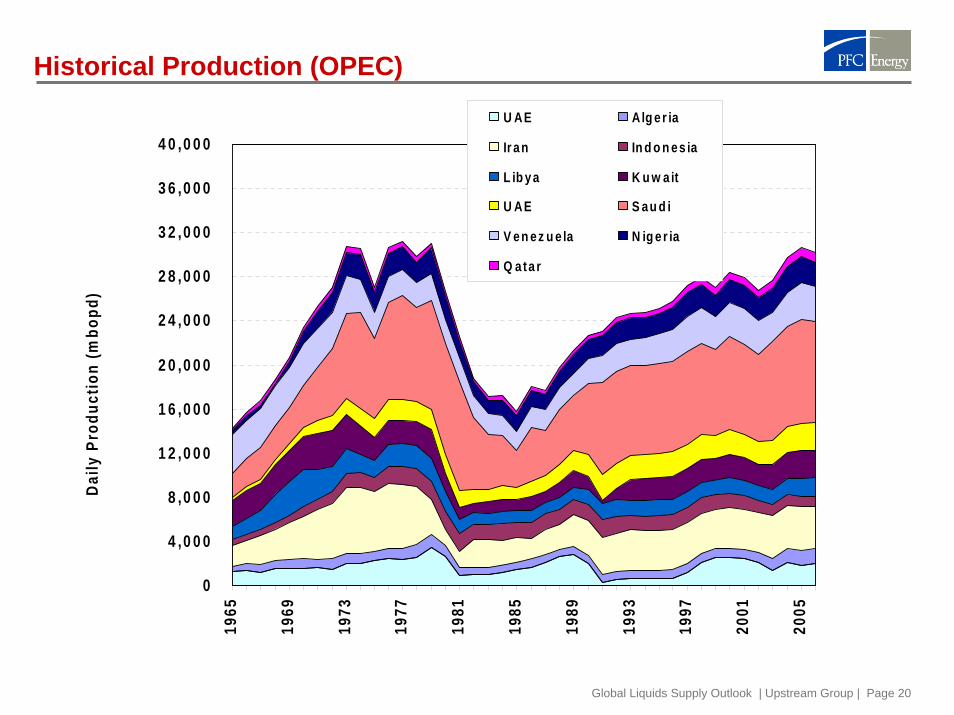
Historical Production (OPEC)
0
4 ,0 0 0
8 ,0 0 0
1 2 ,0 0 0
1 6 ,0 0 0
2 0 ,0 0 0
2 4 ,0 0 0
2 8 ,0 0 0
3 2 ,0 0 0
3 6 ,0 0 0
4 0 ,0 0 0
1965
1969
1973
1977
1981
1985
1989
1993
1997
2001
2005
Dai
ly P
rodu
ctio
n (m
bopd
)U AE Alg e r ia
Ir a n In d o n es ia
L ib y a K u w a it
U AE S au d i
V e n ez u e la N ig e r ia
Q ata r

Global Liquids Supply Outlook | Upstream Group | Page 21
OPEC Creaming Curve
C u m u la t iv e R e s e rv e s (m m b o )
0
2 0 0 ,0 0 0
4 0 0 ,0 0 0
6 0 0 ,0 0 0
8 0 0 ,0 0 0
1 ,0 0 0 ,0 0 0
1 ,2 0 0 ,0 0 0
1950
1954
1958
1962
1966
1970
1974
1978
1982
1986
1990
1994
1998
2002
2006
Cum
ulat
ive
Res
erve
s (m
mbo
)
Global Liquids Supply Outlook | Upstream Group | Page 22
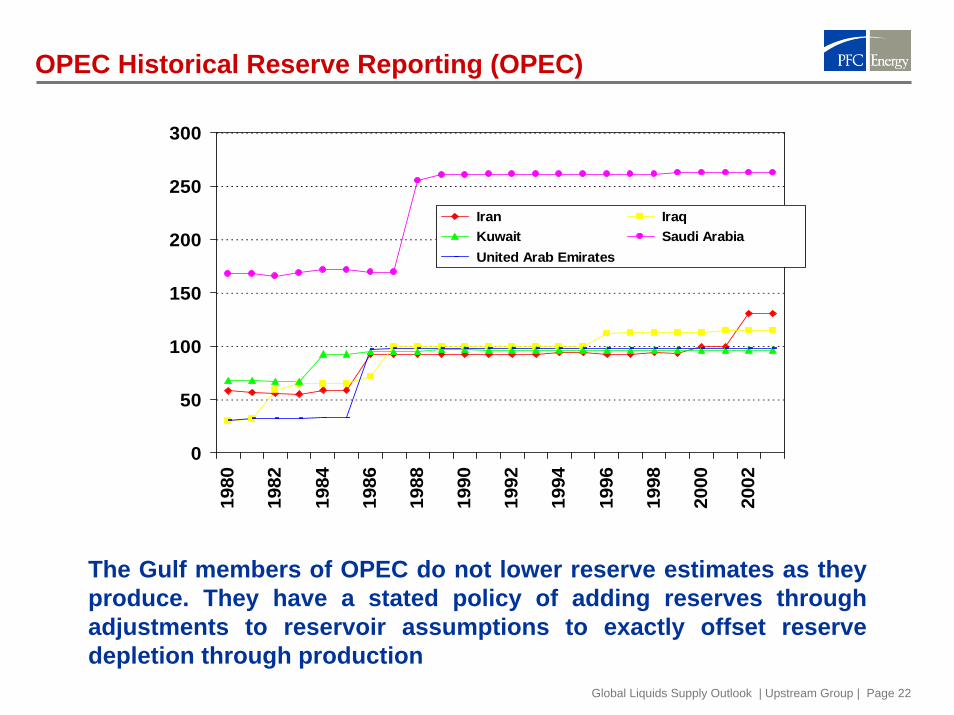
OPEC Historical Reserve Reporting (OPEC)
The Gulf members of OPEC do not lower reserve estimates as they produce. They have a stated policy of adding reserves through adjustments to reservoir assumptions to exactly offset reserve depletion through production
0
50
100
150
200
250
300
1980
1982
1984
1986
1988
1990
1992
1994
1996
1998
2000
2002
Iran Iraq Kuwait Saudi Arabia United Arab Emirates

Global Liquids Supply Outlook | Upstream Group | Page 23
OPEC Historical Annual Crude Production Balance (OPEC)
Like all other areas of the world, PFC Energy’s data analysis indicates that Global OPEC crude production is currently exceeding volumes discovered.
C h a r t T it le
-1 0 ,0 0 0
-8 ,0 0 0
-6 ,0 0 0
-4 ,0 0 0
-2 ,0 0 0
0
2 ,0 0 0
4 ,0 0 0
6 ,0 0 0
8 ,0 0 0
1 0 ,0 0 0
1965
1970
1975
1980
1985
1990
1995
2000
2005
Diff
eren
tial B
etw
een
Ann
ual V
olum
es P
rodu
ced
and
Ann
ual V
loum
es D
isco
vere
d (m
mbo
)
An n u a l R e s e r v e s D is c o v e r e d - An n u a l R e s e r v e s P r o d u c e d3 p e r . M o v . Av g . (An n u a l R e s e r v e s D is c o v e r e d - An n u a l R e s e r v e s P r o d u c e d )

Global Liquids Supply Outlook | Upstream Group | Page 24
Historical Saudi Reserve Additions
This is a creaming curve for Saudi. This is a view of reserve addition history over time based on the currently reported P1 and P2 reserves for all fields. For example, the fields discovered as of 1960 in aggregate had reserves of just over 200 billion barrels (as reserves are reported today).
0
3 5 ,0 0 0
7 0 ,0 0 0
1 0 5 ,0 0 0
1 4 0 ,0 0 0
1 7 5 ,0 0 0
2 1 0 ,0 0 0
2 4 5 ,0 0 0
2 8 0 ,0 0 0
3 1 5 ,0 0 0
3 5 0 ,0 0 0
1950
1955
1960
1965
1970
1975
1980
1985
1990
1995
2000
2005
Cum
ulat
ive
Res
erve
s (m
mbo
)
C u m u la t iv e R e s e rv e s
Global Liquids Supply Outlook | Upstream Group | Page 25
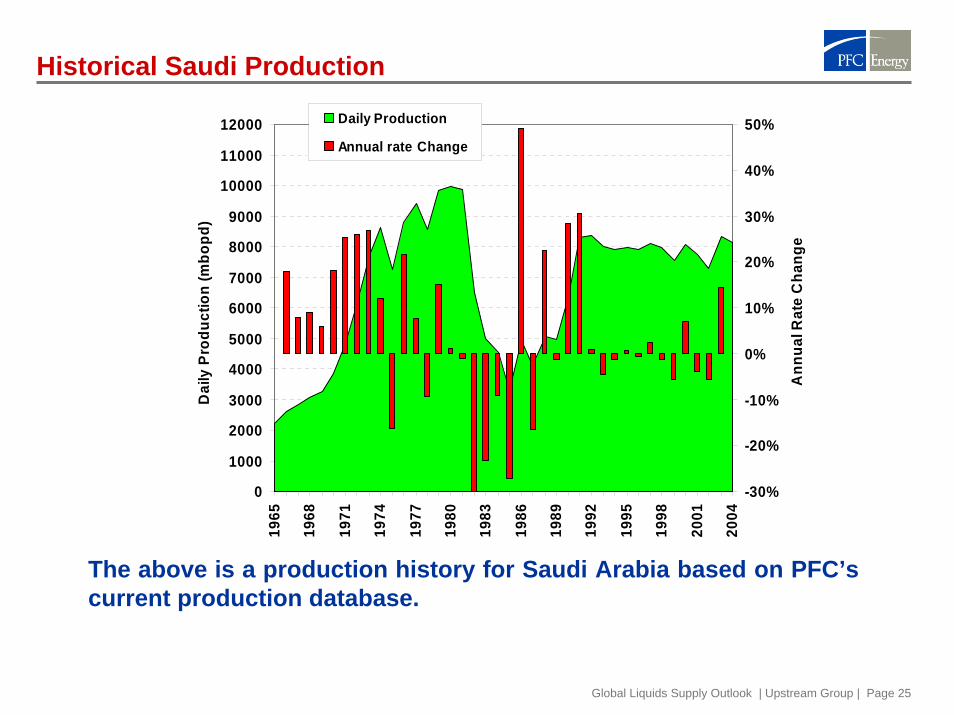
Historical Saudi Production
The above is a production history for Saudi Arabia based on PFC’s current production database.
0
1000
2000
3000
4000
5000
6000
7000
8000
9000
10000
11000
12000
1965
1968
1971
1974
1977
1980
1983
1986
1989
1992
1995
1998
2001
2004
Dai
ly P
rodu
ctio
n (m
bopd
)
-30%
-20%
-10%
0%
10%
20%
30%
40%
50%
Ann
ual R
ate
Cha
nge
Daily Production
Annual rate Change
Global Liquids Supply Outlook | Upstream Group | Page 26
0
5 0 ,0 0 0
1 0 0 ,0 0 0
1 5 0 ,0 0 0
2 0 0 ,0 0 0
2 5 0 ,0 0 0
3 0 0 ,0 0 0
3 5 0 ,0 0 0
1965
1970
1975
1980
1985
1990
1995
2000
2005
Res
erve
s (m
mbo
)
P r o d u ced R es er v e V o lu m e
R em ain in g R es er ve V o lu m e
O ffic ia l O P E C R em a in in g R es er v e
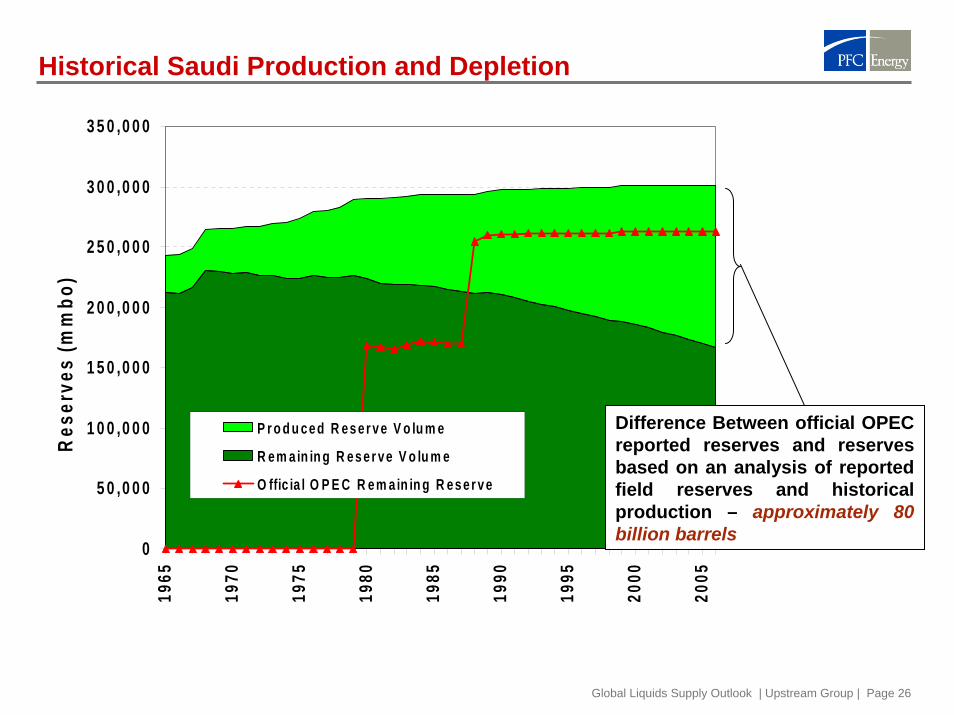
Historical Saudi Production and Depletion
Difference Between official OPEC reported reserves and reserves based on an analysis of reported field reserves and historical production – approximately 80 billion barrels

Global Liquids Supply Outlook | Upstream Group | Page 27
Historical Kuwaiti Production
The above is a production history for Kuwait based on PFC’s current production database.
0
4 0 0
8 0 0
1 ,2 0 0
1 ,6 0 0
2 ,0 0 0
2 ,4 0 0
2 ,8 0 0
3 ,2 0 0
3 ,6 0 0
4 ,0 0 0
1965
1970
1975
1980
1985
1990
1995
2000
2005
Dai
ly P
rodu
ctio
n (m
bopd
)
- 2 0 0 0
-1 6 0 0
-1 2 0 0
-8 0 0
-4 0 0
0
4 0 0
8 0 0
1 2 0 0
1 6 0 0
2 0 0 0
Prod
uctio
n - R
eser
ves
Add
ed
D a ily P ro d u c tio n C u m P ro d u c tio n /C u m R e s e rv e s

Global Liquids Supply Outlook | Upstream Group | Page 28
0
1 0 ,0 0 0
2 0 ,0 0 0
3 0 ,0 0 0
4 0 ,0 0 0
5 0 ,0 0 0
6 0 ,0 0 0
7 0 ,0 0 0
8 0 ,0 0 0
9 0 ,0 0 0
1 0 0 ,0 0 0
1 1 0 ,0 0 019
65
1970
1975
1980
1985
1990
1995
2000
2005
Res
erve
s (m
mbo
)
P r o d u c e d R e s e r ve s
R e m a in in g R e se r v e
O P E C R e p o r te d R e m a in in g R e s e r ve
Historical Kuwaiti Production and Depletion
Difference Between official OPEC reported reserves and reserves based on an analysis of reported field reserves and historical production – approximately 45 billion barrels

Global Liquids Supply Outlook | Upstream Group | Page 29
0 %1 0 %2 0 %3 0 %4 0 %5 0 %6 0 %7 0 %8 0 %9 0 %
1 0 0 %
Iraq
U AEA n g o laK uw ai t
L ib yaS a u d i
A lg e r iaN ig e r ia Ira
nV e n e z u e la Q a ta r
In d o n es iaR
eser
ve B
ase
Dep
letio
n (%
)
Historical Production and Depletion Levels (OPEC)
In Decline
Conventional Oil Production has been declining for several years calling into question currently
reported reserves
At or Near Plateau
OPEC as a whole is depleting but some countries are depleting faster than others

Global Liquids Supply Outlook | Upstream Group | Page 30
Historical Production and Depletion Levels (OPEC)
Based on our analysis OPEC as a whole has produced approximately 45 percent of all reserves discovered in OPEC to date. Understanding whether or not this is correct is critical in understanding what future world production capacity will be.
0
4 ,0 0 0
8 ,0 0 0
1 2 ,0 0 0
1 6 ,0 0 0
2 0 ,0 0 0
2 4 ,0 0 0
2 8 ,0 0 0
3 2 ,0 0 0
3 6 ,0 0 0
4 0 ,0 0 0
1965
1969
1973
1977
1981
1985
1989
1993
1997
2001
2005
Dai
ly P
rodu
ctio
n (m
bopd
)
0 %
1 0 %
2 0 %
3 0 %
4 0 %
5 0 %
6 0 %
7 0 %
8 0 %
9 0 %
1 0 0 %
Cum
Pro
d/C
um R
eser
ves
D a ily P r o d u c t io n
C u m P r o d u c t io n /C u m R e ser ve s

Global Liquids Supply Outlook | Upstream Group | Page 31
Unconstrained OPEC Production Will Peak Under 100 Million Barrels Per Day
The Growing Differential Between Non-OPEC Supply Capacity and
Global Demand
0
2 0 ,0 0 0
4 0 ,0 0 0
6 0 ,0 0 0
8 0 ,0 0 0
1 0 0 ,0 0 0
1 2 0 ,0 0 0
1995
2000
2005
2010
2015
2020
Dai
ly P
rodu
ctio
n (m
b/d)
0
2 0 ,0 0 0
4 0 ,0 0 0
6 0 ,0 0 0
8 0 ,0 0 0
1 0 0 ,0 0 0
1 2 0 ,0 0 0
N o n -O P E C C r u d e N o n -O P E C N G L & C o n d e n s a te
N o n -O P E C O il S a n d s O P E C N G L
O P E C C r u d e 1 .7 % G r o w th
2 .4 % G r o w th 1 .1 % G r o w th

Global Liquids Supply Outlook | Upstream Group | Page 32
1. In spite of high oil prices, Non-OPEC production growth has been very limited with the exception of the FSU. This trend is likely to continue through this decade.
2. Oil exploration in the last 10 years (with a few exceptions likeAngola, Sudan, Mauritania, Brazil) has been much less successfulthan in previous decades. Since 1990 reserve replacement in non-OPEC countries of most regions has been less that 35 percent.
3. Every year, in every region (including OPEC), the world producesmore oil than it finds. It is only logical to conclude that inevitably this will lead to dwindling supplies. Our current view is that absent significant improvements in recovery technologies, exploration results, or a sharp increase in exploration spending, global non-OPEC liquid hydrocarbon production rate will struggle to grow beyond 2010 and may in fact start to decline.
Given a continuation of recent trends in exploration results (field sizes, success rates, etc. and recovery factors):
Key Messages

Global Liquids Supply Outlook | Upstream Group | Page 33
4. Non-OPEC production growth between now and the end of this decade will rely heavily on production growth in Kazakhstan, Azerbaijan, Russia, Brazil, and several miscellaneous smaller producers. The real unknown here is to what degree production from these countries will fill and exceed the void left by production declines in other Non – OPEC countries.
5. If demand continues to grow beyond 2010 and if Non-OPEC production capacity plateaus or falls, OPEC will have to make up the difference resulting in an inevitable increase in dependency on OPEC sources.
Key Messages
Strategic Advisors in Global Energy
PFC Energy consultants are present in the following locations:
Bahrain
Beijing
Buenos Aires
Calgary
Houston
Kuala Lumpur
Lausanne
London
Mumbai
New York
Paris
San Francisco
Washington, D.C.
Main regional offices:
Asia
PFC Energy, Kuala LumpurLevel 27, UBN Tower #2110 Jalan P. Ramlee50250 Kuala Lumpur, MalaysiaTel (60 3) 2172-3400Fax (60 3) 2072-3599
North America
PFC Energy, Washington D.C.1300 Connecticut Avenue, N.W. Suite 800Washington, D.C. 20036, USATel (1 202) 872-1199 Fax (1 202) 872-1219
PFC Energy, Houston4545 Post Oak Place, Suite 312 Houston, Texas 77027-3110, USA Tel (1 713) 622-4447 Fax (1 713) 622-4448
Europe
PFC Energy, France19 rue du Général Foy75008 Paris, France Tel (33 1) 4770-2900Fax (33 1) 4770-5905
PFC Energy International, Lausanne19, Boulevard de la Forêt1009 Pully, Switzerland Tel (41 21) 721-1440Fax: (41 21) 721-1444
Middle East
PFC Energy, BahrainManama Center Entrance 4 - Office 705 Kingdom of BahrainTel (973) 1721-5106 Fax (973) 1721-5108
www.pfcenergy.com | [email protected] regional offices are shown in blue.
Global Liquids Supply Outlook | Upstream Group | Page 35
• For each country reserve additions (field by field) have been documented along with production history
• A decline is modeled for the producing base using current withdrawal rates and remaining reserve estimates for fields in the existing production base (an additional 15-20% volume has been added to the current estimates of P1+P2 to account for possible higher recoveries)
• All new discoveries with a development plan are documented and probabilistically modeled to add to the producing base
• All undeveloped discoveries without a development plan are modeled using country average peak rates, decline rates, development concepts, etc. and added to the producing base
• Probabilistic expected value models are built which assume that field sizes, success rates, etc. (documented since 1990) continue over the next two decades and production from these EVA models are modeled to be added to the producing base
Methodology