
Global Head of AXA Global L&S CEO for Northern, … · AXA Jacques de Vaucleroy Global Head of AXA...
23
AXA Jacques de Vaucleroy Global Head of AXA Global L&S CEO for Northern, Central and Eastern Europe region Member of the AXA Management Committee October 2, 2014 Bank of America Merrill Lynch Annual Banking & Insurance CEO Conference 2014
Transcript of Global Head of AXA Global L&S CEO for Northern, … · AXA Jacques de Vaucleroy Global Head of AXA...

AXA
Jacques de Vaucleroy Global Head of AXA Global L&S
CEO for Northern, Central and Eastern Europe region
Member of the AXA Management Committee
October 2, 2014
Bank of America Merrill Lynch
Annual Banking & Insurance CEO Conference 2014
2 – Bank of America Merrill Lynch Annual Banking & Insurance CEO Conference 2014 – October 2, 2014
Cautionary note concerning forward-looking statements
Certain statements contained herein are forward-looking statements including, but not
limited to, statements that are predictions of or indicate future events, trends, plans or
objectives. Undue reliance should not be placed on such statements because, by their
nature, they are subject to known and unknown risks and uncertainties. Please refer to the
section “Cautionary statements” in page 2 of AXA’s Document de Référence for the year
ended December 31, 2013, for a description of certain important factors, risks and
uncertainties that may affect AXA’s business. AXA undertakes no obligation to publicly
update or revise any of these forward-looking statements, whether to reflect new
information, future events or circumstances or otherwise.
3 – Bank of America Merrill Lynch Annual Banking & Insurance CEO Conference 2014 – October 2, 2014
Today’s key messages
1H14 achievements in line with consistent delivery on Ambition AXA
Performing well in a low interest rate environment
Focus on G/A Protection & Health business: growing and profitable

4 – Bank of America Merrill Lynch Annual Banking & Insurance CEO Conference 2014 – October 2, 2014
1H14 achievements in line with
consistent delivery on Ambition AXA
5 – Bank of America Merrill Lynch Annual Banking & Insurance CEO Conference 2014 – October 2, 2014
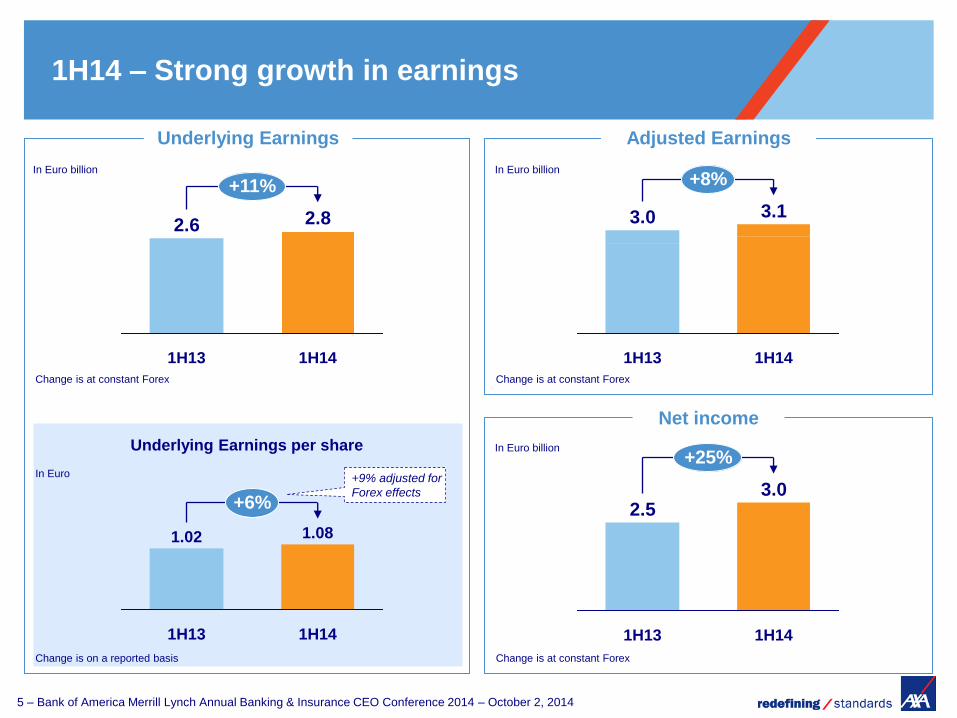
1H14 – Strong growth in earnings
Adjusted Earnings
In Euro billion
+11%
1H14
2.8
1H13
2.6
Change is at constant Forex
Underlying Earnings per share
+6%
1H14
1.08
1H13
1.02
+8%
1H14
3.1
1H13
3.0
Change is at constant Forex
+25%
1H14
3.0
1H13
2.5
Net income
Change is at constant Forex
Underlying Earnings
In Euro billion
+9% adjusted for
Forex effects
Change is on a reported basis
In Euro billion
In Euro
6 – Bank of America Merrill Lynch Annual Banking & Insurance CEO Conference 2014 – October 2, 2014
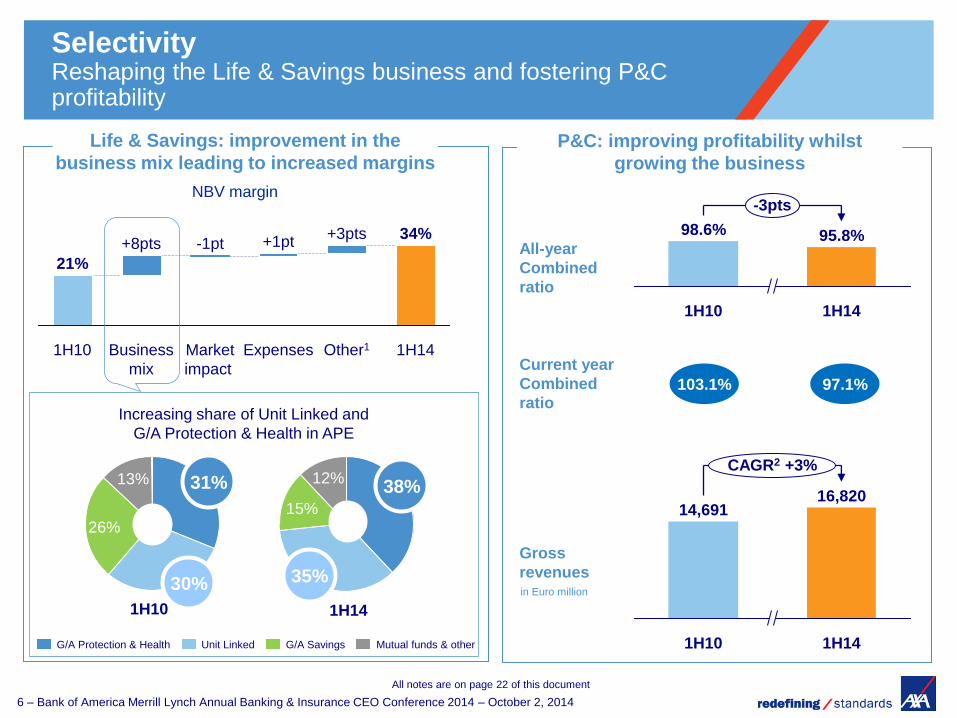
Selectivity Reshaping the Life & Savings business and fostering P&C profitability
CAGR2 +3%
1H14
16,820
1H10
14,691
in Euro million
Gross
revenues
Life & Savings: improvement in the
business mix leading to increased margins
P&C: improving profitability whilst
growing the business
Expenses
+1pt
Market
impact
-1pt
Business
mix
+8pts +3pts
Other1
34%
1H14
21%
1H10
NBV margin
Current year
Combined
ratio
98.6%
-3pts
1H14
95.8%
1H10
All-year
Combined
ratio
103.1% 97.1%
Increasing share of Unit Linked and
G/A Protection & Health in APE
13%
26%
12%
15%
1H10 1H14
G/A Savings Mutual funds & other Unit Linked G/A Protection & Health
38%
35%
31%
30%
All notes are on page 22 of this document

7 – Bank of America Merrill Lynch Annual Banking & Insurance CEO Conference 2014 – October 2, 2014
Contribution to
Group P&C
Acceleration Double-digit topline and earnings evolution in high growth markets
CAGR +23%
1H14
248
1H10
110 92
CAGR +26%
1H14
232
1H10
CAGR +12%
1H14
2,269
1H10
1,417
NBV Underlying Earnings
67
CAGR +17%
1H14
124
1H10
CAGR +15%
1H14
513
1H10
298
Revenues Underlying Earnings
In Euro million
APE
Focus on China P&C
AXA-Tian Ping1
Focus on China L&S
ICBC-AXA Life
Positive contribution to
Underlying Earnings in 1H14
Revenues Euro 0.9 billion at
1H141
1H13
39
+21%
1H14
46
APE In Euro million
Investing in brand, claims and
pricing capabilities leveraging
Group know-how
30% of premiums coming from
Direct channel in 1H14, up from
20% in 2012
+30%
1H14
364
1H13
291
Revenues In Euro million
10% 16% 10% 13% 7% 14% 8% 10% Contribution to
Group L&S
All notes are on page 22 of this document
In Euro million
Property & Casualty high growth markets
Life & Savings high growth markets
8 – Bank of America Merrill Lynch Annual Banking & Insurance CEO Conference 2014 – October 2, 2014
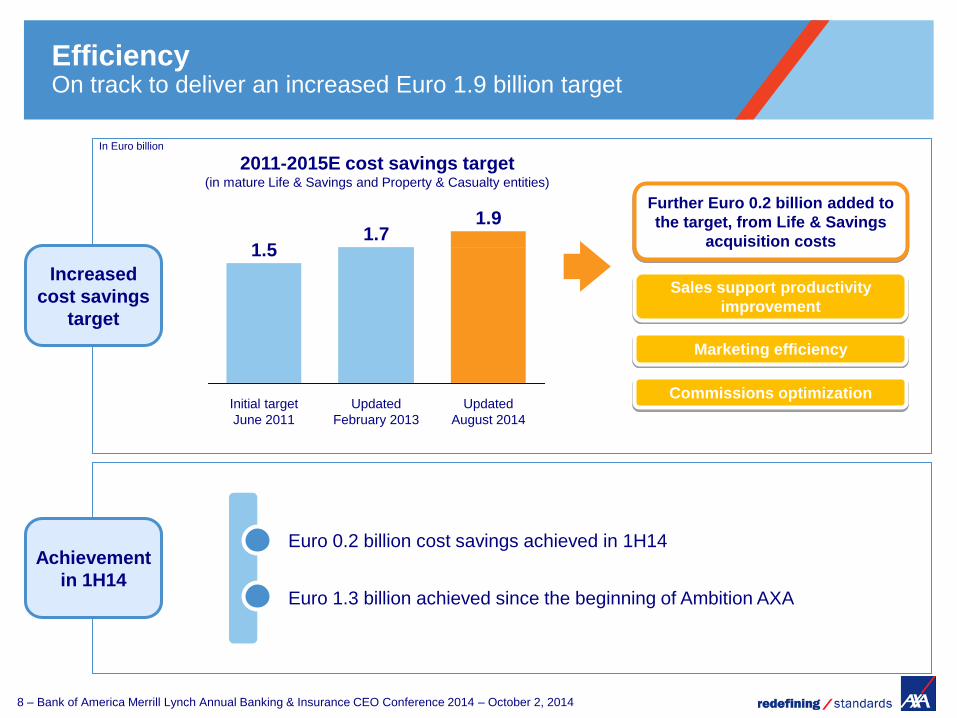
Updated
August 2014
1.9
Updated
February 2013
1.7
Initial target
June 2011
1.5
Increased
cost savings
target
Achievement
in 1H14
Efficiency On track to deliver an increased Euro 1.9 billion target
2011-2015E cost savings target (in mature Life & Savings and Property & Casualty entities)
In Euro billion
Further Euro 0.2 billion added to
the target, from Life & Savings
acquisition costs
Sales support productivity
improvement
Marketing efficiency
Commissions optimization
Euro 0.2 billion cost savings achieved in 1H14
Euro 1.3 billion achieved since the beginning of Ambition AXA
9 – Bank of America Merrill Lynch Annual Banking & Insurance CEO Conference 2014 – October 2, 2014
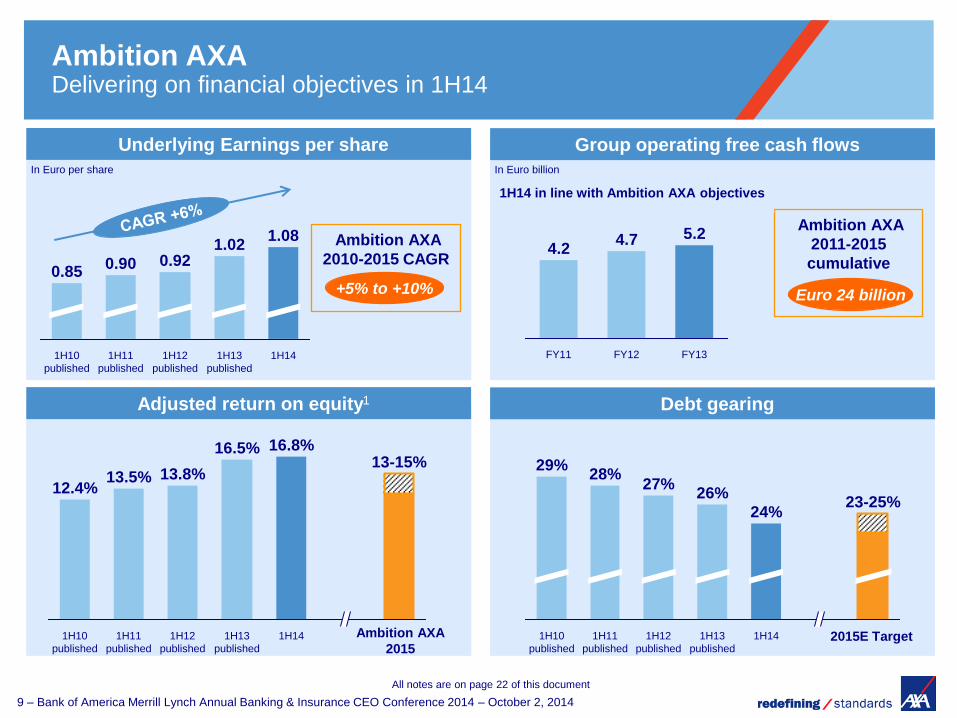
Adjusted return on equity1 Debt gearing
Underlying Earnings per share Group operating free cash flows
In Euro per share
Ambition AXA
2011-2015
cumulative
Euro 24 billion
Ambition AXA
2015
Ambition AXA
2010-2015 CAGR
+5% to +10%
1H14
1.08
1H13
published
1.02
1H12
published
0.92
1H11
published
0.90
1H10
published
0.85
23-25%
1H14
24%
1H13
published
26%
1H12
published
27%
1H11
published
28%
1H10
published
29% 13-15%
1H14
16.8%
1H13
published
16.5%
1H12
published
13.8%
1H11
published
13.5%
1H10
published
12.4%
2015E Target
FY13
5.2
FY12
4.7
FY11
4.2
1H14 in line with Ambition AXA objectives
In Euro billion
Ambition AXA Delivering on financial objectives in 1H14
All notes are on page 22 of this document
10 – Bank of America Merrill Lynch Annual Banking & Insurance CEO Conference 2014 – October 2, 2014
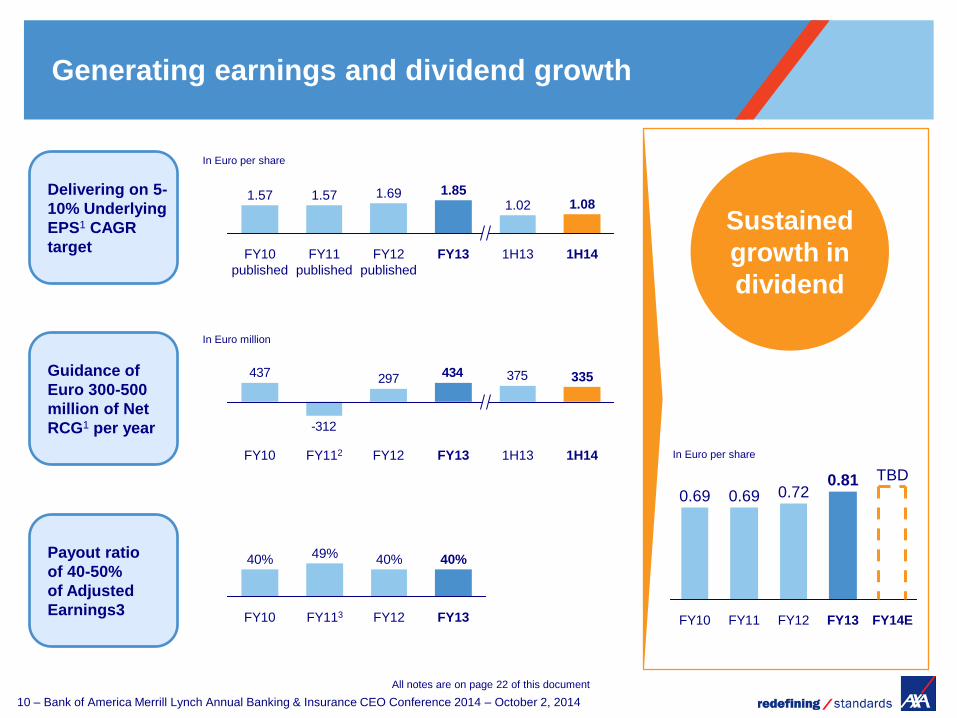
Guidance of
Euro 300-500
million of Net
RCG1 per year
Delivering on 5-
10% Underlying
EPS1 CAGR
target
Generating earnings and dividend growth
1.69
FY13 FY10
published
FY11
published
1.08 1.57
1H14
1.02
FY12
published
1.85
1H13
1.57
375297
-312
437 434
FY112 FY10
335
1H14 FY12 FY13 1H13
FY113
49% 40%
FY10 FY12 FY13
40% 40%
TBD
FY11
0.72
FY12
0.81
FY10 FY13
0.69
FY14E
0.69
Payout ratio
of 40-50%
of Adjusted
Earnings3
Sustained
growth in
dividend
In Euro per share
In Euro million
In Euro per share
All notes are on page 22 of this document
11 – Bank of America Merrill Lynch Annual Banking & Insurance CEO Conference 2014 – October 2, 2014
Performing well in a low interest rate
environment

12 – Bank of America Merrill Lynch Annual Banking & Insurance CEO Conference 2014 – October 2, 2014
Performing well in low interest rate environment (1/3)
Ca.
70% of Group pre-tax Underlying Earnings1 coming from
Property & Casualty and Protection & Health2, i.e.
businesses less sensitive to financial markets
Ca.
1 year
Duration gap maintained around one year
between assets and liabilities (which are mostly
long term in nature)
Well diversified
business mix reduces
earnings volatility
Strong ALM discipline
Decreased sensitivities
to low interest rate
environment
Note: FY13 Group Embedded Value sensitivity to a -100bps parallel shift in risk-free rates: -5%
Ca. Euro
-100 million
Estimated impact on Underlying Earnings3 should
interest rates be 100bps lower for 1 year
All notes are on page 22 of this document
13 – Bank of America Merrill Lynch Annual Banking & Insurance CEO Conference 2014 – October 2, 2014
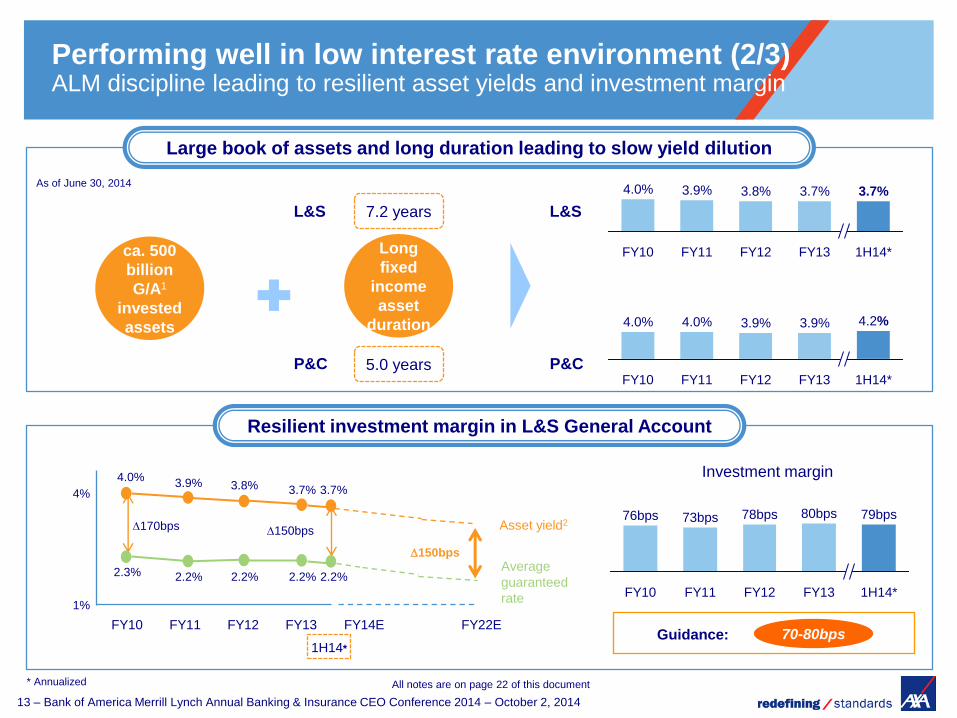
Large book of assets and long duration leading to slow yield dilution
Resilient investment margin in L&S General Account
1H14*
3.7%
FY13
3.7%
FY12
3.8%
FY11
3.9%
FY10
4.0%
1H14*
4.2%
FY13
3.9%
FY12
3.9%
FY11
4.0%
FY10
4.0%
Average
guaranteed
rate
Asset yield2 170bps 150bps
FY10 FY11 FY12 FY13
1H14*
FY14E FY22E
4.0% 3.9% 3.8% 3.7% 3.7%
2.2% 2.2% 2.2% 2.2% 2.3%
150bps
4%
1%
70-80bps Guidance:
FY13 1H14*
78bps
FY11 FY10
73bps 76bps 80bps 79bps
FY12
L&S 7.2 years
P&C 5.0 years
ca. 500
billion
G/A1
invested
assets
L&S
P&C
Long
fixed
income
asset
duration
Performing well in low interest rate environment (2/3) ALM discipline leading to resilient asset yields and investment margin
Investment margin
All notes are on page 22 of this document
As of June 30, 2014
* Annualized

14 – Bank of America Merrill Lynch Annual Banking & Insurance CEO Conference 2014 – October 2, 2014
Increasing contribution from P&H and growing top line in P&C
Strong technical profitability in Protection & Health and P&C
Performing well in low interest rate environment (3/3) Protection & Health and P&C contribute c. 70% to Group pre-tax underlying earnings
1H10 1H14 1H14
CAGR +3%
16,820 16,497
1H13
16,173
1H12 1H11
15,350
1H10
14,691
P&C Revenues Share of Protection & Health in Total L&S APE
Ambition
AXA 2015
1H14
96.0% 97.9% 97.6%
FY13
95.8% 96.6%
FY12 FY10 FY11
99.5% 94.0%
FY12 FY10
95.5%
1H141
95.5%
FY11
94.7%
FY13
94.5%
Combined ratio - Protection & Health
Profitable and consistently below 96%
Combined ratio - P&C
Strong improvement in line with Ambition AXA
38% 31%
In Euro million
All notes are on page 22 of this document
15 – Bank of America Merrill Lynch Annual Banking & Insurance CEO Conference 2014 – October 2, 2014
Focus on G/A Protection & Health:
growing and profitable

16 – Bank of America Merrill Lynch Annual Banking & Insurance CEO Conference 2014 – October 2, 2014
Population ageing
and growth
CAGR +11%
FY13
2.5
FY10
1.8
APE (in Euro billion)
APE NBV
Protection & Health as a % of Total L&S Data as of FY13
Protection & Health business
Strong volume and profitability growth An important contributor to L&S result
Further growth potential due to market dynamics
NBV margin
Medical cost
inflation Economic growth
Withdrawal of
states
FY13
47%
+12pts
59%
FY10
39% 67% 55%
Pre-tax Underlying
Earnings
17 – Bank of America Merrill Lynch Annual Banking & Insurance CEO Conference 2014 – October 2, 2014
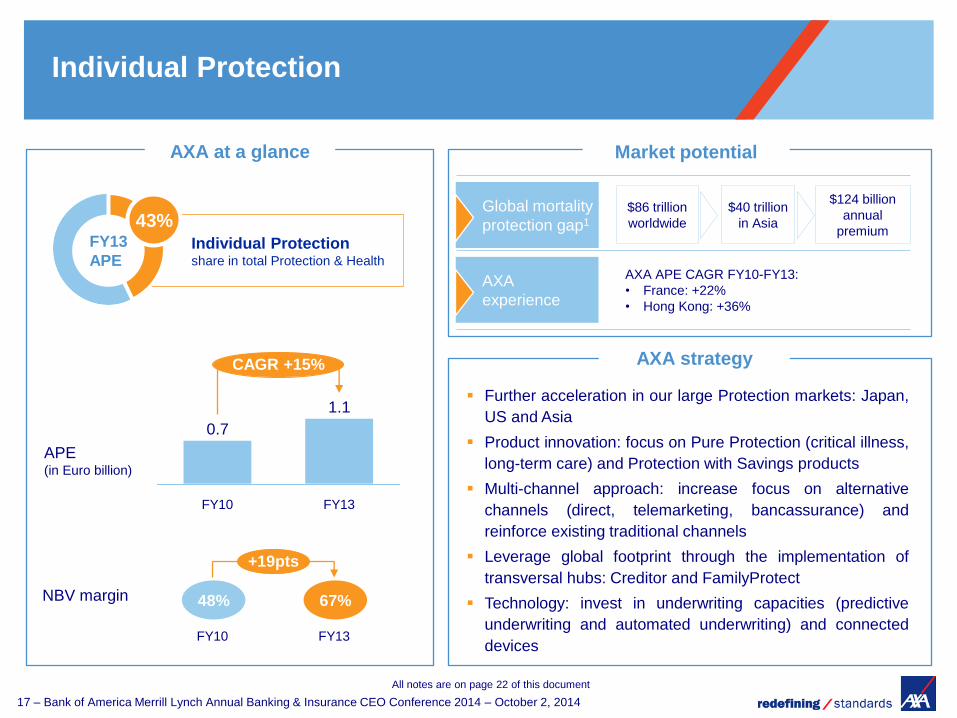
Individual Protection share in total Protection & Health
Individual Protection
AXA at a glance
FY10
0.7
FY13
1.1
CAGR +15%
APE (in Euro billion)
NBV margin
Further acceleration in our large Protection markets: Japan,
US and Asia
Product innovation: focus on Pure Protection (critical illness,
long-term care) and Protection with Savings products
Multi-channel approach: increase focus on alternative
channels (direct, telemarketing, bancassurance) and
reinforce existing traditional channels
Leverage global footprint through the implementation of
transversal hubs: Creditor and FamilyProtect
Technology: invest in underwriting capacities (predictive
underwriting and automated underwriting) and connected
devices
AXA
experience
AXA strategy
Market potential
43% FY13
APE
FY10
1.1
+19pts
1.1
FY13
48% 67%
AXA APE CAGR FY10-FY13:
• France: +22%
• Hong Kong: +36%
Global mortality
protection gap1
$86 trillion
worldwide
$40 trillion
in Asia
$124 billion
annual
premium
All notes are on page 22 of this document

18 – Bank of America Merrill Lynch Annual Banking & Insurance CEO Conference 2014 – October 2, 2014
• Wealth increase and consumerization
• Innovation and specialization
• Changes in demographic and lifestyle
• Withdrawal of states
Individual Health share in total Protection & Health
Individual Health
AXA at a glance
CAGR +10%
FY13
0.5
FY10
0.4
APE (in Euro billion)
NBV margin
Further leverage market leading position as #1 global multi-
line Health insurer (ex-US)
Further develop in six stronghold markets: France,
Germany, UK2, Japan, Hong Kong, Mexico
Increase the number of stronghold markets by 2020 with an
additional focus on high growth markets: Gulf, Malaysia,
Thailand, Indonesia and China
In high growth markets, focus on affluent and high net worth
segments
Extend health insurance towards health services and well
being management leveraging internal capacities (e.g. AXA
Assistance) and focus on digitalization
AXA strategy
Market potential
21% FY13
APE
+19pts
FY13
1.1
FY10
1.1 73% 92%
• Global health spending growth 2.6% in 2013
accelerating to 5.3% (CAGR FY14-FY17)1
Market
dynamics
Market growth
All notes are on page 22 of this document

19 – Bank of America Merrill Lynch Annual Banking & Insurance CEO Conference 2014 – October 2, 2014
Group Protection & Health share in total Protection & Health
Group Protection & Health
AXA at a glance
CAGR +8%
FY13
0.9
FY10
0.7
APE (in Euro billion)
NBV margin
Enhance growth in our stronghold markets: France,
Switzerland and Belgium
Leverage expertise from AXA France and AXA Switzerland
to increase focus in mature markets (US, Germany, Italy
and Spain) and high growth markets
Reinforce efficiency and focus on growth in Asia (Indonesia,
Hong Kong, Thailand, Singapore)
Create an aligned, global compliant offer for expats
including a worldwide network of providers and innovative
assistance services
Become Top 3 provider of employee benefits solutions for
Multi-National Companies (MAXIS)
AXA strategy
Market potential
36% FY13
APE
-1pt
FY13
1.1
FY10
1.1 33% 32%
Group P&H premiums CAGR1 (FY13-FY20)
• >3% Domestic Mature markets
• +12% Domestic High growth markets
Expat market premiums CAGR2 (FY11-FY17):
+11%
Worldwide
Group P&H
Market
All notes are on page 22 of this document

20 – Bank of America Merrill Lynch Annual Banking & Insurance CEO Conference 2014 – October 2, 2014
Today’s key messages
1H14 achievements in line with consistent delivery on Ambition AXA
Performing well in a low interest rate environment
Focus on G/A Protection & Health business: growing and profitable

21 – Bank of America Merrill Lynch Annual Banking & Insurance CEO Conference 2014 – October 2, 2014
Q&A session
Q&A session

22 – Bank of America Merrill Lynch Annual Banking & Insurance CEO Conference 2014 – October 2, 2014
All year over year comments are on comparable basis for activity indicators (constant Forex, scope and methodology), and at constant Forex for
earnings, except for EPS and CAGR growth which is on reported basis; new business margin growth from 2010 to 2014 is on reported basis too.
Page 6
1. Other includes scope, country mix, Forex impact, actuarial and modelling assumption changes
2. CAGR: Compound annual growth rate
Page 7
1. AXA-Tian Ping and ICBC-AXA Life are not included in Group revenues due to consolidation under equity method. Figures shown on the graph
correspond to the period of January 1 to June 30 and are at 100% share. Acquisition of 50% of Tian Ping was completed on February 20, 2014
Page 9
1. Underlying EPS: Underlying Earnings per share; Net RCG: Net realized capital gains
2. Greek government bond impairment
3. Net of undated debt interest charges
Page 10
1. Adjusted ROE: Return corresponds to adjusted earnings net of interest charges on undated debt. Equity corresponds to average shareholders’
equity excluding undated debt and reserves related to change in fair value
Page 12
1. Excluding holdings
2. Includes G/A Protection & Health, Property & Casualty and International Insurance
3. Estimated impact on Underlying Earnings from General Account only (G/A Savings, G/A Protection & Health and Property & Casualty)
Page 13
1. General Account 1H14 Invested assets referenced in page 57 of the financial supplement are Euro 696 billion, which include notably Euro 167
billion of Unit-linked assets and Euro 37 billion related to the banking sector
2. Projections assuming an average 2.9% Fixed Income reinvestment rate over next 9 years
Notes (1/2)

23 – Bank of America Merrill Lynch Annual Banking & Insurance CEO Conference 2014 – October 2, 2014
Page 14
1. P&H combined ratio calculation was adjusted to exclude Underlying Earnings from associates
Page 17
1. Source: Swiss Re, sigma 6/2013 “Life insurance: focusing on consumer”, “Mortality and Morbidity gaps, aging society and Implications on product
development”, 2012. Mortality protection gap is defined as the additional resources required to maintain the current living standard of dependents
(spouse, children, other) after the death of the family breadwinner. A premium rate of 0.3% as estimated by Swiss Re is used to arrive from
protection gap in Asia to estimated potential annual premiums.
Page 18
1. Source: Deloitte “2014 Global health care outlook”
2. AXA UK PPP business not included in L&S scope but in P&C
Page 19
1. Source: McKinsey Global 2013
2. Source: Roland Berger analysis 2013
Notes (2/2)


![(Axa wf global strategic bonds germany sept 2013 [kompatibilitätsmodus])](https://static.fdocuments.in/doc/165x107/5472a6ebb4af9fbe0a8b50df/axa-wf-global-strategic-bonds-germany-sept-2013-kompatibilitaetsmodus.jpg)


![Axa Magnet - Presentasi AXA Magnet [ Maestro Global Network ] Terbaru](https://static.fdocuments.in/doc/165x107/55d2ed27bb61ebdd398b462f/axa-magnet-presentasi-axa-magnet-maestro-global-network-terbaru.jpg)