
Bank of America Merrill Lynch 21st Annual Financials CEO ... · AXA Thomas Buberl – Chief...
22
AXA Thomas Buberl – Chief Executive Officer Bank of America Merrill Lynch 21st Annual Financials CEO Conference | London September 29, 2016
-
Upload
nguyentuong -
Category
Documents
-
view
219 -
download
2
Transcript of Bank of America Merrill Lynch 21st Annual Financials CEO ... · AXA Thomas Buberl – Chief...
AXA
Thomas Buberl – Chief Executive Officer
Bank of America Merrill Lynch
21st Annual Financials CEO Conference | London
September 29, 2016

Certain statements contained herein are forward-looking statements including, but not limited to,
statements that are predictions of or indicate future events, trends, plans or objectives. Undue reliance
should not be placed on such statements because, by their nature, they are subject to known and
unknown risks and uncertainties. Please refer to the section “Cautionary statements” in page 2 of AXA’s
Document de Référence for the year ended December 31, 2015, for a description of certain important
factors, risks and uncertainties that may affect AXA’s business. AXA undertakes no obligation to publicly
update or revise any of these forward-looking statements, whether to reflect new information, future events
or circumstances or otherwise.
3 | AXA | BofAML 21st Annual Financials CEO Conference | London | September 29, 2016
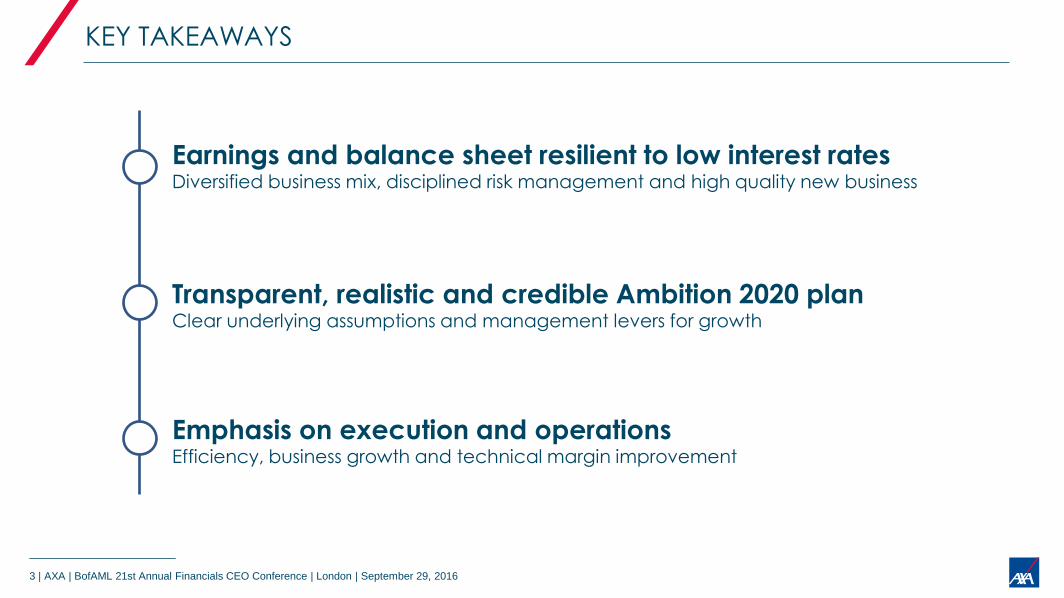
KEY TAKEAWAYS
Transparent, realistic and credible Ambition 2020 plan Clear underlying assumptions and management levers for growth
Emphasis on execution and operations Efficiency, business growth and technical margin improvement
Earnings and balance sheet resilient to low interest rates Diversified business mix, disciplined risk management and high quality new business
4 | AXA | BofAML 21st Annual Financials CEO Conference | London | September 29, 2016
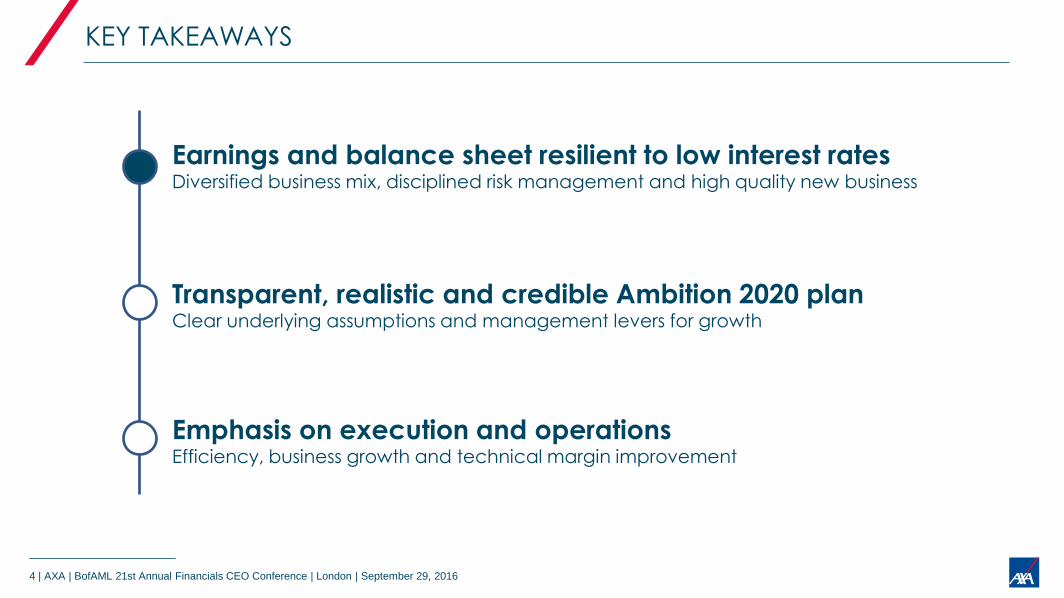
KEY TAKEAWAYS
Transparent, realistic and credible Ambition 2020 plan Clear underlying assumptions and management levers for growth
Emphasis on execution and operations Efficiency, business growth and technical margin improvement
Earnings and balance sheet resilient to low interest rates Diversified business mix, disciplined risk management and high quality new business
5 | AXA | BofAML 21st Annual Financials CEO Conference | London | September 29, 2016
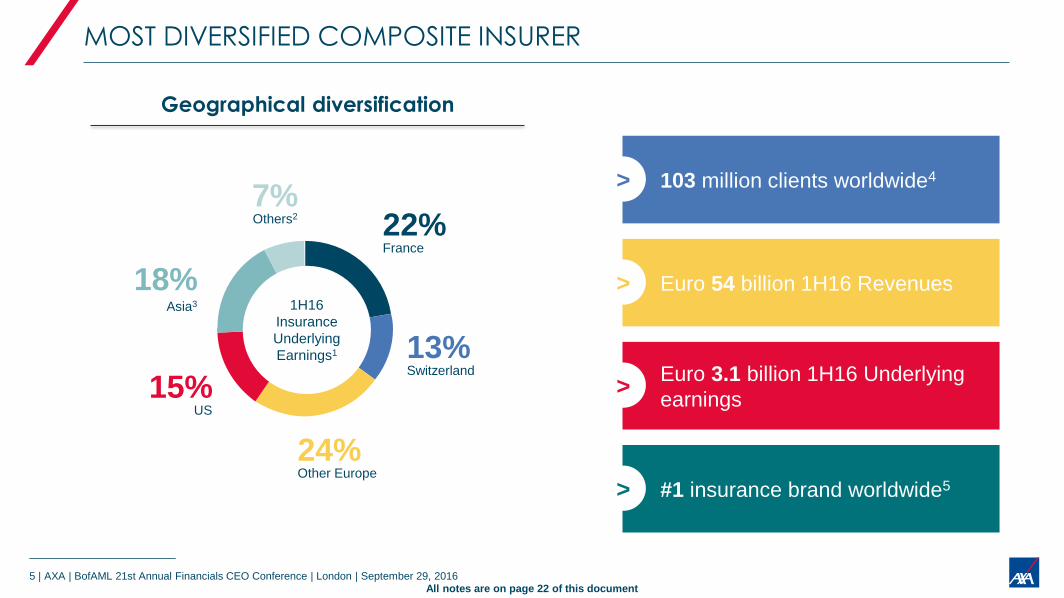
MOST DIVERSIFIED COMPOSITE INSURER
Geographical diversification
22% France
15% US
18% Asia3
7% Others2
All notes are on page 22 of this document
103 million clients worldwide4 >
Euro 54 billion 1H16 Revenues >
Euro 3.1 billion 1H16 Underlying
earnings >
#1 insurance brand worldwide5 >
1H16
Insurance
Underlying
Earnings1 13% Switzerland
24% Other Europe
6 | AXA | BofAML 21st Annual Financials CEO Conference | London | September 29, 2016
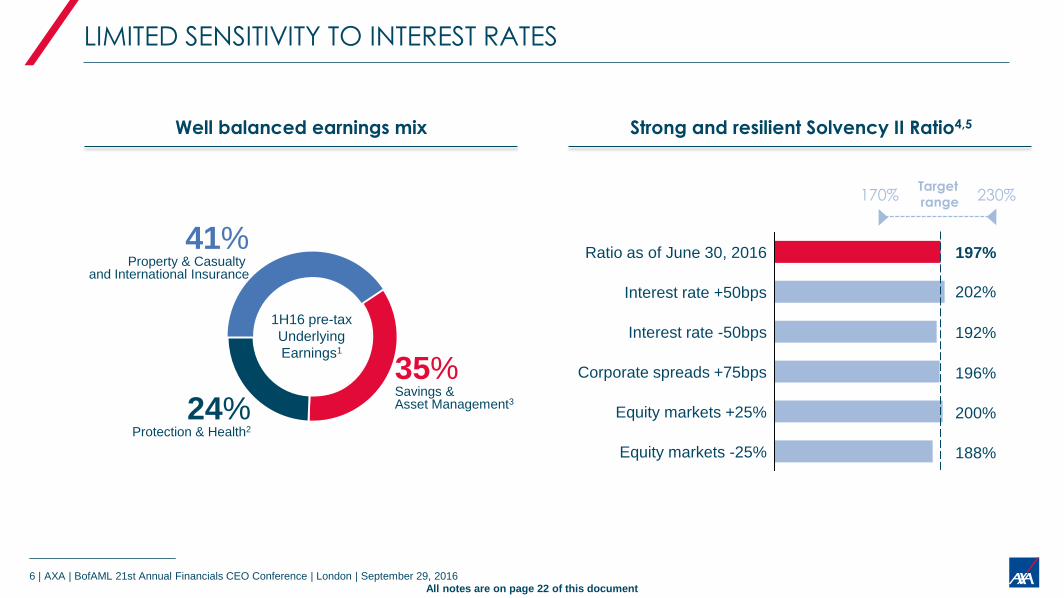
LIMITED SENSITIVITY TO INTEREST RATES
Well balanced earnings mix
1H16 pre-tax
Underlying
Earnings1
35% Savings & Asset Management3 24%
Protection & Health2
41% Property & Casualty
and International Insurance
Strong and resilient Solvency II Ratio4,5
Equity markets -25%
Equity markets +25%
Interest rate +50bps
Corporate spreads +75bps
Ratio as of June 30, 2016
Interest rate -50bps
197%
202%
192%
196%
200%
188%
170% Target
range 230%
All notes are on page 22 of this document
7 | AXA | BofAML 21st Annual Financials CEO Conference | London | September 29, 2016
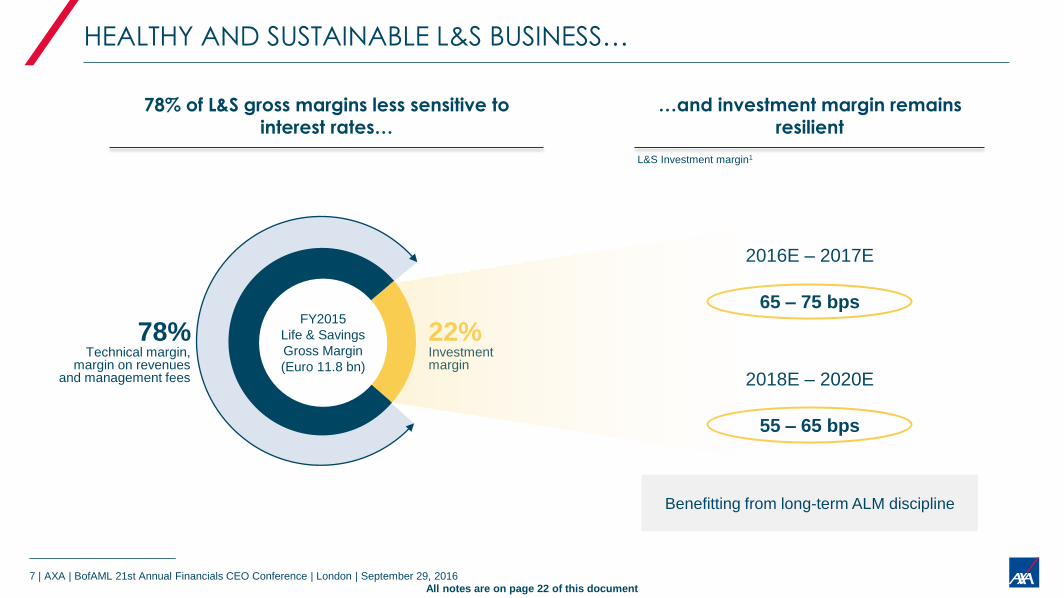
HEALTHY AND SUSTAINABLE L&S BUSINESS…
78% of L&S gross margins less sensitive to interest rates…
55 – 65 bps
65 – 75 bps
2016E – 2017E
2018E – 2020E
…and investment margin remains resilient
L&S Investment margin1
22% Investment margin
78% Technical margin,
margin on revenues and management fees
FY2015
Life & Savings
Gross Margin
(Euro 11.8 bn)
All notes are on page 22 of this document
Benefitting from long-term ALM discipline
8 | AXA | BofAML 21st Annual Financials CEO Conference | London | September 29, 2016
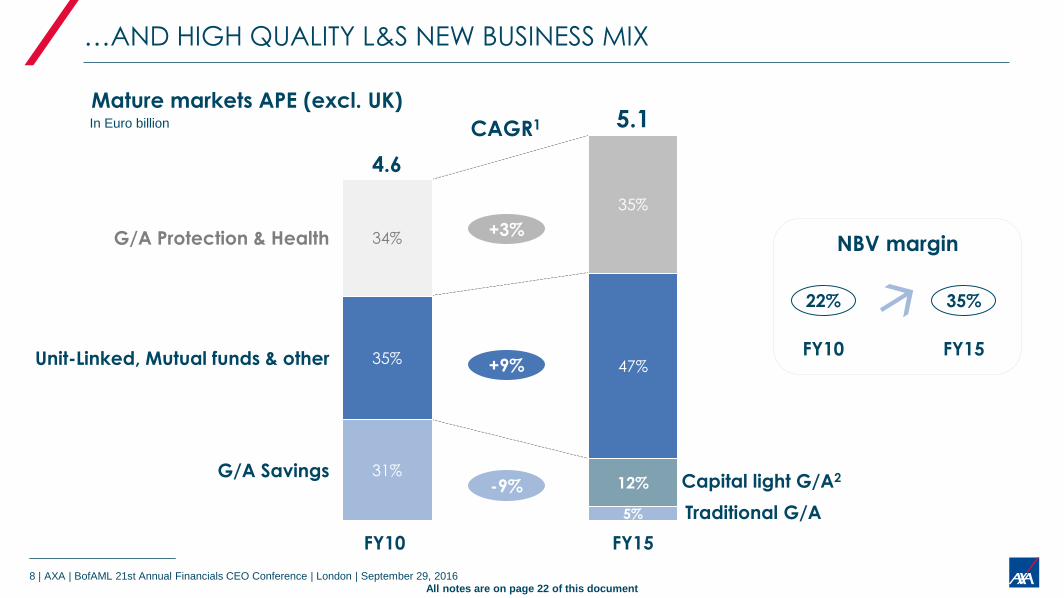
…AND HIGH QUALITY L&S NEW BUSINESS MIX
G/A Savings
Unit-Linked, Mutual funds & other
G/A Protection & Health
FY15
5.1
47%
5%
12% 31%
35%
FY10
4.6
35%
34%
In Euro billion
Mature markets APE (excl. UK)
NBV margin
22%
+3%
+9%
-9%
35%
Capital light G/A2
Traditional G/A
FY10 FY15
CAGR1
All notes are on page 22 of this document
9 | AXA | BofAML 21st Annual Financials CEO Conference | London | September 29, 2016
KEY TAKEAWAYS
Transparent, realistic and credible Ambition 2020 plan Clear underlying assumptions and management levers for growth
Emphasis on execution and operations Efficiency, business growth and technical margin improvement
Earnings and balance sheet resilient to low interest rates Diversified business mix, disciplined risk management and high quality new business
10 | AXA | BofAML 21st Annual Financials CEO Conference | London | September 29, 2016
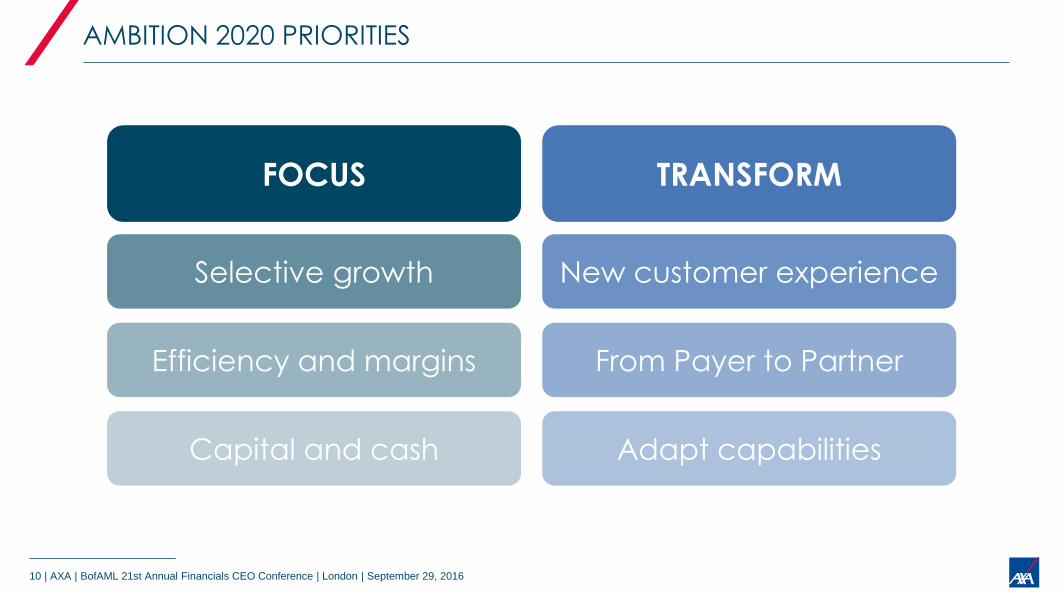
AMBITION 2020 PRIORITIES
New customer experience
From Payer to Partner
Adapt capabilities
FOCUS
Selective growth
Efficiency and margins
Capital and cash
TRANSFORM
11 | AXA | BofAML 21st Annual Financials CEO Conference | London | September 29, 2016
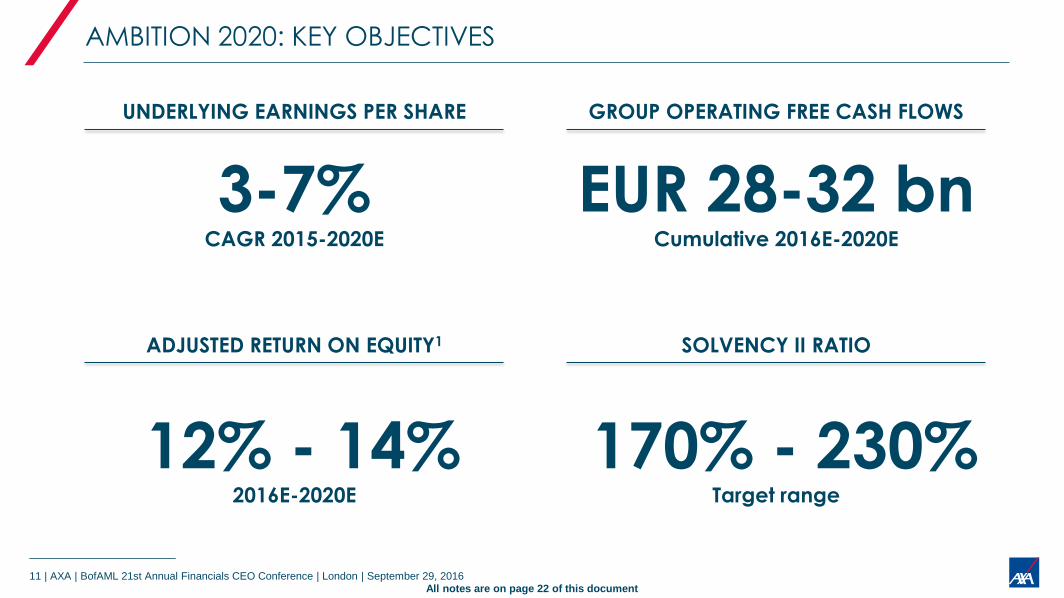
UNDERLYING EARNINGS PER SHARE
AMBITION 2020: KEY OBJECTIVES
EUR 28-32 bn Cumulative 2016E-2020E
GROUP OPERATING FREE CASH FLOWS
ADJUSTED RETURN ON EQUITY1
SOLVENCY II RATIO
170% - 230% Target range
12% - 14% 2016E-2020E
3-7% CAGR 2015-2020E
All notes are on page 22 of this document
12 | AXA | BofAML 21st Annual Financials CEO Conference | London | September 29, 2016
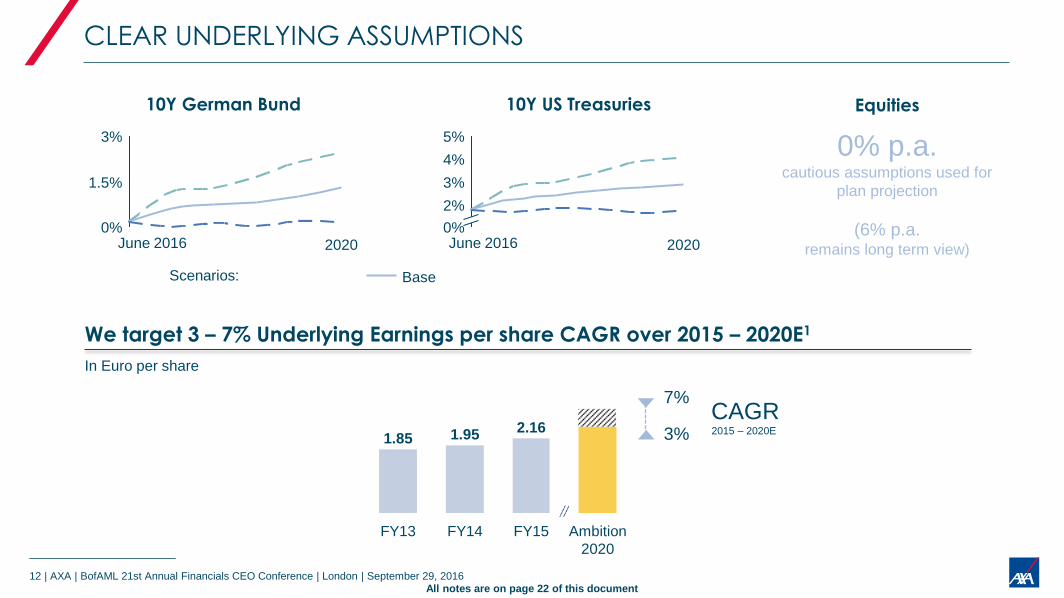
CLEAR UNDERLYING ASSUMPTIONS
FY14
2.16
FY15 Ambition
2020
1.95
FY13
1.85
We target 3 – 7% Underlying Earnings per share CAGR over 2015 – 2020E1
In Euro per share
3% CAGR 2015 – 2020E
1.5%
3%
0% 2020
0% p.a. cautious assumptions used for
plan projection
(6% p.a.
remains long term view)
0%
3%
2%
5%
4%
2020
10Y German Bund Equities 10Y US Treasuries
Unfavourable Base Favourable
June 2016 June 2016
Scenarios:
7%
All notes are on page 22 of this document

13 | AXA | BofAML 21st Annual Financials CEO Conference | London | September 29, 2016
EARNINGS GROWTH DESPITE INTEREST RATE HEADWINDS
2%
Technical
margin
M&A
1%
Growth
2%
Efficiency
3%
-5% ; -1%
3% - 7%
2015 –
2020E
UEPS
CAGR
Under management control
8% UEPS CAGR
+ =
Interest
rates
headwinds
Uncertainties
-5 to -1% UEPS CAGR
Ambition 2020
+3% to +7% CAGR
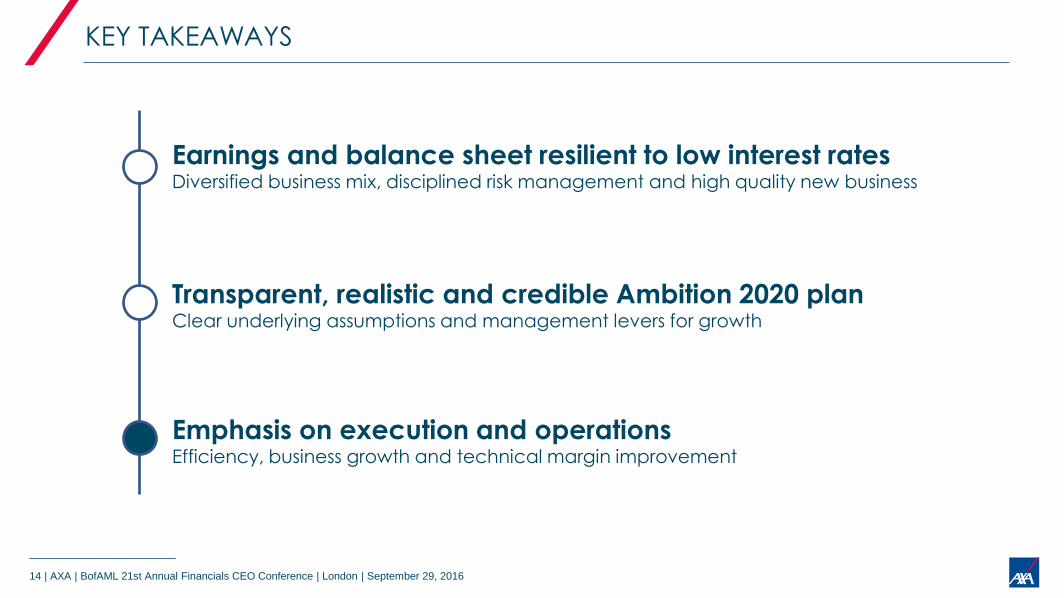
14 | AXA | BofAML 21st Annual Financials CEO Conference | London | September 29, 2016
KEY TAKEAWAYS
Transparent, realistic and credible Ambition 2020 plan Clear underlying assumptions and management levers for growth
Emphasis on execution and operations Efficiency, business growth and technical margin improvement
Earnings and balance sheet resilient to low interest rates Diversified business mix, disciplined risk management and high quality new business
15 | AXA | BofAML 21st Annual Financials CEO Conference | London | September 29, 2016
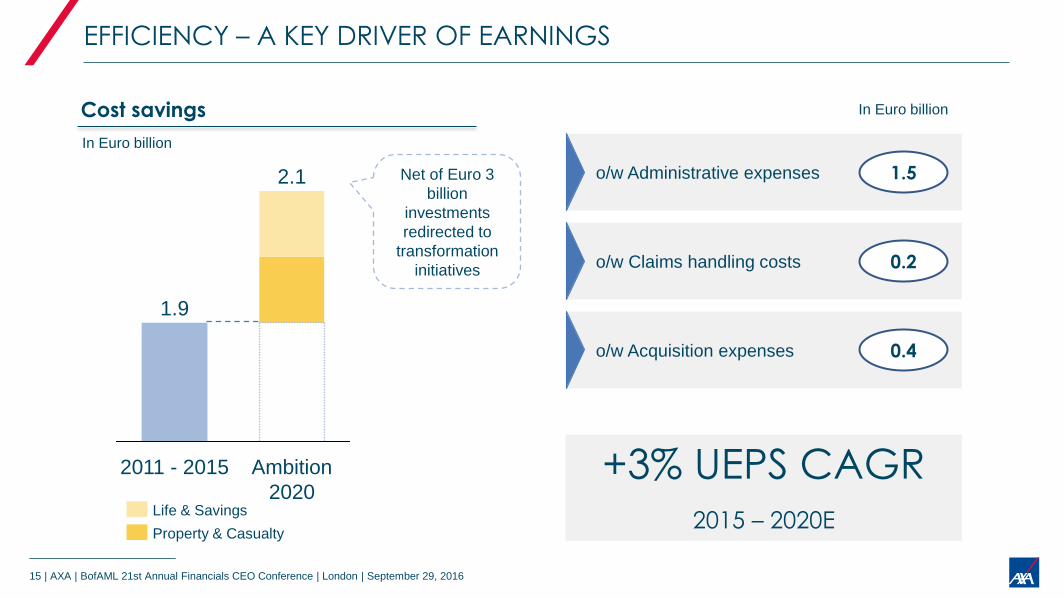
EFFICIENCY – A KEY DRIVER OF EARNINGS
In Euro billion
Cost savings
1.9
2.1
2011 - 2015 Ambition
2020 Life & Savings
Property & Casualty
o/w Administrative expenses
o/w Claims handling costs
o/w Acquisition expenses
+3% UEPS CAGR
2015 – 2020E
Net of Euro 3
billion
investments
redirected to
transformation
initiatives
1.5
0.2
0.4
In Euro billion
16 | AXA | BofAML 21st Annual Financials CEO Conference | London | September 29, 2016
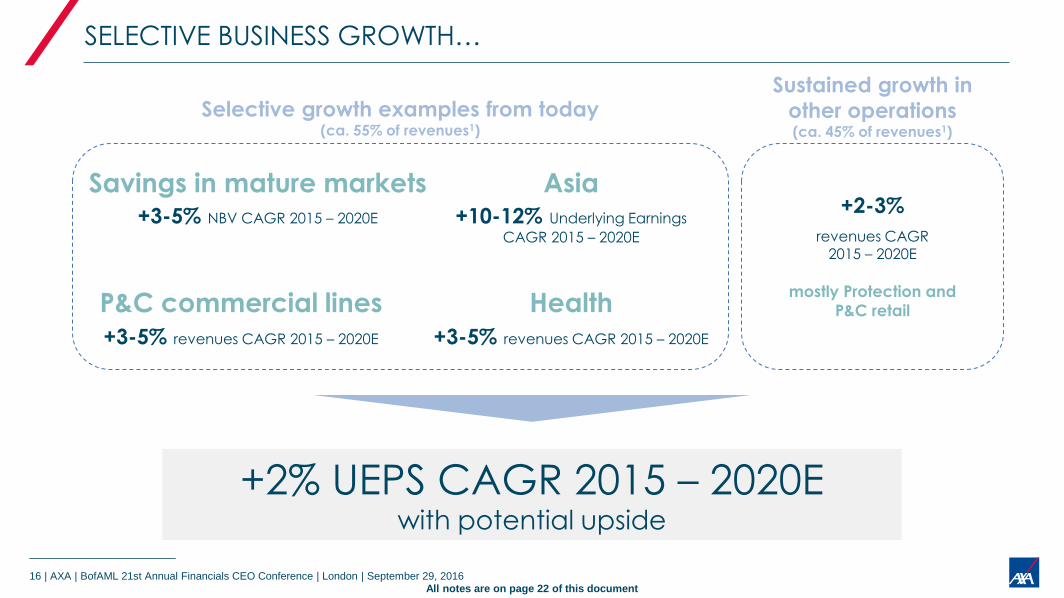
+2% UEPS CAGR 2015 – 2020E with potential upside
SELECTIVE BUSINESS GROWTH…
Selective growth examples from today (ca. 55% of revenues1)
Sustained growth in
other operations (ca. 45% of revenues1)
+2-3%
revenues CAGR 2015 – 2020E
Savings in mature markets Asia +3-5% NBV CAGR 2015 – 2020E
P&C commercial lines
+3-5% revenues CAGR 2015 – 2020E
Health
+3-5% revenues CAGR 2015 – 2020E
+10-12% Underlying Earnings
CAGR 2015 – 2020E
mostly Protection and
P&C retail
All notes are on page 22 of this document
17 | AXA | BofAML 21st Annual Financials CEO Conference | London | September 29, 2016
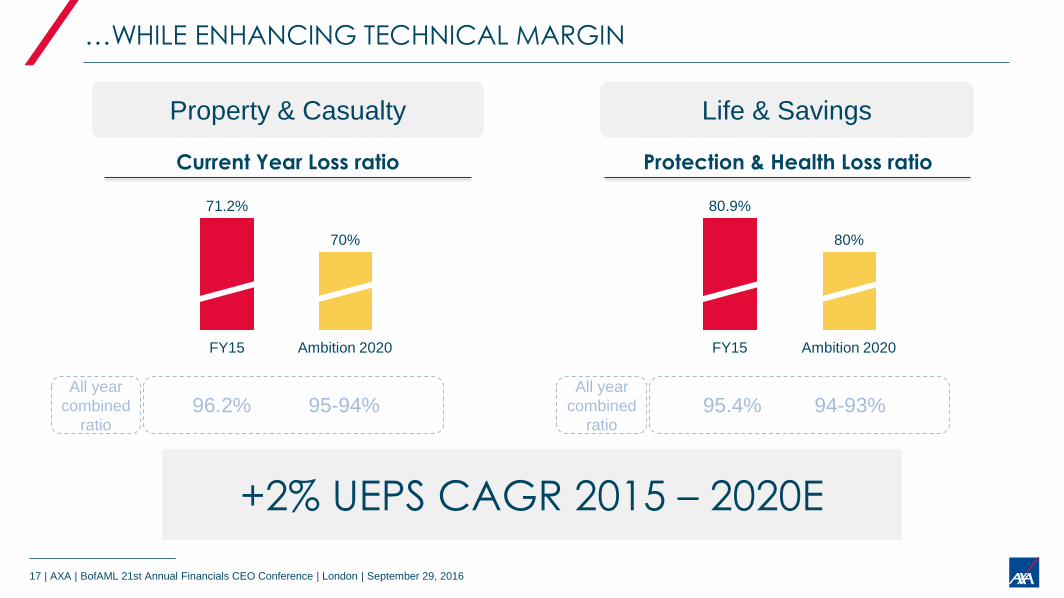
…WHILE ENHANCING TECHNICAL MARGIN
Ambition 2020
70%
FY15
71.2%
Current Year Loss ratio
Property & Casualty Life & Savings
Protection & Health Loss ratio
Ambition 2020
80%
FY15
80.9%
+2% UEPS CAGR 2015 – 2020E
96.2% 95-94% 95.4% 94-93% All year
combined
ratio
All year
combined
ratio
18 | AXA | BofAML 21st Annual Financials CEO Conference | London | September 29, 2016
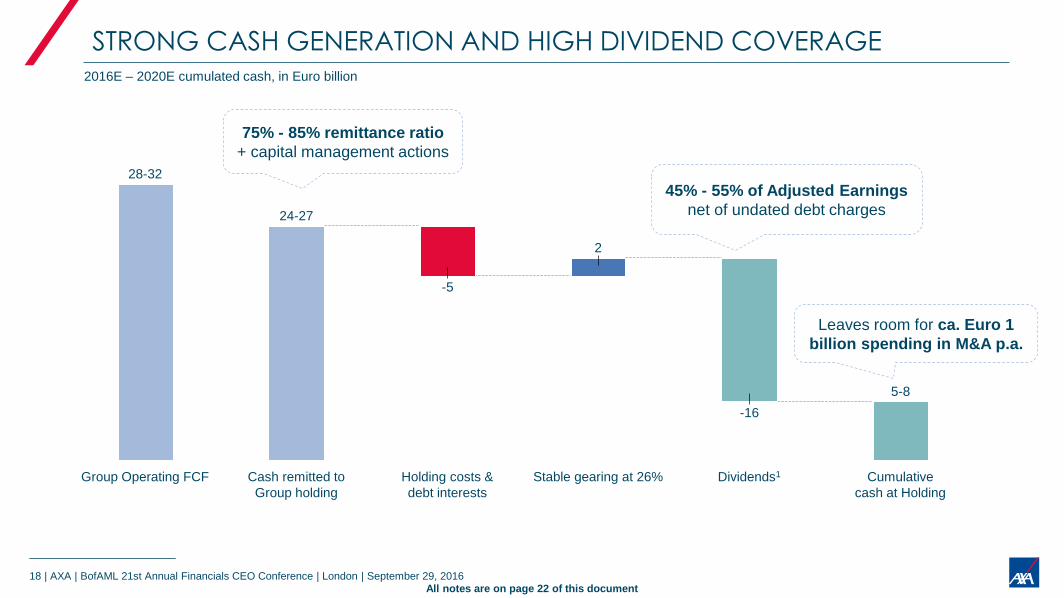
STRONG CASH GENERATION AND HIGH DIVIDEND COVERAGE
Cumulative
cash at Holding
5-8
-16
Dividends1
2
Stable gearing at 26%
24-27
Group Operating FCF
28-32
Holding costs &
debt interests
-5
Cash remitted to
Group holding
2016E – 2020E cumulated cash, in Euro billion
45% - 55% of Adjusted Earnings
net of undated debt charges
Leaves room for ca. Euro 1
billion spending in M&A p.a.
75% - 85% remittance ratio
+ capital management actions
All notes are on page 22 of this document
19 | AXA | BofAML 21st Annual Financials CEO Conference | London | September 29, 2016
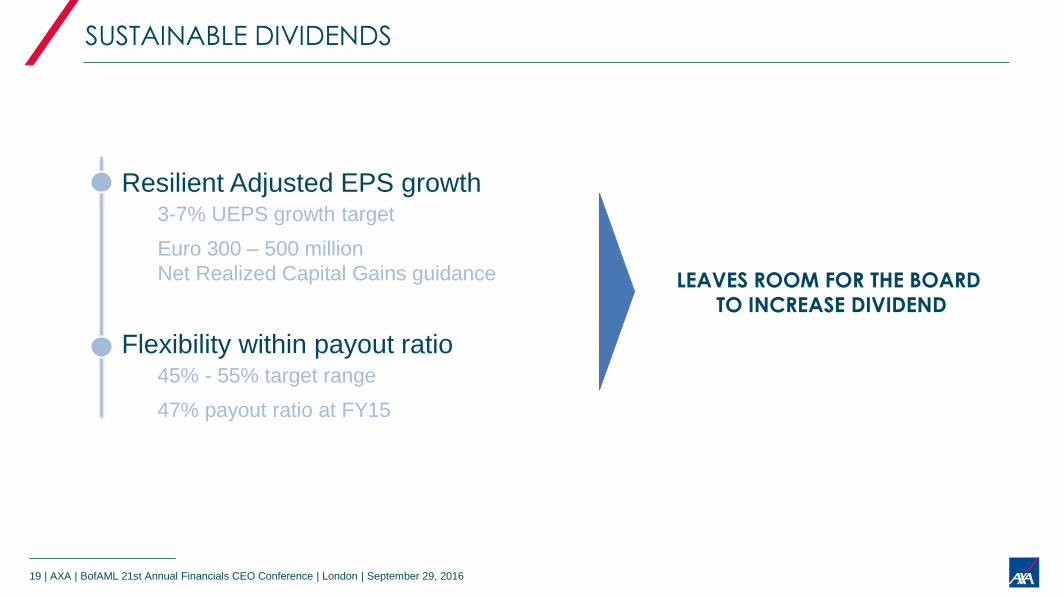
SUSTAINABLE DIVIDENDS
Resilient Adjusted EPS growth 3-7% UEPS growth target
Euro 300 – 500 million
Net Realized Capital Gains guidance
Flexibility within payout ratio 45% - 55% target range
47% payout ratio at FY15
LEAVES ROOM FOR THE BOARD TO INCREASE DIVIDEND
20 | AXA | BofAML 21st Annual Financials CEO Conference | London | September 29, 2016
KEY TAKEAWAYS
Transparent, realistic and credible Ambition 2020 plan Clear underlying assumptions and management levers for growth
Emphasis on execution and operations Efficiency, business growth and technical margin improvement
Earnings and balance sheet resilient to low interest rates Diversified business mix, disciplined risk management and high quality new business

Thank You
22 | AXA | BofAML 21st Annual Financials CEO Conference | London | September 29, 2016
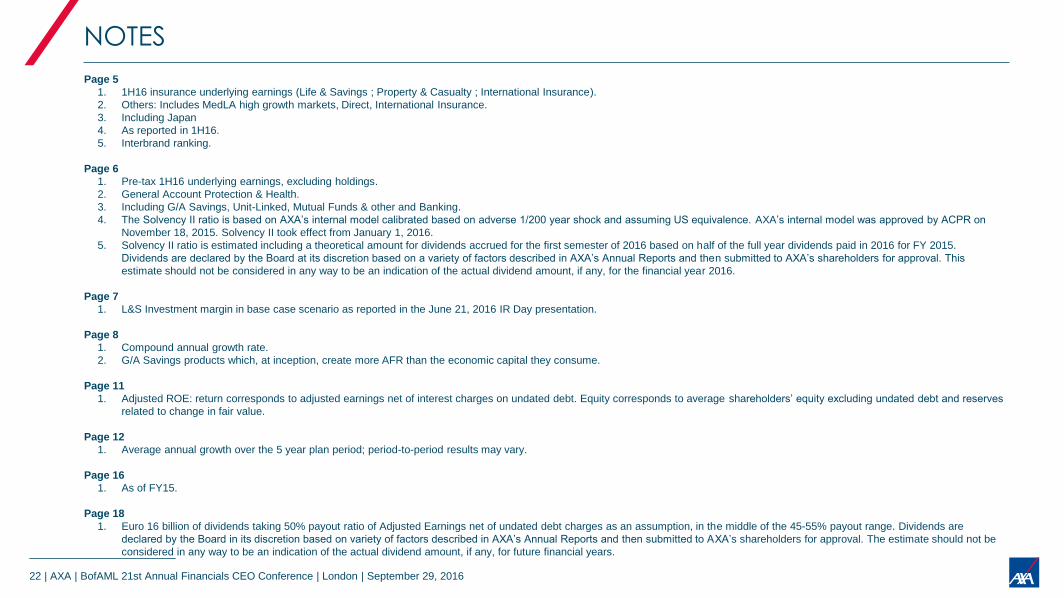
NOTES
Page 5
1. 1H16 insurance underlying earnings (Life & Savings ; Property & Casualty ; International Insurance).
2. Others: Includes MedLA high growth markets, Direct, International Insurance.
3. Including Japan
4. As reported in 1H16.
5. Interbrand ranking.
Page 6
1. Pre-tax 1H16 underlying earnings, excluding holdings.
2. General Account Protection & Health.
3. Including G/A Savings, Unit-Linked, Mutual Funds & other and Banking.
4. The Solvency II ratio is based on AXA’s internal model calibrated based on adverse 1/200 year shock and assuming US equivalence. AXA’s internal model was approved by ACPR on
November 18, 2015. Solvency II took effect from January 1, 2016.
5. Solvency II ratio is estimated including a theoretical amount for dividends accrued for the first semester of 2016 based on half of the full year dividends paid in 2016 for FY 2015.
Dividends are declared by the Board at its discretion based on a variety of factors described in AXA’s Annual Reports and then submitted to AXA’s shareholders for approval. This
estimate should not be considered in any way to be an indication of the actual dividend amount, if any, for the financial year 2016.
Page 7
1. L&S Investment margin in base case scenario as reported in the June 21, 2016 IR Day presentation.
Page 8
1. Compound annual growth rate.
2. G/A Savings products which, at inception, create more AFR than the economic capital they consume.
Page 11
1. Adjusted ROE: return corresponds to adjusted earnings net of interest charges on undated debt. Equity corresponds to average shareholders’ equity excluding undated debt and reserves
related to change in fair value.
Page 12
1. Average annual growth over the 5 year plan period; period-to-period results may vary.
Page 16
1. As of FY15.
Page 18
1. Euro 16 billion of dividends taking 50% payout ratio of Adjusted Earnings net of undated debt charges as an assumption, in the middle of the 45-55% payout range. Dividends are
declared by the Board in its discretion based on variety of factors described in AXA’s Annual Reports and then submitted to AXA’s shareholders for approval. The estimate should not be
considered in any way to be an indication of the actual dividend amount, if any, for future financial years.


![[Merrill Lynch] Credit Derivatives Handbook](https://static.fdocuments.in/doc/165x107/55cf97e9550346d03394646c/merrill-lynch-credit-derivatives-handbook.jpg)