
Global Engagement and Returns...
29
Global Engagement and Returns Volatility * Sourafel Girma, Sandra Lancheros and Alejandro Riaño Preliminary – Please do not cite without permission This Draft: August 16, 2013. Abstract: This study uses firm-level data for publicly-listed Japanese firms to examine whether there is any relationship between a firm‟s reliance on foreign market sales and its equity returns volatility. Using data for 2000-2010, we find that globally-engaged firms, i.e. firms exporting or selling in foreign markets through foreign subsidiaries, are more volatile than firms serving only the domestic market; however, we find that non-exporting firms employing overseas subsidiaries are less volatile than firms using both exports and FDI. Further results reveal a substantial degree of heterogeneity in the relationship between volatility and the mode of operation in foreign markets across industries and over time. In particular, we find evidence of a greater effect of exporting on volatility during the 2000-2002 recession and the 2009 financial crisis. Finally, we find that greater geographical diversification of export sales weakens the relationship between exporting and financial volatility, whereas the diversification of activities of foreign subsidiaries is found to be positively related to volatility. Keywords: Volatility, Stock Returns, Exports, FDI, Japan, Financial Crisis. JEL Classification: F36, F14, F23, G10. * Girma: School of Economics, University of Nottingham, Sir Clive Granger Building, Nottingham NG7 2RD, UK, GEP and CFCM. Email: [email protected]. Lancheros: Aston Business School, Aston University, Aston Triangle, Birmingham, B4 7ET, UK. Email: [email protected]. Riaño: School of Economics, University of Nottingham, Sir Clive Granger Building, Nottingham NG7 2RD, UK, GEP, CFCM and CESifo. Email: [email protected]. All remaining errors are our own.
Transcript of Global Engagement and Returns...

Global Engagement and Returns Volatility*
Sourafel Girma, Sandra Lancheros and Alejandro Riaño
Preliminary – Please do not cite without permission
This Draft: August 16, 2013.
Abstract:
This study uses firm-level data for publicly-listed Japanese firms to examine whether there is any
relationship between a firm‟s reliance on foreign market sales and its equity returns volatility.
Using data for 2000-2010, we find that globally-engaged firms, i.e. firms exporting or selling in
foreign markets through foreign subsidiaries, are more volatile than firms serving only the
domestic market; however, we find that non-exporting firms employing overseas subsidiaries are
less volatile than firms using both exports and FDI. Further results reveal a substantial degree of
heterogeneity in the relationship between volatility and the mode of operation in foreign markets
across industries and over time. In particular, we find evidence of a greater effect of exporting on
volatility during the 2000-2002 recession and the 2009 financial crisis. Finally, we find that
greater geographical diversification of export sales weakens the relationship between exporting
and financial volatility, whereas the diversification of activities of foreign subsidiaries is found to
be positively related to volatility.
Keywords: Volatility, Stock Returns, Exports, FDI, Japan, Financial Crisis.
JEL Classification: F36, F14, F23, G10.
* Girma: School of Economics, University of Nottingham, Sir Clive Granger Building, Nottingham NG7 2RD, UK, GEP and CFCM. Email: [email protected]. Lancheros: Aston Business School, Aston University, Aston Triangle, Birmingham, B4 7ET, UK. Email: [email protected]. Riaño: School of Economics, University of Nottingham, Sir Clive Granger Building, Nottingham NG7 2RD, UK, GEP, CFCM and CESifo. Email: [email protected]. All remaining errors are our own.

1
1. Introduction
Deeper International trade linkages have been instrumental in the worldwide propagation of the
recent financial crisis. Even countries such as Japan which were relatively far removed from the
epicentre were hit hard by the crisis with GDP and manufacturing exports contracting by 5.5%
and 27% respectively between 2008 and 2009. Not surprisingly, financial volatility soared at the
same time, increasing fourfold during the third quarter of 2008, remaining above its pre-crisis
level until the last quarter of 2009.1
The objective of this paper is to examine whether a firm‟s reliance on foreign sales, what
we refer to as „global engagement‟, is related to its level of financial volatility, measured as the
conditional volatility of monthly excess returns for publicly-listed, manufacturing firms in Japan
over the period 2000-2010. In understanding how a greater degree of global integration shapes
volatility at the microeconomic level it is crucial to focus on stock returns since they are tightly
linked to a firm‟s present discounted value of expected cash flows, making them a primary
concern for investors.2 Moreover, as Fillat and Garetto (2012) point out, despite the large body
of literature documenting features that distinguish firms that sell in foreign markets from firms
that do not, only a small number of papers have focused on whether the international status of a
firm matters for its investors or not.
An important contribution of our study is that we can distinguish in our data whether a
firm sells abroad by exporting or by means of local subsidiaries, a crucial margin of a firm‟s
internationalization process. Previous work has only investigated the relationship between
exporting and volatility. However, the role of foreign affiliates in influencing firm-level volatility
has yet to be explored, even though their sales are substantially larger than exports. For instance,
Antràs and Yeaple (forthcoming) report that subsidiary sales are about three times as large as
1 Financial volatility is measured using an index that replicates the Chicago Board Options Exchange (CBOE) VIX 2Bloom et al. (2007) show that excess return volatility is strongly correlated with other firm-level measures of
uncertainty such as real sales growth volatility and the cross-sectional the cross-sectional dispersion across analysts‟ earnings forecasts for the same firm.

2
exports for large U.S. firms. Similarly, total sales of Japanese manufacturing overseas affiliates are
approximately 42% larger than exports. As we argue in more detail in the next section, the
underlying factors that shape this decision, e.g. distance to destination markets or the magnitude
of investment costs associated with each mode of entry, have been acknowledged to potentially
play an important role in influencing firm-level volatility. To the best of our knowledge this is the
first study to analyse the link between firm-level financial volatility, exporting and outward FDI
(OFDI).
We find a positive and statistically significant relationship between financial volatility and
global engagement for Japanese firms. Our results indicate that globally-engaged firms are on
average 3.1% more volatile than their purely domestically-oriented counterparts. Turning to
whether this higher level of volatility is related to how firms serve foreign markets, either
through exports or local subsidiaries located abroad, we find that this relationship is primarily
driven by exporting activity. Both the act of exporting and a greater share of exports in total sales
are positively correlated with financial volatility, whereas firms that use only OFDI are 2.7% less
volatile than firms only selling in Japan. These results suggest that elements intrinsic to
conducting international transactions, such as longer lead times, which in turn are associated with
more complex inventory management and higher probability of payment default, might explain
the greater riskiness of exporting. It is important to note though, that we find a substantial
degree of cross-industry heterogeneity in the relationship between global engagement and
volatility. For instance, for firms in the chemicals products and electronic equipment, both
exporting and OFDI seem to have a negative relationship with volatility, whereas we found a
very strong and positive relationship for transportation equipment.
Since has long been established in the finance literature that the volatility of excess
returns is time-varying and strongly countercyclical (Schwert, 1989), we investigate whether the
volatility premium of exporters also changes over time. Our results show that the volatility
premium for Japanese exporters has changed substantially over the decade covered in our study.

3
More specifically, we find that the exporting volatility premium is also countercyclical, being the
highest during the domestic recession of the early 2000s, becoming statistically insignificant
during the middle of the decade and becoming positive again just before the 2008-09 financial
crisis. The volatility premium for firms using OFDI vis-à-vis non-OFDI firms follows a similar
pattern over our sample period, although it is for the most part not statistically significant.
Since our data allows us to keep track of the volume of exports and number of
subsidiaries located in four aggregate destinations (Asia, Europe, North America and other
destinations), we investigate whether the geographic pattern of foreign sales and market
diversification have affect the relationship between a firm‟s global engagement and its financial
volatility. If firms face foreign demand shocks that are not perfectly correlated, geographic
diversification might offer a channel to reduce volatility (Hirsch and Lev, 1971). Our results
show that firms exporting to Asia and Europe are significantly less volatile than firms exporting
to North America and other markets. Using a Herfindahl index of exports sales across our four
major destinations, we find that more geographically-diversified firms tend to be less volatile; this
negative relationship weakens, however, when exports constitute a large share of a firm‟s total
sales. Since we do not observe the share of sales accounted for subsidiaries in our set of major
destinations, we cannot replicate exactly the same analysis of export diversification for subsidiary
sales, but instead we use as proxies the number of subsidiaries in each region as well as their
share of a firm‟s total assets. In this case we find that greater OFDI diversification is positively
related to volatility, although we find some weak evidence that the effect of OFDI intensity on
volatility is moderated by geographic diversification.
There is an emerging body of literature that investigates the relationship between
international trade (and to some extent investment) and volatility, and seeks to identify plausible
mechanisms giving rise to this relationship. As Engel and Wang (2011) report, international trade
flows are up to threefold more volatile than GDP. This stylized fact suggests that firms relying
on both domestic and international demand are more vulnerable to demand and exchange rate
4
shocks than their domestically-oriented counterparts. Higher volatility of exporters is also found
to be associated with the political uncertainty faced by foreign partners, including unexpected
change in contractual agreements and regulations (Boutchkova et al., 2012). This finding echoes
the conclusion of Desai, Foley and Hines (2008) that the volatility of US multinational
corporations is greater the larger the political risk exposure from their foreign subsidiaries. On
the other hand, there are also plausible reasons to believe that globally engaged firms might face
lower volatility than their domestic peers. Due to their size such firms have the wherewithal to
engage in hedging activities. Moreover, in a world where domestic and foreign demands (or cash
flows segments) are imperfectly correlated, global firms can enjoy the volatility reducing effects
resulting from the geographic diversification. Indeed, Buch et al. (2009) find that German
exporters exhibit less pronounced sales volatility than non-exporters. These considerations
suggest that whether or not global engagement is related to financial volatility is ultimately an
empirical research question.
An important dimension in which our study improves upon previous work studying the
relationship between trade openness and firm-level volatility (Buch et al., 2009; Riaño, 2011;
Vanoorenberghe, 2012) besides our consideration of OFDI, is the use of the conditional volatility
of monthly excess stock returns as our dependent variable of interest. Since work in this area has
relied primarily on annual firm/plant-level surveys, the most common measure of volatility
employed has been the rolling standard deviation of sales. There three main advantages in using
the conditional volatility of stock returns: (i) excess stock returns incorporate information on
firms‟ sales, profitability and growth prospects and in general reflect the productivity of net
assets, thus provide the dimension of firm-level volatility most relevant from an investor‟s
perspective. (ii) The use of a rolling standard deviation to measure volatility assumes that
volatility remains constant within the window, and that all realizations used to calculate volatility
have the same weight within the window while realizations outside the window receive zero
weight. These undesirable features are easily overcome when using of a GARCH model to

5
parameterize returns volatility conditional on all information available up to that period. Finally,
(iii) volatility can be measured more accurately for stock returns because of the availability of
high frequency time series data.
Besides data availability, Japan constitutes an excellent laboratory to examine the impact
of globalisation on the volatility of stock returns. An significant fraction of Japanese firms are
highly globalised, thus relying heavily on exports and overseas investment for their growth,
however a large number of firms are still highly dependent on the domestic market. There is also
substantial time-series variation in terms of firm-level volatility and global engagement within our
sample period. De Veirman and Levin (2012) document a sharp increase in firm earnings,
employment and sales volatility during the deep recession that hit Japan between 1998 and 2002
and a subsequent decline in volatility after the export-led recovery that took place in the middle
of the decade. At the end of our sample, we witness the current financial crisis, which hit Japan‟s
exports particularly hard (Eaton et al., 2011) also driving volatility to its highest level throughout
the whole decade.
The rest of the paper is organized as follows: Section 2 discusses different mechanisms
through which global engagement might influence firm-level volatility. Sections 3 and 4 describe
our empirical methodology and data respectively. Our main results and robustness checks are
presented in Section 5. Section 6 concludes.
2. Global Engagement and Volatility at the Firm-level
Our starting point is the problem of a firm choosing how to serve a foreign market. There are
two alternatives available to the firm: to use its domestic capacity to produce and export its
output, or to manufacture its output directly in the foreign market in a subsidiary facility, i.e.
engage in multinational production (MP).
6
There is a vast literature exploring the main factors that determine the trade-offs
associated with this choice, which in turn would also shape the relationship between the extent
of a firm‟s global engagement and its volatility.
For instance, in the „proximity-concentration‟ framework, firms balance the plant-level
economies of scale that can be exploited by concentrating production in one location associated
with exporting against the lower transportation costs made possible by MP. In this set-up, it is
commonly assumed that operating a foreign subsidiary involves greater sunk entry costs than
exporting. Fillat and Garetto (2012) show that in the presence of country-specific shocks, firms
serving the foreign market through MP are more volatile than exporters. This result follows
because the wider hysteresis band makes multinational firms more reluctant to exit in response
to negative shocks. In support of this hypothesis, they document that listed multinational firms
in the U.S. exhibit higher stock returns and earning yields than exporters.
An important distinction between exporters and multinational firms that proximity-
concentration models do not consider is the time it takes for each firm to reach foreign
customers, while there is ample empirical evidence that transportation costs are indeed time-
dependant (Djankov et al., 2010 and Hummels and Schoar, forthcoming). During the time it
takes to complete an international transaction, an exporter is exposed to, among other things,
adverse movements in exchange rates or demand, payment default and customs-related
disruptions. These costs can be substantial; Alessandria et al. (2010) estimate that the inventory-
carrying expenses of exporters amount to a tariff equivalent of 20%, about six times larger than
the physical cost of trade. From a financial perspective, Amiti and Weinstein (2011) find that
export sales of Japanese firms are hit harder than sales of purely domestic firms and firms with
foreign subsidiaries when credit market conditions tighten. This response, they argue, stems
from the higher working capital needs and default risk faced by exporters. Thus, it can be seen
that by shortening delivery and payment lags, engaging in FDI constitutes a real option that can

7
help a firm hedge its exposure to foreign shocks, a point forcefully made in a simple theoretical
setting by Chang and Gayle (2009).
Some authors also find a relationship between the extent of country/sectoral volatility
that a firm faces and the mode of operation it chooses to serve its foreign demand. Ramondo et
al. (2012) show that in a model of horizontal FDI the ratio of exports to affiliate sales at the
sectoral level is increasing in the destination country‟s aggregate volatility. Riskier foreign market
conditions might also induce firms to rely primarily on exports rather than FDI as a more cost-
effective way to learn about their profitability as suggested by Conconi et al. (2013).
There are two main takeaway points from this brief discussion. First, selling in foreign
markets, either through exporting or using foreign subsidiaries is a risky endeavor, much more so
than operating purely in domestic markets. Second, there are several plausible mechanisms
through which the internationalization mode chosen by a firm might influence the level of
volatility faced by its investors. Thus, we turn to the data in order to shed light on how a greater
degree of global engagement at the firm level affects stock returns volatility.
3. Empirical approach
In this section, we describe the empirical approach to identify the effects of global engagement
on stock returns volatility. We specify the following baseline model of the determinants of
volatility with firm-specific heterogeneity:
𝑉𝑜𝑙 = 𝛽 + 𝛽 𝑋 + 𝛽 𝐺𝐿𝑂𝐵 + 𝑓 + 𝑑 + 𝜀 (1)
In the above equation i and t index firms and time periods respectively. The dependent
variable VOL denotes log of monthly unconditional volatility,3 GLOB captures variously defined
firm level indicators of exporting and outward FDI activities, X is a vector of control variables
that include exchange rate volatility, firm size, age and leverage, f denotes time-invariant firm-specific
3 Detail of the construction of all variables used in this paper is discussed in the next section.

8
heterogeneity, d is a vector of year dummies and is a random error term which is allowed to
exhibit cross-sectional as well serial correlation. It is important to account for spatial or cross-
sectional correlation because past research has shown that expected-returns tend to be correlated
across firms operating in the same market (e.g. Vuolteenaho, 2002).
Our main analysis is based on conditional volatility as the dependent variable, although
we also check the sensitivity of our results by looking at unconditional volatility. The latter is
based on historical information, where all observations are treated equally. By contrast,
conditional volatility conditions only on the latest available information, which is useful since
volatility is likely to be affected by more recent events. Furthermore, unconditional volatility
ignores potentially relevant information on the random process generating the return. For these
reasons we believe conditional volatility is a more appropriate measure of uncertainty facing
businesses. Hence in what follows volatility refers to conditional volatility, unless and other
stated.
The firm level control variables age, size and leverage are three of the most commonly
used variables to explain cross‐sectional differences in return variances (see inter alia Fik et al,
2010; Pástor and Veronesi , 2002 and Wei and Zhang, 2006). Since stock return volatility is
driven by the uncertainty about future profits and younger firms tend to have greater uncertainty
about their future growth, and hence exhibit have greater return volatility. While investor may
have more confidence in bigger firms and a result less uncertainty regarding their future cash
flows, firms‟ size can also proxy their degree diversification and maybe associated with greater
volatility. By the same token, the impact of firm leverage on volatility can be ambiguous. One
the one hand, high leverage (the ratio of long‐term debt to total assets) signals firms‟ ability to
attract external finance signaling greater certainty about future stream of earnings from the firm‟s
assets. On the other hand, more highly levered firms can be seen as having higher bankruptcy
probability and hence higher return volatility. There is a well-developed literature that studies the
relationship between exchange rate movements and firm equity (e.g. Dominguez and Tesar,

9
2006). The consensus seems to be that exchange rate exposure matters especially for
internationally-oriented firms. It is therefore important to control for exchange rate volatility
when examining the relationship between return volatility and global engagement.
In subsequent analysis, we subject our baseline model to a number of refinements and
robustness checks. These include using unconditional instead of conditional volatility, allowing
the relationship between internationalisation and volatility to depend on exports‟ destination
markets and exports diversification; exploring industry heterogeneity and temporal effects;
analysing the role of OFDI‟s geographic diversification.
4. Database construction and preliminary analysis
A. Variables definition and construction
We focus on Japanese companies in the manufacturing industry over the 132 months
spanning the period January 2000-December 2010. As described below, the dataset used in the
analysis is gleaned from various sources.
Unconditional volatility, defined as the log of monthly standard deviation of companies‟
daily excess return over the industry average, is calculated based on data are obtained from
Thomson Reuters Datastream. Two-digit industry average returns are obtained as the market
value -weighted average of individual returns. The same data source is used to compute conditional
volatility which is defined as the log monthly companies‟ excess return volatility estimated from
GARCH (1, 1) model. By way of preliminary analysis we also conduct an industry level study,
and for this purpose conditional and unconditional volatility are calculated as market value-
weighted average industry volatilities within each industry. We construct unconditional exchange rate
volatility as log of monthly standard deviation $/Yen exchange rate, which is obtained from
Bloomberg database. Conditional exchange rate conditional volatility is estimated from GARCH

10
(1, 1) model. Company size is proxied by log of company total assets, whereas leverage is defined
as the ration of long terms debts to total equity, and both variables are sourced from Datastream.
In our study, age is log of years since incorporation based on information obtained from the
ORBIS database.
Annual export sales figures are obtained from two sources, namely Datastream and
Bloomberg. As far as Japanese companies are concerned, the latter database is especially useful
since it gives export intensity (exports sales/total sales) with further breakdowns into four
exports destinations, viz. Asia, Europe, N. America and Others. The main sources for outward
FDI are Datastream and Orbis. Whereas Datastream makes the total sales by foreign subsidiaries
available, Bloomberg is an excellent source for obtaining the number of foreign subsidiaries,
sales and assets of subsidiaries with further breakdown by geographic areas.
Before looking at the sample characteristics, it is worth noting that at macro level, the
monthly volatility of Japanese exports and that of the Tokyo Stock Exchange exhibit co-
movement as depicted in Figure 1. For both variables, volatility has taken an upward surge in the
last quarter of the decade.
B. Sample Characteristics
Our sample consists of 1,474 companies over 132 months starting January 2000. Since
the time dimension of the dependent variable (s) is quite large, we were careful to test for
stationarity of the series. Firm-specific unit roots tests suggest that non-stationarity is not an
issue here4.
Table 1 gives summary statistics for the variables used in the estimation as well as their
precise definition and data sources.
[Table 1 goes about here] 4 Individual firm test results are not reported to save space.

11
Next we estimate firm fixed-effects adjusted volatility differentials between exporting and
non-exporting and OFDI and non-OFDI firms for each year during the period 2000-2010. The
point estimates and corresponding 95% confidence intervals are depicted in Figure 2. The figure
shows that volatility was higher for exporters in the first two years of the sample. However, the
volatility differentials declined to reach statistical insignificance, before starting climbing up again
around the time of the global financial crisis in 2007. Similar albeit less pronounced pattern
emerges when one contrasts OFDI and non-OFDI firms. This finding is indicative of a positive
correlation between globalisation and volatility. However we defer a more systematic firm level
analysis until the next section.
[Figure 2 goes about here]
C. Industry level analysis
We investigate whether sectors that rely more on exports and overseas subsidiaries‟ sales
exhibit larger volatility by estimating an industry-average version of Equation 1, that is
𝑉𝑜𝑙 = 𝛽 + 𝛽 𝑋 + 𝛽 𝐺𝐿𝑂𝐵 + 𝑓 +𝐷 + 𝜀 (2)
where j and t index industry and time respectively, Vol is volatility of industry return, the
control variables X are the industry average counterparts of those defined in Section 2, f and D
denotes industry and year fixed effects respectively, and GLOB consists of industry exports
intensity and the share of overseas‟ affiliates sales in total industry sales. Table 2 gives the list of
the industries and some summary statistics of industry exporting and OFDI intensities. As
expected the industries are fairly heterogeneous, but overall the figures confirms that Japanese
economy is well-embedded into the global economy. It is also noticeable that, amongst global
firms, a vast proportion engages in both exports and OFDI.
[Table 2 goes about here]

12
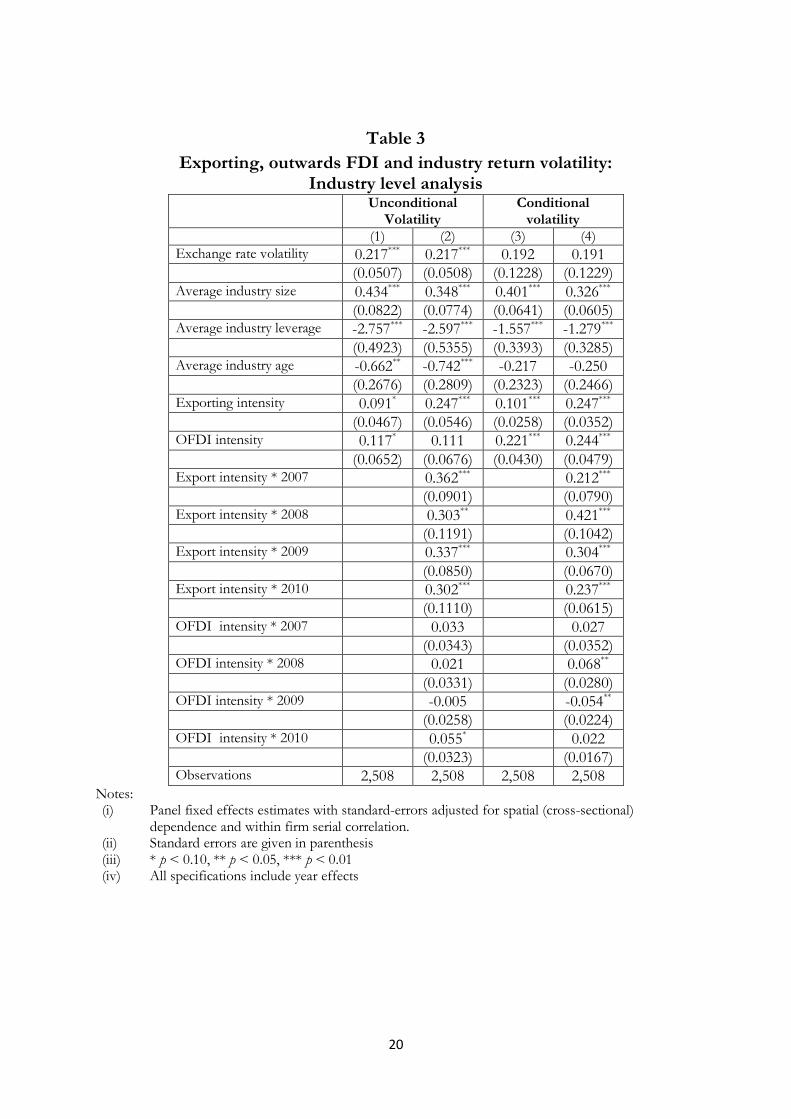
The results from the industry level estimations are reported in Table 3; they provide
suggestive evidence of a positive relationship between industry volatility and exports and OFDI
sales. Conditional volatility is found to be especially responsive to changes in the degree of
industry level globalisation. We also experimented with interacting exports and OFDI intensities
with post global financial crisis (2007-2010) year dummies, a period which has witnessed a large
drop in Japanese exports. Interestingly, we uncovered evidence that the impact of exporting on
volatility has become more pronounced post-financial crisis. This mirrors the upward trend in
the differential between the volatility of exporters and non-exporters shown in Figure 2.
[Table 3 goes about here]
5. Main findings
We discuss the main findings from estimating model [1] using the fixed effects panel
estimator with cross-sectionally and serially correlated errors developed by Driscoll and Kraay
(1998). This estimator is appropriate in the present context because unlike typical micro panels,
our dataset consists of large time dimension.
A. Baseline specification
We start our discussion with the estimates from the baseline model reported in Table 4.
Across all specification we confirm the importance of controlling for exchange rate volatility
when modelling returns volatility of Japanese companies. The results show that a 10% increase
in the volatility of the Yen/$ exchange rate can lead up to 5% increase in returns volatility all else
constant. This is indeed an economically significant effect, although not too surprising given that
Japan is a highly globalised economy.
[Table 4 goes about here]
We establish a robust positive relationship between firm size and volatility. By contrast,
firm age exert a negative effect on conditional volatility consistent with the notion that the
market is less certain the future profits of relatively younger firms. Leverage also has a negative

13
impact on volatility, providing indirect evidence that the ability to attract external finance inspires
higher confidence regarding future stream of earnings.
In what follows we confine our discussion to the global engagement variables which are
the main focus of this study. Estimates reported in column (1) of Table 4 indicate that the
volatility of exporters is, on average, 3.2% higher respectively, than otherwise equivalent non-
exporters. While still economically significant, these differentials are much lower than those
shown in Figure 2 as they are based on a more robust estimation technique that controls for a
host of confounding variables on top of unobservable fixed effects. Interestingly, we also
uncover evidence that the higher the share of exports in total sales, the larger volatility will be
(column 2), consistent with the industry level results discussed in Section 3. While OFDI firms
do not on average have higher volatility than their non-OFDI peers, the share of subsidiaries
sales in total assets is positively related with volatility.
Since a substantial fraction of OFDI firms export too, we have re-estimated the model
by interacting the exports and OFDI dummies in order to get further insights into the situation.
The results from this experiment are given in the final column of Table 4, and they suggest that
firms that both exports and engage in OFDI are 4.1% more volatile than non-exporting and
non-OFDI firms. Interestingly, the volatility of non-exporting firms with overseas subsidiaries is
2.7% lower than otherwise equivalent firms.
B. Exploring time effects
Our preliminary analysis showed an increase in the volatility of exporters (OFDI firms)
relative to non-exporters (non-OFDI firms) during the second half of the sample period. We
now explore this issue more formally within our regression framework. Table 5 reports the
regression results from interacting post-2006 year-specific with exporting and OFDI. There is an
increase in the volatility of the average exporters, ranging from 1.6% in 2007 to 3.5% in 2010.
However there is no clear dynamics in the relationship between exporting intensity and volatility.

14
Similarly the volatility of OFDI firms is on average 5.2% higher in 2007 than would otherwise be
the case. In the same year, higher OFDI intensity amongst multinational firms is associated with
higher volatility.
[Table 5 goes about here]
C. Industry heterogeneity
The summary statistics given in Table 2 suggested a substantial variation in the extent to
which Japanese manufacturing industries relies on exports and foreign affiliate sales. This
prompts to explore if there are any industry-specific heterogeneity in the relationship between
volatility and global engagement. To this end we focused on four highly globalised (in terms of
both exporting and OFDI) industries, namely chemical, industrial machinery, electronics and
transportation equipment. As can be seem from Table 6, no uniform pattern emerges from the
econometric estimates based on interacting dummies for those industries with the measures of
global engagement. It seems the chemical and electronic industries are less vulnerable to
globalisation-induced volatility, whereas the relationship between volatility, exporting and
OFDI is stronger amongst firms in the transportation equipment industry.
[Table 6 goes about here]
D. Exports markets destination and diversification
Does exports destination matter for firm volatility? The answer to this question is
affirmative as long as the role of destination-specific shocks varies significantly. For example, in
in industry-level study, Boutchkova et al (2012) find that industries that are more dependent on
trade exhibit greater volatility when export-destination political risks are higher. Our dataset
allows a breakdown of export sales into four destination markets, viz. Asia, Europe, N. America
and others. While this is not quite the ideal country-specific destination markets information, we

15
hope we still can learn something from it. In this spirit we have re-estimated our baseline model
with variously defined destination-specific exporting variables. The results from this experiment
are presented in Table 7 providing suggestive evidence that destination matters indeed. In
particular Japanese exports to Asia are associated with less volatility all else contrast. By contrast,
there is a uniformly positive link between exports to North America and the returns volatility of
Japanese firms.
At an aggregate level, Haddad et al (2010) report empirical evidence that the degree of
diversification of a country's export helps reduce trade-induced growth volatility. We thus
explore the role of export market diversification by interacting an exports share-based
Herfindhal index of exports diversification with exports intensity. The econometric estimates
reported in the last column of Table 7 indicate that while exports diversification is associated
with less volatility. However the interaction between exports intensity and diversification is
positive and significant suggesting that exports-related volatility is likely to be exacerbated when
the firms depends on selling a large fraction of its output in a relatively large number of
countries.
[Table 7 goes about here]
E. OFDI geographic destination and diversification
We next investigate the role OFDI destination and geographic diversification, using a similar
approach as when we were studying the effects export destinations. The results shown in Table
8 paint a picture where OFDI in Asia is less risky for Japanese multinationals, at least during our
sample period. This is consistent with the evidence on the effects exports destinations reported
earlier. Another striking results is that the larger the number of subsidiaries in Europe or indeed
the higher the share of subsidiaries assets in Europe, the larger returns volatility will get ceteris
paribus. In contrast to the case of exporting, we uncover evidence that geographic diversification

16
has a volatility increasing effects. There is however some weak evidence that effects of OFDI
intensity is moderated by geographic diversification.
[Table 8 goes about here]
F. Unconditional volatility
We argued in Section 3, that conditional volatility better captures business risk than its
unconditional counterpart. Nonetheless we have also re-estimated our models based on
unconditional volatility which is defined as log of monthly standard deviation of companies‟ daily
excess return over the industry average. Table 9 reports results from regression exploring the
role of destination markets and diversification, and these are generally consistent with those
based on unconditional volatility.
6. Conclusions
TBA

17
Figure 1: The volatility of aggregate Japanese exports and Tokyo Stock Exchange
Figure 2
0.5
11.5
2
To
kyo S
tock E
xch
an
ge
-2.3
-2.2
-2.1
-2
Expo
rts
Jan2000 Jan2005 Jan2010Year and month
Exports Tokyo Stock Exchange
Log monthy conditional volatility
-.1
0.1
.2
Vo
latilit
y d
iffe
ren
tia
ls w
ith 9
5%
CIs
2000 2003 2005 2008 2010Year
Exporters vs. non-exporters
-.2
-.1
0.1
.2
Vo
latilit
y d
iffe
ren
tia
ls w
ith 9
5%
CIs
2000 2003 2005 2008 2010Year
Outward FDI vs. non-FDI
Firm level differentials across time
The impact of global engagement on conditional volatility:

18
Table 1 Variable definition and summary statistics
Definition Data sources Mean Std. Dev.
Unconditional volatility
Log of monthly standard deviation of companies‟ daily excess return over the industry average.
DATASTREAM for raw data; and own calculations.
-1.520 1.028
Conditional volatility Log of monthly companies‟ excess return volatility estimated from GARCH (1, 1) model.
DATASTREAM for raw data; and own estimation.
-2.495 0.838
Industry unconditional volatility
Market-value weighted monthly conditional volatility within two-digit industry
DATASTREAM and own calculations.
1.889 0.956
Industry conditional volatility
Market value-weighted monthly conditional volatility within two-digit industry
DATASTREAM and own estimation.
2.818 0.554
Exchange rate volatility
Log of monthly standard deviation $/Yen exchange rate.
BLOOMBERG 0.125 0.380
Exchange rate conditional volatility
Log of monthly standard deviation $/Yen exchange rate estimated from GARCH (1, 1).
BLOOMBERG and own estimation.
0.125 0.380
Size Log of company total assets DATASTREAM 17.549 1.538
Leverage Long terms debts/total equity DATASTREAM 0.219 0.181
Age Log of years since incorporation ORBIS 3.755 0.832
Export dummy 1 if exports in particular year are positive, 0 else.
DATASTREAM and BLOOMBERG
0.369 0.482
Export intensity Exports sales/total sales, with further breakdowns into four exports destinations, viz. Asia, Europe, N. America and Others.
DATASTREAM and BLOOMBERG
0.257 0.215
OFDI dummy 1 if company has foreign subsidiaries year are positive, 0 else.
DATASTREAM, BLOOMBERG and ORBIS.
0.357 0.479
OFDI intensity Sales by foreign subsidiaries/total sales DATASTREAM & ORBIS.
0.287 0.189
Number of foreign subsidiaries
Number of foreign subsidiaries, with further breakdowns into four main geographic areas, viz. Asia, Europe, N. America and Others.
ORBIS 1.236 4.533
Total assets of all foreign subsidiaries
Log of total assets of foreign subsidiaries in their respective countries, with further breakdowns into four main geographic areas, viz. Asia, Europe, N. America and Others.
ORBIS 11.347 2.405
Time period: January 2000-December 2010 (132 months)
Number of companies 1,474
Note: In the above table, average values of export and OFD intensities are calculated for those firms with positive exports and OFDI respectively.

19
Table 2 Proportion (in %) of Exporters and OFDI firms and exports and foreign
subsidiaries sales’ share in total sales by industry
Exports
firms OFDI firms
Exports&
OFDI
Exports OFDI
Two-digit SIC code
Manufacturing industry name
Mean SD Mean SD
20 Food and kindred products 9.26 6.91 6.45 15.08 14.91 2.62 0.99
22 Textile mill products 37.84 31.33 22.56 18.51 19.27 2.42 1.50
23 Apparel and other textile products 19.66 15.17 11.03 32.97 31.43 2.43 0.64
24 Lumber and wood products 8.93 4.17 4.17 7.60 7.48 0.00 0.05
25 Furniture and fixtures 2.08 0.00 0.00 25.23 24.94 0.00 0.03
26 Paper and allied products 13.39 17.49 12.02 23.75 24.35 3.21 1.65
27 Printing and publishing 10.66 6.61 5.33 24.55 23.19 0.58 0.21
28 Chemicals and allied products 38.69 39.08 31.29 25.22 25.49 10.60 3.05
29 Petroleum and coal products 39.81 35.92 31.07 21.68 21.07 13.44 2.69
30 Rubber and misc. Plastics products 47.86 51.47 43.57 25.95 25.97 15.39 4.97
31 Leather and leather products 0.00 12.12 0.00 11.93 12.78 0.00 0.11
32 Stone, clay, and glass products 28.57 28.74 23.92 29.47 29.87 7.48 1.76
33 Primary metal industries 40.05 31.24 26.42 21.68 21.74 9.10 2.66
34 Fabricated metal products 18.69 21.65 16.47 19.61 19.98 1.79 0.51
35 Industrial machinery and equipment 42.55 45.31 35.96 35.03 34.89 14.67 3.14
36 Electronic & other electric equipment 46.81 50.60 40.27 36.63 36.88 18.95 5.92
37 Transportation equipment 50.62 58.47 45.50 40.27 40.31 25.37 3.29
38 Instruments and related products 45.40 46.73 36.92 35.03 34.53 14.10 3.68
39 Miscellaneous industries 45.10 50.00 40.91 30.65 30.91 6.97 6.12
20
Table 3
Exporting, outwards FDI and industry return volatility: Industry level analysis
Unconditional Volatility
Conditional volatility
(1) (2) (3) (4)
Exchange rate volatility 0.217*** 0.217*** 0.192 0.191 (0.0507) (0.0508) (0.1228) (0.1229) Average industry size 0.434*** 0.348*** 0.401*** 0.326*** (0.0822) (0.0774) (0.0641) (0.0605) Average industry leverage -2.757*** -2.597*** -1.557*** -1.279*** (0.4923) (0.5355) (0.3393) (0.3285) Average industry age -0.662** -0.742*** -0.217 -0.250 (0.2676) (0.2809) (0.2323) (0.2466) Exporting intensity 0.091* 0.247*** 0.101*** 0.247*** (0.0467) (0.0546) (0.0258) (0.0352) OFDI intensity 0.117* 0.111 0.221*** 0.244*** (0.0652) (0.0676) (0.0430) (0.0479) Export intensity * 2007 0.362*** 0.212*** (0.0901) (0.0790) Export intensity * 2008 0.303** 0.421*** (0.1191) (0.1042) Export intensity * 2009 0.337*** 0.304*** (0.0850) (0.0670) Export intensity * 2010 0.302*** 0.237*** (0.1110) (0.0615) OFDI intensity * 2007 0.033 0.027 (0.0343) (0.0352) OFDI intensity * 2008 0.021 0.068** (0.0331) (0.0280) OFDI intensity * 2009 -0.005 -0.054** (0.0258) (0.0224) OFDI intensity * 2010 0.055* 0.022 (0.0323) (0.0167) Observations 2,508 2,508 2,508 2,508
Notes: (i) Panel fixed effects estimates with standard-errors adjusted for spatial (cross-sectional)
dependence and within firm serial correlation. (ii) Standard errors are given in parenthesis (iii) * p < 0.10, ** p < 0.05, *** p < 0.01 (iv) All specifications include year effects

21
Table 4 Returns volatility and global engagement:
Baseline specification
(1) (2) (3) (4) (5)
Exchange rate volatility 0.500*** 0.500*** 0.500*** 0.500*** 0.500*** (0.1175) (0.1175) (0.1175) (0.1175) (0.1175) Size 0.165*** 0.160*** 0.166*** 0.162*** 0.164*** (0.0087) (0.0085) (0.0087) (0.0084) (0.0086) Leverage -0.350*** -0.348*** -0.350*** -0.352*** -0.348*** (0.0285) (0.0279) (0.0285) (0.0286) (0.0283) Age -0.100*** -0.097*** -0.101*** -0.099*** -0.098*** (0.0072) (0.0070) (0.0072) (0.0071) (0.0072) Exports dummy 0.032*** 0.017** (0.0043) (0.0074) Export intensity 0.112*** (0.0234) OFDI dummy 0.003 -0.027*** (0.0074) (0.0081) OFDI intensity 0.172*** (0.0266) Exports*OFDI dummy 0.041*** (0.0131) Observations 181660 181660 181660 181660 181660
Notes: (i) Panel fixed effects estimates with standard-errors adjusted for spatial (cross-sectional)
dependence and within firm serial correlation. (ii) Standard errors are given in parenthesis (iii) * p < 0.10, ** p < 0.05, *** p < 0.01 (iv) All specifications include year effects

22
Table 5 Returns volatility and global engagement:
Exploring temporal effects Exporting OFDI
Dummy Intensity Dummy Intensity Exchange rate volatility 0.500*** 0.500*** 0.500*** 0.500*** (0.1175) (0.1175) (0.1175) (0.1175) Size 0.161*** 0.160*** 0.163*** 0.161*** (0.0084) (0.0083) (0.0083) (0.0083) Leverage -0.347*** -0.345*** -0.346*** -0.350*** (0.0273) (0.0273) (0.0271) (0.0279) Age -0.096*** -0.097*** -0.098*** -0.099*** (0.0071) (0.0070) (0.0070) (0.0070)
Exporting 0.016* 0.097***
(0.0089) (0.0275)
Exporting * 2007 0.038*** 0.026
(0.0124) (0.0338)
Exporting * 2008 0.028 -0.015
(0.0187) (0.0508)
Exporting * 2009 0.021* -0.058*
(0.0115) (0.0305)
Exporting * 2010 0.035*** -0.013 (0.0119) (0.0303) OFDI -0.007 0.133*** (0.0095) (0.0326) OFDI * 2007 0.052*** 0.057* (0.0127) (0.0324) OFDI * 2008 0.009 -0.016 (0.0242) (0.0582) OFDI * 2009 0.026** -0.007 (0.0102) (0.0293) OFDI * 2010 0.011 -0.031 (0.0129) (0.0347) Observations 181660 181660 181660 181660
Notes: (i) Panel fixed effects estimates with standard-errors adjusted for spatial (cross-sectional)
dependence and within firm serial correlation. (ii) Standard errors are given in parenthesis (iii) * p < 0.10, ** p < 0.05, *** p < 0.01 (iv) All specifications include year effects

23
Table 6 Returns volatility and global engagement:
Exploring industry heterogeneity Exporting OFDI
Dummy Intensity Dummy Intensity Exchange rate volatility 0.500*** 0.500*** 0.500*** 0.500*** (0.1175) (0.1175) (0.1175) (0.1176) Size 0.153*** 0.139*** 0.166*** 0.158*** (0.0082) (0.0076) (0.0087) (0.0084) Leverage -0.350*** -0.348*** -0.350*** -0.354*** (0.0283) (0.0271) (0.0283) (0.0281) Age -0.090*** -0.090*** -0.098*** -0.096*** (0.0068) (0.0067) (0.0072) (0.0071) Exporting 0.091*** 0.488*** (0.0105) (0.0322) Exporting* chemical industry -0.087*** -0.351*** (0.0214) (0.0649) Exporting* industrial machinery 0.017 -0.142*** (0.0153) (0.0337) Exporting * electronics equipment -0.290*** -1.096*** (0.0315) (0.0900) Exporting * transportation equipment 0.109*** -0.079 (0.0250) (0.0697) OFDI 0.004 0.294*** (0.0108) (0.0556) OFDI * chemical industry -0.003 -0.175*** (0.0143) (0.0578) OFDI * industrial machinery 0.078*** 0.151* (0.0127) (0.0785) OFDI * electronics equipment -0.175*** -0.972*** (0.0352) (0.1370) OFDI * transportation equipment 0.175*** 0.635*** (0.0232) (0.1551) Observations 181660 181660 181660 181660 Notes: (i) Panel fixed effects estimates with standard-errors adjusted for spatial (cross-sectional)
dependence and within firm serial correlation. (ii) Standard errors are given in parenthesis (iii) * p < 0.10, ** p < 0.05, *** p < 0.01 (iv) All specifications include year effects

24
Table 7 Returns volatility and global engagement:
The role of exports destinations and diversification Exports destinations Diversification
Dummy Intensity Major destination
Exchange rate volatility 0.500*** 0.500*** 0.500*** 0.500*** (0.1175) (0.1175) (0.1175) (0.1175) Size 0.165*** 0.158*** 0.164*** 0.160*** (0.0086) (0.0083) (0.0086) (0.0085) Leverage -0.351*** -0.351*** -0.352*** -0.349*** (0.0285) (0.0278) (0.0284) (0.0274) Age -0.098*** -0.095*** -0.100*** -0.095*** (0.0071) (0.0069) (0.0072) (0.0069) Asia -0.020*** -0.077** -0.014* (0.0064) (0.0306) (0.0075) Europe -0.020*** 0.039 -0.003 (0.0054) (0.0523) (0.0107) North America 0.020*** 0.240*** 0.023*** (0.0068) (0.0275) (0.0057) Other destinations 0.062*** 0.475*** -0.046*** (0.0067) (0.0700) (0.0130) Exports intensity 0.297*** (0.0288) Exports diversification index -1.194*** (0.1749) Exports intensity*diversification 0.843*** (0.1564) Observations 181660 181660 181660 181660
Notes: (i) Panel fixed effects estimates with standard-errors adjusted for spatial (cross-sectional)
dependence and within firm serial correlation. (ii) Standard errors are given in parenthesis. (iii) Exports diversification index is calculated as a Herfindhal index. (iv) * p < 0.10, ** p < 0.05, *** p < 0.01 (v) All specifications include year effects

25
Table 8 Returns volatility and global engagement:
Exploring the role OFDI geographic diversification
Diversification
Dummies # of subsidiaries
Share of assets
Exchange rate volatility 0.500*** 0.500*** 0.500*** 0.500*** (0.1175) (0.1175) (0.1175) (0.1175) Size 0.167*** 0.166*** 0.167*** 0.162*** (0.0086) (0.0084) (0.0087) (0.0084) Leverage -0.350*** -0.350*** -0.348*** -0.351*** (0.0287) (0.0285) (0.0287) (0.0286) Age -0.101*** -0.101*** -0.101*** -0.099*** (0.0071) (0.0070) (0.0071) (0.0071) Asia -0.043*** -0.033* 0.025 (0.0145) (0.0168) (0.0243) Europe -0.022*** 0.028*** 0.037*** (0.0066) (0.0093) (0.0077) North America -0.019* -0.027* -0.285*** (0.0100) (0.0136) (0.0357) Other destinations -0.023* -0.037** -0.095 (0.0117) (0.0166) (0.1040) OFDI intensity 0.129*** (0.0212) OFDI diversification index 0.022** (0.0085) OFDI intensity*diversification -0.069* (0.0374) Observations 181660 181660 181660 181660
Notes: (i) Panel fixed effects estimates with standard-errors adjusted for spatial (cross-sectional)
dependence and within firm serial correlation. (ii) Standard errors are given in parenthesis. (iii) OFDI diversification index is calculated as a Herfindhal index. (iv) * p < 0.10, ** p < 0.05, *** p < 0.01 (v) All specifications include year effects

26
Table 9 Unconditional volatility and global engagement:
With EXPORTING With OFDI Dummy Intensity Diversification Dummy Intensity Diversification Exchange rate volatility 0.257*** 0.257*** 0.257*** 0.257*** 0.257*** 0.257*** (0.0602) (0.0602) (0.0602) (0.0602) (0.0602) (0.0602) Size 0.179*** 0.176*** 0.178*** 0.182*** 0.181*** 0.178*** (0.0115) (0.0111) (0.0113) (0.0114) (0.0114) (0.0110) Leverage -0.399*** -0.400*** -0.398*** -0.398*** -0.397*** -0.398*** (0.0342) (0.0338) (0.0335) (0.0344) (0.0344) (0.0344) Age -0.111*** -0.110*** -0.111*** -0.114*** -0.114*** -0.113*** (0.0123) (0.0120) (0.0119) (0.0123) (0.0123) (0.0123) Asia -0.021** -0.142*** -0.041** 0.050* (0.0092) (0.0455) (0.0186) (0.0285) Europe -0.030*** -0.065 -0.037*** 0.025* (0.0075) (0.0722) (0.0094) (0.0125) North America 0.014 0.229*** -0.027* -0.332*** (0.0095) (0.0444) (0.0141) (0.0555) Other destinations 0.072*** 0.499*** -0.044*** -0.172 (0.0091) (0.0848) (0.0154) (0.1304) Intensity 0.266*** 0.072** (0.0423) (0.0337) Diversification index -1.354*** 0.020* (0.2196) (0.0110) Intensity*diversification 0.998*** -0.054 (0.2010) (0.0497) Observations 181648 181648 181648 181648 181648 181648
Notes: (i) Panel fixed effects estimates with standard-errors adjusted for spatial (cross-sectional)
dependence and within firm serial correlation. (ii) Standard errors are given in parenthesis. (iii) Exports diversification index is calculated as a Herfindhal index. (iv) * p < 0.10, ** p < 0.05, *** p < 0.01 (v) All specifications include year effects

27
References:
Alessandria, G., J. Kaboski, and V. Midrigan (2010). “Inventories, Lumpy Trade, and Large Devaluations,” The American Economic Review 100: 2304–2339.
Amiti, M. and D. E. Weinstein (2011). “Exports and Financial Shocks,” Quarterly Journal of Economics 126: 1841-1877.
Antràs, P. and S. R. Yeaple (forthcoming) “Multinational Firms and the Structure of International Trade,” Handbook of International Trade.
Bloom, N., S. Bond and J. van Reenen (2007). “Uncertainty and Investment Dynamics,” Review of Economic Studies 74: 391-415.
Boutchkova, M., Doshi, H. Durnev, A. and Molchanov, A. (2012) “Precarious Politics and Return Volatility,” Review of Financial Studies. 25: 1111-1154.
Buch, C., J. Doepke, and H. Strötmann (2009). “Does Export Openness Increase Firm-level Volatility?” The World Economy 32: 531-551.
Chang, Y-M. and P. G. Gayle (2009). “Exports versus FDI: do Firms use FDI as a Mechanism to Smooth Demand Volatility?” Review of World Economics 145: 447-467.
Conconi, P., A. Sapir and M. Zanardi (2013). “The Internationalization Process of Firms: from Exports to FDI,” Working Paper, Université Libre de Bruxelles.
De Veirman, E. and A. T. Levin (2012). “When did Firms become more Different? Time-Varying Firm-Specific Volatility in Japan,” Journal of the Japanese and International Economies 26: 578-601.
Desai, M., C. Foley, and J. Hines, Jr. (2008). “Capital Structure with Risky Foreign Investments,” Journal of Financial Economics 88: 534–53.
Djankov, S., C. Freund and C. S. Pham (2010). “Trading on Time,” The Review of Economics and Statistics 92: 166-173.
Driscoll, J. C. and A. C. Kraay (1998). “Consistent Covariance Matrix Estimation with Spatially Dependent Panel Data,” Review of Economics and Statistics 80: 549-560.
Domínguez, K. M. E. and Tesar, L. L. (2006). “Exchange Rate Exposure”, Journal of International Economics 68: 188-218.
Eaton, J., S. Kortum, B. Neiman and J. Romalis (2010). “Trade and the Global Recession,” NBER Working Paper 16666.
Engel, C., and J. Wang. (2011). “International Trade in Durable Goods: Understanding Volatility, Cyclicality, and Elasticities,” Journal of International Economics 83: 37–52.
Fillat, J. L. and S. Garetto (2012). “Risk, Returns and Multinational Production,” Working Paper, Boston University.
Fink, J., K. W. Fink, G. Grullon, and J. P. Weston (2010). “IPO Vintage and the Rise of Idiosyncratic Risk,” Journal of Financial and Quantitative Analysis 45: 1253–1278.
di Giovanni, J. and A. A. Levchenko (2009). “Trade Openness and Volatility,” The Review of Economics and Statistics 91: 558–585.
Hirsch, S. and B. Lev (1971). “Sales Stabilization through Export Diversification,” Review of Economics and Statistics 53: 270-277,
Hummels, D. L. and G. Schaur (forthcoming). “Time as a Trade Barrier,” American Economic Review.
Pástor, L. and P. Veronesi (2003). “Stock Valuation and Learning about Profitability,” Journal of Finance 58: 1749–89.
Ramondo, N., V. Rappoport and K. J. Ruhl (2012). “The Proximity-Concentration Tradeoff under Uncertainty,” Working Paper, Arizona State University.
Riaño, A. (2011). “Exports, Investment and Firm-level Volatility,” Review of World Economics 147: 643-663.
Rob, R. and N. Vettas (2003). “Foreign Direct Investment and Exports with Growing Demand,” Review of Economic Studies 70: 629-648.

28
Schwert, G. W. (1989). “Why Does Stock Market Volatility Change Over Time?” Journal of Finance 44: 1115-1153.
Vannoorenberghe, G. (2012). “Firm-level Volatility and Exports,” Journal of International Economics 86: 57–67.
Vuolteenaho, T. (2002). “What Drives Firm‐level Stock Returns?” Journal of Finance 57: 233–264.
Wei, S. X., and C. Zhang. (2006). “Why Did Individual Stocks Become More Volatile?” Journal of Business 79: 259–292.