Global Burden of Disease Study - 2010
100
Global Burden of Disease Study – 2010 Dr. Rizwan S A, M.D.,
-
Upload
rizwan-s-a -
Category
Health & Medicine
-
view
105 -
download
2
description
Transcript of Global Burden of Disease Study - 2010
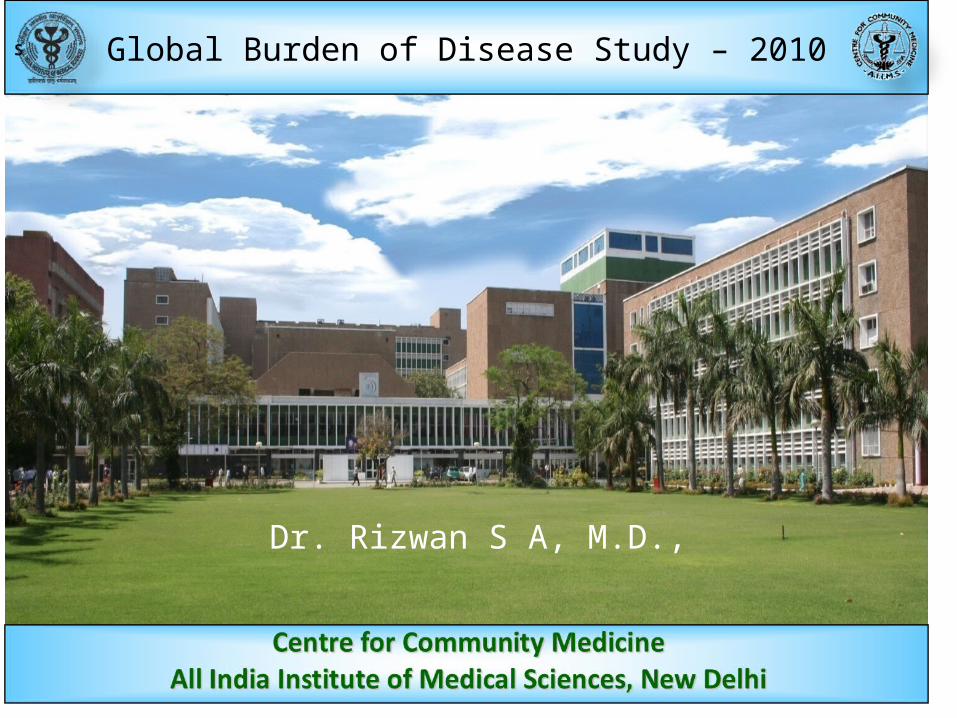
Global Burden of Disease Study – 2010
Dr. Rizwan S A, M.D.,
Outline of presentation
• Beginnings• Prior studies• What is GBD?• Need for GBDS – 2010• Methodology of GBDS – 2010• Analytical components of GBDS – 2010• Five critical choices• Results overview• Articles published

Beginnings
• Original GBD 1990 Study was commissioned by the World Bank in 1991 to provide a comprehensive assessment of the burden of 107 diseases and injuries and ten selected risk factors for the world and eight major regions in 1990
• The disability-adjusted life year (DALY), a time-based measure that combined years of life lost due to premature mortality and years of life lost due to time lived in health states less than ideal health, was developed to assess the burden of disease.
Prior studies
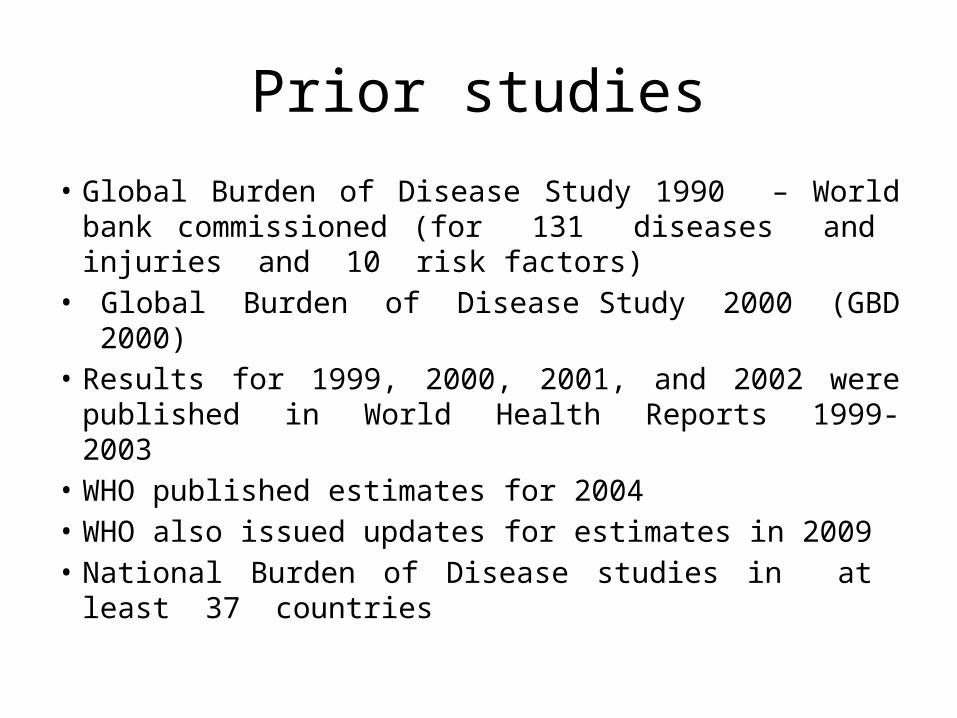
• Global Burden of Disease Study 1990 – World bank commissioned (for 131 diseases and injuries and 10 risk factors)
• Global Burden of Disease Study 2000 (GBD 2000)• Results for 1999, 2000, 2001, and 2002 were published
in World Health Reports 1999-2003• WHO published estimates for 2004• WHO also issued updates for estimates in 2009• National Burden of Disease studies in at least 37
countries

What is GBD ? - 1
• There are some 6 billion people in the world, and hundreds of millions experience disease or injury each year.
• Taken as a whole, the combined pain, suffering, loss of productivity and unrealised hopes and dreams are our world’s burden of disease !
• In other words, the burden of disease is a measurement of the gap between the current health of a population and an ideal scenario where everyone completes their full life expectancy in full health
• The Global Burden of Disease project attempts to measure this total disease burden
What is GBD? - 2
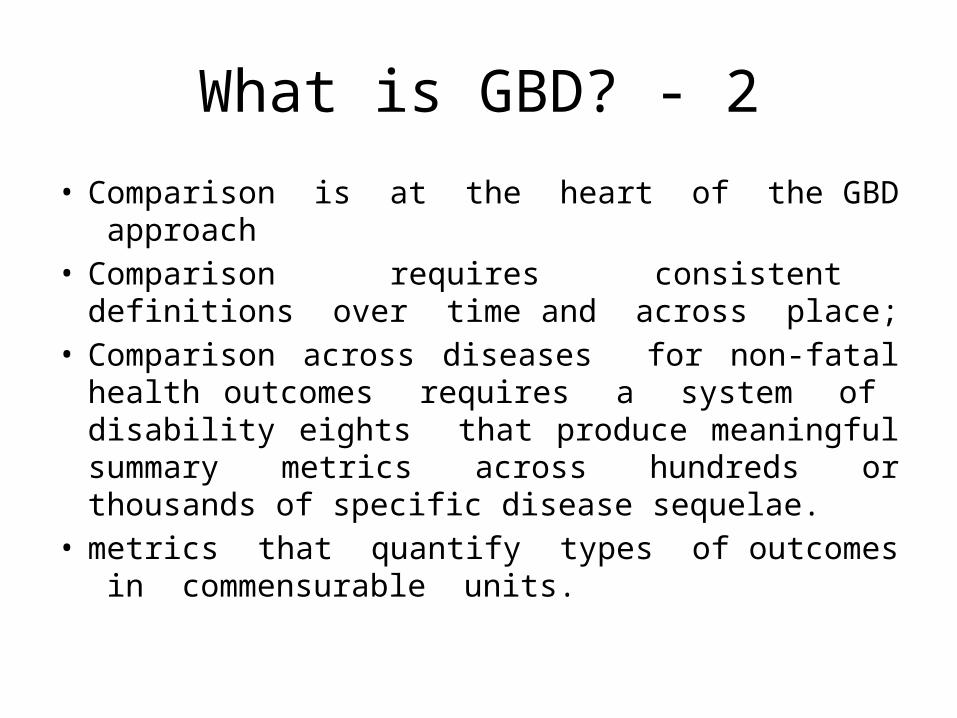
• Comparison is at the heart of the GBD approach• Comparison requires consistent definitions over
time and across place; • Comparison across diseases for non-fatal health
outcomes requires a system of disability eights that produce meaningful summary metrics across hundreds or thousands of specific disease sequelae.
• metrics that quantify types of outcomes in commensurable units.

What is GBD? - 3
• One needs estimates for all diseases, injuries, and risk factors, not just those for which there are the best data in a place
• Poorly studied health problems may in fact be some of the most important in some places and neglected because no one has collected good data in the past
• All age-groups are included in the GBD so that comparisons across age and sex groups are also a key advantage
What is GBD? - 4
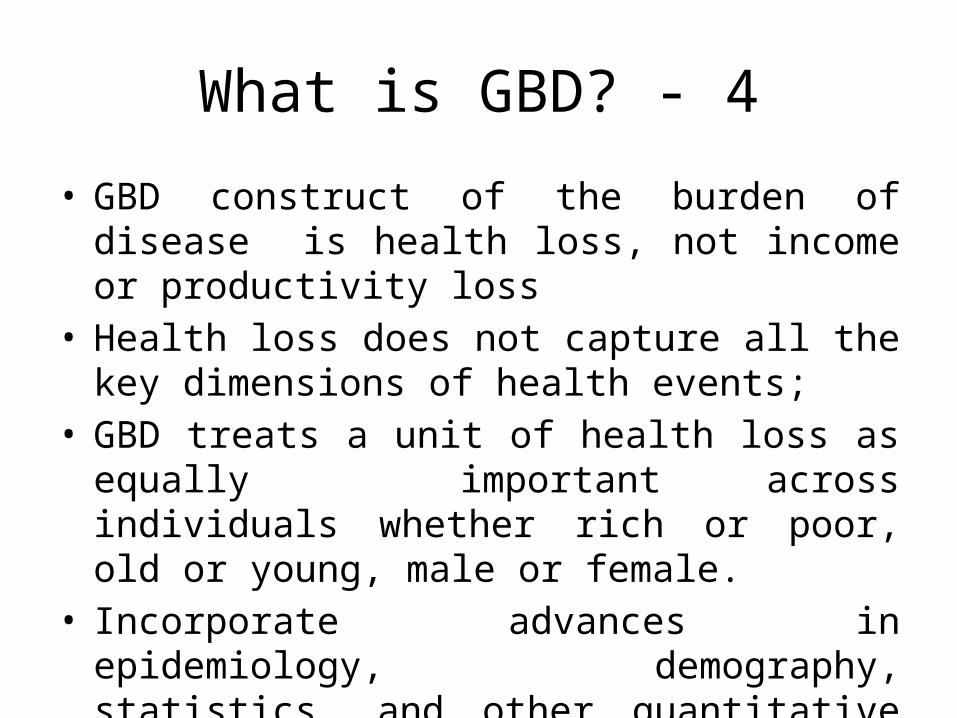
• GBD construct of the burden of disease is health loss, not income or productivity loss
• Health loss does not capture all the key dimensions of health events;
• GBD treats a unit of health loss as equally important across individuals whether rich or poor, old or young, male or female.
• Incorporate advances in epidemiology, demography, statistics, and other quantitative disciplines.
• Completely revamped and improved tools.
What is GBD? - 5
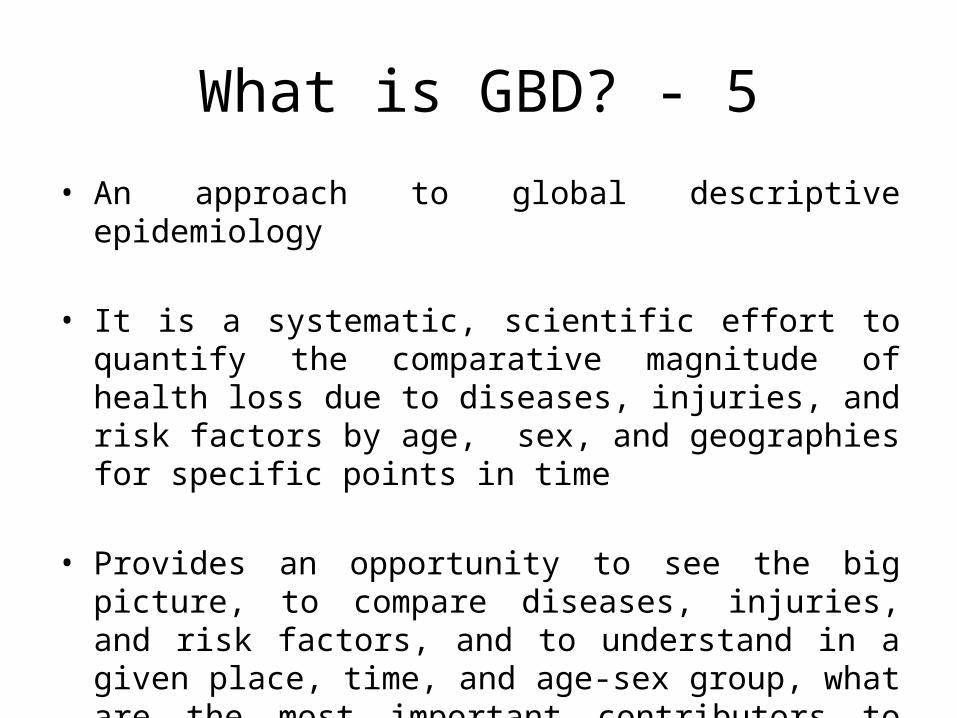
• An approach to global descriptive epidemiology
• It is a systematic, scientific effort to quantify the comparative magnitude of health loss due to diseases, injuries, and risk factors by age, sex, and geographies for specific points in time
• Provides an opportunity to see the big picture, to compare diseases, injuries, and risk factors, and to understand in a given place, time, and age-sex group, what are the most important contributors to health loss.

10
GBD 2010 Team486 authors from 302 institutions in 50 countries
Seven institutions: IHME as the coordinating center, the University of Queensland, the Harvard School of Public Health, the Johns Hopkins Bloomberg School of Public Health, the University of Tokyo, Imperial College London, and the World Health Organization.
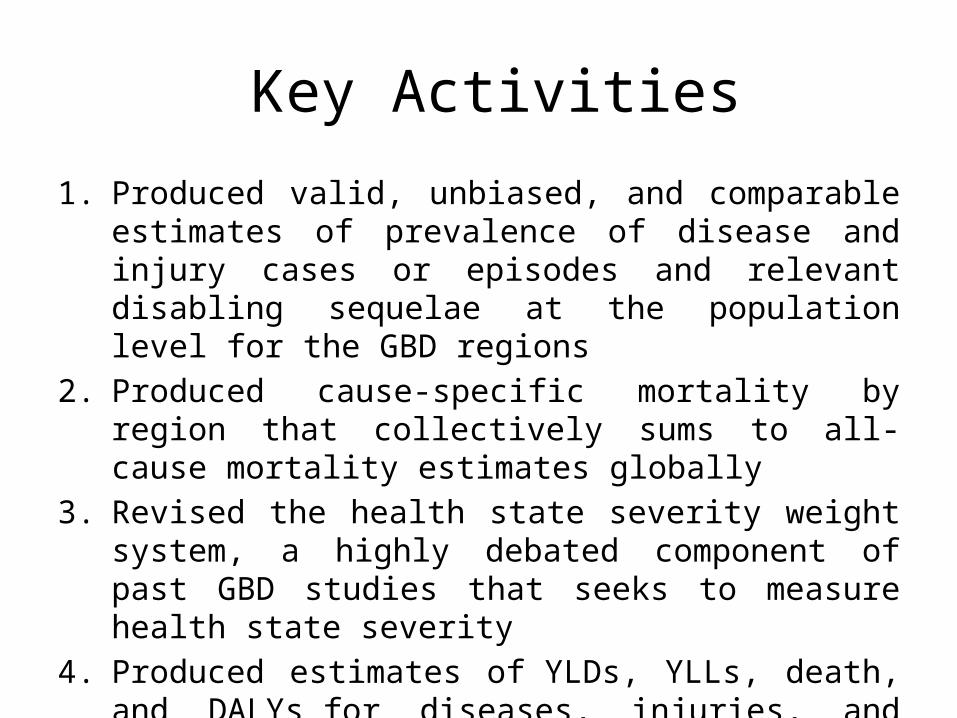
Key Activities
1. Produced valid, unbiased, and comparable estimates of prevalence of disease and injury cases or episodes and relevant disabling sequelae at the population level for the GBD regions
2. Produced cause-specific mortality by region that collectively sums to all-cause mortality estimates globally
3. Revised the health state severity weight system, a highly debated component of past GBD studies that seeks to measure health state severity
4. Produced estimates of YLDs, YLLs, death, and DALYs for diseases, injuries, and risk factors for 21 regions for 20 age groups and both sexes, for 1990, 2005, and 2010
12
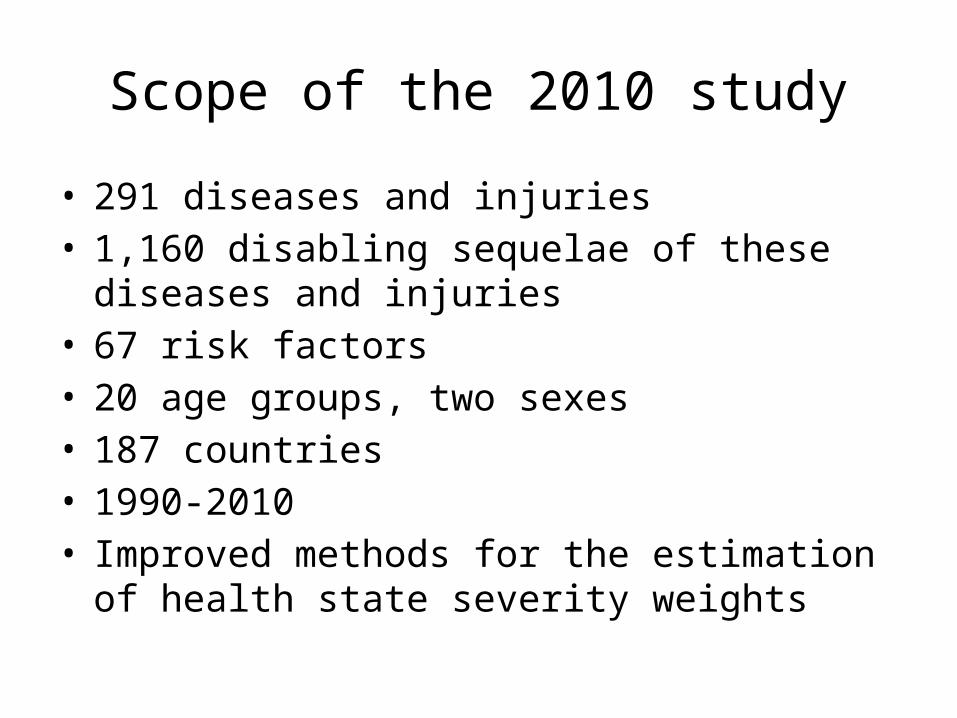
Scope of the 2010 study• 291 diseases and injuries• 1,160 disabling sequelae of these diseases and
injuries• 67 risk factors• 20 age groups, two sexes• 187 countries• 1990-2010• Improved methods for the estimation of health state
severity weights
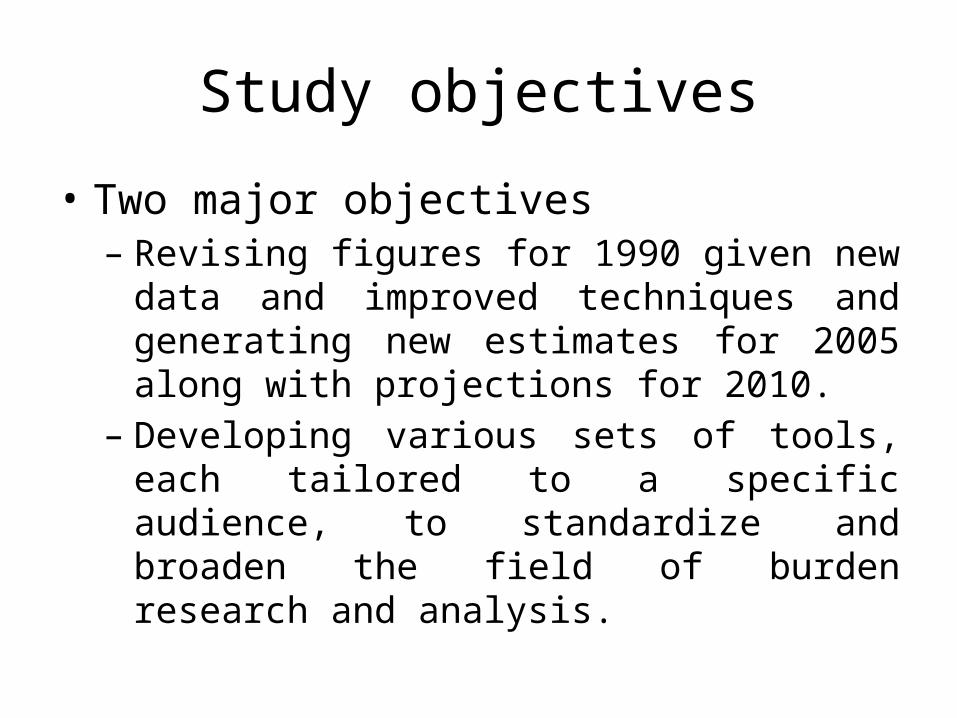
Study objectives
• Two major objectives– Revising figures for 1990 given new data and
improved techniques and generating new estimates for 2005 along with projections for 2010.
– Developing various sets of tools, each tailored to a specific audience, to standardize and broaden the field of burden research and analysis.
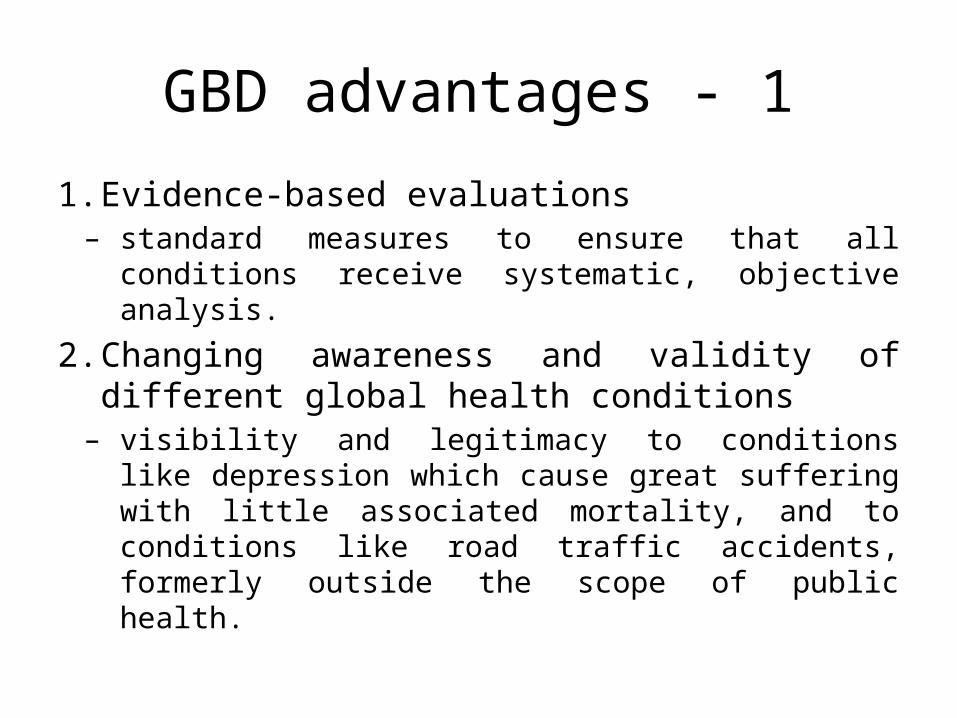
GBD advantages - 1
1. Evidence-based evaluations– standard measures to ensure that all conditions
receive systematic, objective analysis.
2. Changing awareness and validity of different global health conditions– visibility and legitimacy to conditions like
depression which cause great suffering with little associated mortality, and to conditions like road traffic accidents, formerly outside the scope of public health.
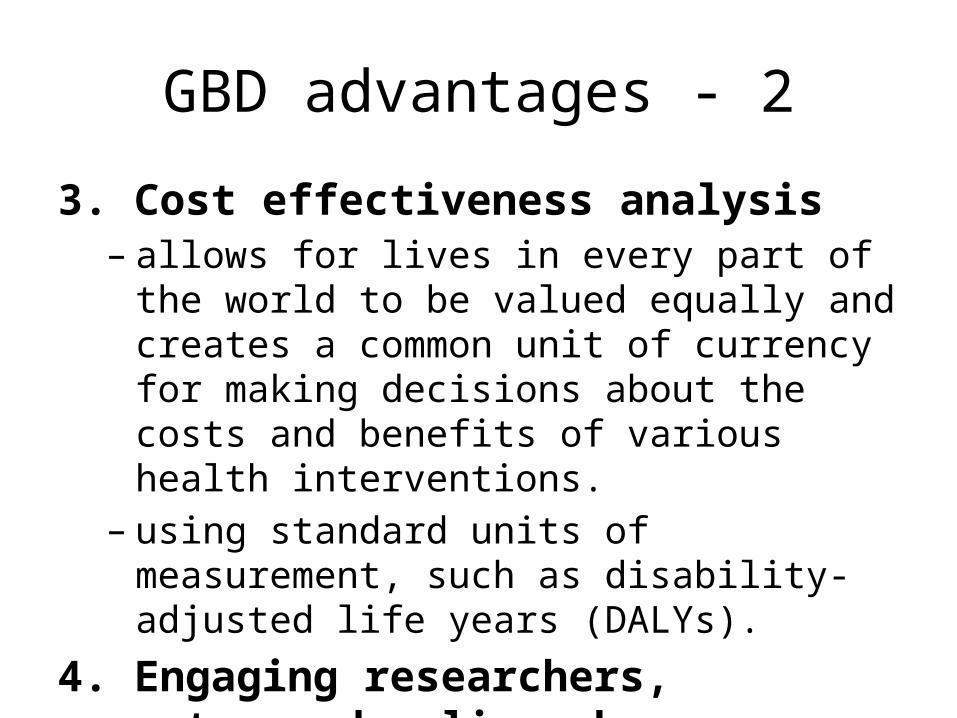
GBD advantages - 2
3. Cost effectiveness analysis– allows for lives in every part of the world to be
valued equally and creates a common unit of currency for making decisions about the costs and benefits of various health interventions.
– using standard units of measurement, such as disability-adjusted life years (DALYs).
4. Engaging researchers, experts, and policymakers
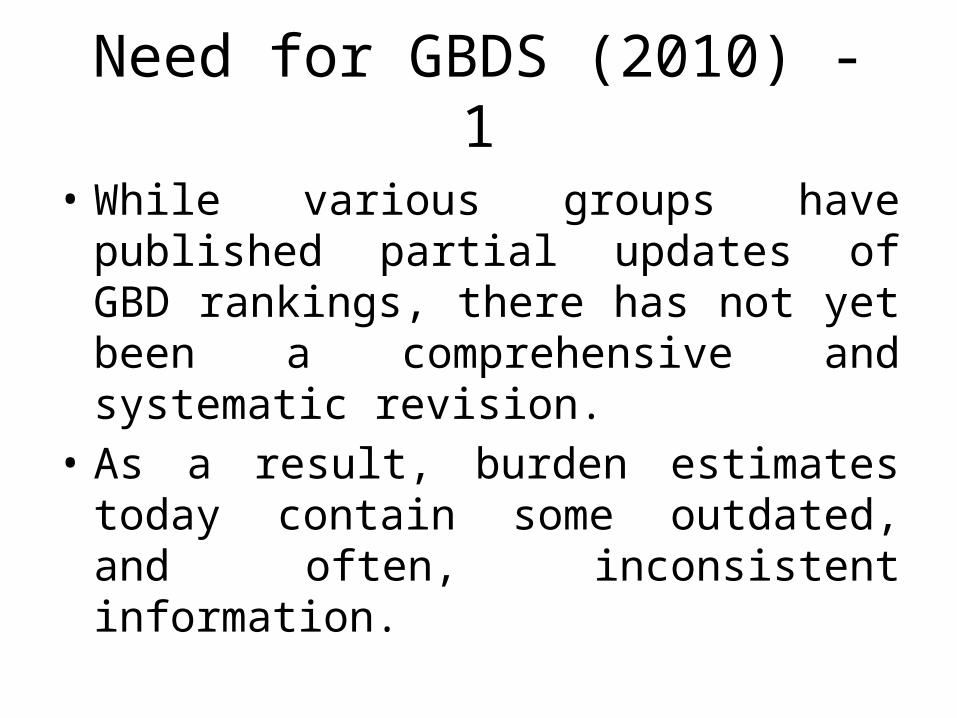
Need for GBDS (2010) - 1
• While various groups have published partial updates of GBD rankings, there has not yet been a comprehensive and systematic revision.
• As a result, burden estimates today contain some outdated, and often, inconsistent information.
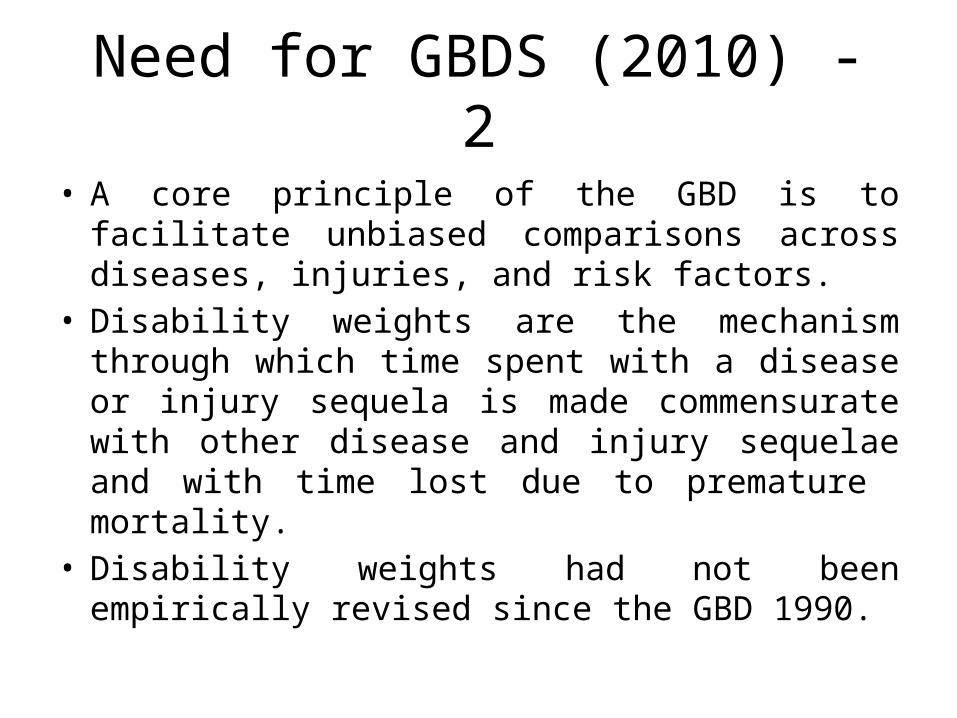
Need for GBDS (2010) - 2
• A core principle of the GBD is to facilitate unbiased comparisons across diseases, injuries, and risk factors.
• Disability weights are the mechanism through which time spent with a disease or injury sequela is made commensurate with other disease and injury sequelae and with time lost due to premature mortality.
• Disability weights had not been empirically revised since the GBD 1990.
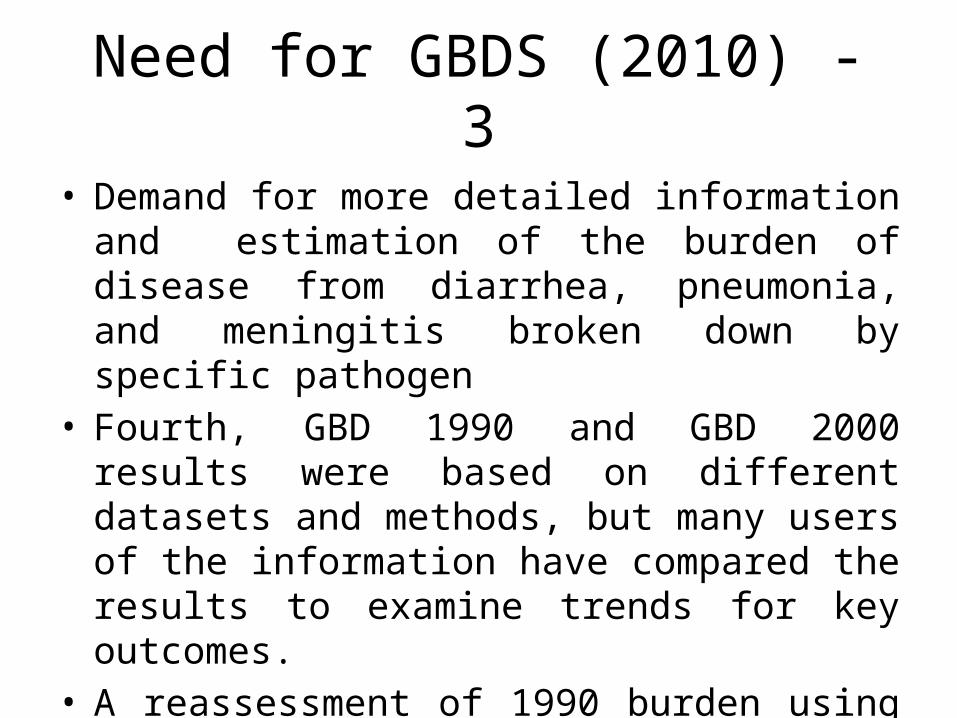
Need for GBDS (2010) - 3
• Demand for more detailed information and estimation of the burden of disease from diarrhea, pneumonia, and meningitis broken down by specific pathogen
• Fourth, GBD 1990 and GBD 2000 results were based on different datasets and methods, but many users of the information have compared the results to examine trends for key outcomes.
• A reassessment of 1990 burden using strictly comparable methods to the current time period was needed
Need for GBDS (2010) - 4
• Methods innovation across the spectrum from mortality measurement, cause of death analysis, and meta-regression for epidemiological synthesis provided opportunities to modernize the GBD approach
• Combined with a global movement towards enhanced transparency and access to data, the empirical basis for assessing the epidemiology of diseases is much richer than in the past

Methods
Disease and injury causes, sequelae, and health states
• Cause list has a hierarchical structure• At each cause level, the list provides a set of mutually
exclusive and collectively exhaustive categories• Added causes on the basis of three criteria:
potentially large, health policy interest, feasibility of measurement.
• Four levels of diseases and injuries and a fifth level for sequela,
Causes, sequelae, and health states - 1
• The four levels provide different degrees of disaggregation of the causes:
• Three level 1 causes, 21 level 2 causes, 155 level 3 causes, and 112 level 4 causes
• Of the level 3 causes 129 have no level 4 causes below them in the hierarchy;
• At the most disaggregated level there are, therefore, 241 mutually exclusive and collectively exhaustive causes
• The three level 1 causes are communicable, maternal, neonatal, and nutritional disorders; non-communicable diseases; and injuries.
Causes, sequelae, and health states - 2
• List of sequelae is designed to capture the direct consequences of disease or injury that are not otherwise captured elsewhere in the cause list
• Number of sequelae evaluated has increased for all three broad cause groups, leading to 1,160 in total
• A given outcome only appears once in the cause sequela list to avoid double counting
Causes, sequelae, and health states - 3
• For the GBD 2010 an important innovation has been to identify which disease sequelae are common across conditions; these common disease sequelae are called health states
• Shorter list of health states which facilitates the disability weight measurement component of the study
• For each of the health states, a lay description was developed for use in the empirical assessment of disability weights
Disease and injury ranking list• Because the leading causes of burden tend to have some influence
on the perception of disease control priorities, the choice of aggregation is at once important
• Provides information at the second level cause (21 causes)• A ranking list with 176 causes selected to distinguish and cluster
conditions together that may have programmatic or public health significance
• Results in the tables are provided for all 291 causes; the ranking list is used only for the leading cause figures
• The 176 causes along with the excluded residual categories are also mutually exclusive and collectively exhaustive
Risks rather than specific diseases• An alternative way of looking at ill health is to consider risks for disease
rather than diseases themselves• A risk is defined as the probability of an adverse health outcome or a
factor that raises this probability• A single risk factor may underlie several diseases; e.g. unsafe sex is a risk
for HIV/AIDS, many other sexually transmitted diseases and teenage pregnancy
• It is often more useful to direct health interventions against risks rather than specific diseases
• DALYs have been assigned to health risks as well as diseases

Risk factor list
• Comparative Risk Assessment 2000 list of 26 risk factors and subtracted and added risk factors based on consideration of four criteria:
• Convincing or probable evidence on relative risks by cause, sufficient data to estimate exposure by region, potential size of the attributable burden of disease, and the extent to which burden is modifiable
• A hierarchy with three levels
Risk factor list
• Level 1 risks – Groups of risk factors that are related by mechanism,
biology, or potential policy intervention. • Most risks are presented at level 2, but in some
cases, such as occupational carcinogens calculations, are done at a third level
• The category diet and physical inactivity clusters together some key behavioral risks. This category has been substantially expanded to include 14 components of diet.

Risk factor list
• For some of the level 1 clusters of risk factors, there are analytical challenges for computation related to risk factors that operate through each other.
• The problem of mediation is particularly challenging for the physiological risks. For example, BMI operates in part through blood pressure and cholesterol changes.
• In this analysis, we have not been able to estimate this level 1 risk factor, so that results are presented for only 67 of the 69 risks or clusters of risks
• As with diseases and injuries, we have identified a list of 43 risk factors for use in developing tables and figures of leading causes of risk factors.

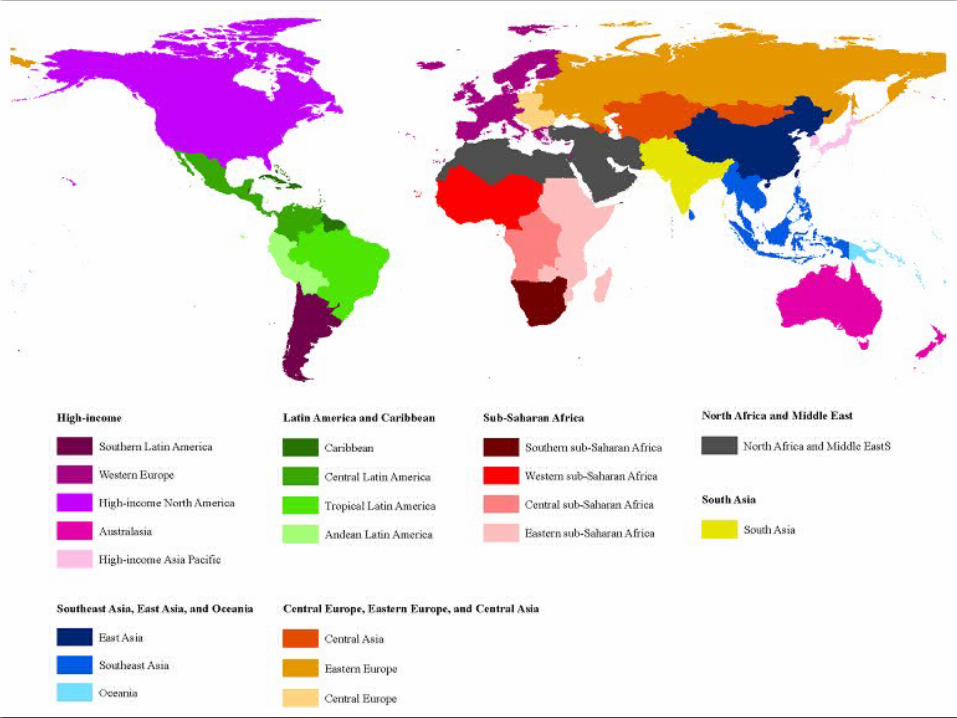
Regions
• Basis of two criteria – Epidemiological homogeneity and geographic contiguity
• Maximize the between-region variance in outcomes and minimize the within-region variance in outcomes
• The process was iterative based on examination of levels of under-5 mortality and adult mortality (as measured by the probability of death between ages 15 and 60)
• 21 regions were made. • For some types of analysis, created seven super-regions• For some Bayesian estimation procedures used in the
analysis, super-regions are useful in the presence of sparse data.
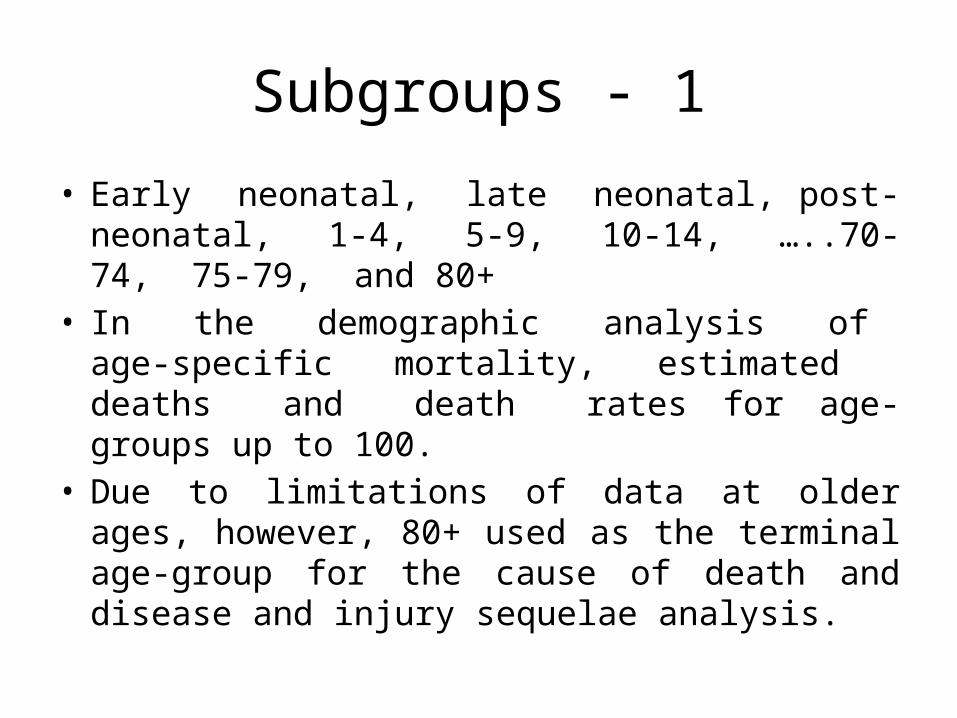
Subgroups - 1
• Early neonatal, late neonatal, post-neonatal, 1-4, 5-9, 10-14, …..70-74, 75-79, and 80+
• In the demographic analysis of age-specific mortality, estimated deaths and death rates for age-groups up to 100.
• Due to limitations of data at older ages, however, 80+ used as the terminal age-group for the cause of death and disease and injury sequelae analysis.
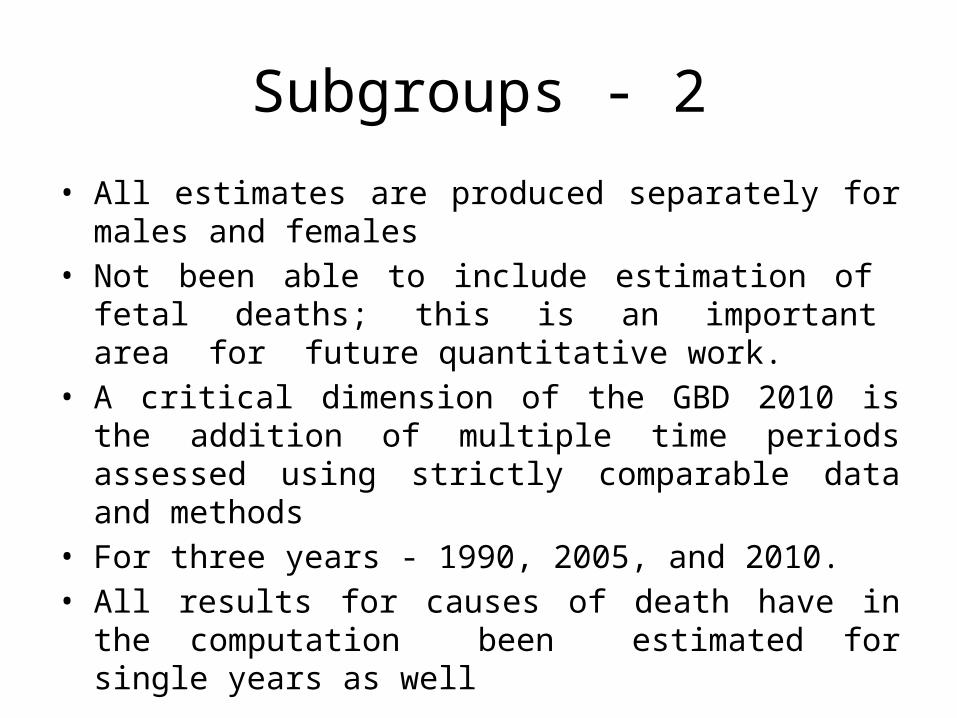
Subgroups - 2
• All estimates are produced separately for males and females• Not been able to include estimation of fetal deaths; this is
an important area for future quantitative work.• A critical dimension of the GBD 2010 is the addition of
multiple time periods assessed using strictly comparable data and methods
• For three years - 1990, 2005, and 2010. • All results for causes of death have in the computation been
estimated for single years as well
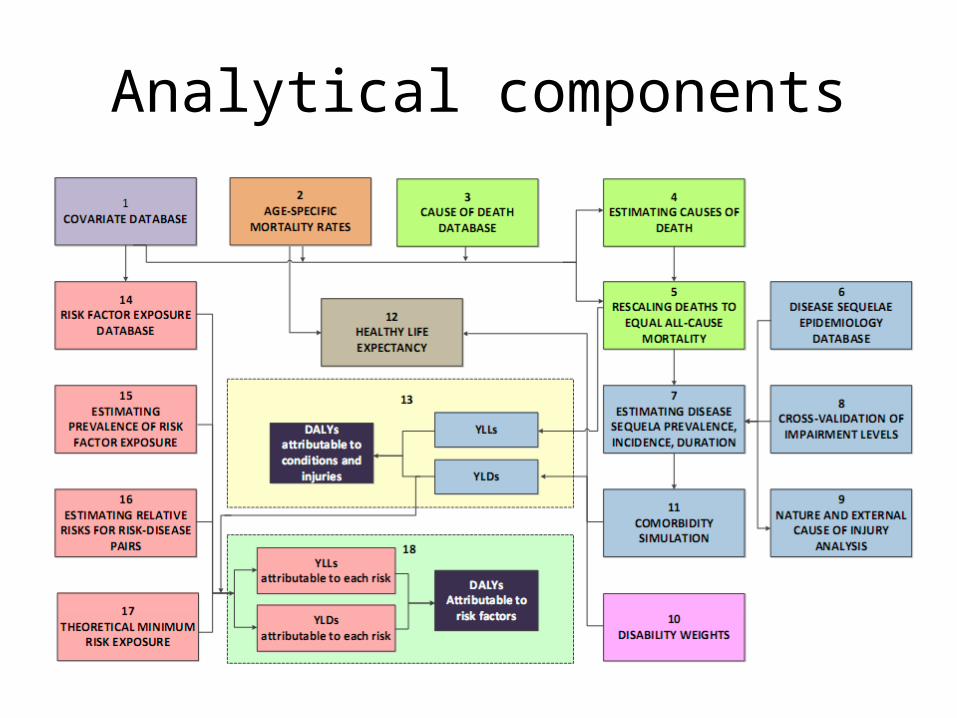
Analytical components
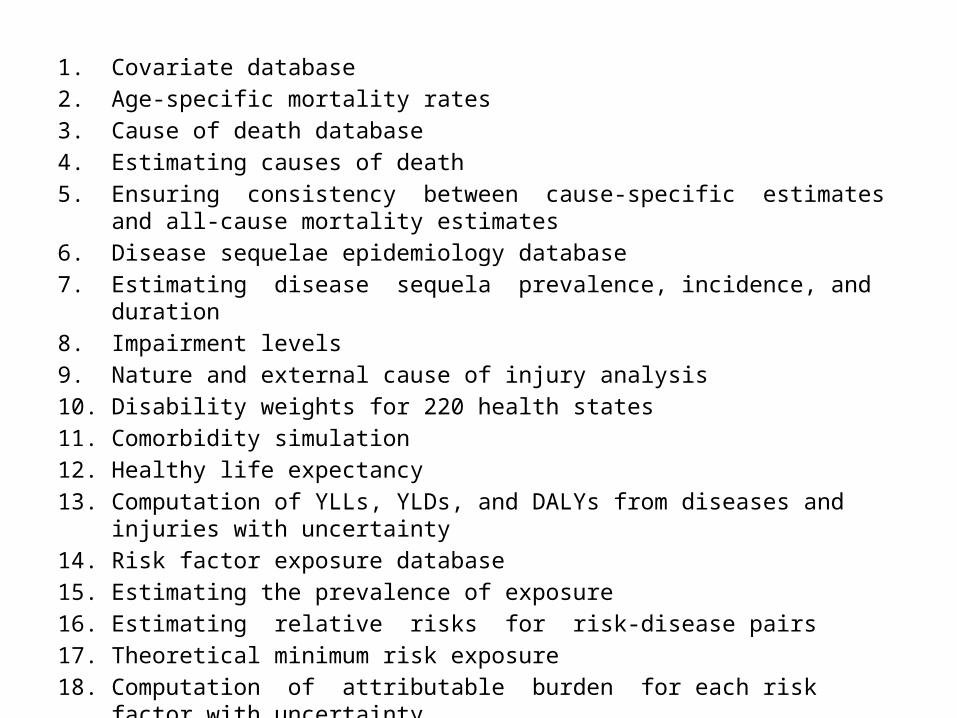
1. Covariate database2. Age-specific mortality rates3. Cause of death database4. Estimating causes of death5. Ensuring consistency between cause-specific estimates and all-cause mortality
estimates6. Disease sequelae epidemiology database7. Estimating disease sequela prevalence, incidence, and duration8. Impairment levels9. Nature and external cause of injury analysis10. Disability weights for 220 health states11. Comorbidity simulation12. Healthy life expectancy 13. Computation of YLLs, YLDs, and DALYs from diseases and injuries with uncertainty 14. Risk factor exposure database 15. Estimating the prevalence of exposure 16. Estimating relative risks for risk-disease pairs 17. Theoretical minimum risk exposure 18. Computation of attributable burden for each risk factor with uncertainty
Covariate database
• In settings where there are sparse data or conflicting data from multiple sources
• This estimation task is facilitated by the use of appropriate covariates that can be used as independent variables in the modeling process
• A database of 84 covariate topic areas and 179 variants of the covariates has been developed for this purpose
• Missing data in covariates have been addressed using spatial-temporal regression and Gaussian process regression (GPR)
Age-specific mortality rates
• Complete re-analysis of the evidence on levels of age-specific mortality has been undertaken for 187 countries from 1970 to 2010
• This re-analysis takes advantage of improvements in demographic estimation methods for various types of data on child and adult mortality
• All available data on child and adult mortality have been combined into a time series of best estimates
Cause of death database
• Information on causes of death comes primarily from vital registration systems and verbal autopsy studies
• IHME has systematically created a cause of death database spanning the period 1980 to 2010, including mapping data across various revisions and national variants of the ICD
• Algorithms have also been developed and applied to deal with the problem of ill-defined coding in vital registration and verbal autopsy data where deaths are assigned to unknown causes, intermediate causes, or immediate causes of death rather than the underlying cause of death
Estimating causes of death• For 133 of 235 causes, cause of death ensemble modeling (CODEm)
used as the primary strategy to develop cause-specific estimates;• Three key aspects to this approach
– To develop and test a diverse set of plausible models instead of a single analyst-preferred model;
– To objectively test the prediction performance of these models by holding out some of the data from the analysis and then comparing model prediction to the held out data
– In the CODEm approach, predictions for the GBD are based on a pool of the best models.
• For some sub-causes, such as diarrhea etiologies, HIV/AIDS, and for some causes that rarely cause death, alternative methods have been used
Ensuring consistency between cause-specific estimates and all-cause mortality estimates
• Cause of death estimation proceeds in two stages. – First, models are developed for each cause of
death in isolation– Second, the estimates for each cause are combined
into estimates for all causes simultaneously that sum to the demographic estimates of all-cause mortality.
• This simple algorithm leads to greater change in the estimates for more uncertain causes

Disease sequelae epidemiology database
• To support estimation for each region of disease sequelae incidence, prevalence, duration, remission, and excess mortality, a database of available published and unpublished data has been developed
Estimating disease sequela prevalence, incidence, and duration
• Developing estimates for disease incidence, prevalence, duration, and excess mortality estimates for 21 regions for three time periods by age and sex, a meta-regression tool was used (DisMod-MR)
• Dealing with selection bias intrinsic to some data sources, such as hospital discharges
• For some causes where more complicated models capturing more stages of disease progression are necessary, such as HIV, more elaborate natural history models were used, refined, or developed.

Impairment levels
• The impairment analysis has been undertaken for vision loss, hearing loss, anemia, infertility, heart failure, intellectual disability, and epilepsy
• In these cases, the quality and extent of data on the overall impairment level have been determined to be stronger than on disease specific impairments.
Nature and external cause of injury analysis
• Dual nature of injury assessment. Each injury can be characterized by the nature of injury such as a femur fracture or head trauma and the external cause of injury such as a road injury or a fall.
• To assess disability, data is required on the frequency of the nature of injury as well as follow-up data on reduced health functioning at certain points in time after the injury.
• capture data on the matrix between the nature of injury incidence and the external causes leading to these injuries
• first time included survey data on the incidence of external causes and, perhaps more importantly, multiple sources of long-term follow-up data to estimate the fraction of individuals with each nature of injury progressing to permanent disability
Disability weights for 220 health states
• Disability weights are the key mechanism in the GBD approach through which disease and injury sequelae are made comparable with each other and with time lost due to premature mortality.
• we have switched to the construct of disability weights for health states as assessed by the general public.
• To achieve this, simple lay descriptions of the 220 unique health states across the 1,160 disease and injury sequelae were developed.
• Disability weights were assessed using general population surveys in five countries to capture a diverse set of views and through an Internet survey.
• Disability weights were elicited using pairwise comparisons where the respondent is asked to identify which health state represents a higher level of health.

Comorbidity simulation
• Combinations of these sequelae change the likely health experience of the individual.
• Comorbidity is taken into account in three stages. – First, for each age-sex group, a micro-simulation is developed to estimate the number of
individuals who will have combinations of disease conditions.
– Second, the combined disability weight for individuals with multiple conditions is estimated assuming a multiplicative model.
– Finally, the overall individual health loss captured in the disability weight is assigned to the different sequelae experienced by an individual proportionate to the disability weights of individual conditions on their own.
• The micro-simulation process is repeated for each country-age-sex-year 1000 times to propagate uncertainty in the prevalences and disability weights into the comorbidity estimates.
Healthy life expectancy• Healthy life expectancy is a single summary metric of population
health that is not affected by population age structure
• It can be thought of as equivalent to the expectation of life at birth in full health given the currently observed age-specific death rates and prevalence of disease and injury sequelae
• Used the life tables developed in component 2 for each country in 1990 and 2010, the disability weights and the output of the comorbidity simulations to estimate healthy life expectancy for 187 countries
Computation of YLLs, YLDs, and DALYs from diseases and injuries with uncertainty
• Each quantity is estimated with uncertainty by generating 1,000 draws from the posterior distribution
• Given the large number of diseases and injuries and their sequelae, this task is computationally intensive
Risk factor exposure database
• Assesses the attributable burden of disease using four components: – Database on risk factor exposure, – Estimating the prevalence of risk factor exposure by age
and sex– Relative risk for a specific disease, – Counterfactual distribution of risk exposure called the
theoretical minimum risk distribution.
Estimating the prevalence of exposure
• Exposure estimates have been developed for many risks using the GBD Bayesian meta-regression tool, DisMod-MR
• Related Bayesian methods have been used in published analyses for the metabolic risks
• For some risks, alternative modeling strategies have been used
Estimating relative risks for risk-disease pairs
• For each risk-disease pair, relative risks for specific disease outcomes have been taken from published meta-analyses or updated meta-analyses that have been undertaken as part of this study.
• Special analyses have been undertaken for water and sanitation, all sources of particulates less than 2·5 microns, and the components of diet

Theoretical minimum risk exposure
• The tradition in risk factor epidemiology is to assess attributable burden by estimating a counterfactual scenario where exposure to a risk factor in the past is set to a counterfactual distribution
• Following the framework for comparative risk assessment, counterfactuals are set to the lowest risk distribution that has been observed or is theoretically possible – the theoretical minimum risk exposure distribution (TMRED)
Computation of attributable burden for each risk factor with uncertainty
• Risk factor burden is assessed using the distributions of burden for each disease associated with a risk factor
• Uncertainty from the prevalence of exposure, relative risks, and where appropriate the TMRED, are all propagated into the final risk factor uncertainty
Five critical choices
• New standard reference life table• Comorbidity• Incidence versus prevalence• Discounting for time• Age-weighting
New standard reference life table - 1
• The standard reference life table for the GBD 1990 was based on the highest observed life expectancy at the time, Japanese females with a life expectancy at birth close to 82·5 years
• Given the progress in extending life expectancy in the last 20 years, it is appropriate to extend the normative goal for life expectancy
• Developed a new reference standard life table by identifying the lowest observed death rate for any age-group in countries with more than five million in population

New standard reference life table - 2
• At the Critical Ethical Choices for DALYs meeting, there was a consensus that using a different standard for males and females was inappropriate
• First, the empirically observed gap in life expectancy between males and females continues to narrow
• Within high-income countries, the gaps between male and female life expectancies especially for the lowest mortality communities have also narrowed
• Second, there is no reason that society should have lower aspirations for health for males than females
Comorbidity
• A year of life lived with a disabling sequela such as blindness should contribute the same amount to the burden of disease regardless of whether it occurs in someone with another condition or not.
• Critical Ethical Choices for DALYs meeting viewed that burden should be assessed individual by individual. Individuals with the same functional health loss should be treated as like regardless of whether that functional health loss came from one or several contributing conditions.
Incidence versus prevalence• Two types of DALYs were calculated in the GBD 1990: prevalence DALYs and
incidence DALYs. • Murray argued that the incidence perspective had two advantages: mortality
rates used to compute YLLs are by definition incidence rates; using incidence for YLDs means that both non-fatal and fatal outcomes are analyzed in a consistent fashion.
• several disadvantages - individuals living with reductions in health functioning who need health and other social services may not be reflected in burden estimates if incidence has declined substantially.
• If the incidence of ischemic heart disease is designated to start with plaque formation or detectable myocardial ischemia will profoundly change the number of discounted YLDs. This arbitrariness to the construct of when a disease process starts is not present in a prevalence perspective.
• incorporation of comorbidity is more straightforward in a prevalence approach than an incidence approach.
• Incidence approach - information intensive and computationally challenging.
Discounting for time
• Anand and Hanson argued that there was no intrinsic reason to value a year of health as less important simply because it is in the future
• One cannot expect that the value of a year of healthy life to society will be less in the future;
• There is no expectation of declining marginal utility of years of healthy life
• Chosen to compute the base case of DALYs for the with a discount rate of 0%
Age-weighting
• Some have argued that deaths at particularly young ages or even fetal death represents less of a loss of health because individuals do not have fully developed life plans
• “the well-being of some age groups is instrumental in making society flourish; therefore, collectively we may be more concerned with improving health status for individuals in these age groups”
• We recognize, however, that there is still an important set of issues about social priority that should be attached to preventing fetal death compared to death after a live birth that have not been addressed here

Results overview

66
The disability transition: progressive shift in burden from premature mortality to years lived with disability
1990 2010

Articles published

• All available data on causes of death for 187 countries from 1980 to 2010 from vital registration, verbal autopsy, mortality surveillance, censuses, surveys, hospitals, police records, and mortuaries
• Six different modeling strategies to estimate cause-specific mortality trends depending on the strength of the data
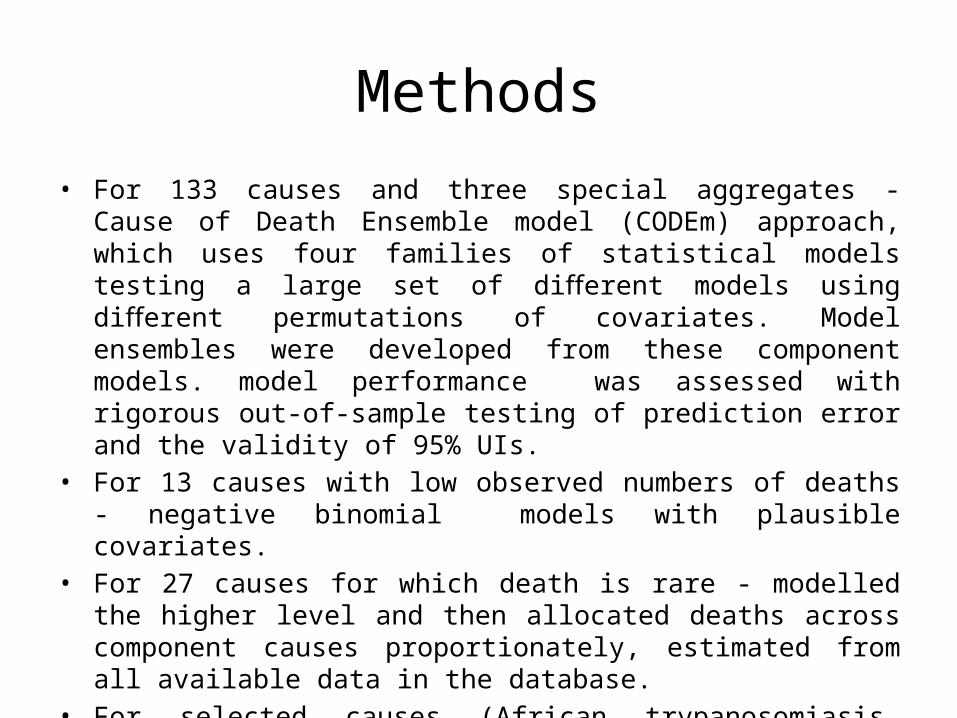
Methods• For 133 causes and three special aggregates - Cause of Death Ensemble
model (CODEm) approach, which uses four families of statistical models testing a large set of different models using different permutations of covariates. Model ensembles were developed from these component models. model performance was assessed with rigorous out-of-sample testing of prediction error and the validity of 95% UIs.
• For 13 causes with low observed numbers of deaths - negative binomial models with plausible covariates.
• For 27 causes for which death is rare - modelled the higher level and then allocated deaths across component causes proportionately, estimated from all available data in the database.
• For selected causes (African trypanosomiasis, congenital syphilis, whooping cough, measles, typhoid and parathyroid, leishmaniasis, acute hepatitis E, and HIV/AIDS), - natural history models based on information on incidence, prevalence, and case-fatality.
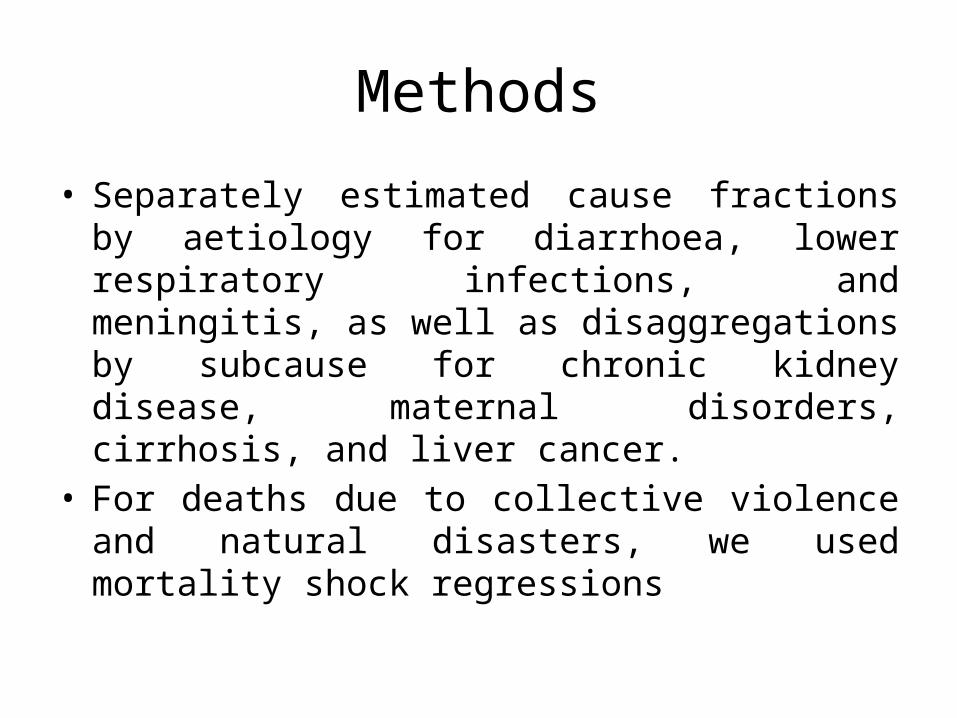
Methods
• Separately estimated cause fractions by aetiology for diarrhoea, lower respiratory infections, and meningitis, as well as disaggregations by subcause for chronic kidney disease, maternal disorders, cirrhosis, and liver cancer.
• For deaths due to collective violence and natural disasters, we used mortality shock regressions
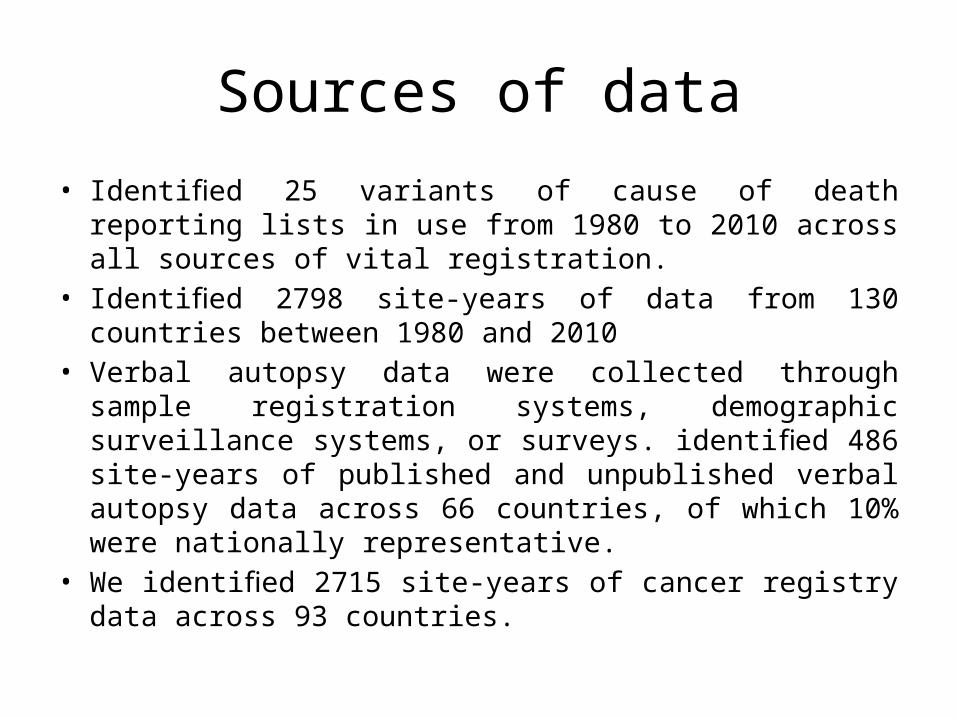
Sources of data
• Identified 25 variants of cause of death reporting lists in use from 1980 to 2010 across all sources of vital registration.
• Identified 2798 site-years of data from 130 countries between 1980 and 2010
• Verbal autopsy data were collected through sample registration systems, demographic surveillance systems, or surveys. identified 486 site-years of published and unpublished verbal autopsy data across 66 countries, of which 10% were nationally representative.
• We identified 2715 site-years of cancer registry data across 93 countries.
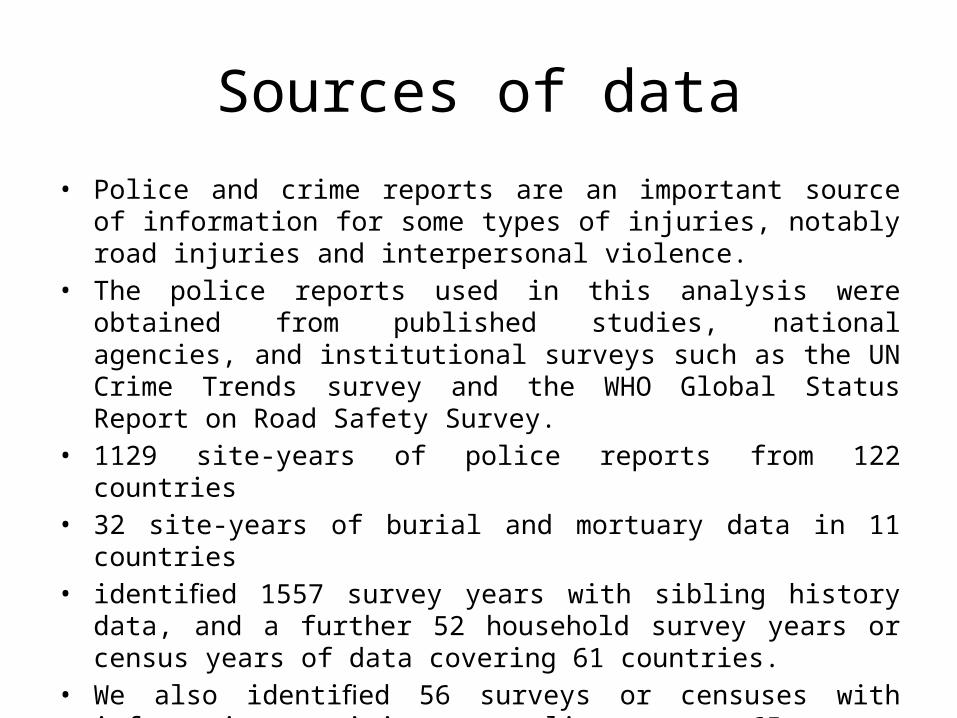
Sources of data• Police and crime reports are an important source of information for some
types of injuries, notably road injuries and interpersonal violence. • The police reports used in this analysis were obtained from published
studies, national agencies, and institutional surveys such as the UN Crime Trends survey and the WHO Global Status Report on Road Safety Survey.
• 1129 site-years of police reports from 122 countries• 32 site-years of burial and mortuary data in 11 countries• identified 1557 survey years with sibling history data, and a further 52
household survey years or census years of data covering 61 countries. • We also identified 56 surveys or censuses with information on injury
mortality across 65 survey years or census years.• identified eight countries with nationally representative maternal
mortality surveillance systems covering 83 site-years• 21 site-years of data based on deaths in health facilities.
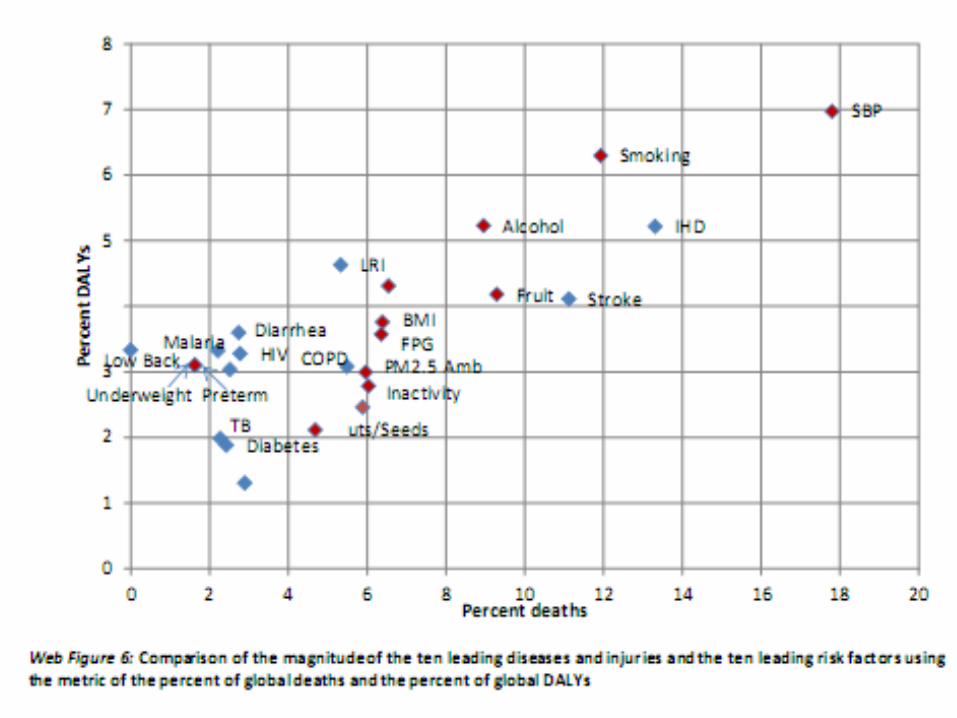
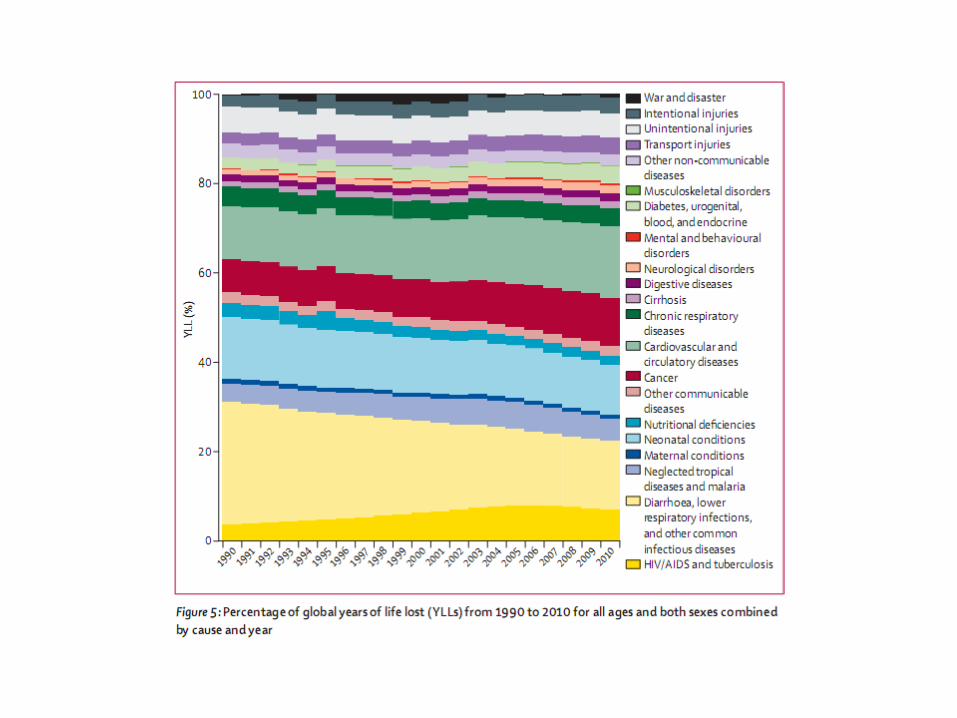
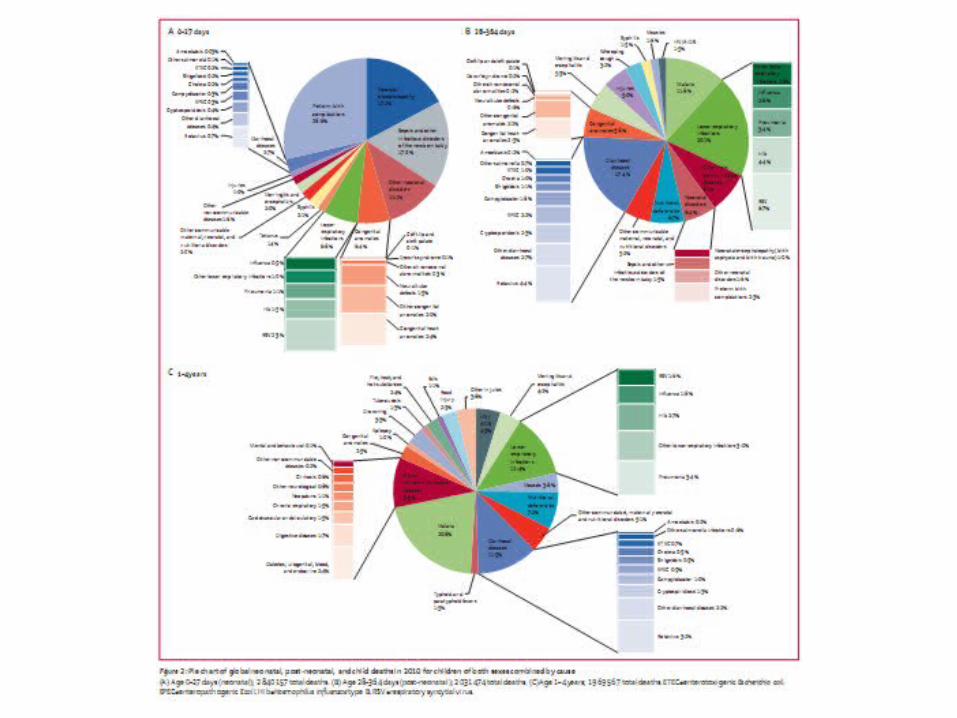
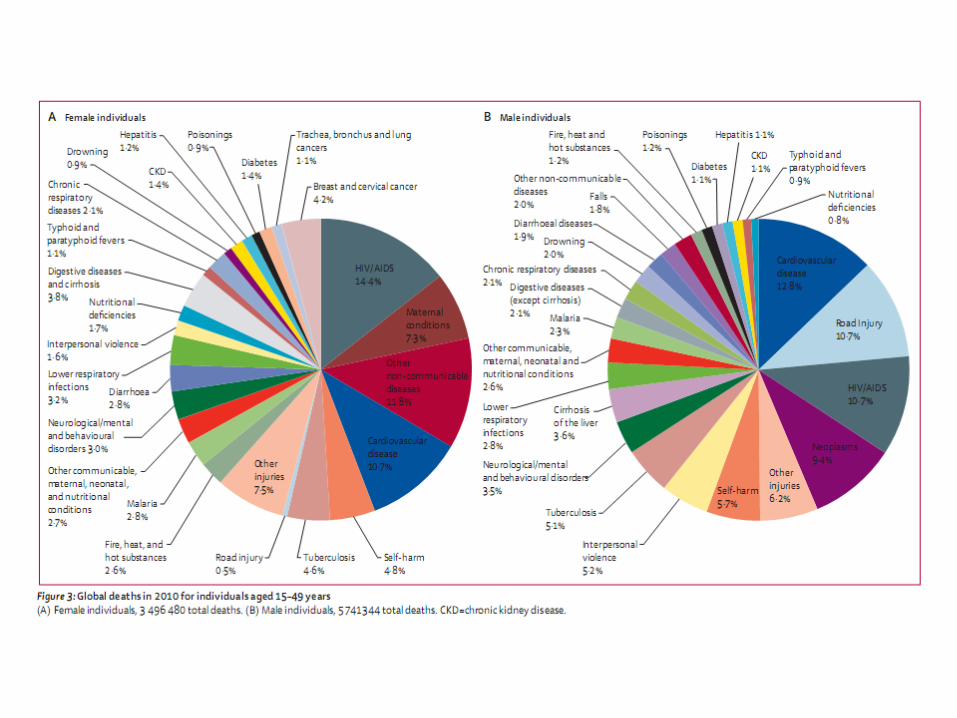
Results
• Population growth, increased average age of the world’s population, and largely decreasing age-specific, sex-specific, and cause-specific death rates combine to drive a broad shift from communicable, maternal, neonatal, and nutritional causes towards non-communicable diseases.
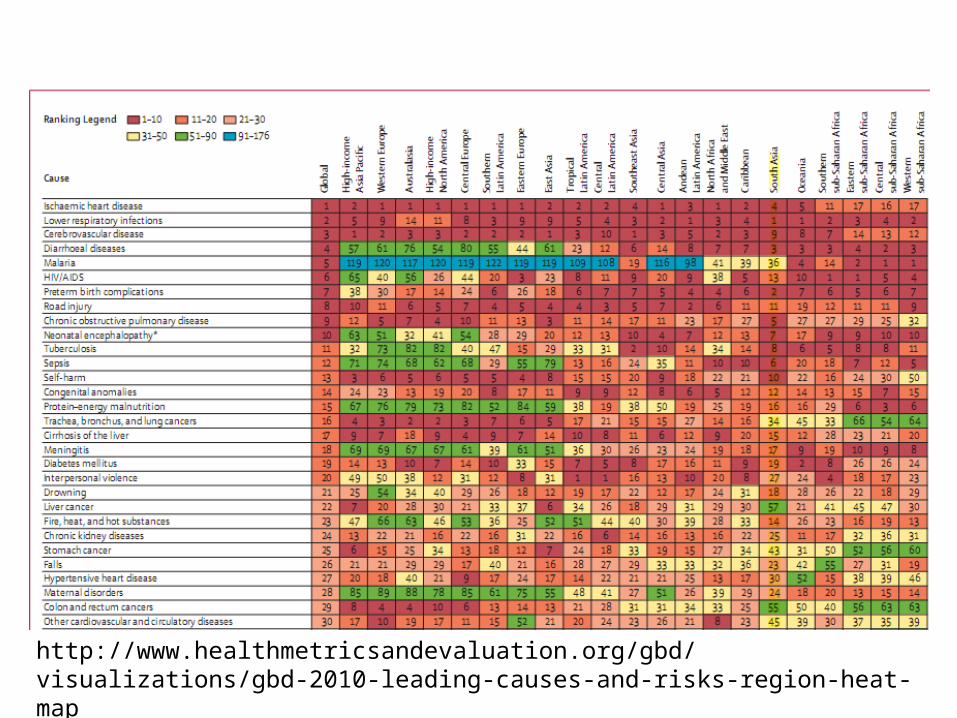
http://www.healthmetricsandevaluation.org/gbd/visualizations/gbd-2010-leading-causes-and-risks-region-heat-map

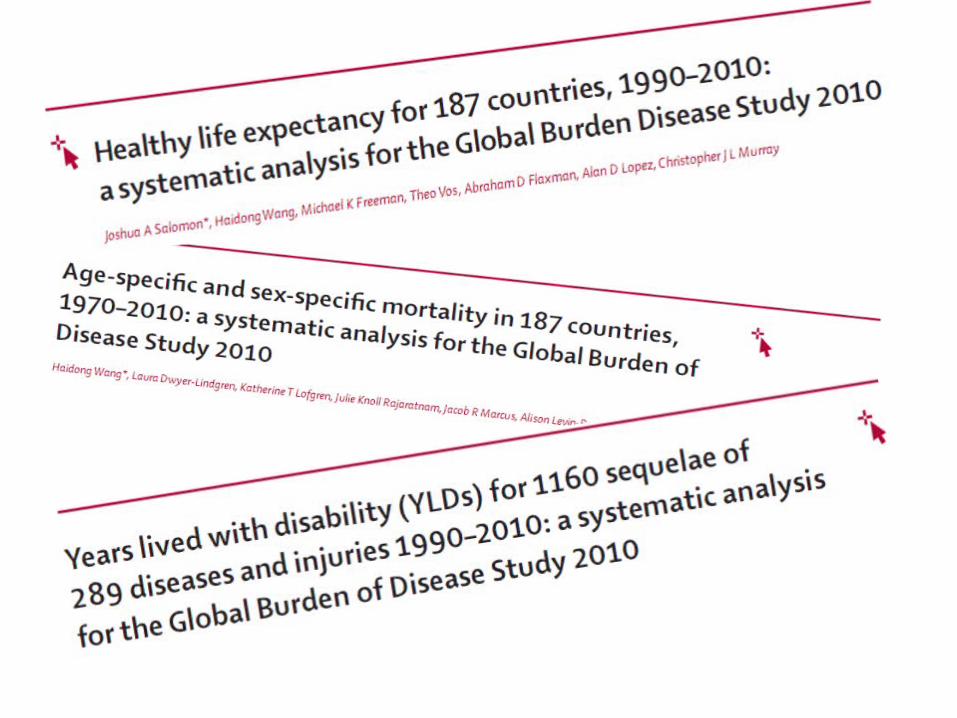
Other articles

Thank you

Basics
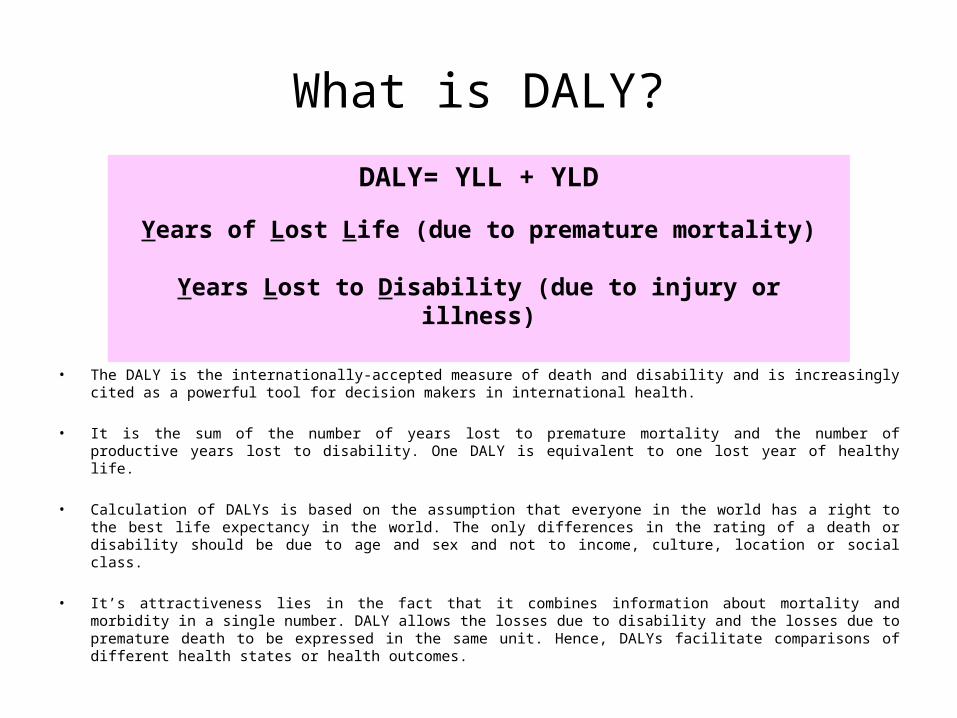
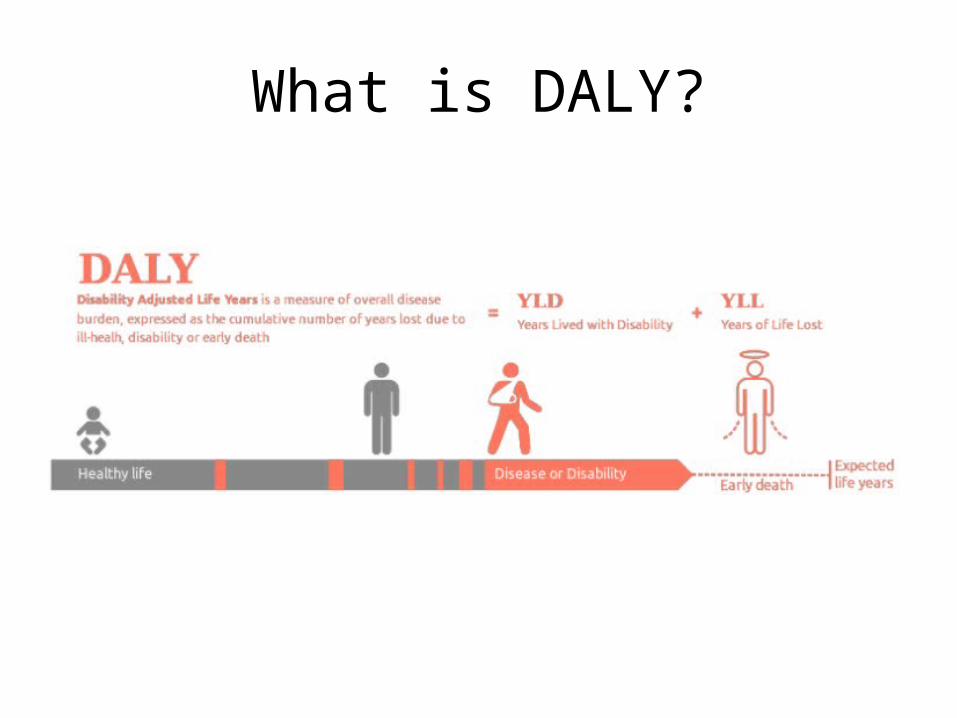
What is DALY?
• The DALY is the internationally-accepted measure of death and disability and is increasingly cited as a powerful tool for decision makers in international health.
• It is the sum of the number of years lost to premature mortality and the number of productive years lost to disability. One DALY is equivalent to one lost year of healthy life.
• Calculation of DALYs is based on the assumption that everyone in the world has a right to the best life expectancy in the world. The only differences in the rating of a death or disability should be due to age and sex and not to income, culture, location or social class.
• It’s attractiveness lies in the fact that it combines information about mortality and morbidity in a single number. DALY allows the losses due to disability and the losses due to premature death to be expressed in the same unit. Hence, DALYs facilitate comparisons of different health states or health outcomes.
DALY= YLL + YLD
Years of Lost Life (due to premature mortality)
Years Lost to Disability (due to injury or illness)
What is DALY?
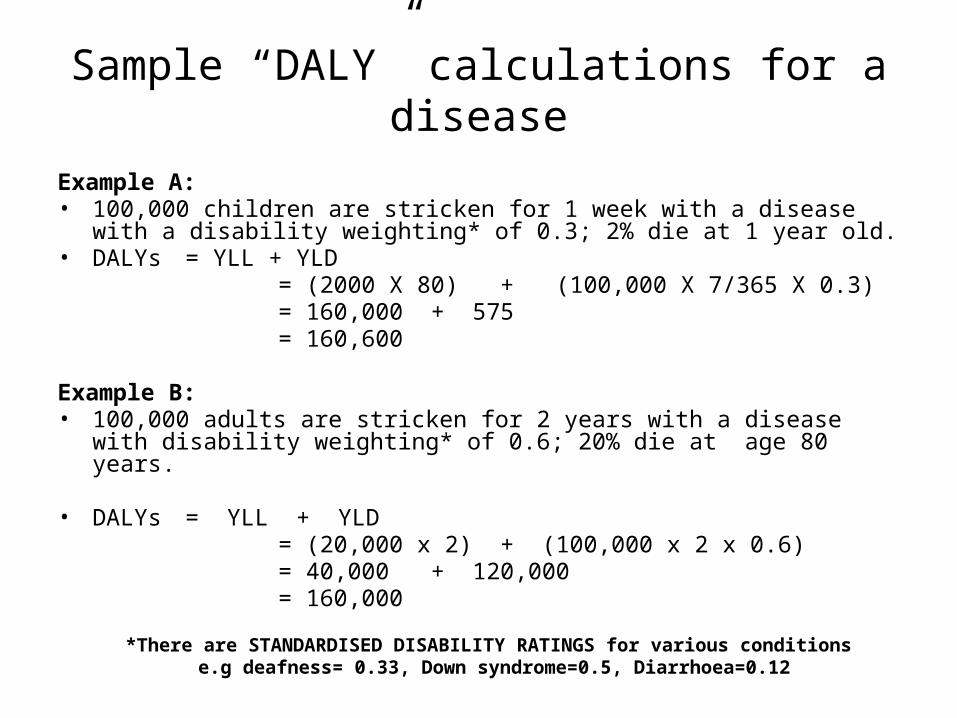
Sample “DALY” calculations for a disease
Example A:• 100,000 children are stricken for 1 week with a disease with a disability weighting*
of 0.3; 2% die at 1 year old. • DALYs = YLL + YLD = (2000 X 80) + (100,000 X 7/365 X 0.3) = 160,000 + 575 = 160,600
Example B:• 100,000 adults are stricken for 2 years with a disease with disability weighting* of
0.6; 20% die at age 80 years.
• DALYs = YLL + YLD = (20,000 x 2) + (100,000 x 2 x 0.6) = 40,000 + 120,000 = 160,000
*There are STANDARDISED DISABILITY RATINGS for various conditions e.g deafness= 0.33, Down syndrome=0.5, Diarrhoea=0.12
Why are DALYs important?DALYs attempt to provide an appropriate, balanced attention to the effects of
non-fatal as well as fatal diseases on overall health. In the absence of such assessments, conditions which cause decrements in function but not mortality tend to be neglected.
DALYs help to inform debates on priorities for health service delivery, research and planning. For example, DALYs can be used to:
• Compare the health of one population with another – and allow decision makers to focus on health systems with the worst performance
• Compare the health of the same population at different points in time
• Compare the health of subgroups within a population - to identify health inequalities

Disability weights, discounting and age weighting
• Egalitarian principles are explicitly built into the DALY metric, and the global burden of disease studies apply these to all regions of the world.
• The studies use the same "ideal" life expectancy for all population subgroups and exclude all non-health characteristics (such as race, socioeconomic status or occupation) apart from age and sex from consideration in calculating lost years of healthy life.
• Most importantly, they use the same "disability weight" for everyone living a year in a specified health state.
Disability weights, discounting and age weighting
• Disability weights – A disability weight is a weight factor that reflects the severity of
the disease on a scale from 0 (perfect health) to 1 (equivalent to death). Years Lost due to Disability (YLD) are calculated by multiplying the incident cases by duration and disability weight for the condition
• Age weighting and discounting– 3% discounting and non-uniform age weighting was used in the
original GBD 1990 study. These adjustments result in less weight given to years lived at young and older ages
– The GBD 2001-2 study used 3% discounting but uniform age weighting. GBD 2004 update used the original 3% discounting and non-uniform age weighting
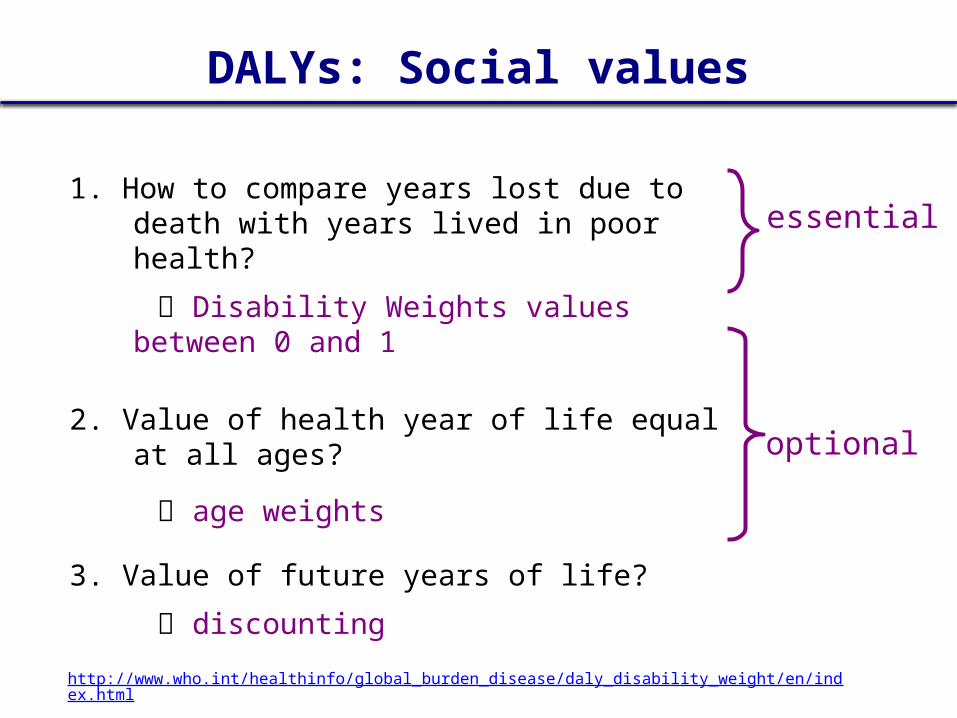
DALYs: Social values
1. How to compare years lost due to death with years lived in poor health?
Disability Weights values between 0 and 1
2. Value of health year of life equal at all ages?
age weights
3. Value of future years of life?
discounting
optional
essential
http://www.who.int/healthinfo/global_burden_disease/daly_disability_weight/en/index.html
Disability Weights
In GBD, non-fatal consequences of diseases and injuries understood as transitions through different ‘health states’
YLD calculation requires aggregate assessments of the overall decrements in health associated with particular health states disability weights
DWs are measures of overall levels of health rather than contribution of health to overall welfare
GBD1990 : DW elicited from panel of health professionals following explicit
protocol evaluating 22 indicator conditions in an intensive group exercise with ‘deliberative phase’ using person trade-off (PTO) method. Responses averaged across participants
The new DW will have a greater emphasis on paired comparisons, anchored by time trade-off methods.
It also aims to engage members of the general community (including those in developing countries) to a greater degree.
The DW project is being carried out in two stages:
a community household survey in selected regions, and an online open-access survey.
New Disability Weight Project
1. Community surveys
• (Pemba, Bangladesh, Indonesia, Peru, USA)• Cultural/SES diversity >> representativeness• Paired comparisons
2. Internet survey
• the primary source of data for the final DW• will include random(?) selections from all ~230 sequelae• open to all interested in participating (open-access• includes a variety of measurements paired comparisons, ranking,
visual analogue scale, time trade-off, population equivalence) to anchor the scale (paired comparisons, ranking, visual analogue scale, time trade-off, population equivalence)
http://gbdsurvey.org/
New Disability Weight Project
Discounting common practice in economic analyses.
Assumes that individuals value their health more now than at some point in the future. So the further in the future health loss occurs the more they are discounted. • GBD 1990 used 3% discounting
Discounting
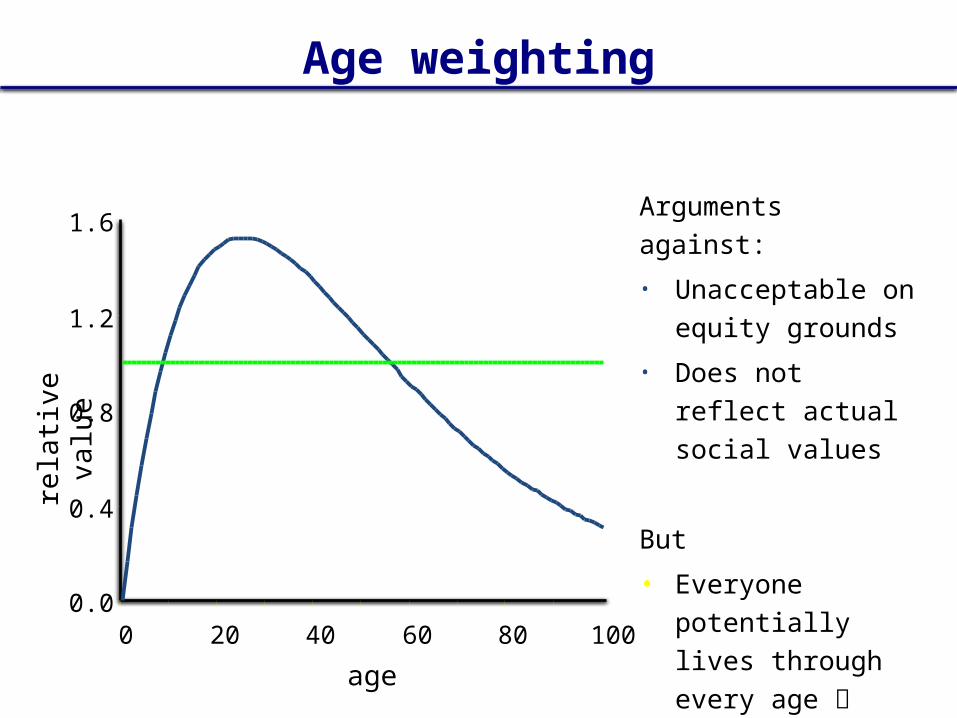
Discounting
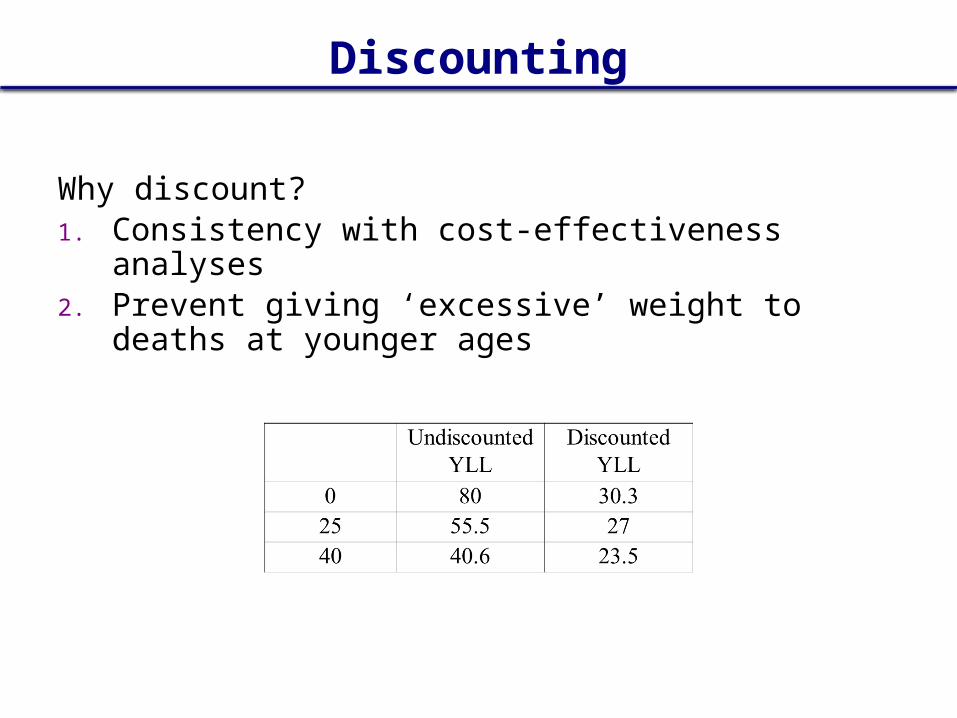
Why discount?1. Consistency with cost-effectiveness analyses2. Prevent giving ‘excessive’ weight to deaths at younger ages

Used to reflect a social preference that values a year lived by young adult more highly than that of young children or the elderly.
• Eg. An Australian survey found that respondents considered saving four 20-year olds as important as saving ten 60-year olds (Nord et al, 1996 and 1998)
Not related to productivity but ‘social’ role in caring for the young and old
Age weighting
Age weighting
0.0
0.4
0.8
1.2
1.6
0 20 40 60 80 100
age
rela
tive
valu
e
Arguments against:
• Unacceptable on equity grounds
• Does not reflect actual social values
But
• Everyone potentially lives through every age not inequitable
Source: Murray and Lopez, 2006. Chapter 5
Terminology used GBDS• Disability : Disability refers to any short-term or long-term health loss. • Sequelae :In the GBD 2010 cause list there are 291 diseases and injuries,
of which 289 cause disability. In total, 1160 sequelae of these diseases and injuries. For example, diabetic neuropathy is a sequela of diabetes mellitus. To avoid double counting, a sequela can only be counted in the cause list once even if the same outcome might be caused by more than one disease.
• Health state :Across the 1160 sequelae, 220 unique health states. For example, both malaria and hookworm have mild anaemia as a sequela. Mild anaemia is a unique health state. The list of unique health states serves two purposes: to allow assessment of the total burden of some health states such as anaemia across various causes, and to simplify the task of measuring disability weights for sequelae.
Terminology used GBDS• Disability weights : A quantification of the severity of health loss
associated with the 220 unique health states on a scale from 0 to 1, when 0 is commensurate with perfect health and 1 is commensurate with death.
• Years lived with disability (YLDs) : For the GBD 2010, YLDs per person from a sequela are equal to the prevalence of the sequela multiplied by the disability weight for the health state associated with that sequela. YLDs for a disease or injury are the sum of the YLDs for each sequela associated with the disease or injury.
• Impairments : In the GBD 2010 we estimated the prevalence and burden of several unique health states that are sequelae for multiple diseases including anaemia, heart failure, vision loss, seizures, hearing loss, infertility, and intellectual disability. These are referred to as impairments.