Ace electech.com is one of the renowned pcb manufacturer and supplier in china
Upload
researchinchinaCategory
view
434download
4
Global and China Rigid PCB Industry
Report, 2015
Mar. 2015
METHODOLOGY
Both primary and secondary research methodologies were used
in preparing this study. Initially, a comprehensive and exhaustive
search of the literature on this industry was conducted. These
sources included related books and journals, trade literature,
marketing literature, other product/promotional literature, annual
reports, security analyst reports, and other publications.
Subsequently, telephone interviews or email correspondence
was conducted with marketing executives etc. Other sources
included related magazines, academics, and consulting
companies.
INFORMATION SOURCES
The primary information sources include Company Reports,
and National Bureau of Statistics of China etc.
STUDY GOAL AND OBJECTIVES
This report provides the industry executives with strategically significant
competitor information, analysis, insight and projection on the
competitive pattern and key companies in the industry, crucial to the
development and implementation of effective business, marketing and
R&D programs.
REPORT OBJECTIVES
To establish a comprehensive, factual, annually updated and cost-
effective information base on market size, competition patterns,
market segments, goals and strategies of the leading players in the
market, reviews and forecasts.
To assist potential market entrants in evaluating prospective
acquisition and joint venture candidates.
To complement the organizations’ internal competitor information
gathering efforts with strategic analysis, data interpretation and
insight.
To suggest for concerned investors in line with the current
development of this industry as well as the development tendency.
To help company to succeed in a competitive market, and
understand the size and growth rate of any opportunity.
Room 502, Block 3, Tower C, Changyuan Tiandi Building, No. 18, Suzhou Street, Haidian District, Beijing, China 100080 Phone: +86 10 82600828 ● Fax: +86 10 82601570 ● www.researchinchina.com ● [email protected]
Copyright 2012 ResearchInChina
Abstract
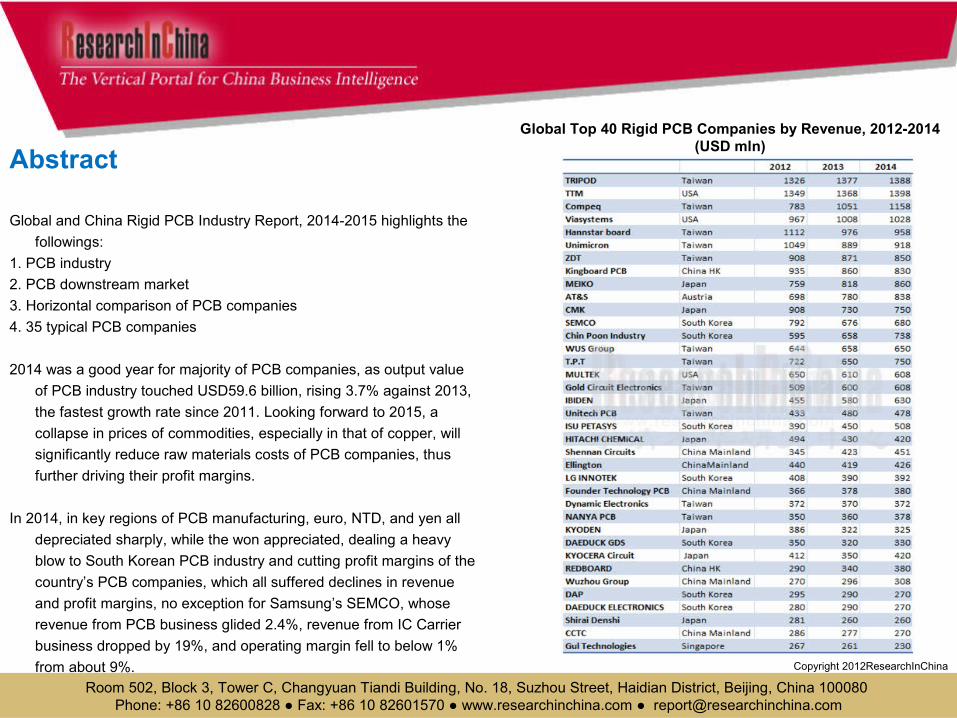
Global and China Rigid PCB Industry Report, 2014-2015 highlights the
followings:
1. PCB industry
2. PCB downstream market
3. Horizontal comparison of PCB companies
4. 35 typical PCB companies
2014 was a good year for majority of PCB companies, as output value
of PCB industry touched USD59.6 billion, rising 3.7% against 2013,
the fastest growth rate since 2011. Looking forward to 2015, a
collapse in prices of commodities, especially in that of copper, will
significantly reduce raw materials costs of PCB companies, thus
further driving their profit margins.
In 2014, in key regions of PCB manufacturing, euro, NTD, and yen all
depreciated sharply, while the won appreciated, dealing a heavy
blow to South Korean PCB industry and cutting profit margins of the
country’s PCB companies, which all suffered declines in revenue
and profit margins, no exception for Samsung’s SEMCO, whose
revenue from PCB business glided 2.4%, revenue from IC Carrier
business dropped by 19%, and operating margin fell to below 1%
from about 9%.
Room 502, Block 3, Tower C, Changyuan Tiandi Building, No. 18, Suzhou Street, Haidian District, Beijing, China 100080 Phone: +86 10 82600828 ● Fax: +86 10 82601570 ● www.researchinchina.com ● [email protected]
Copyright 2012ResearchInChina
Global Top 40 Rigid PCB Companies by Revenue, 2012-2014(USD mln)

Taiwanese companies and European ones, benefiting from currency devaluation, saw a surge in profit margins, while Japanese peers didn’t
gain from yen depreciation, as more than half of their production bases are located in foreign countries, but still performed better than South
Korean counterparts.
HDI was still a main engine of growth in rigid PCB field in 2014, and is expected to maintain the momentum in 2015. As mobile phone
screens become larger, PCB for mobile phone has to react accordingly. To ensure light weight and thinness of mobile phone, the demand
for more advanced Anylayer HDI increases tremendously. As Anylayer HDI technology is time- and -capacity consuming, combined with
Panasonic’s withdrawal from Anylayer HDI field, various PCB companies will expand Anylayer HDI capacity in 2015. In 2014, the company
registered largest growth in revenue from HDI PCB business was Taiwanese Compeq, which boasts customers like Apple and Xiaomi with
impressive performance, jumping by 28.3% to USD690 million, one step away from industry leader Unimicron.
Another spotlight in 2014 was PCB for server. With further penetration of internet economy, the coming of big data era, and influx of large
amounts of capital into network economy, the demand for server ushers in explosive growth. PCB for server requires high Tg and low Loss,
with layer growing more higher, up to 28, driving continuous increase in unit price of PCB for server since 2009. The companies that
specialize in PCB for server, such as Taiwanese WUS Printed Circuit and ACCL, accomplished good results, with WUS Printed Circuit’s
revenue ascending by 20% and ACCL’s 27%.
Regarding rigid PCB, LED lighting stimulated demand for metal PCB with good heat elimination performance. Taiwanese T.P.T, GIA
TZOONG, and mainland Chinese Shenzhen Kinwong Electronic, which are skilled in metal PCB, all enjoyed a decent level of growth. In
addition, PCB for automobile also did a good performance.
The most sensational event in PCB industry in 2014 was the merger of TTM and Viasystems. The combined company is absolutely No. 1
manufacturer with total revenue approximating USD2.5 billion. TTM enjoys a strong position in cellular phone and networking/telecom, and
Viasystems in automotive and industrial fields, showing a perfect complementation.
Room 502, Block 3, Tower C, Changyuan Tiandi Building, No. 18, Suzhou Street, Haidian District, Beijing, China 100080 Phone: +86 10 82600828 ● Fax: +86 10 82601570 ● www.researchinchina.com ● [email protected]
Copyright 2012ResearchInChina
1. Overview of PCB Industry
1.1 Output Value of Global PCB Industry
1.2 Recent Developments and Future Trends of PCB Industry
1.3 PCB Industry in Taiwan
1.4 PCB Industry in Mainland China
1.4.1 Industrial Scale
1.4.2 Policy
1.5 Ranking of Chinese Mainland PCB Vendors
1.6 PCB Industry in Europe
1.7 PCB Industry in North America
1.8 PCB Industry in Japan
2. PCB Downstream Market
2.1 Global Mobile Phone Market
2.2 Global Smartphone Market
2.3 Chinese Mobile Phone Market
2.4 Tablet PC Market
2.5 Laptop Computer Market
3. Analysis of PCB Industry
3.1 PCB Technology Trends
3.1.1 Ranking of PCB Companies for Mobile Phone
3.1.2 Supporting Relationship of Mobile Phone PCB
Table of contents
Room 502, Block 3, Tower C, Changyuan Tiandi Building, No. 18, Suzhou Street, Haidian District, Beijing, China 100080 Phone: +86 10 82600828 ● Fax: +86 10 82601570 ● www.researchinchina.com ● [email protected]
3.2 Memory Module PCB
3.3 Rigid PCB
3.4 PCB for Automotive Electronics
3.5 PCB for Laptop Computer
3.6 Ranking of Global PCB Companies
4. Major PCB Companies
4.1 Unimicron
4.2 Compeq
4.3 HannStar Board
4.4 Gold Circuit Electronics
4.5 Tripod Technology
4.6 Meiko
4.7 CMK
4.7.1 WUXI CMK
4.7.2 CMK GBM
4.7.3 CMKC DONGGUAN
4.8 IBIDEN
4.9 Daeduck Electronics
4.10 TTM
4.11 Unitech PCB
4.12 AT&S
4.13 Kingboard
4.13.1 Elec&Eltek
4.13.2 Tech-Wise Circuit
4.13.3 Express Electronics
4.14 SIMMTECH
4.15 T.P.T
4.16 Ellington Electronics
4.17 Chinpoon Industrial
4.18 LG INNOTEK
4.19 SEMCO
4.20 Founder PCB
4.21 Gul Technologies
4.22 Dynamic Electronics
4.23 Viasystems
4.24 Nanya PCB
4.25 Shennan Circuit
4.26 WUS Printed Circuit
4.27 Guangdong Goworld
4.28 ZDT
4.29 Multek
4.30 Kinsus
4.31 Shinko
4.32 ISU PETASYS
4.33 KYOCERA CIRCUIT SOLUTIONS
4.34 Shenzhen Kinwong Electronic
4.35 Allied Circuit
• Output Value of PCB Industry, 2001-2015E
• Global PCB Output Value, 1980-2001
• PCB Industry Chain
• Revenue Breakdown of PCB Industry by Technology, 2009-2015E
• Global PCB Output Value by Layer, 2013
• Revenue of Global PCB Industry by Region, 2013-2015E
• Revenue of Global PCB Industry by Region, 2012-2014
• Revenue of PCB Industry in Taiwan by Product, 2010-2013
• Investment Structure of PCB Companies in Mainland China, 2010-2011
• Output Value of PCB Industry in Mainland China by Technology, 2011-2013
• Ranking of Chinese Mainland PCB Vendors by Revenue, 2013
• European PCB Production by End Market, 2013
• Revenue of European PCB Vendors by Country, 2013
• Revenue of European PCB Vendors by Country, 2000-2013
• Quarterly Revenue of Major European PCB Vendors, 2009-2013
• Output Value Growth of European PCB Vendors, 2005-2017E
• TOP 50 PCB Vendors in Europe, 2013
• Revenue of Major North American PCB Vendors, 2008 Q1-2014 Q1
• Growth Rate of North American PCB Output Value, 2005-2017E
• Geographical Distribution of Japanese PCB Output Value, 2001-2014
• Japanese PCB Output Value by Layer, 2014
• Global Mobile Phone Shipments, 2007-2015E
• Geographical Distribution of Global 3G/4G Mobile Phone Shipments, 2011-2014
• Worldwide Mobile Phone Sales to End Users by Vendor in 2013 (Thousands of Units)
• Shipments of Global Top10 Mobile Phone Vendors, 2014 Q3
Selected Charts
Room 502, Block 3, Tower C, Changyuan Tiandi Building, No. 18, Suzhou Street, Haidian District, Beijing, China 100080 Phone: +86 10 82600828 ● Fax: +86 10 82601570 ● www.researchinchina.com ● [email protected]
• Worldwide Smartphone Sales to End Users by Vendor in 2013 (Thousands of Units)
• Worldwide Smartphone Sales to End Users by Operating System in 2013 (Thousands of Units)
• Global Top13 Smartphone Vendors by Shipment, 2013-2015E
• Shipments of Major Smartphone Vendors, 2014 Q3
• Monthly Mobile Phone Shipments in China, Jan 2013-Dec 2014
• Market Share of Major Vendors in Chinese Smartphone Market, 2014
• Market Share of Major Vendors in Chinese 4G Mobile Phone Market, 2014
• Global Tablet PC Shipments, 2011-2016E
• Shipments of Top5 Tablet PC Vendors, 2014 Q4
• Shipments, Market Share, and Growth of Top5 Tablet PC Vendors, 2014
• Laptop Computer Shipments, 2008-2015E
• Shipments of Global Major Laptop Computer ODM Companies, 2010-2014
• Ranking of Major HDI Vendors by Revenue, 2012-2014
• Supply Structure of PCB for NOKIA Mobile Phone, 2010-2013
• Supply Structure of PCB for SAMSUNG Mobile Phone, 2010-2013
• Supply Structure of PCB for LG Mobile Phone, 2012
• Supply Structure of PCB for ZTE Mobile Phone, 2010-2013
• Supply Structure of PCB for RIM Mobile Phone, 2010-2011
• Supply Structure of PCB for APPLE, 2010-2013
• Ranking of Major HDI Vendors by Revenue, 2012-2014
• Ranking of Global DRAM Vendors by Revenue, 2014 Q1
• Market Share of Global DRAM Vendors, 2014 Q1
• Market Share of NAND Vendors, 2014 Q1
• Market Share of Memory Module PCB Vendors, 2010-2013
• Market Share of Major Rigid PCB Vendors, 2006/2010/2011/2012
Selected Charts
Room 502, Block 3, Tower C, Changyuan Tiandi Building, No. 18, Suzhou Street, Haidian District, Beijing, China 100080 Phone: +86 10 82600828 ● Fax: +86 10 82601570 ● www.researchinchina.com ● [email protected]
• Market Share of PCB Vendors for Automotive Electronics, 2010-2014
• Market Share of Major PCB Vendors for Laptop Computer by Shipment, 2011-2014
• Supply Chain of Server PCB
• Technology Roadmap of Server PCB
• Market Share of Global Major Server PCB Vendors, 2014
• Global Top40 Rigid PCB Vendors, 2012-2014
• Gross Margin of Major PCB Vendors, 2012-2014
• Operating Margin of Top25 PCB Vendors, 2012-2014
• Organizational Structure of Unimicron
• Revenue and Gross Margin of Unimicron, 2003-2014
• Revenue and Operating Margin of Unimicron, 2009-2014
• Quarterly Revenue and Gross Margin of Unimicron, 2012 Q1-2014 Q4
• Sales Breakdown of Unimicron by Technology, 2010-2014
• Sales Breakdown of Unimicron by Application, 2010-2014
• Capacity of Unimicron, 2010-2014
• CAPEX of Unimicron, 2004-2013
• Financial Data of Unimicron’s Subsidiaries in Mainland China, 2013
• Revenue and Gross Margin of Compeq, 2006-2014
• Revenue and Operating Margin of Compeq, 2009-2014
• Monthly Revenue and Growth Rate of Compeq, Jan 2013-Jan 2015
• Financial Data of Major Subsidiaries under Compeq, 2009-2013
• Diagram of Associated Companies of HannStar Board
• Revenue and Gross Margin of HannStar Board, 2006-2014
• Revenue and Operating Margin of HannStar Board, 2009-2014
• Monthly Revenue and Growth Rate of HannStar Board, Jan 2013-Jan 2015
Selected Charts
Room 502, Block 3, Tower C, Changyuan Tiandi Building, No. 18, Suzhou Street, Haidian District, Beijing, China 100080 Phone: +86 10 82600828 ● Fax: +86 10 82601570 ● www.researchinchina.com ● [email protected]
• Revenue Breakdown of HannStar Board by Application, 2009-2012
• Revenue Breakdown of HannStar Board by Layer, 2009-2012
• Financial Data of Major Subsidiaries under HannStar Board, 2011
• Financial Data of Major Subsidiaries under HannStar Board, 2013
• Revenue and Gross Margin of Gold Circuit Electronics, 2005-2015E
• Revenue and Operating Margin of Gold Circuit Electronics, 2009-2014
• Monthly Revenue and Growth Rate of Gold Circuit Electronics, Jan 2013-Jan 2015
• Revenue Breakdown of Gold Circuit Electronics by Product, 2010-2012
• Revenue and Gross Margin of Tripod Technology, 2006-2014
• Revenue and Operating Margin of Tripod Technology, 2009-2015E
• Revenue Breakdown of Tripod Technology by Application, 2013
• Revenue Breakdown of Tripod Technology by Layer, 2013
• Monthly Revenue and Growth Rate of Tripod Technology, Jan 2013-Jan 2015
• Capacity of Tripod Technology, 2006-2011
• Financial Data of Tripod Technology’s Subsidiaries in Mainland China, 2013
• Revenue and Operating Margin of Meiko, FY2006-FY2015E
• Operating Income of Meiko, FY 2014
• Revenue and Operating Margin of Meiko’s Subsidiaries in Mainland China, FY2009-FY2014
• Revenue and Operating Margin of Meiko’s Subsidiaries in Mainland China, FY2015E
• Revenue Breakdown of Meiko by Application, FY2013-FY2015E
• Revenue Breakdown of Meiko by Layer, FY2010-FY2015E
• Revenue and Operating Margin of CMK, FY2005-FY2015E
• Revenue Breakdown of CMK by Application, FY2007-FY2015E
• Revenue Breakdown of CMK by Layer, FY2007-FY2015E
• Revenue Breakdown of CMK by Region, FY2007-FY2014
Selected Charts
Room 502, Block 3, Tower C, Changyuan Tiandi Building, No. 18, Suzhou Street, Haidian District, Beijing, China 100080 Phone: +86 10 82600828 ● Fax: +86 10 82601570 ● www.researchinchina.com ● [email protected]
• Revenue and Output of WUXI CMK, 2003-2010
• Revenue and Operating Margin of IBIDEN, FY2006-FY2015E
• Revenue Breakdown of IBIDEN by Business, FY2006-FY2015E
• Quarterly Revenue Breakdown of IBIDEN by Business, 2012 Q2-2014 Q2
• Quarterly Operating Income of IBIDEN by Business, 2012 Q2-2014 Q2
• Revenue Breakdown of IBIDEN’s Electronics Division by Product, FY2010-FY2015E
• CAPEX and Depreciation of IBIDEN, FY2010-FY2015E
• Revenue and Operating Margin of Daeduck Electronics, 2005-2014
• Revenue Breakdown of Daeduck Electronics by Business, 2009-2014
• Revenue and Operating Margin of Daeduck GDS, 2005-2014
• Revenue Breakdown of Daeduck GDS by Business, 2010-2014
• Revenue and Operating Margin of TTM, 2005-2014
• Revenue Breakdown of TTM +Viasystems by Application
• Quarterly Revenue Breakdown of TTM by Region, 2013 Q1-2014 Q4
• Quarterly Revenue and Gross Margin of TTM, 2013 Q1-2014 Q4
• Distribution of TTM’s Customers, 2014
• Revenue Breakdown of TTM by Region, 2011-2013
• Revenue Breakdown of TTM by Technology, 2013
• Revenue Breakdown of TTM by Application, 2008-2014
• Global Distribution of TTM’s Factories
• Revenue and Gross Margin of Unitech PCB, 2006-2014
• Revenue and Operating Margin of Unitech PCB, 2009-2015E
• Monthly Revenue and Growth Rate of Unitech PCB, Jan 2013-Jan 2015
• Technology Roadmap for Rigid PCB
• Technology Roadmap for Flexible PCB
Selected Charts
Room 502, Block 3, Tower C, Changyuan Tiandi Building, No. 18, Suzhou Street, Haidian District, Beijing, China 100080 Phone: +86 10 82600828 ● Fax: +86 10 82601570 ● www.researchinchina.com ● [email protected]
• Financial Data of Shanghai Unitech Electronics, 2010&2013
• EBITDA of AT&S, FY2005-FY2015E
• Ramp-up of AT&S’ Substrate Plant in Chongqing
• Revenue Breakdown of AT&S by Business and Region, FY2014
• Revenue Breakdown of AT&S by Business and Region, FY2015
• Quarterly Revenue of AT&S Mobile Devices & Substrates, Q2/13-Q4/14
• Main Customers of AT&S Mobile Devices & Substrates
• Quarterly Revenue of AT&S Industrial & Automotive, Q2/13-Q4/14
• Number of Employees of AT&S, 2010-2015E
• CAPEX of AT&S, 2010-2015E
• Organizational Structure of Kingboard
• Revenue and Margin of Profit Attributable to Equity Shareholders of Kingboard, 2002-2014
• Revenue and Pretax Profit Margin of Kingboard, 2009-2014
• Revenue Breakdown of Kingboard by Revenue, 2008-2014
• Organizational Structure of Elec&Eltek
• Revenue and Operating Margin of Elec&Eltek, 2005-2014
• Balance Sheets of Elec&Eltek, 2009-2013
• Revenue Breakdown of Elec&Eltek by Region, 2006-2013
• Revenue Breakdown of Elec&Eltek by Layer, 2006-2013
• Capacities of Elec&Eltek’s Plants
• Technological Capability of Elec&Eltek
• Revenue of Express Electronics from Dongguan Plant, 2009-2013
• Revenue of Express Electronics from Suzhou Plant, 2009-2013
• Organizational Structure of SIMMTECH
• Revenue and Operating Margin of SIMMTECH, 2004-2014
Selected Charts
Room 502, Block 3, Tower C, Changyuan Tiandi Building, No. 18, Suzhou Street, Haidian District, Beijing, China 100080 Phone: +86 10 82600828 ● Fax: +86 10 82601570 ● www.researchinchina.com ● [email protected]
• Revenue, Gross Margin and Net Profit Margin of SIMMTECH, 2009-2014
• Revenue Breakdown of SIMMTECH by Product, 2013-2015E
• Quarterly Gross Margin and Operating Margin of SIMMTECH, 2013 Q1-2014 Q4
• Quarterly Shipments of SIMMTECH, 2013 Q1-2014 Q4
• Shipments of SIMMTECH, 2012-2015E
• Quarterly Capacity Utilization of SIMMTECH, 2013 Q1-2014 Q4
• Capacity Utilization of SIMMTECH, 2012-2015E
• Revenue Breakdown of SIMMTECH by Application, 2008-2014
• Revenue Breakdown of SIMMTECH from Substrate by Application, 2012-2014
• SIMMTECH’s Factories
• Revenue and Gross Margin of T.P.T, 2005-2014
• Revenue and Operating Margin of T.P.T, 2005-2015E
• Monthly Revenue and Growth Rate of T.P.T, Jan 2013-Jan 2015
• Customer Structure of T.P.T, 2014
• Revenue Breakdown of T.P.T by Application, 2014
• Financial Data of T.P.T’s Subsidiaries in Mainland China, 2013
• Equity Structure of Ellington Electronics
• Revenue and Gross Margin of Ellington Electronics, 2007-2014
• Revenue Breakdown of Ellington Electronics by Layer, 2009-2014
• Revenue Breakdown of Ellington Electronics by Application, 2009-2012H1
• Revenue Breakdown of Ellington Electronics by Region, 2009-2012
• Revenue and Gross Margin of Chinpoon Industrial, 2005-2013
• Revenue and Operating Margin of Chinpoon Industrial, 2005-2015E
• Monthly Revenue and Growth Rate of Chinpoon Industrial, Jan 2013-Jan 2015
• Revenue and Operating Margin of LG INNOTEK, 2006-2015E
Selected Charts
Room 502, Block 3, Tower C, Changyuan Tiandi Building, No. 18, Suzhou Street, Haidian District, Beijing, China 100080 Phone: +86 10 82600828 ● Fax: +86 10 82601570 ● www.researchinchina.com ● [email protected]

• Revenue and Operating Margin of LG INNOTEK, 2012 Q1-2014 Q4
• Revenue Breakdown of LG INNOTEK by Business, 2011-2015E
• Operating Income Breakdown of LG INNOTEK by Business, 2011-2015E
• Revenue and Operating Margin of SEMCO, 2009-2014
• Revenue Breakdown of SEMCO by Business Division, 2010-2014
• Revenue and Operating Margin of SEMCO ACI Division, 2013 Q1-2014 Q4
• SEMCO’s Revenue from HDI and PKG, 2014 Q1-2014 Q4
• Revenue and Operating Margin of Founder PCB, 2007-2014
• Financial Data of Subsidiaries under Founder PCB, 2013
• Downstream Application of Founder PCB, 2010
• Capacity of Founder PCB’s Factory in Chongqing
• Capacity of Founder PCB’s No.1 Factory in Zhuhai
• Capacity of Founder PCB’s No.3 Factory in Zhuhai
• Capacity of Founder PCB’s No.5 Factory in Zhuhai
• Capacity Breakdown of Founder PCB’s No.1 Factory in Hangzhou by Technology
• Capacity of Founder PCB’s No.4 Factory in Zhuhai
• HDI Technology Capability of Founder PCB
• Revenue and Operating Income of Gul Technologies, 2005-2013
• Associated Companies of Gul Technologies
• Revenue and Gross Margin of Dynamic Electronics, 2006-2014
• Revenue and Operating Margin of Dynamic Electronics, 2009-2014
• Monthly Revenue and Growth Rate of Dynamic Electronics, Jan 2013-Jan 2015
• Capacity of Dynamic Electronics, 2009-2012
• Revenue and Operating Margin of Viasystems, 2006-2014
• Revenue Breakdown of Viasystems by Business, 2008-2014
Selected Charts
Room 502, Block 3, Tower C, Changyuan Tiandi Building, No. 18, Suzhou Street, Haidian District, Beijing, China 100080 Phone: +86 10 82600828 ● Fax: +86 10 82601570 ● www.researchinchina.com ● [email protected]
• Global Distribution of Viasystems
• Revenue Breakdown of Viasystems by Application, 2008-2014
• Major Customers of Viasystems
• Revenue Breakdown of DDI by Region and End Market
• Distribution of DDI’s Factories
• Major Customers of DDI
• Organizational Structure of Nanya PCB
• Revenue and Gross Margin of Nanya PCB, 2006-2014
• Revenue and Operating Margin of Nanya PCB, 2009-2015E
• Monthly Revenue and Growth Rate of Nanya PCB, Jan 2013-Jan 2015
• Capacity and Global Distribution of Nanya PCB
• Technology Capability of Nanya PCB
• Revenue and Operating Income of WUS Printed Circuit, 2007-2014
• Revenue Breakdown of WUS Printed Circuit by Layer, 2010-2014
• Revenue Breakdown of WUS Printed Circuit by Application, 2007-2014
• Gross Margin of WUS Printed Circuit by Application, 2012-2014
• Major Customers of WUS Printed Circuit, 2013
• Revenue and Operating Margin of Guangdong Goworld, 2005-2014
• Organizational Structure of Guangdong Goworld
• Revenue Breakdown of Guangdong Goworld by Business, 2007-2014
• Output of Guangdong Goworld, 2007-2013
• Organizational Structure of ZDT Holding
• Revenue and Operating Margin of ZDT, 2008-2015E
• Revenue and Gross Margin of ZDT, 2008-2014
• Monthly Revenue of ZDT, Jan 2013-Jan 2015
Selected Charts
Room 502, Block 3, Tower C, Changyuan Tiandi Building, No. 18, Suzhou Street, Haidian District, Beijing, China 100080 Phone: +86 10 82600828 ● Fax: +86 10 82601570 ● www.researchinchina.com ● [email protected]
• ZDT Global Footprint
• Number of Employees of ZDT, 2006-2014
• Technology Roadmap of Multek’s ELIC, 2011-2013
• Technology Roadmap of Rigid-Flex PCB of Multek, 2011-2013
• Technology Roadmap of Multek’s Microvias, 2011-2013
• Revenue and Gross Margin of Kinsus, 2004-2014
• Revenue and Operating Margin of Kinsus, 2009-2015E
• Monthly Revenue and Growth Rate of Kinsus, Jan 2013-Jan 2015
• Revenue Breakdown of Kinsus by Product, 2011-2014
• Revenue Breakdown of Kinsus by Application, 2011
• Revenue Breakdown of Kinsus by Application, 2014 Q1
• Revenue Breakdown of Kinsus by Application, 2014 Q4
• Customer Distribution of Kinsus, 2013&2014
• Revenue and Net Income of Shinko, FY2007-FY2015E
• Revenue Breakdown of Shinko by Business, FY2010-FY2015E
• Revenue and Operating Margin of ISU PETASYS, 2008-2014
• Revenue Breakdown of ISU PETASYS, by Technology, 2012-2014
• Revenue and Operating Margin of Shenzhen Kinwong Electronic, 2011-2015E
• Capacity and Output of Shenzhen Kinwong Electronic, 2011-2014
• Revenue Breakdown of Shenzhen Kinwong Electronic by Layer, 2011-2014
• Revenue Breakdown of Shenzhen Kinwong Electronic by End Market, 2011-2014
• ASP of Shenzhen Kinwong Electronic’s Products, 2011-2014
• Customer Distribution of Shenzhen Kinwong Electronic, 2011-2014
• Raw Materials Costs Structure of Shenzhen Kinwong Electronic, 2011-2014
• Raw Materials Prices of Shenzhen Kinwong Electronic, 2011-2014
Selected Charts
Room 502, Block 3, Tower C, Changyuan Tiandi Building, No. 18, Suzhou Street, Haidian District, Beijing, China 100080 Phone: +86 10 82600828 ● Fax: +86 10 82601570 ● www.researchinchina.com ● [email protected]
• Major Suppliers of Shenzhen Kinwong Electronic, 2011-2014
• Main Equipment of Shenzhen Kinwong Electronic, at the End of Jun 2014
• Revenue and Gross Margin of Allied Circuit, 2009-2014
• ASP of Allied Circuit’s Products, 2009-2014
• Monthly Revenue of Allied Circuit, Jan 2013-Jan 2015
• Downstream Distribution of Allied Circuit’s Shipments, 2012-2014
Selected Charts
Room 502, Block 3, Tower C, Changyuan Tiandi Building, No. 18, Suzhou Street, Haidian District, Beijing, China 100080 Phone: +86 10 82600828 ● Fax: +86 10 82601570 ● www.researchinchina.com ● [email protected]
You can place your order in the following alternative ways:
1.Order online at www.researchinchina.com
2.Fax order sheet to us at fax number:+86 10 82601570
3. Email your order to: [email protected]
4. Phone us at +86 10 82600828/ 82601561
Party A:Name:Address:Contact Person: TelE-mail: Fax
Party B:Name: Beijing Waterwood Technologies Co., Ltd (ResearchInChina)Address: Room 502, Block 3, Tower C, Changyuan Tiandi Building, No. 18,
Suzhou Street, Haidian District, Beijing, China 100080Contact Person:
Liao Yan Phone:
86-10-82600828
E-mail: [email protected] Fax: 86-10-82601570Bank details:
Beneficial Name: Beijing Waterwood Technologies Co., LtdBank Name: Bank of Communications, Beijing BranchBank Address: NO.1 jinxiyuan shijicheng,Landianchang,Haidian District,BeijingBank Account No #: 110060668012015061217Routing No # : 332906Bank SWIFT Code: COMMCNSHBJG
Title Format Cost
Total
Choose type of format
PDF (Single user license) …………..2,500 USD
Hard copy ………………….……. 2,700 USD
PDF (Enterprisewide license)…....... 3,950 USD
※ Reports will be dispatched immediately
once full payment has been received.
Payment may be made by wire transfer or
credit card via PayPal.
How to Buy
Room 502, Block 3, Tower C, Changyuan Tiandi Building, No. 18, Suzhou Street, Haidian District, Beijing, China 100080 Phone: +86 10 82600828 ● Fax: +86 10 82601570 ● www.researchinchina.com ● [email protected]
About ResearchInChina
ResearchInChina (www.researchinchina.com) is a leading independent provider of China business intelligence. Our research is designed to meet the diverse planning and information needs of businesses, institutions, and professional investors worldwide. Our services are used in a variety of ways, including strategic planning, product and sales forecasting, risk and sensitivity management, and as investment research.
Our Major Activities
Multi-users market reports
Database-RICDB
Custom Research
Company Search
RICDB (http://www.researchinchina.com/data/database.html ), is a visible financial data base presented by map and graph covering global and China macroeconomic data, industry data, and company data. It has included nearly 500,000 indices (based on time series), and is continuing to update and increase. The most significant feature of this base is that the vast majority of indices (about 400,000) can be displayed in map.
After purchase of our report, you will be automatically granted to enjoy 2 weeks trial service of RICDB for free.
After trial, you can decide to become our formal member or not. We will try our best to meet your demand. For more information, please find at www.researchinchina.com
For any problems, please contact our service team at:
Room 502, Block 3, Tower C, Changyuan Tiandi Building, No. 18, Suzhou Street, Haidian District, Beijing, China 100080 Phone: +86 10 82600828 ● Fax: +86 10 82601570 ● www.researchinchina.com ● [email protected]
RICDB service