Giuseppe De Blasi, Annalisa De Boni, Rocco Gigante, Rocco Roma · the support model based on the...
12
1. Introduction The need for a reform of the CAP began to arise at the end of the seventies and the beginning of the eighties. The Gundelach report, 1980, and the Thorn report, 1981, can be considered as the docu- ments that started the revi- sion process culminating in the Mac Sharry reform (1992). This was an impor- tant turning point for com- munity policy strategies. In fact, for the first time, the support model based on the price system is al- tered, introducing ele- ments of “separation” from production volumes and market orientation in two of the most relevant COMs: arable crops and beef. There was also the first real attempt to build into the CAP environmen- tal protection and rural de- velopment measures. This reform was really a response to international pressures deriving from the GATT talks rather than a solu- tion to problems of containing overproduction, to correct- ing territorial imbalances and to reducing costs to the com- munity budget. The reform, in fact, only timidly started on the road to separation of price maintenance from quantity pro- duced, since it neither managed to correct the imbal- ances on a distribution level nor did it manage to con- tain costs; on the con- trary, the mechanism of compensation to farm- ers not only safeguarded the more productive ar- eas, but even institu- tionalised their position of advantage (M. De Benedictis and F. De Filippis, 1999) and with the separation and the introduction of direct payments the cost to the budget increased con- siderably. The European Council of Berlin (March 1999) made a further development and extension of the 1992 Reform on the ba- sis of the “Agenda 2000” document pre- sented by the Commis- sion in July ’97. In “A- genda 2000” the Com- mission outlines an or- ganic framework for consideration of the ob- jectives and instruments for the future develop- ment of Union policies, in terms of the limits imposed by the international and internal scenario, above all in view of the expansion to the east. The new objectives in Agenda 2000 are the need to make European agriculture more competitive and environmentally compatible and a move from the concept of safe income in terms of quantity available to one of guaranteed food quality. On the basis of these objectives, Agenda 2000 proposes to: Develop and extend the separation criteria already adopt- ed in the Mac Sharry Reform; Recognise the multifunctional role of agriculture expect- ed by society both on a productive level and in terms of protection of the environment and development of the ter- NEW MEDIT N. 3/2007 Evolution of agricultural income in Puglia between the Mac Sharry Reform and the Mid-term review 1 Giuseppe De Blasi, Annalisa De Boni, Rocco Gigante, Rocco Roma Abstra ct Aim of this work has been the evaluation of the effects of common agricultur- al policies on primary sector income in Italy, in the Mezzogiorno and above all in Puglia. In order to see the effects of Mac Sharry reform, Agenda 2000 and the Mid-term review, we considered different periods from 1993 to 2004. The aggregate income trend was analysed considering variations in agricultural added value in money and real terms. Variations in real income were broken down into three components: productive, monetary and subsidies. Results showed that on the whole, from 1996 agricultural income in Puglia declined more than in Italy and in the Mezzogiorno and, whereas in Italy the main cause of falling income had a monetary origin, above all inflation, in Apulia this neg- ative effect was mostly due to the reduction of subsidies. Changes in subsidy systems caused great variations in crop distribution: in Puglia a concentration of intensive farming has been established in the irrigated areas, while exten- sive crops converged on marginal areas with scarce water supplies. Key words: PAC reform, farm income, Puglia region Résumé Le but de ce travail est l’évaluation des effets de la politique agricole com- mune sur le revenu du secteur primaire en Italie, dans le Midi et surtout dans la région des Pouilles. Afin d’évaluer les effets de la réforme Mac Sherry, de l’Agenda 2000 et de la révision à moyen terme, on a considéré la période en- tre 1993 et 2004. La tendance des revenus a été analysée à la lumière des va- riations de la valeur ajoutée agricole en argent et en termes réels. Les varia- tions du revenu réel ont été divisées en trois composantes: productive, moné- taire et des subventions. Les résultats ont montré qu’à partir de 1996 le reve- nu agricole s’est réduit dans les Pouilles plus qu’en Italie et que dans le Mi- di. En outre si en Italie la cause de la réduction était d’origine monétaire, voi- re l’inflation, dans les Pouilles cet effet négatif était lié à la réduction des sub- ventions. Les changements du système des subventions a causé de grandes va- riations dans la distribution productive: dans les Pouilles, l’agriculture inten- sive s’est concentrée dans les zones irriguées alors que les cultures extensives dans les régions marginales avec des ressources en eau limitées. Mots clé: réforme PAC, revenu agricole, région des Pouilles 42 1 This work was carried out as a research project financed by Ateneo 2004 funds “Evaluation of the impact of the CAP for the improvement of agricultural structures on the earnings of cereal and olive growing farms in Puglia” – scientific director Prof. G. De Blasi. Jel classification: Q180, Q140
-
Upload
nguyentram -
Category
Documents
-
view
217 -
download
0
Transcript of Giuseppe De Blasi, Annalisa De Boni, Rocco Gigante, Rocco Roma · the support model based on the...

1. IntroductionThe need for a reform of
the CAP began to arise atthe end of the seventiesand the beginning of theeighties. The Gundelachreport, 1980, and theThorn report, 1981, can beconsidered as the docu-ments that started the revi-sion process culminatingin the Mac Sharry reform(1992). This was an impor-tant turning point for com-munity policy strategies.In fact, for the first time,the support model basedon the price system is al-tered, introducing ele-ments of “separation”from production volumesand market orientation intwo of the most relevantCOMs: arable crops andbeef. There was also thefirst real attempt to buildinto the CAP environmen-tal protection and rural de-velopment measures.
This reform was really aresponse to internationalpressures deriving from the GATT talks rather than a solu-tion to problems of containing overproduction, to correct-ing territorial imbalances and to reducing costs to the com-munity budget.
The reform, in fact, only timidly started on the road toseparation of price maintenance from quantity pro-duced, since it neither managed to correct the imbal-ances on a distribution level nor did it manage to con-
tain costs; on the con-trary, the mechanism ofcompensation to farm-ers not only safeguardedthe more productive ar-eas, but even institu-tionalised their positionof advantage (M. DeBenedictis and F. DeFilippis, 1999) and withthe separation and theintroduction of directpayments the cost to thebudget increased con-siderably. The EuropeanCouncil of Berlin(March 1999) made afurther developmentand extension of the1992 Reform on the ba-sis of the “Agenda2000” document pre-sented by the Commis-sion in July ’97. In “A-genda 2000” the Com-mission outlines an or-ganic framework forconsideration of the ob-jectives and instrumentsfor the future develop-ment of Union policies,
in terms of the limits imposed by the international andinternal scenario, above all in view of the expansion tothe east. The new objectives in Agenda 2000 are theneed to make European agriculture more competitiveand environmentally compatible and a move from theconcept of safe income in terms of quantity available toone of guaranteed food quality. On the basis of theseobjectives, Agenda 2000 proposes to:
Develop and extend the separation criteria already adopt-ed in the Mac Sharry Reform;
Recognise the multifunctional role of agriculture expect-ed by society both on a productive level and in terms ofprotection of the environment and development of the ter-
NEW MEDIT N. 3/2007
Evolution of agricultural income in Puglia betweenthe Mac Sharry Reform and the Mid-term review1
Giuseppe De Blasi, Annalisa De Boni, Rocco Gigante, Rocco Roma
AbstractAim of this work has been the evaluation of the effects of common agricultur-al policies on primary sector income in Italy, in the Mezzogiorno and above allin Puglia. In order to see the effects of Mac Sharry reform, Agenda 2000 andthe Mid-term review, we considered different periods from 1993 to 2004. Theaggregate income trend was analysed considering variations in agriculturaladded value in money and real terms. Variations in real income were brokendown into three components: productive, monetary and subsidies. Resultsshowed that on the whole, from 1996 agricultural income in Puglia declinedmore than in Italy and in the Mezzogiorno and, whereas in Italy the main causeof falling income had a monetary origin, above all inflation, in Apulia this neg-ative effect was mostly due to the reduction of subsidies. Changes in subsidysystems caused great variations in crop distribution: in Puglia a concentrationof intensive farming has been established in the irrigated areas, while exten-sive crops converged on marginal areas with scarce water supplies.
Key words: PAC reform, farm income, Puglia region
RésuméLe but de ce travail est l’évaluation des effets de la politique agricole com-mune sur le revenu du secteur primaire en Italie, dans le Midi et surtout dansla région des Pouilles. Afin d’évaluer les effets de la réforme Mac Sherry, del’Agenda 2000 et de la révision à moyen terme, on a considéré la période en-tre 1993 et 2004. La tendance des revenus a été analysée à la lumière des va-riations de la valeur ajoutée agricole en argent et en termes réels. Les varia-tions du revenu réel ont été divisées en trois composantes: productive, moné-taire et des subventions. Les résultats ont montré qu’à partir de 1996 le reve-nu agricole s’est réduit dans les Pouilles plus qu’en Italie et que dans le Mi-di. En outre si en Italie la cause de la réduction était d’origine monétaire, voi-re l’inflation, dans les Pouilles cet effet négatif était lié à la réduction des sub-ventions. Les changements du système des subventions a causé de grandes va-riations dans la distribution productive: dans les Pouilles, l’agriculture inten-sive s’est concentrée dans les zones irriguées alors que les cultures extensivesdans les régions marginales avec des ressources en eau limitées.
Mots clé: réforme PAC, revenu agricole, région des Pouilles
42
1 This work was carried out as a research project financed by Ateneo2004 funds “Evaluation of the impact of the CAP for the improvementof agricultural structures on the earnings of cereal and olive growingfarms in Puglia” – scientific director Prof. G. De Blasi.
Jel classification: Q180, Q140
ritory and the rural communities; greater equilibrium be-tween market policies and structural policies and a greaterintegration of environmental measures with structural oneswithin the common agricultural policy.
The agricultural policy choices made in the final deci-sions of 1999 were, however, very modest compared to theCommission’s indications because the instruments withhigher innovative potential were not activated, were weak-ened or postponed. Already, when ratifying the reform ofAgenda 2000 the European Council of Berlin of March1999 prescribed the revision of some measures by2002/2003. This further revision, defined the Mid-term re-view, was started in July 2002 and finished with the deci-sions of the Council of Agriculture of June 26th 2003. TheMTR, therefore, takes on the characteristics of a real re-form of the CAP, and its essential elements can be sum-marised thus:
Introduction of a single payment to farms not based onproduction.
Subsidies tied to respect of environmental standards,food safety for plants and animals, obligation to keep landin good agricultural and environmental condition.
Introduction of a modulation mechanism to finance newpolicies of rural development.
Increased funding for rural development plans.This work proposes to evaluate the effects that the Mac
Sharry reform, Agenda 2000 and the first phase of the Mid-term review may have had on agriculture in Italy, in theMezzogiorno1 and above all in Puglia. These analyseswere carried out examining in the various periods incometrends in the primary sector. References to the primary sec-tor are necessary because official national figures do notdistinguish between agriculture, forestry and fishing. How-ever, the limited influence of the latter two sectors allowsus to make an approximate evaluation of the agriculturalsector.
In the analysis we tried to show the role of the reforms a-mong the many factors that have influenced the evolution ofreal agricultural income. The comparison between the situ-ation in Puglia, in the Mezzogiorno and in Italy has shownthe specificity of the effects of the reforms in the region.
2. Materials and methodsTaking an approach already used in a previous study
(Carbone and Sorrentino 1999), the aggregate income trendwas analysed considering variations in agricultural addedvalue in money and real terms. In particular, variations inreal income were broken down into three components: pro-ductive, monetary and subsidies. We then proceeded to ex-amine partial productivity and changes in the product mix.In order to see the effects of the CAP in the changes of thedimensions under study, and in particular of the Mac Shar-ry reform, Agenda 2000 and the Mid-term review, we con-
sidered the period of time from 1993 to 2004, distinguish-ing four sub-periods corresponding to the different evolu-tionary phases of community policy and subsidies. Thefirst period, from 1993 to 1995 covers the initial phase ofthe Mac Sharry reform; from 1996 to 1998 we see the ef-fects of the Mac Sharry reform and the announced intro-duction of the revisions in Agenda 2000; the third period,from 1999 to 2001 coincides with the actuation of Agenda2000; finally, from 2001 to 2004 we see the effects of theprevious reform and the first results of the Mid-term re-view.
In order to stabilise the effects of accidental events andthose not related to our analyses and to exclude them fromour analyses, we decided to give values as three year aver-ages centred on the years 1994, 1997, 2000, 2003. Fromthese figures we analysed the variations in the three yearperiods. These variations are expressed in terms of loga-rithmic percentages.
To calculate income we referred to the national account-ing equation:
Va: agricultural added value; Plv: Gross saleable agricul-tural product; Ci: agricultural intermediate consumption; S:agricultural subsidies
Equation (1) was broken down into its components
Where : weighting coefficient, determined respec-tively by the ratio vari-ation of the natural logarithm “p” and “q”: deflator and val-ue at constant prices; Pil: Gross Domestic Product.
The weighting coefficients are important when changingthe values of the components and have a particular signifi-cance in that they indicate the structure of Va. A higher val-ue of b will show a high level of technical equipment, andtherefore a more intensive form of agriculture, while a highvalue for the g coefficient shows activity where there is aregime of compensatory payments.
Through an algebraic calculation of equation (2) we reachthe following expression:
This can be broken up into:
Monetary Component:
represents both the effects of general inflationary phenom-ena on variations of the purchasing power of agricultural in-come (expressed as (weighted variation of
NEW MEDIT N. 3/2007
43
2 The regions included in the definition of the Mezzogiorno are: Basi-licata, Calabria, Campania, Molise, Puglia.
the price index), and the relative agricultural input – outputprice variations which can be expressed as cost-pricesqueeze, ( ).
Subsidies Component: allows us to see the role
of direct aid, expressed in real terms, in modifying the pur-chasing power of agricultural income. Also here, the weight-ing coefficient ? measures the entity of subsidies with re-spect to the added value, and is, therefore, strictly connect-ed to the structural aspects of the crop – mix in the variousterritories.
From the analysis of the indices generated we can calculate:
Real agricultural income given by
The level of agricultural prices calculable using
The level of intermediate consumer prices (Ci) calculatedusing
The general level of prices given by
The real value of Subsidies given by
The cost-price squeeze can be calculated as
Productivity Component: allows usto attribute part of the variation in agricultural revenue tovariations in the productivity of average consumption, being
strictly related to logarithmic variations in the ratio .
Considering the different weights of the Plv and of the Ci inthe determination of Va, such that the ratio is corrected bythe weighting coefficients a e b which, as we have alreadyseen, are closely connected to the structure of agriculturalincome. Finally, we must consider that the component is apartial measure of productivity since it excludes all the oth-er production factors considering only intermediate con-sumption.
Starting from the productivity index of intermediate con-
sumption we carried out a further analysis of varia
tions in the Productivity Component.This relationship was broken down into two terms:
Unit productivity of the land.
Intensiveness of intermediate consumption or
factor intensity.The dynamic analysis carried out through percentage log-
arithmic variations of the indices allowed us to divide theincrease in the productivity component, attributing a quota
to the substitution of technical means with the land factorand an increase in the total land productivity.
Where: : variations in land Productivity; :intensity of use of intermediate consumption
Land productivity is due to the combined effects of in-creased yields, given by technical progress and by varia-tions in the product mix in favour of higher productivitycrops.
A further analysis was carried out in order to attribute theincrease in productivity to two causes:
Increased yields in individual sectors or groupsVariation in the production mix in favour of crops and/or
sectors with a higher PlvTo this end, total Plv was split up creating Divisia indices
and expressed as a sum of the two factors:
consequently
Where: Plvt = gross total national product (T) of agricul-ture; Plvi =: gross national product of the individual sector(i), ai =:weight of the sector on.
Land productivity was then expressed as:
On the basis of equation (5) the contribution of each sec-tor to was calculated in terms of unit yield.
Unit Yield is given by , consequently:
and
From the association of expressions (6) and (7), taking thesum of the weight of all the sectors as equal to 1, we obtain:
in which we can see:
a yield effect: that expresses the co tribu
tion of the yield variations “i” of the sectors to unit pro-ductivity.
Structure effect: that indicates the vari
ations in productive mix with respect to total SAU (UtilisedAgricultural Surface).
Formula (8) expresses the variation of the total agricul-tural gross national product given by the sum of the totalyield effects of each sector and the total structure effect, the
NEW MEDIT N. 3/2007
44
And a

performance of the product mix of each individual sector.For the base matrix we referred to data from ISTAT, IN-
EA and EUROSTAT relative to Gross saleable production,Added Value, Intermediate consumption and Subsidies. Forthe latter we considered only the part issued by AGEA, asthis is given directly to farmers to maintain and encouragesector productivity.
3. Evolution of agricultural incomeTable 1 shows the trend of gross saleable product (Plv), of
added value (Va) and of intermediate consumption (Ci), atconstant 1995 prices, referred to the primary sector.
For the entire period under examination, there was an in-crease in Va in Italy at ’95 prices, of 3.75%, but the trendbecame negative in the last three-year period when Va de-creased by –5.3%.
Overall increases in added value were found, however, inthe Mezzogiorno: growth is particularly evident in the twocentral three-year periods (8% and 5.6%), with a more thanpositive overall variation in the period ’94-’03 of + 15.9%.As can be seen, the growth in added value is linked to var-ious factors. In Italy the positive variation in Va in the firsttwo three-year periods, which can be identified as the yearsfollowing the Mac Sharry reform, the push given by the re-duction in intermediate consumption (-3.5%) is evident
given a variation in Plv of 1.6%. In the variation betweenthe second and third periods we can see how the increasein Plv, which is greater than in the ’93 – ’95 period, and thesmaller decrease of Ci, allow Va to have the same variationas in the previous period. In the last period we can see aninversion of the trend with a great reduction in production:- 3% and an increase in Ci of 1%, which caused a collapseof Va of – 5.3%. This effect can be better seen in the trendsof the Mezzogiorno, which had virtually zero growth in thefirst two three-year periods (0.3%), but a great contractionin Ci (- 5%). This situation allowed Va to grow by + 2.3%.In the following period there was an increase in Va of 8%,
stimulated by thereduction in Ci andby an increase inproduction of +5%. The reversalof the trend foundin all Italy in thelast variation canalso be seen in theMezzogiorno, butwith a minimal ef-fect on added valuewhich reduced itsgrowth by threepercentage pointscompared to theprevious period.
The analysis ofadded Va in Pugliashowed a reductionof 14% between thelast two three-yearperiods and a totalvariation between’94 and 2003 of –10%. This trendcan be seen for I-taly in the period2000 – 2003, butwith smaller varia-tions that do not
cause an overall positive change. Positive variations inadded value, however, are always found for the Mezzo-giorno.
Puglia fully reflects the trend for Italy; from the analysesof the first variations we can see how the reduction in Cidoes not compensate the decreasing trends in production, somuch so that Va decreased by 0.56%. In the second period,the transition between the Mac Sharry reform and Agenda2000, we can see how an increase in Va corresponds to anincrease in production, even though there is a smaller re-duction in Ci. In Puglia, as in Italy, the third period, that ofthe Mid-term review, confirms the reversed trend alreadyseen nationally, with an even clearer reduction in income.
NEW MEDIT N. 3/2007
45
Table 1: Variations Plv, Ci and Va at ’95 prices for Italy, Mezzogiorno, Puglia
We can see, in fact, a decrease in Plv of 9.4% and an increasein Ci of 6% causing a reduction in added value of – 14%.
After analysing the Plv, Ci and Va trends we need to un-derstand what these variations have meant for real agricul-tural income expressed by the ratio Va/Pilp.(Tab. 1)
From an analysis its clear that the variation in Va in theperiod following the Mac Sharry reform (’94 – ’97) in thethree areas under examination is very positive, correspon-ding, however, to a much lower increase in agricultural in-come expressed in real terms, above all in Italy and inPuglia. From the analysis of the following three-year peri-ods we can see how Va, in Italy and in the Mezzogiorno, s-lowed in growth without ever contracting. In Puglia, how-ever, it declined sharply in the last two three-year periods.
While Va remained positive in Italy and in the Mezzo-giorno, this did not stop a contraction in real terms due toinflation; in Puglia in particular this has accentuated thedecline in real agricultural income.
It is clear that Italian agricultural income, in the Mezzo-giorno and in Puglia, has been greatly influenced by pricetrends, and in particular in the last nine years, by their con-sistent increase which has had strongly negative effects onreal agricultural income.
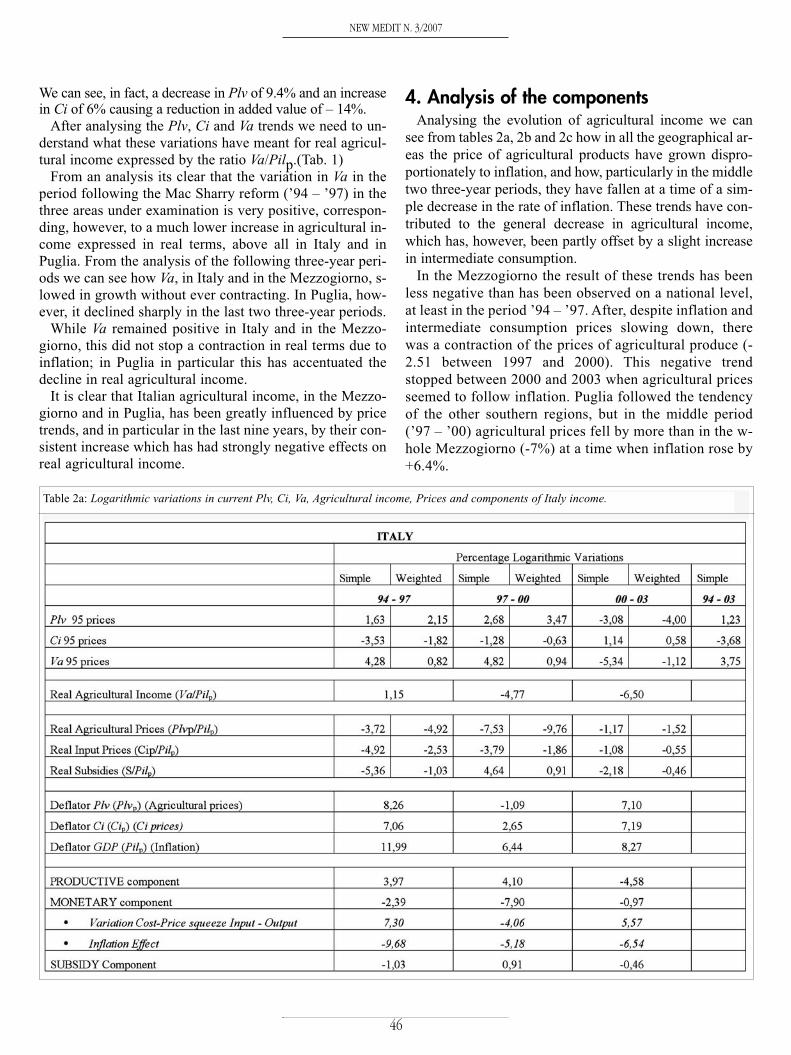
4. Analysis of the componentsAnalysing the evolution of agricultural income we can
see from tables 2a, 2b and 2c how in all the geographical ar-eas the price of agricultural products have grown dispro-portionately to inflation, and how, particularly in the middletwo three-year periods, they have fallen at a time of a sim-ple decrease in the rate of inflation. These trends have con-tributed to the general decrease in agricultural income,which has, however, been partly offset by a slight increasein intermediate consumption.
In the Mezzogiorno the result of these trends has beenless negative than has been observed on a national level,at least in the period ’94 – ’97. After, despite inflation andintermediate consumption prices slowing down, therewas a contraction of the prices of agricultural produce (-2.51 between 1997 and 2000). This negative trendstopped between 2000 and 2003 when agricultural pricesseemed to follow inflation. Puglia followed the tendencyof the other southern regions, but in the middle period(’97 – ’00) agricultural prices fell by more than in the w-hole Mezzogiorno (-7%) at a time when inflation rose by+6.4%.
NEW MEDIT N. 3/2007
46
Table 2a: Logarithmic variations in current Plv, Ci, Va, Agricultural income, Prices and components of Italy income.

NEW MEDIT N. 3/2007
47
Table 2b: Logarithmic variations in current Plv, Ci, Va, Agricultural income, Prices and components of Mezzogiorno income.
Table 2c: Logarithmic variations in current Plv, Ci, Va, Agricultural income, Prices and components of Puglia income.
4.1 The Productive ComponentThe productive component has had an important role in
agricultural income change. The variation of the productivecomponent from 1994 to 2000 (tabs. 2a, 2b and 2c) waspositive in all divisions, while production in real terms fellconsiderably from 2000 to 2003.
These trends are due to the variation in the Plv of the ar-eas under examination. In particular in Puglia, between1997 and 2000, we see a growing increase in productioncontrasted by a growing contraction in intermediate con-sumption. These trends correspond to the full application ofthe Mac Sharry reform, which determined the move to bet-ter performing productive mixes and favoured a slight con-tainment of intermediate consumption causing a less in-tense use of factors through a greater attention to agro-en-vironmental aspects (set-aside and cereals). In particular, inthe first three-year period we see a fall in production of1.7% when there was a Ci reduction of -5.2%; in the fol-lowing three-year period the Plv variation was positive inline with that of Italy. This type of variation can be seen inall the areas. In the last three-year period, both in the wholeMezzogiorno and above all in Puglia there was a contrac-tion in Gross saleable agricultural product and a growth inintermediate consumption. Total variations in ’93 – ’04were positive in all the areas examined, except in Puglia. Infact, in the 12 years examined, in Italy there was growth of+1.3% for Italy and +2.5% for the Mezzogiorno, but a totalfall in Puglia of -8.4%.
The total variation in intermediate consumption was neg-ative in all the areas examined, a sign of the move to lessintensive sequences and the adoption of technology with aless intensive use of machinery.
From the trend described we can see that the productivecomponent had a positive effect on the evolution of agri-cultural income in Italy and in the Mezzogiorno, but ex-tremely negative in Puglia where it caused a total reductionof 10% of added value.
Community Policies through the years have brought agradual reduction in subsidies and this has caused a fall inproduction, bearing in mind, however, that the Plv exam-ined also includes the subsidy quota. The Community Agri-cultural Policy applied in the early years of this centuryhave had a great influence on production in Puglia, dis-couraging low income crops like cereals and totally sepa-rating the subsidy.
4.2. The Monetary ComponentThe monetary component had a limited role in agricul-
tural income variation in the first and last three-year peri-ods studied, but it was a determining factor for agriculturein the 1997 – 2000 period. In fact, the variations rangefrom slightly positive values, as in the Mezzogiorno andPuglia, +0.45% and +1.5% respectively in the ’94 – ’97 pe-riod, to extremely negative values (-9.9% and -13.8%) forthe same areas in ’97 – ’00. There was clearly a negativeeffect of this component, more evident in Puglia, with re-
spect to the average in Italy and in the Mezzogiorno as awhole.
Analysing the variations we can state that in the first pe-riod (1993 – 1997) the monetary component had negativeeffects on variations in real income for Italy, mainly due toan inflationary effect that was not compensated by an input– output cost-price squeeze. This “squeeze”, however, wasevident (+10.15 Tab.2b) in the Mezzogiorno, where itcaused a total compensation of the negative effect of infla-tion. In Puglia there were even better results than those forthe Mezzogiorno (+11.28 Tab.2c). This first trend can beexplained, above all in Puglia and in the areas of the Mez-zogiorno, by the effects of the Community Policy followingthe Mac Sharry reform, which encouraged movement toless intensive farming and a lower rise in Intermediate Con-sumer prices than that of the agricultural products.
In the following period (1996-2001) we see an inversionof the trend, following the considerable fall in the price ofagricultural products at the same time as a great increase inintermediate consumption. This brought about a very nega-tive effect on the monetary component, despite a fallingrate of inflation. The most negative value of all the areasexamined can be found in Puglia, where agricultural pricescollapsed with respect to other areas, despite the fact thatthe increase in Ci prices was similar to that found in all ofItaly. This type of trend cannot be directly attributed to theeffects of the community agricultural policy, but more to I-taly’s exit from the European Monetary System. With theexit from the EMS in the early 90’s the Lire was stronglydevalued. This caused the prices of agricultural means ofproduction, mainly bought from abroad, to rise, and a fall inthe price of agricultural produce due to an increase in ex-ports. Furthermore this situation gave rise to an increase ininvestment abroad, in countries where a stronger currencywould allow the product to be more competitive.
In the last period studied, the situation got much better asagricultural produce prices started to grow again, both inPuglia and in the Mezzogiorno, at a much higher rate thanthe increase in intermediate consumption. Only in Italy wasthere a slightly negative variation due to a higher Ci in-crease with respect to other areas.
Finally, analysing the difference between the influenceof production and that of intermediate consumption onthe creation of agricultural added value we can see that,in all the areas examined, there was a fall, in terms ofquantity, of intermediate consumption, with a greater fallin Puglia. This was due to a rise in the price of technicalmeans giving them greater importance in the companies’balance sheets. This brought about an evolution of agri-culture in Italy and above all in Puglia towards extensiveproduction.
4.3. The subsidy componentDuring the period of full application of the Mac Sharry
reform there was a considerable increase in direct fundingfor the Mezzogiorno and Puglia with respect to the trend in
NEW MEDIT N. 3/2007
48

Italy where subsidies tended to be reduced. The communi-ty gave a great contribution to the agricultural income ofproducers in the Mezzogiorno. In the period from ’97 to2000 this trend of increasing subsidies in the southern re-gions continued, but the rise was less steep. In Puglia thetrend became negative, bringing a consequent reduction inagricultural revenue. With Agenda 2000 there was a reduc-tion in linked funding in favour of separate subsidies tied toquality and agro-environmentally friendly practices. It iseasy to see how Puglia, with an agriculture mainly based onheavily subsidised crops, such as cereals and olives, foundit very difficult to adapt to the new rules with respect to oth-er regions. In the third period there was a further constantreduction in subsidies as provided for in Agenda 2000 andthe following Mid-term review. Puglia was more affectedby the reduction in subsidies for agricultural income thanthe other areas examined, with a fall estimated at -1.9%(tab. 3c). The other areas also suffered a negative effect onincome because of these reductions, but for a more preciseanalysis we need to look at the role of subsidies in the cre-ation of added value. To do this we need to look at theweighting coefficient? (Graph.1)
We have seen how, despite their progressive reduction,community subsidies have become over time an importantpart of agricultural added value. This phenomenon is moreevident in the situation of agriculture in Puglia where sub-sidies play a greater part in creating Va and therefore agri-cultural income.
This analysis of the components of agricultural incomeshows how Community Policies have had a marginal role,not supporting agriculture in the periods when it neededsubsidies and taking on the simple role of helping farms tosurvive without providing effective incentives for remuner-ative innovations and changes.
5. Evolution of agricultural income in thecereals and olive sectors in Puglia
A further analysis evaluated the effects of the policieson farmers’ income in terms of variations in productivi-ty and intermediate consumption. Below are the resultsof the analysis carried out on two sectors of agriculturein Puglia. The sectors of cereals and olives were evalu-ated on the basis of both the contribution of each to thePlv of the corresponding sector at a national level (about10% for cereals and over 37% for olives) and the highlevel of subsidy that these sectors have enjoyed in thepast.
5.1. The cerealsIn the cereal sector we examined: durum wheat, soft
wheat, maize, barley, oats and rye. These crops are con-sidered the most representative, both because of the fre-quency of their cultivation within the regions and for theimpact they have on total Plv in the sector (9.6% of Ital-ian Plv).
NEW MEDIT N. 3/2007
49
Graph 1: Variations in weighting coefficient? in Italy, Mezzogiorno and Puglia

As can be seen in Graph 2, in Puglia there is a fall inyields in the period after the Mac Sharry reform (’94 – ’97):the fall is much sharper than in the rest of Italy and in theMezzogiorno: -15.3%, and a slower growth in surface area,+2.3%. In the transition period between the Mac Sharry re-form and Agenda 2000 the fall in yields continues, but s-lower (-14.3%), and there is a reduc-tion in the surface area destined for thissector (-1.1%). On the contrary, in acomparison between the last two three-year periods (’99 – ’01, ’02 – ’04) af-fected by the Mid-term review, we cansee a considerable increase in the sur-face area dedicated to cereal crops,+10.4%, unlike in other areas, but nocorresponding increase in yields.These continue to be negative (-3.3%),showing a tendency for extensification.
On the whole, in the first period, thesurface increase and the fall in yields inthe cereals sector can be justified by thecultivation of more marginal soils aswell as those traditionally cultivated,because of the chance to receive subsi-dies.
In the second period, the obligatoryset-aside and the introduction of re-gionalised yields caused a reduction inthe surface areas cultivated. In Puglia,which has a larger SMN and a supple-
mentary bonus for the tradition-al areas, this fall was much lessthan in the other areas exam-ined. The introduction of re-gionalisation and different fund-ing for cereals as opposed tooilseeds and proteins caused amigration of the latter to moreproductive areas, causing an in-crease in SAU and in yields.
In the last period there was ageneral increase in the surfacearea dedicated to cereals, partic-ularly in Puglia. This increasewas probably caused by the con-version of the SAU dedicated tooilseeds and proteins, industrialcrops and market gardening intoareas for growing cereals. Thisconversion was due to the re-duction of subsidies for theseproducts and the introduction ofaid directed at surface areas andquality bonuses. The increase insurface area caused increases inyields, probably due to the con-
centration of crops in the more productive areas and to a-bandonment and set-aside (+10% of the surface area).
5.2. OliveIn Puglia olive cultivation is even more important than in
the Mezzogiorno and in the rest of Italy (Graph 3).
NEW MEDIT N. 3/2007
50
Graph 2: Three-year variations in yields and of SAU of cereals in PUGLIA centred on the year of reference.
Graph 3: Three-year variations in yields and of SAU of olives in PUGLIA centred on the yearof reference
In the period following the Mac Sharry reform there werepositive variations in yield, with trends similar to those seenfor Italy and for the Mezzogiorno: +7.5%. The surface areadestined for olive cultivation, however, unlike the trends forItaly and the Mezzogiorno, fell by -2.3%. in the transitionperiod between the Mac Sharry “bridging reform” and A-genda 2000 there was a drastic reduction in production,causing a negative variation in yield, both in simple termsand in relation to the whole agricultural sector in Puglia: re-spectively -28.4% and -5.4%. The surface areas under cul-tivation, however, were the same as in the previous period.In the whole period we can see the effect of the applicationof law 2092/91, regarding the field of biology. It seemsclear, from an analysis of statistics supplied by INEA, thatItaly, and above all Puglia, converted rapidly from tradi-tional to organic farming methods. Puglia is the prime pro-ducer of organic olives with 50% of the total for Italy, andin the last three-year period 30% of farms converted. Thisconversion from traditional to organic olive farming led toa consequent fall in yields which could partly justify thetrends we have seen.
In the third period, affected by the Mid-term review, pro-duction grew again, with a positive influence on weightedyields for the entire agricultural sector (+3.7%) and a rea-sonable growth of simple yields: +24.6%. The increase inproduction also had a positive influence on surface areaswhich grew with a positive SAU variation of +7.3%. As wehave already seen, the increase in yields is probably due tothe subsidised planting of new areas for olive production,which was also encouraged by a larger bonus for small pro-ducers.
From a global analysis of the trends for yields and surfaceareas of olive cultivation we can see that in the first periodexamined there was an increase in yields because of linkedsubsidy, such as aid for consumption and for production.The latter were also given to small producers under theform of a higher subsidy. Puglia, being characterised by alarge number of small farms, benefited from this. Surfacesunder cultivation generally increased, except in Puglia,where they fell slightly. In 1998 the Oil COM was reformedthrough Regg. 1638-1639/98, causing the disappearance ofaid for consumption and a great reduction in aid for pro-duction. This notable reduction in aid led, in the second pe-riod, to a corresponding fall in yields in all the areas exam-ined, encouraging the extensification of growing tech-niques.
The years between 1998 and 2004 saw the introduction oftwo other Regulations (1513/01; 1019/02) which broughtsubstantial innovations to the pre-existing rules: aid for newplantations, for the conversion of old plantations, bonusesfor quality and the constitution of a Geographic Informa-tion System. These innovations led to a growth in surfaceareas in all the territories examined, while in Puglia, a tra-ditional olive growing area they brought about an increasein yields. From this we can see how, in the last period, theEuropean Community opted for a policy of improving qual-
ity rather than quantity in order to combat the competitionfrom the entry of new producing countries into the EU.
6. ConclusionsAnalysing the individual components of agricultural in-
come we can state that in Italy the main cause of falling in-come has a monetary origin, above all inflation, and to alesser extent the reduction of subsidies. We can see how, inthe three-year period ’97 – ’00 the tightening of the input-output cost-price squeeze had an important influence onfalling income. In the ’00 – ’03 period, however, we can seehow the main cause of the contraction of real income is thefall in production.
For the Mezzogiorno we can state that agricultural in-come grew in the first period (+2.64%), above all thanks tothe push of production, and despite a negative inflation ef-fect of around 10% - compensated, however, by a cost-pricesqueeze of about the same amount. In the ’97 -2000 periodthere was still an increase in production, but not enough tocompensate for the cost-price squeeze (-8.06%) which, to-gether with inflation (-5.2%) caused negative growth in themonetary component. In the last period examined there wasa further cost-price squeeze encouraging growth in themonetary component. In the same period production fellwith the reduction in subsidies.
The indices for Puglia show similar, but more accentuat-ed trends compared to Italy and the Mezzogiorno. On thewhole, from 1996 agricultural income in Puglia declinedmore than in Italy and in the Mezzogiorno. In the first peri-od we see a near stagnation in production and a level of in-flation equal to that on a national level, compared to a cost-price squeeze of 11.3% and an increase in subsidies of2.5%. in the following period there is a considerable effectof the monetary component on the reduction in agriculturalincome with respect to the other areas (-13.8%), greatly in-fluenced by the cost-price squeeze (-11%). To this negativeeffect we must add the fact that subsidies did not grow. Inthe last two three-year periods we see a considerable fall inproduction (-12.6%), which is not compensated by a trendinversion of the monetary component of income which re-turns to growth, pushed above all by the fall in the cost-price squeeze.
It is clear how community policies in the last 9 years havecaused a reduction in the incidence of subsidies on income.
The subsidy systems of the COMs have certainly causedgreat variations in crop distribution throughout the region. Inparticular, Community Policies applied through the variousCOMs have encouraged the growth of SAU laid down for ce-reals. In Puglia, where the main product is durum wheat, thishas partly replaced the oilseeds and protein crops, industrialcrops such as sugar beet and tobacco, forage and probably al-so areas previously used for market gardening.
Market gardening has been “concentrated” in the moresuitable areas where there has been an increase in yieldsdue to an intensification of the growing techniques (fertilis-er, intense rotation, protective measures etc.).
NEW MEDIT N. 3/2007
51

The system of incentives through bonuses for transfor-mation and above all for the producers, the aid for replant-ing in the fruit and vegetable COM has seen an expansionin the surface area and improved yields for the main stonefruit trees (Clementine, cherry, peach) since 2001.
Olive cultivation seems to have seized the opportunitiesoffered by Community Policies, above all since 2000, witha progressive increase in yields and a reduction of the SAU.This increase can be put down to the creation of the SIG(Geographic Information System), which has allowed a de-tailed control of national olive cultivation. The increasedyield is probably due to new, more productive plantationsand to the adoption of innovative technology encouragedby the policies.
The wine sector, thanks to incentives to plant new vari-eties given by Community Policies and to the fruiting ofnew, more modern plantations, has improved its perform-ance through an increase in the quality of the product, con-firming Puglia’s vocation for wine production, to the pointwhere, unfortunately, national and international producersare moving in with greater potential for massive investmentand greater power in the market.
The table grape sector, unlike the other fruits, has beenmore subject to price fluctuations and marketing problems,and in the last period yields fell.
On the whole, recent policies seem to have favoured theconcentration of crops for which Puglia has a traditionalvocation (olive, market gardening, fruit) in the irrigated ar-eas where intensive growing techniques are used, and theproductivity and further distribution of cereals, in particulardurum wheat, in the marginal areas with scarce water sup-plies. The wine sector also seems to have taken up the op-portunities offered by the new CAP.
Despite all this, in terms of agricultural income, farmingin Puglia has had decidedly worse results than in the otherareas examined. This can at least be partly explained by“end of the line” problems in agricultural production. Theinability of the farmers to approach either the market or theprocessing industry because of inadequate prices and low a-gricultural wages. The reasons for this low bargaining pow-er can be found in the structural aspects of farms in Puglia(size, fragmentation, high average age of the farmers, etc.)and the insufficiency and often inefficiency of the associa-tions in the territory.
The scene described appears even more worrying with theprospect of the new Fischler reform coming into force.
The single farm bonus will be more or less independentfrom the choice of crops by the farmer, and from the type,quantity and quality of production, and income will be leftexclusively to the ability to operate on the market.
BibliographyCARBONE A, SORRENTINO A, Giugno 1998. Fattorireali e monetari nell’evoluzione del reddito agricolo primae dopo la riforma Mac Sharry, Rivista di Economia Agrariaanno LIII, NN 1-2, Istituto Nazionale di Economia Agraria.
CHRISTENSEN L.R.,1975. Concepts and Measurement ofAgricultural Productivity. American Journal of AgricoltureEconomics, vol.57.CIOFFI A., SORRENTINO A., 1997, La piccola azienda ela nuova politica agricola dell’Unione Europea, Problemi e-conomici e strutturali. Franco Angeli.CIOFFI A., SORRENTINO A., 1997, Prime riflessioni su<< Agenda 2000>>: quale futuro per la Politica Agricoladell’Unione Europea?, Rivista di Economia Agraria, n.6DE MEO G. 1996. La filiera olivicolo-olearia in Puglia,Istituto di Economia e Politica Agraria – Università deglistudi di Bari, Puglia Grafica Sud.DE FILIPPIS F., MASTROSTEFANO M., 1985. Analisi eprospettive della diffusione regionale dello sviluppo agrico-lo. La questione Agraria, n.18.DE FILIPPIS F., ZEZZA A., 1993. La PAC prima e dopo lariforma Mac Sharry. Convegno INEA, Roma.FAGIANI G., DE MURO P., SCARANO G., 2000. Le tra-sformazioni strutturali dell’agricoltura meridionale: dallosviluppo agricolo allo sviluppo territoriale. Convegno distudi Manlio Rossi Doria e le trasformazioni del Mezzo-giorno d’Italia.FINTOLA R., 1995. La spesa pubblica in agricoltura, studie ricerche. INEA.GATTO E.,1996. Riforma della PAC e controllo della pro-duzione: l’efficacia del set-aside nel comparto cerealicolo.La Questione Agraria, n. 62Hulten C.R.,1973. Divisia Index Number. Econometria,vol. 41INEA, Osservatorio Puglia, Maggio 1997, L’agricoltura inPuglia 1997. Osservatorio sul mondo rurale e sul sistema a-groindustriale della Puglia. INEA, Osservatorio sulle Politiche Agricole dell’UE, Mag-gio 1997. Rapporto sulle politiche agricole dell’Unione Eu-ropea..INEA, Osservatorio sulle Politiche Agricole dell’UE,Dicembre 1998. Rapporto sulle politiche agricole dell’U-nione Europea 1997.INEA, Osservatorio sulle Politiche Agricole dell’UE, Giu-gno 1999. La riforma della PAC in AGENDA 2000, delleproposte alle decisioni finali.INEA, Osservatorio sulle Politiche Agricole dell’UE, Giug-no 2000. Le politiche agricole dell’Unione Europea. Rap-porto 1998-99.INEA, Osservatorio sulle Politiche Agricole dell’UE, Mar-zo 2000. La modulazione degli aiuti diretti della PAC in I-talia.INEA, Osservatorio sulle Politiche Agricole dell’UE, Giug-no 2001. Le politiche agricole dell’Unione Europea. Rap-porto 2000. INEA, Osservatorio sulle Politiche Agricole dell’UE ,Giugno 2004. Le politiche agricole dell’Unione Europea,Rapporto 2002-03.INEA, Osservatorio sulle Politiche Agricole dell’UE. La ri-forma dell’Organizzazione Comune di Mercato nel settoredello zucchero: uno studio per l’Italia.
NEW MEDIT N. 3/2007
52
INEA, Istituto Nazionale di Economia Agraria. Annuariodell’agricoltura italiana, various issues.INEA, Istituto Nazionale di Economia Agraria. L’agricoltu-ra italiana conta, various issues.INEA, Osservatorio Puglia. L’agricoltura in Puglia, annatevarie. Osservatorio sul mondo rurale e sul sistema agroin-dustriale della Puglia.ISTAT, Luglio 2002. Valore aggiunto ai prezzi di base del-l’agricoltura per regione, anni 1988-1998.ISMEA, Luglio 2005. L’evoluzione del mercato delle pro-duzioni biologiche, l’andamento dell’offerta, le problemati-che della filiera e le dinamiche della domanda.ISTAT. Statistiche dell’agricoltura, annate varie, Istituto na-zionale di statistica.MARIANI A.C., Vigano E., 1992. Simulazione dell’impat-to della riforma della PAC sul reddito delle aziende agricolenelle regioni meridionali. Rivista di Economia Agraria, n.3.P. CONFORTI, F. DE FILIPPIS, L. SALVATICI. Dicembre2002. Mid-term review of the common agricultural policy:assessing the effects of the commission proposals. INEA.PIEVANI P., RIZZI P.L., 1991. Produttività totale dei fattorie progresso tecnico nell’agricoltura italiana: un’analisi re-gionale. Rivista di Economia Agraria, n.2.POMARICI E., SORRENTINO A., 1998. L’evoluzionedell’agricoltura italiana 1986-1996, Primo rapporto. Fair-Capmedit, Dear, Viterbo e CSREAM, Portici (Na)POVELLATO A., BEATRIS E. VELASQUEZ, Giugno
2005. La riforma Fischler e l’agricoltura italiana. Inea. RomaROSSI N., 1988. Un modello econometrico del sistema a-gro-alimentare italiano. ISMEA, Franco Angeli.SCKOKAI P., MESCHINI G.,1993. Interventi <<disaccop-piati>>, riforma della PAC e redditi agricoli: un’analisiqualitativa. Rivista di Economia Agraria XLVIII.SORRENTINO A., 1990. Politiche macroeconomiche esettore agricolo in Italia, in M. Gorgoni, A Zezza, Scarsità esovrapproduzione nell’economia agroalimentare. INEA.SORRENTINO A., 1995. Riforma della PAC e mercato deifattori. La Questione Agraria n.57.VIERI S., 1994. La politica agricola comune, dal trattato diRoma alla riforma Mac Sharry. Ed agricole.
Internet sourcesFonte: http://con.istat.itFonte: http://epp.eurostat.ec.europa.euFonte: http://europa.eu/scadplus/Fonte: http://www.foruminternazionale.coldiretti.itFonte: http://www.inea.itFonte: http://www.ismea.itFonte: http://www.istat.itFonte: http://www.istruzioneonline.itFonte: http://www.politicheagricole.itFonte:http://www.sementi.it/aree_tematiche/riforma_PAC.htmFonte: http://www.trend-online.com
NEW MEDIT N. 3/2007
53