GIS in the Emergency Operations Center - URISA Winners... · June, 2017 GIS in the Emergency...
25
June, 2017 GIS in the Emergency Operations Center SANDY SPRINGS, GEORGIA Application to the URISA Exemplary Systems in Government award (ESIG), a Single Process System.
-
Upload
trinhduong -
Category
Documents
-
view
224 -
download
1
Transcript of GIS in the Emergency Operations Center - URISA Winners... · June, 2017 GIS in the Emergency...
June, 2017
GIS in the Emergency
Operations Center SANDY SPRINGS, GEORGIA
Application to the URISA Exemplary Systems in Government award
(ESIG), a Single Process System.

InterDev | Atlanta – Chicago 1
Contents A. GIS in Emergency Operations Center ............................................................................................................... 1
B. Jurisdiction: The City of Sandy Springs, Georgia ............................................................................................. 10
C. System Design ................................................................................................................................................. 11
D. Implementation .............................................................................................................................................. 14
E. Organizational Impact ..................................................................................................................................... 16
F. System Resources ........................................................................................................................................... 21
A. GIS in Emergency Operations Center
A1. Name of System and Category Name GIS in the Emergency Operations Center (EOC) for Sandy Springs, Georgia.
Category Single Process System

InterDev | Atlanta – Chicago 2
A2. Letter from Executive Administrator The letter supporting this application is provided by Jonathan Crowe, Director of Information Technology for
Sandy Springs, Georgia.
InterDev | Atlanta – Chicago 3
A3. Summary
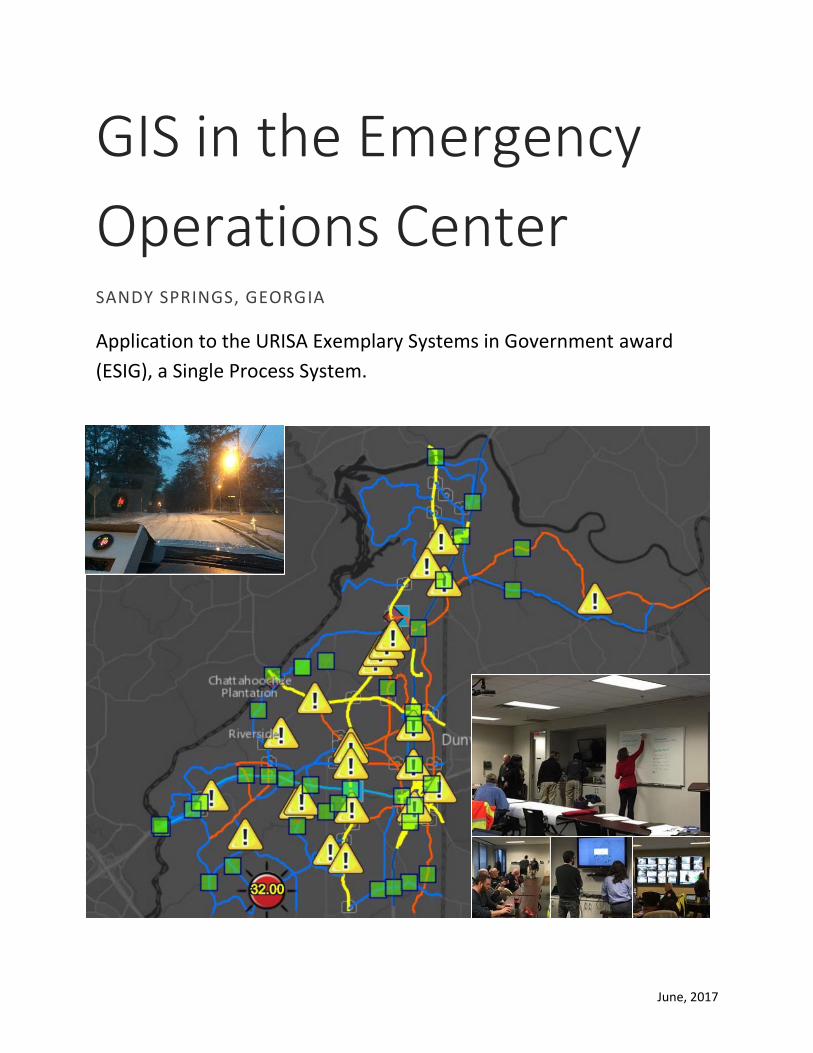
The Emergency Operations Center (EOC) is the primary hub of planning, deployment response, and
information management during an emergency event. In late 2016 through early 2017, the City of Sandy
Springs developed an agile mapping system for tracking real-time data during storm events. The GIS map
hosted through ArcGIS Online was a centrally managed communication tool to facilitate dispatch of snow and
salt operations and field crews to clear incidents such as fallen trees.
In past winter events, road temperatures were monitored by handheld devices and reported hourly to the
EOC through email, calls, and text messages. The GIS team saw an opportunity to improve field collection
services and reduce email chatter. During an emergency planning session, GIS offered to create a mobile
application using Esri ArcGIS software for this specific task. This initiative was a targeted task-based approach
to bringing real-time GIS to emergency operations. Focusing the application on specific tasks allowed staff to
develop solutions with needs, users, and roles already identified. The project quickly proved successful and
was expanded in functionality and deployment.
Key components of the system include a central web map displaying real-time field data collection, accurate
reference layers, and mobile access to the same map for all parties. The map allows user input of data such
as road temperatures and active incidents including uploading of photos, updating statuses, and adding
notes. After the event, data can be exported for reporting to other agencies and clean-up efforts.
User accounts and software are provided through an Esri Enterprise License Agreement. Primary hardware
consists of the EOC infrastructure such as large monitor displays, public safety radios, data hosting on ArcGIS
Online, field hardware and temperature gauges, and mobile devices for field collection. The GIS Team worked
closely with Information Technology to federate ArcGIS Online user accounts with Windows Active Directory
to maintain a single-sign-on experience.
Using a centrally managed GIS map increased efficiencies, reduced redundancy, and helped provide a clear
picture of current conditions. Using a Common Operating Picture, managers, field and administrative staff
were all able to quickly understand the same status of operations. Briefings and shift changes were easily
facilitated by walking through the various incident locations placed on the map. The GIS map with mobile
data access is currently deployed during any EOC activation or used by Field Services when three or more
trees have fallen in a storm event.
Although multiple departments use this tool, it is submitted as a Single Process system because the GIS map
and data collection are used during singular events to facilitate a specific process, the activation of the EOC
and emergency response management. Full-time GIS and IT services for the City are provided by InterDev,
LCC, a managed IT and security company.
InterDev | Atlanta – Chicago 4
A4. User Testimonials
User testimonials have been provided by departments impacted by this system. This includes Public Works
managers and administrative staff, Field Services workers who used the mobile applications during the event,
and the Fire department coordinating the Emergency Operations Center. Additionally, a public highlight
published on the city's Facebook page by the Communications department is also included.
1. Donald Kahn, Field Services Manager
2. Cheryl Oslund, Administrative Coordinator for Field Services
3. David Johnson, Field Services Superintendent
4. Craig Miceli, Administrative Affairs Officer for Fire Department
5. City of Sandy Springs Facebook page highlighting the GIS EOC map.

InterDev | Atlanta – Chicago 5
Donald Kahn, Field Services Manager

InterDev | Atlanta – Chicago 6
Cheryl Oslund, Administrative Coordinator for Field Services

InterDev | Atlanta – Chicago 7
David Johnson, Field Services Superintendent
InterDev | Atlanta – Chicago 8
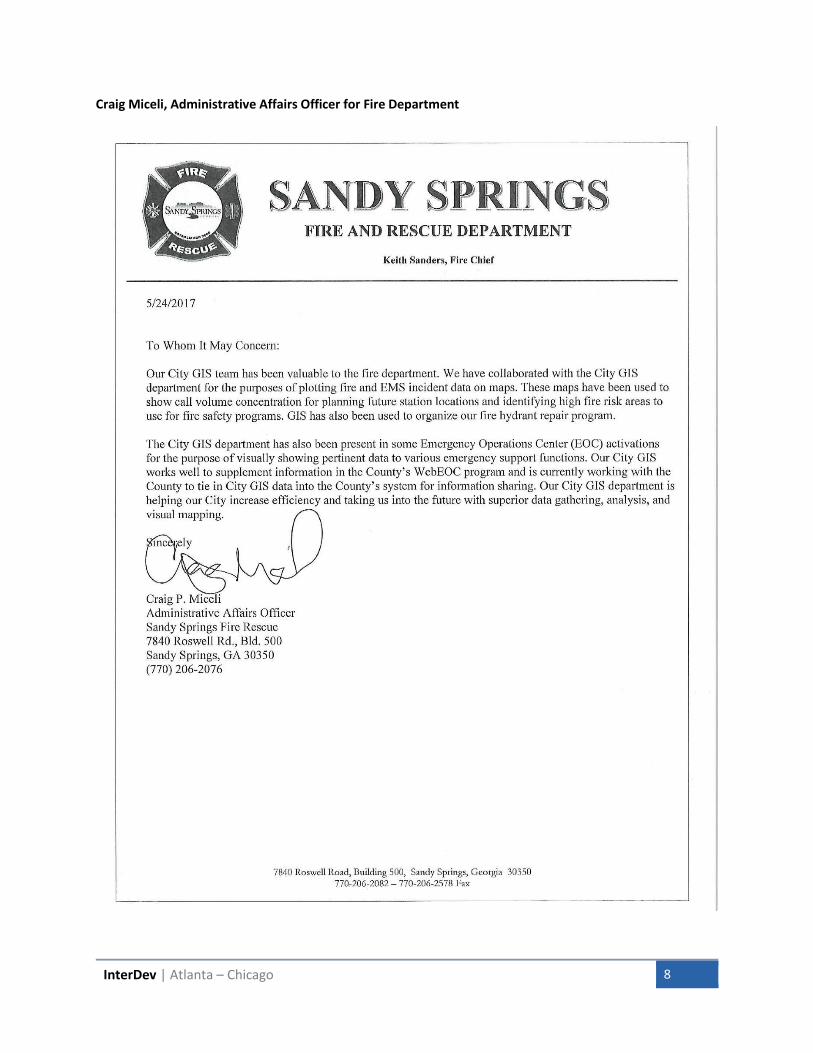
Craig Miceli, Administrative Affairs Officer for Fire Department

InterDev | Atlanta – Chicago 9
City of Sandy Springs Facebook page highlighting the GIS EOC map.
“We love technology and the winter weather has provided an exciting challenge for our GIS team. To
help us track our bridges and roadways, along with temperatures and road conditions, they've
created this mapping system. It also includes an overlay showing wind and temperature and tracks
our personnel as they check hotspots around the city.” - City of Sandy Springs Jan 6, 2017

InterDev | Atlanta – Chicago 10
B. Jurisdiction: The City of Sandy Springs, Georgia
B1. Name of Jurisdiction
City of Sandy Springs, Georgia
B2. Population served
Sandy Springs is home to 105,703 residents (US Census Bureau 2016).
B3. Annual Total Budget of the Jurisdiction
“The proposed budgets for all operating, capital and special revenue funds total $401,735,771. The City’s
General Fund provides for general government operations of the City and maintains adequate working
capital necessary for the City’s financial health and stability. This fund accounts for most of Sandy Springs’
operations and has a budget of $103,562,695.”
John McDonough, City Manager. 2017 Approved Budget.
http://www.sandyspringsga.gov/home/showdocument?id=11305
B4. Chief Elected Official
The Honorable Rusty Paul
Mayor of the City of Sandy Springs
7840 Roswell Road, Bldg. 500
Sandy Springs, GA 30350
Phone: 770.730.5600
Email: [email protected]

InterDev | Atlanta – Chicago 11
B5. System Contact
Primary
Langdon Sanders
GIS Analyst II, Information Technology
Public Works, City of Sandy Springs
7840 Roswell Road, Bldg 500
Sandy Springs, GA 30350
Phone: 770-206-2084
Fax: 770-206-1480
Email: [email protected]
Secondary
Phone: 770-730-5600
Email: [email protected]
C. System Design
C1. What motivated the system development?
In the fall of 2016, the City of Sandy Springs reviewed emergency operation plans for winter weather events.
With the chance of ice forming on roadways, Public Works and Public Safety personnel planned to closely
monitor road and bridge surface temperatures to quickly deploy targeted de-icing operations.
Communication during the event was identified as a clear opportunity for improvement. In past years, radio
exchange, email chains, and telephone calls were the primary means of exchanging pertinent information
between field staff and the Emergency Operations Center (EOC). During these discussions, the GIS team
proposed using mobile GIS data collection and the Esri ArcGIS Online platform for data sharing. Digitally
recording data in the field with live results shown on a central map would reduce time and inefficiencies in
communicating these important environmental factors.

InterDev | Atlanta – Chicago 12
C2. What specific service or services was the system intended to improve?
The initial scope was intentionally narrow. The first task was to facilitate the collection and reporting of road
temperatures and display readings on a centralized map. After its initial success, functionality was broadened
to show additional layers such as weather conditions, road closures, real-time incidents (such as fallen trees,
major accidents, and icy conditions), and GPS tracking. This visual display improved resource management
during the event.
C3. What, if any, unexpected benefits did you achieve?
This project introduced departments to practical applications of GIS beyond traditional cartography. The
system was a highly effective educational device. Fire, Police, Field Services, and Communications personnel
monitored the event with real-time and reference information in one place. Additional projects were
requested using the same GIS platform, demonstrating the new knowledge of GIS applications.
The system also proved a valuable pilot exercise for other projects and acted as a training exercise.
Documentation for this system was the foundation for non-emergency related field activities, serving as a
model for future projects. Staff were trained on how to use ArcGIS Collector, ArcGIS Online, and engage in
the Enterprise GIS services at Sandy Springs. Starting with only limited participation by GIS and Planners, the
ArcGIS Online user group has grown to 109 users from all City departments.
C4. What system design problems were encountered?
The project team experienced technical limitations and matters of human resource management. Technical
difficulties were relatively minimal and less than expected upon the launch of the system. Instead, training
and user tracking required more time than setting up the initial map and deploying the software.
Technical Limitations:
The system uses enterprise logins of the City’s Windows Active Directory Federated Services (ADFS) accounts
integrated with ArcGIS Online.1 This feature is available through ArcGIS Online organizational settings but
requires specific setup and coordination with the IT department. While there is an initial layer of complexity
on setup, this allowed users to manage their own passwords, not have to create new passwords or logins for
the system, and reduced the user management role of the GIS team. This required the use of a Virtual Private
Network (VPN) software on each mobile device and additional training on logging in. This was the only source
of dependency on Sandy Springs hardware resources. If a connection through VPN to the Sandy Springs
1 Configure ADFS with ArcGIS Online: http://doc.arcgis.com/en/arcgis-online/reference/configure-adfs.htm (training video also available at https://www.esri.com/training/).

InterDev | Atlanta – Chicago 13
network failed, users were unable to login. Back-up accounts managed entirely by ArcGIS Online were
generated as a fallback plan to mitigate this risk.
Human Capital:
Design problems for human capital did not take into account the large user base and need for ongoing
reminders and training. Some users did not bring their mobile devices to the event so they were not able to
participate in the field collection services. Battery life of mobile devices is a potential limitation but was
alleviated by in-vehicle chargers. Additionally, the current collection process requires manual data entry on
tablets which is not safely possible for one-person driving crews. Only two-person crews were able to
participate in active field collection. Creation of custom documentation with screen captures of each step
was somewhat time intensive; however, this resource proved invaluable during the event as it could be
quickly printed and distributed to new users and was also used in other projects.
Although the current map provides a common view of operational data, it is still maintained by a largely
manual process. Field collected events are manually inputted with mobile devices and touch pad entry of
data. Active incidents from E911, the citizen Call Center, and other reports are manually drawn on the map
using ArcGIS Online edits. Only the reference REST web services such as weather conditions are automatically
updated. Future integrations with other emergency management software, dedicated GPS devices, and
temperature hardware would strengthen the system
As calls and incident update requests were reported in quick succession, they were recoded briefly as notes,
then demarcated when they had been entered in the mapping system.
Handwritten log of incidents and map update requests quickly noted before adding details to the map.

InterDev | Atlanta – Chicago 14
C5. What differentiates this system from other similar systems?
The system is unique at the city because it displays all pertinent field activities for the emergency event
regardless of source. Public Works Field Services and Public Safety personnel utilize different systems for
their daily operations. The Emergency 911 Computer Aided Dispatch (CAD) currently supports display and
dispatch of incoming calls for Police, Fire, and other daily emergencies, but did not have other data from Field
Services such as downed trees, snow routes, or clean-up tasks. While 911 calls were available to Public Safety
departments, this data was not readily available for Field Services workers. Field Services use a different
system for asset management and work order tracking which is not utilized by Public Safety personnel. The
GIS map allowed for easy input of basic information without being bogged down in software dependencies or
complicated integrations.
Additionally, all data and maps were hosted using Esri ArcGIS Online with no hard dependencies on servers at
the city. This guaranteed access to the maps with only an internet connection, safeguarding against any
potential disruptions at the City servers. This system was also the first major implementation of a new
Enterprise License Agreement purchased in Fall of 2016.
D. Implementation
D1. What phases did you go through in developing the system?
1. Proposal
a. During review of previous events, inefficiencies of communication were identified.
b. Knowledge of existing GIS technology was used to propose a map-centric solution for
mobile field collection.
2. Design
a. An ArcGIS Online web map was created as the main viewport for data.
b. Reference data such as snow and salt routes were organized and hosted on ArcGIS
Online
c. An editable feature service for road temperatures was designed with limited number of
data fields for ease of data entry.
d. A mock-up of the map was demonstrated to managers for feedback and field collection
was tested on mobile devices.
e. Review comments were used to improve field collection and map design.
f. ArcGIS Online content was organized and shared to departmental groups such as Fire,
Public Works, and Communications.
g. Enterprise logins using Windows Active Directory Federated Services was integrated
with ArcGIS Online.

InterDev | Atlanta – Chicago 15
3. Training
a. Detailed documentation was created with screen captures and step-by-step
instructions. These "how-to" guides were written for the end user who does not have
any GIS knowledge and has never used Collector for ArcGIS previously.
b. A spreadsheet was used to track each user and their setup process such as access to
their account, VPN software, and ability to collect data.
c. Two mandatory training sessions were scheduled with Public Works field staff as an
overview of the system and live demo with required steps for follow-up with GIS Staff.
Each user also received at least 15 minutes of individual training and walk-through to
make sure they completed the enrollment and setup process.
4. Deployment
a. A winter weather event in January 2017 was the first live deployment. The GIS team
staffed two 12-hour shifts in the EOC, provided copies of user documentation, and
oversaw the use of the EOC web map.
b. During the event, a new editable layer was created on-the-fly to store incident
locations. This layer then became the key focal point of the project and later
deployments.
5. Refinement
a. The GIS team conducted a written review of the event and identified successes and
areas of improvement. Additional review and refinement was completed with Field
Services and Fire staff to improve the system for other events.
b. A new dedicated map for Field Services Incidents during non EOC activation events was
created using the same platform.
D2. Were there any modifications to the original system design?
The original system design was focused on one area of the EOC operations, road temperature collections, and
did not include additional layers in the initial scope. During the deployment of the system, it became clear
the GIS web map could display a great deal more useful information.
A GPS live tracking layer was added that displays the current location of field users with the application
running. This was requested by the Field Services manager and was implemented without the purchase of
additional hardware (though dedicated GPS units would offer enhanced tracking capabilities in the future).
The GPS tracking layer shows a "bread-crumb" trail of user locations every 30 seconds. This can be filtered to show only the current most recent points or viewed for historic reporting purposes.
InterDev | Atlanta – Chicago 16
At the start of the winter event, only road temperatures were collected digitally. Incidents such as icy
conditions, fallen trees, and power line issues were reported by radio, phone call, and emails. These were
initially managed by EOC staff with paper processes. GIS staff saw this opportunity and quickly created a new
data layer to track incidents during the event. GIS analysts then entered incidents on the map in real-time as
they were notified by Public Works and Public Safety personnel by radio, calls, or email.
During later storm events, the active incident layer became the central focus of the map. New fields for
comments and descriptions such as whether a road closure was needed or if utility lines were involved were
added. The ability to upload attachments was enabled allowing users to share photos from the field of the
event. Photos could be accessed by simply clicking a point on the map or viewing the data table and greatly
improved the understanding of each incident and record keeping.
E. Organizational Impact
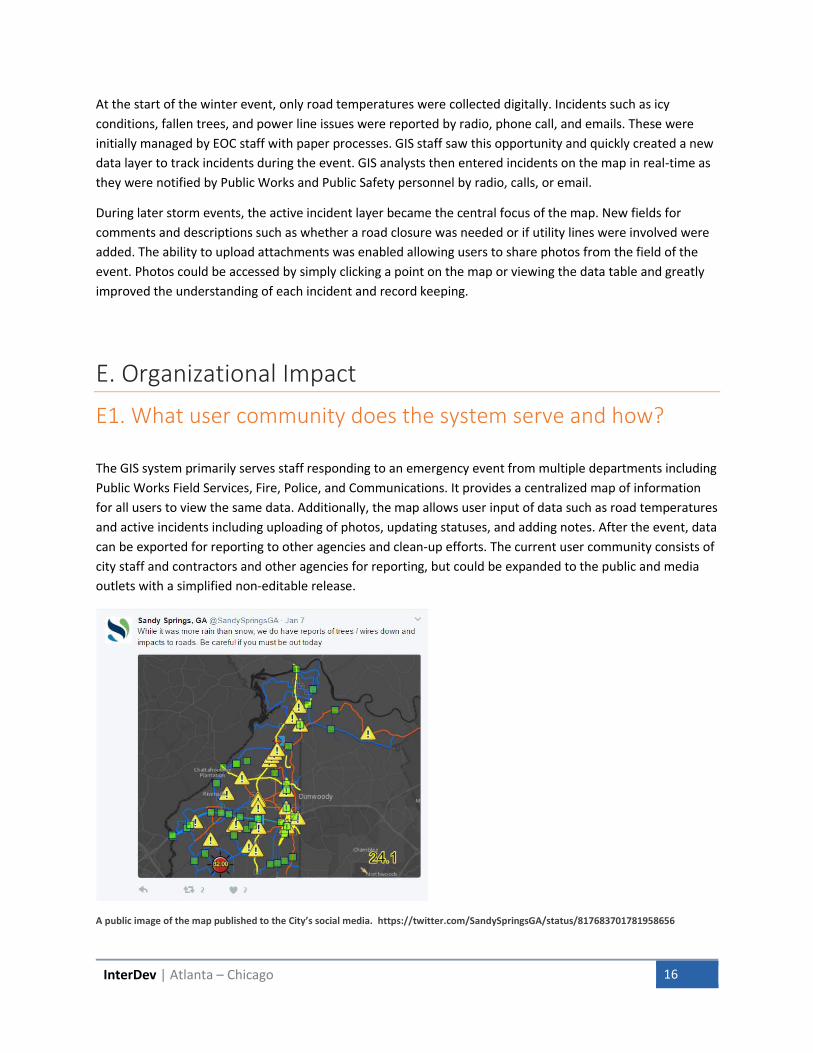
E1. What user community does the system serve and how?
The GIS system primarily serves staff responding to an emergency event from multiple departments including
Public Works Field Services, Fire, Police, and Communications. It provides a centralized map of information
for all users to view the same data. Additionally, the map allows user input of data such as road temperatures
and active incidents including uploading of photos, updating statuses, and adding notes. After the event, data
can be exported for reporting to other agencies and clean-up efforts. The current user community consists of
city staff and contractors and other agencies for reporting, but could be expanded to the public and media
outlets with a simplified non-editable release.
A public image of the map published to the City’s social media. https://twitter.com/SandySpringsGA/status/817683701781958656

InterDev | Atlanta – Chicago 17
E2. What are the ultimate decisions/operations/services being affected?
Emergency management involves a wide range of decisions and operations both before, during, and after an
event. In pre-incident planning, the GIS map allows for easily distributable maps and sharing of information
for training and orientation. Reference layers show snow and salt routes, vehicle and salt depot locations,
bridges, as well as historically dangerous intersections. This lowers the cost and need for large format paper
maps which are also cumbersome to use in the field.
During the event, the map served as a live briefing of the current conditions. Temperature readings allowed
managers to understand when bridges would begin freezing and to manage salt dispensing activities.
Managers could reroute nearby trucks to specific incidents based on proximity shown in the GPS tracking
layer.
During a severe thunderstorm event, the fire department used the map to determine areas of potential
flooding with FEMA flood plain reference layers and bridge locations. Crews were dispatched to preemptively
inspect these flood sites. Issues identified were added to the map. Photos from specific incidents like
roadway flooding were shared on social media to inform citizens and motorists of the hazards.
Social media report showing a field collected image of flooding.
There is often just as much if not more operations after the emergency event has passed. Clean-up and
reporting efforts were supported by the digital database of incidents. The entire database is exportable to
standard spreadsheet formats which are easily shareable or used to input into the regular contractor tracking
and billing software. Should an event require Federal or outside assistance, this data would help document
the needs for reimbursement.

InterDev | Atlanta – Chicago 18
E3. What were the quantitative and qualitative impacts of the system?
Using a centrally managed GIS map increased efficiencies, reduced redundancy, and helped provide a clear
picture of current conditions. Using a Common Operating Picture, managers, field and administrative staff
were all able to quickly understand the same statuses of operations. Whether there were two incidents or
twenty, briefings and shift changes were easily facilitated by walking through the various incident locations
placed on the map. The EOC was responsible for reporting hourly situational summaries to elected officials
and senior administration. Temperature data as viewed on the map, number and type of incidents, were
readily available for these reports without requiring additional staff time.
Temperature readings Temperatures below freezing Incident reports
Hundreds of temperature readings were reported during the event through the mobile app which reduced
email and radio chatter significantly. Instead of hourly phone calls and emails, data entry was provided in
real-time from users directly freeing up this recording process of staff in the EOC. Managers were able to see
pictures of incidents without having to dig through email chains, simply by clicking a point on the map.

InterDev | Atlanta – Chicago 19
View of the map showing temperatures and pop-up window when a feature is clicked. Access to photos is provided with a link (example below).
Photo taken from field worker, attached to the temperature reading point. The temperature gauge is visible on the bottom left and icy conditions on the roadway.
In the field, large format paper maps are cumbersome and difficult to read in low-light settings. The digital
map viewed on mobile devices provided a compact and zoomable experience of the same data in addition to
automatic geolocation. This reduced cabin clutter and provided more efficient readings of the snow/salt
routes.
Over 76 incident points were recorded for the first winter event. These were exported in an easy to use
spreadsheet for remedial or clean-up actions. In disaster events, this reporting can be used for
reimbursement through the Federal Emergency Management Agency (FEMA).
E4. What effect has the system had on productivity?
The current system is only activated during an emergency event. During the event the GIS map reduces
redundancy of reporting and reduces the time needed to brief workers and managers on the current
situation. Event managers can quickly identify active incident such as areas for potential icing or fallen trees
and direct crews based on their current location. While users can still email photos and text descriptions, this
information is inputted on the map allowing for tracking and consolidation of information. Photos and
descriptions are easy to share and view rather than forwarding of lengthy email chains.
Productivity during and after an event increased as time was saved on communication tasks. Additionally, the
automatic storage of data in a database allows for historic archiving, walk-throughs of the event, and reports
and exporting of data for follow-up or sharing with other agencies.

InterDev | Atlanta – Chicago 20
Administrative staff requesting data for follow-up.
Exported table of incidents provided.
E5. What, if any, other impacts has the system had?
As a pilot system, the use of GIS in the EOC prompted further interest and utilization of the GIS department
at the city as a whole. The Fire Department requested additional GIS services for other projects which used
the same technology. Specifically, field data collection was used for Fire hydrant inspection rather than
previous paper based methods. The map was so successful in the winter event deployment, it has been
expanded to become a necessary tool whenever three or more trees have fallen during other storms even
when the EOC is not officially activated.

InterDev | Atlanta – Chicago 21
E6. How did the system change the way business is conducted with and/or service delivered to clients?
The current system is an internally focused productivity tool; however, its derivative products have allowed
for improved interaction with other agencies and citizens. Each data point collected on the map is stored in a
relational database. These records can be exported to tables useable in any spreadsheet software. During an
event only the immediate travel surface of the right-of-way is cleared of debris. Administrative staff used
these records to ensure each incident is appropriately cleaned and closed out during regular business hours
after the event, improving customer service to citizens.
During a shift change, the briefing of events was facilitated by viewing the incident map conversationally with
the ability to zoom in on geographic areas of interest rather than having to sift through tabular lists of
information. Future iterations of the map could be published for the public and media agencies to view
similar information.
F. System Resources
F1. What are the system’s primary hardware components?
ArcGIS Online hosting services
Desktop GIS for editing and creation of source data
Public Safety Radios
Cell phones
Apple iPads with cellular data plans
Temperature monitors (built-in vehicle sensors and handheld infrared guns)
Emergency Operation Center
o multiple large screens
o planning and training room
o computer work stations for each functional group (Communications, Field Services,
Police, Fire, etc.)
F2. What are the system’s primary software components?
Esri ArcGIS Enterprise License Agreement (ELA)
o Facilitated the use of 250 ArcGIS Online user accounts.
Esri ArcGIS Desktop
o Database design and initial data editing.
ArcGIS Online
o Specialized groups configured for departments (Field Services Operations /
Management, Fire Ops / Management, Emergency Operations)
o Users provided access to these groups

InterDev | Atlanta – Chicago 22
Web maps created with a standard basemap and reference layers
Collector for ArcGIS mobile application configured for data entry and photo attachments.
o Field entry configured for dates and numbers to improve accuracy
o A GPS tracking layer was enabled that functioned whenever Collector was in use.
Cisco AnyConnect Secure Mobility Client
o Provided VPN access to the City network allowing for the use of enterprise logins with
the ArcGIS Online integration. Users could use the same name/password as their regular
Windows accounts.
Waze – Connected Citizens Program
o Real-time traffic events and road closures were reported to the Waze application
through a data sharing agreement the “Connected Citizens Program.” The City provides
authoritative information to Waze which is then displayed to thousands of drivers in the
area using the Waze app.
F3. What data does the system work with?
The system displays many GIS data sources including live real-time editing layers, real-time reference layers,
and static reference layers.
Live real-time editing datasets consisted of road temperature (points), active incidents (points), active road
and lane closures (lines), and GPS tracking of vehicles (points). The road temperatures were entered using
Collector for ArcGIS with fields for temperature reading, text location description, timestamp, and the ability
to attach photos.
Live Real-time Editing Datasets
Road temperatures (points)
o Reported by field workers using Collector for ArcGIS with timestamps.
Active Incidents (points)
o Calls for services through 911, field reports from workers, social media, or any other
service were added to the map as point events. Events were classified by type, time
reported, location, and current status. Pictures were attached when available to
incidents.
Active Road / Lane Closures (lines)
o Maintained by City of Sandy Springs including planned construction closures and
incident closures during the event (such as for downed trees).
GPS tracking of vehicle locations
o Template feature service on ArcGIS Online
Static Reference layers:
Pre-planned salt/plow routes (lines)
City streets from ArcGIS Online basemap
Bridges (points)
Vehicle and operation depots (points)

InterDev | Atlanta – Chicago 23
Historically dangerous intersections (points)
Live Reference Layers:
- Sandy Springs Traffic Cameras
o Location (points) and latest live pictures available
- Current Wind and Weather Conditions
o Esri Subscriber Content – ArcGIS Online
o “The Current Wind Conditions layer is created from hourly METAR/TAF and BUOY data
provided from NOAA.” o https://www.arcgis.com/home/item.html?id=29d3ea0ef52a43abab68be309479f2ac
- Recent Weather Radar Imagery
o “Weather Radar (NEXRAD) Reflectivity Mosaics from NOAA/NWS RIDGE2 for Alaska,
CONUS, Puerto Rico, and Hawaii for last 3 hours.” o http://www.arcgis.com/home/item.html?id=da53700b1f324cc685c4d3bcc00c12fc
F4. What staff resources were required to implement the system?
Two Full Time Equivalent GIS Analyst staff developed, maintained, and trained users on the system over the
course of two months while managing other daily activities. During the event, analysts rotated 12-hour shifts.
Additional ad-hoc support from IT staff was provided for network troubleshooting, user permissions,
hardware support and software installation.
Field workers were required to collect data in trucks during the storm. This was accomplished with two-
person teams with one person operating the vehicle and one person using the application and
communicating with the command center. The solution is scalable with the number of field staff available for
data collection, currently limited to 250 users with the city’s license agreement.
F5. Comment on anything unusual about the resources used to develop your system, such as data, software, personnel and financing
GIS personnel became operational staff in the Emergency Operations Center which, though included in the
National Incident Management System framework, is not necessarily a common practice, especially at the
municipality level.
The system is unusual in that it is an entirely digital except for hardcopy user documentation. Esri ArcGIS
suite of products is used, however, the basic concepts are transferrable to other software platforms. The
basic components are a web map, ability to collect GIS data on a mobile device, and the mobile data
represented as layer on the web map. The solution is almost an entirely cloud based platform. ArcGIS Online

InterDev | Atlanta – Chicago 24
was the host for all data layers and local servers were only used for user management through Windows
Active Directory. This relieves dependency on local conditions, servers, and downtime during maintenance.
An Enterprise License Agreement affords the city plenty of named user accounts for all field workers to have
access to ArcGIS Collector. This might be a limiting factor for other organizations and may need to be
purchased separately.