GIS in Action - West Virginia Universitypages.geo.wvu.edu/~elmes/geog350/KClecture09.pdf ·...
56
GIS in Action: Case Studies From: Keith Clark, Getting Started With GIS, Prentice Hall, NJ Chapter 9
Transcript of GIS in Action - West Virginia Universitypages.geo.wvu.edu/~elmes/geog350/KClecture09.pdf ·...

GIS in Action: Case Studies
From: Keith Clark, Getting Started With GIS, Prentice Hall, NJChapter 9

GIS in Action
Introducing GIS in Action Case Study 1: GIS Fights the Gypsy Moth Case Study 2: GIS and Road Accidents in Connecticut Case Study 3: GIS Helps Environmental Assessment in BrooklynCase Study 4: Channel Island GISCase Study 5: GIS and GPS to Map Sliding Rocks

Understanding GIS by Case StudyUse of GIS is best understood by examining case studies.Case studies in this chapter cover rural, suburban, urban, and coastal GIS applications.Rural: Gyspy Moth in MichiganSuburban: Road Accidents in ConnecticutUrban: Environmental Decision Making: Brooklyn, NY Coastal: Channel Islands of CaliforniaWildlands: Sliding Rocks in Death Valley

Case Study #1: Use of GIS to Understand Population Dynamics of the Gypsy Moth in Michigan
Contributors: Bryan C. Pijanowskiand Stuart H. Gage, Dept. of Entomology,Michigan State University.

The Problem
First discovered in the state 40 years ago.Gypsy moth defoliated 280,000 ha in 1992Up from 2,800 in 1984.Insect is spreading across state.Impacts mostly oak and aspen.Agriculture, DNR, USDA involved.

The Gypsy Moth

The Spread of the Gypsy Moth
GIS has been used by Michigan State University to monitor the spread of gypsy moth.The gypsy moth has spread over the state from the north and east, and defoliates trees.

The Monitoring Program
Information from the monitoring program, via a GIS in Arc/Info and IDRISI, is used to direct spraying trees with Bt.A statewide monitoring program uses milk carton traps in trees dispersed over a spatial grid.

A gypsy moth trap

Locations ofTraps forGypsy moths in Michigan

Data Processing
Data are aggregated annually in a central GIS, forms are entered and locationsgeocoded.Statewide gypsy moth infestation are interpolated using inverse distance squared weighting and mapped.An overlay of tree species data is then used to map the trees at risk of defoliation and therefore to be sprayed.
Risk to trees in Michigan from Gypsy Moth

Spraying with Bt biological pesticide

Software Used
Arc/InfoIDRISIAlso use: ER-Mapper, ERDAS, Atlas*GIS

Case Study #2:GIS and Road Accidents in CT
Contributor: Ellen K. Cromley,Medical Geographer, University of Connecticut.

The Problem
National need to quantify the benefits of automotive protection systems like seat belts and bicycle helmets.Connecticut had 72,672 crashes involving 190,143 people in 1995, and 78,407 crashes involving 202,792 people in 1996.
Crash Outcome Data Evaluation System
National Highway Traffic Safety Administration funds 20 states through the CODES (Crash Outcome Data Evaluation System) Project. The Connecticut CODES Project uses GIS to link motor vehicle crash data with medical outcome data to develop a better picture of accidents and the effectiveness of protection systems.The purpose is to create a viewing environment for the linked crash records so that users can explore the locations and attributes of crashes.

Connecticut CODES GIS
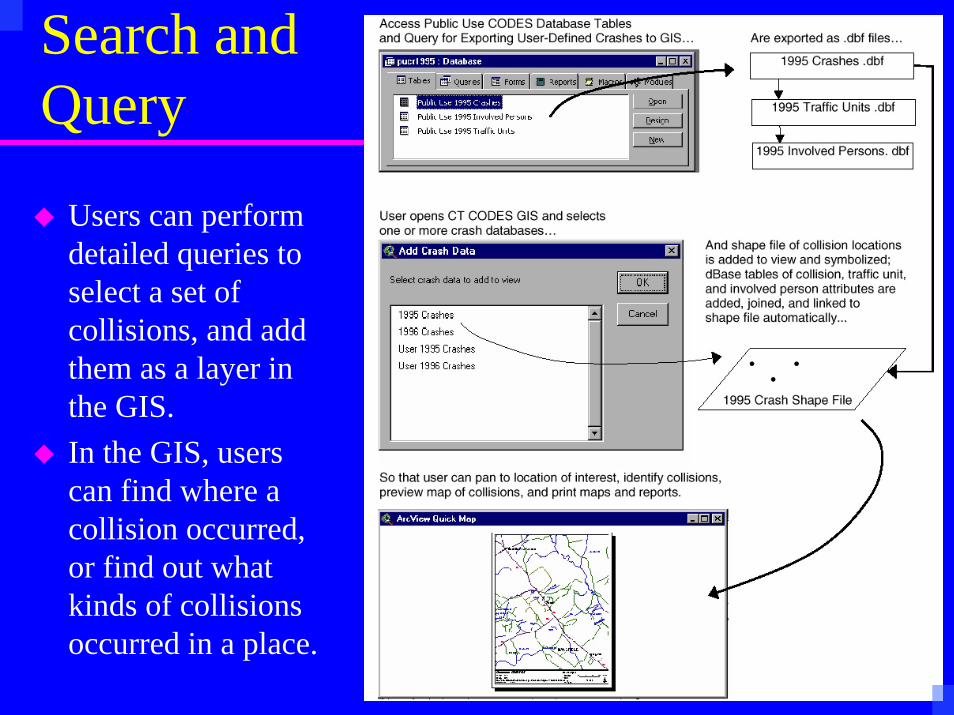
Search andQuery
Users can perform detailed queries to select a set of collisions, and add them as a layer in the GIS.In the GIS, users can find where a collision occurred, or find out what kinds of collisions occurred in a place.

ArcView Quick Map
The user can pan to location of interest, identify collisions, preview map of collisions, and print maps and reports.

GIS Software Used
CT CODES (Crash Outcome Data Evaluation System) GIS is an ESRI ArcView application modified with Avenue scripts to create a tailored GIS.Microsoft Access Database links motor vehicle crash data with medical outcome data.

Data Used in the StudyMotor vehicle crash data from Police Accident reports for 1995 and 1996, coded by the Accident Records Section of ConnDOT.Trauma registry, emergency department, and inpatient records maintained by CHREF, an arm of the CT Hospital Association.Mortality records maintained by the Vital Records Section of the Health Dept.

Uses of CT CODES GIS
Local child safety seat campaignsEvaluation of traffic calming devices by DOTStudies of elderly drivers in one CT countyResearch on fatal motor vehicle collisions in the state

Case Study #3: GIS Helps Environmental Assessment in Brooklyn
Contributors: Sean C. Ahearn and Jeffrey P. Osleeb, Hunter CollegeCity University of New York
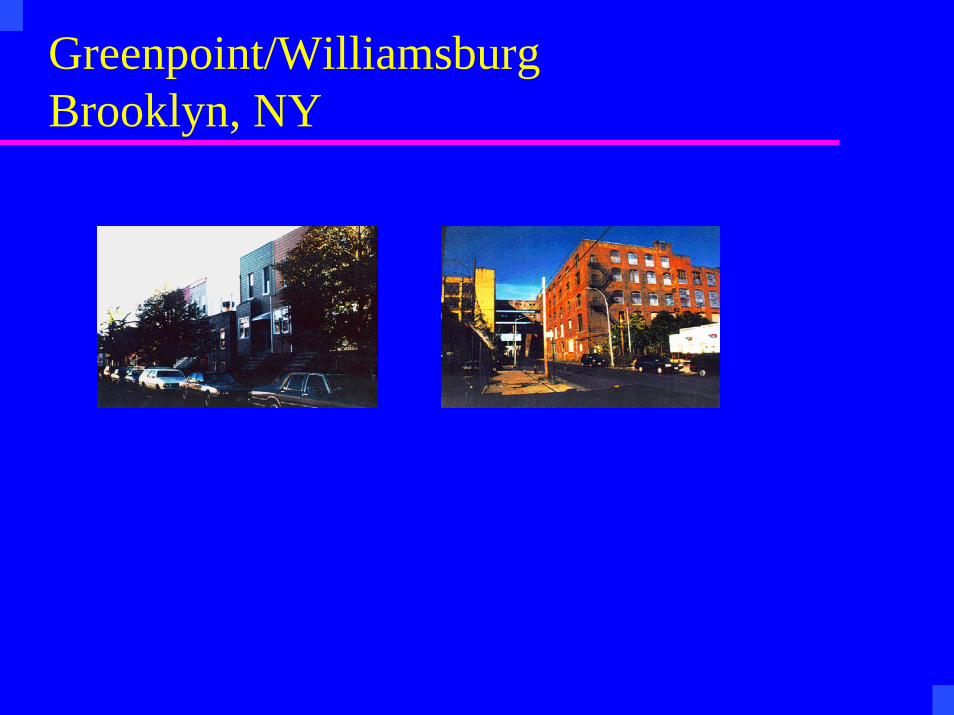
Greenpoint/WilliamsburgBrooklyn, NY
GIS Helps Environmental Assessment in Brooklyn
In Brooklyn, New York, the industrializedGreenpoint/Williamsburg community decided to build a GIS to answer concerns it had over environmental contamination.At Hunter College, geographers assembled three different map base layers: parcels, a street map, and TIGER.

The Problem
Greenpoint/Williamsburg heavily polluted100,000 residents19 sites on toxic release inventory200 sites storing toxic materialsHow can public domain information get into the community’s hands?

Data Use and ManagementThe base layers were coregistered and used togeocode many text and other city databases with environmental, health, and demographic attributes.The link between the layers that the GIS provided allowed cross-referencing of information in ways that helped the community; for example, linking toxic storage facilities and citizens’ complaints.

GIS land parcel reference base

Number of Odor Complaints

Results
The GIS has been placed in the community and is used to empower residents with knowledge about their own local environmental concerns.
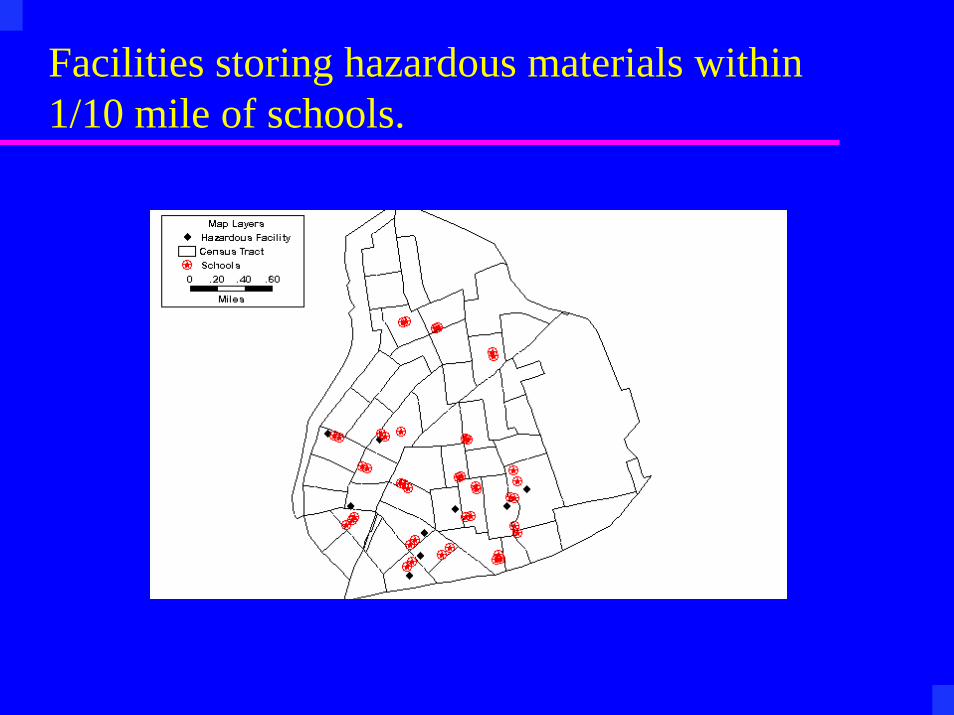
Facilities storing hazardous materials within 1/10 mile of schools.

GIS Software used
Arc/InfoCaliper’s GIS+TIGER CensusSARA right to know data: EPALocal map base from NYC
Case Study 4: Channel Islands GIS
Effective Resource Management for California’s Coastal Islands
Contributor: Leal Mertes, Dept. of Geography UCSB and grad/undergraduate students.
Channel Islands GISCollaborative GISMany contributors and developersPublic domain and mission-specific data– UCSB– NOAA Channel Islands National Marine Sanctuary– Channel Islands National Park– Santa Cruz Island Reserve– UC Natural Reserve System– State of California Fish and Game (Oil Spill Prevention &
Response)
Data layersBathymetryTopographyFlora and FaunaArcheological sitesSea cavesShipping lanesOil platformsGeologyVegetationSoils
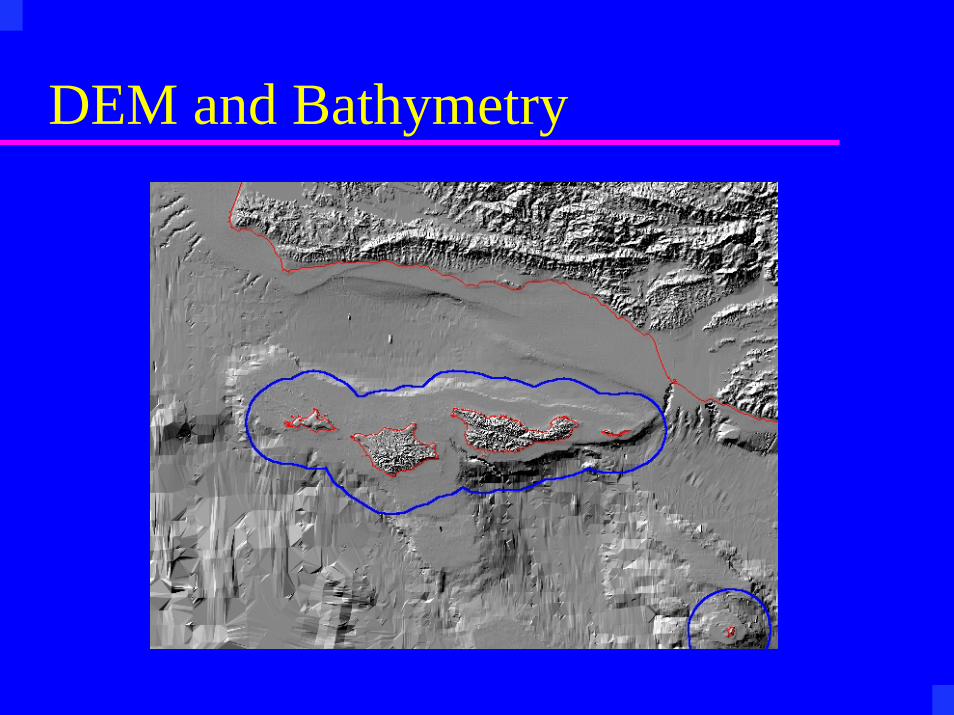
DEM and Bathymetry

Data suite
Master DB is Arc/Info and ArcViewOngoing maintenanceUse on workstations, PCs and on boatsPlumes and blooms projectInclusion in a new class on Watershed Analysis

Plumes and Blooms Project

El Nino Plume response~

AVHRR Sediment Plume Santa Clara/Ventura Rivers

Santa Cruz Island: Watersheds

Outcomes
Data set constructed and used for better environmental managementHighlighted significance of high magnitude rainfall events on water quality and ecosystemsIntegrated research, teaching and internships activities Led to Conception Coast project

Case Study 5: Sliding Rocks
Contributor: Paula Messina,Department of Geology, San Jose State University,California.

Sliding rock phenomenonRecessed trails in the playa sediments suggest that rocks and boulders glide across an almost perfectly flat lakebed at Racetrack Playa in Death Valley. No one has witnessed the rocks in motion.Trails are defined by lateral ridges, suggesting that the surface is saturated and pliant when the rocks move.

Sliding rock phenomenon, ctd.Some trails exhibit splash marks, wakes, and bow waves, indicating that the rocks are propelled at speeds of 2 meters per second or even more.The longest trail, over 800 meters, is fairly straight, but others record extremely chaotic activity. The largest boulders have masses up to 320 kilograms, and their trails are by no means the shortest.

“Ellen” and “Bessie”
Two rocks, “Ellen” and “Bessie”, apparently slid to the northwest, imprinting trails as evidence of their unusual activity.

GIS, GPS and Terrain AnalysisDr. Messina, captivated by the sliding rocks of Racetrack Playa, used a variety of mapping and GIS tools to solve the mystery. GPS was used to map the positions of “sliding” rocks, and their trails. GIS was used to find spatial patterns in the movement of the rocks.She used hand-held anemometers to map wind vectors. Terrain analysis provided the elusive clue.

Ice vs. Wind
Maps of a few selected trails showed significant parallelism, suggesting that rocks may move while imbedded in a cohesive wind-propelled ice sheet.While some trails are parallel, most are not. Does that impy that ice moves only some rocks?Robert P. Sharp concluded that the wind alone, acting over a surface “lubricated” with wet clay may provide enough force to set the rocks in motion.
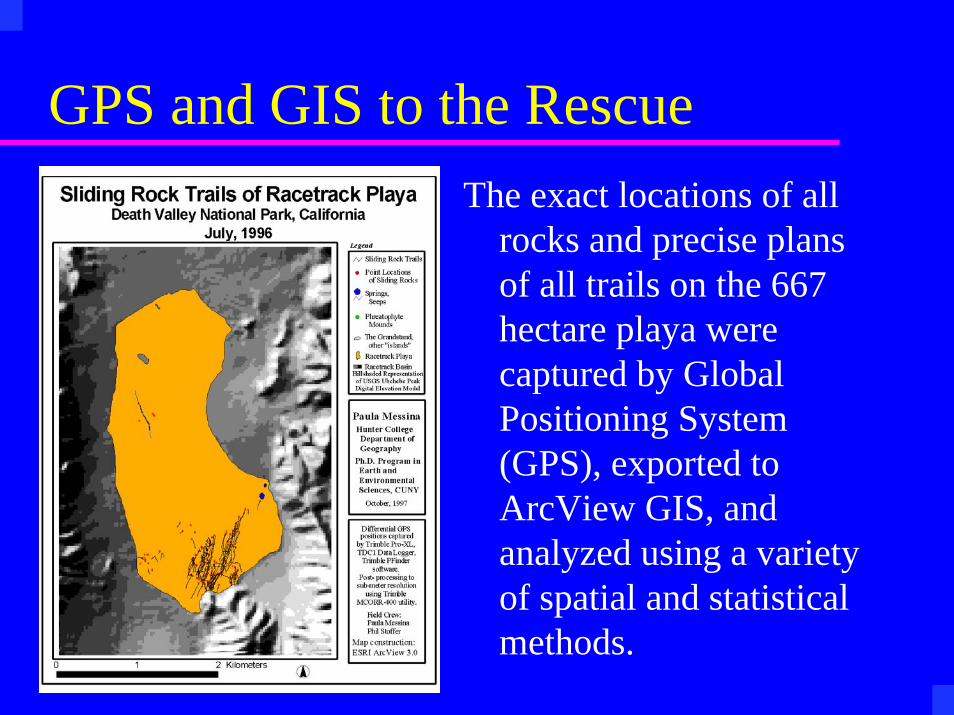
GPS and GIS to the RescueThe exact locations of all
rocks and precise plans of all trails on the 667 hectare playa were captured by Global Positioning System (GPS), exported to ArcView GIS, and analyzed using a variety of spatial and statistical methods.
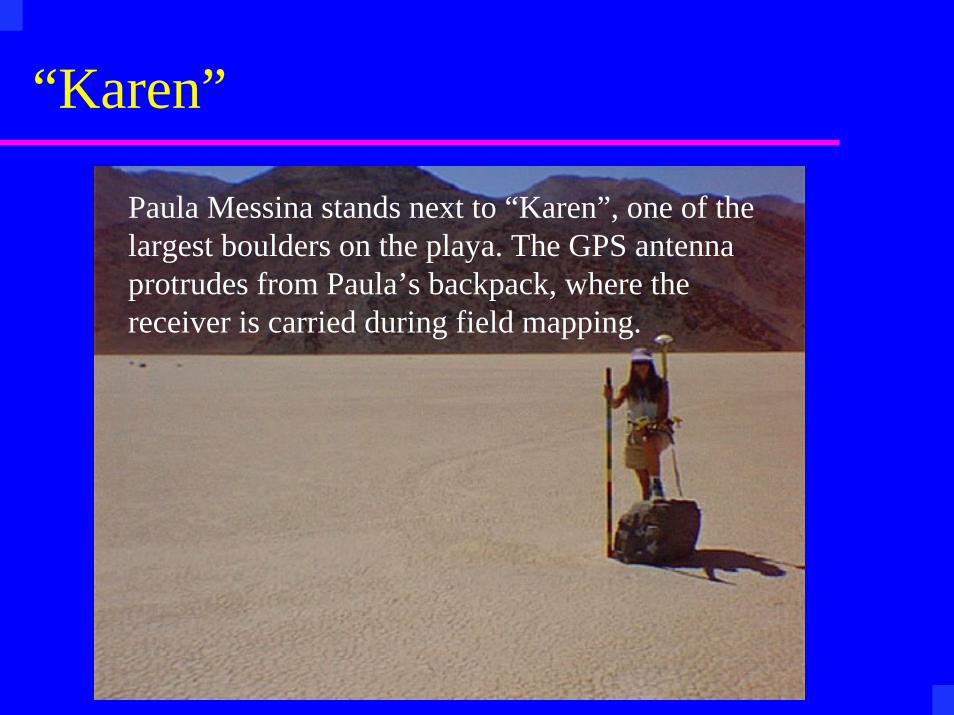
“Karen”
Paula Messina stands next to “Karen”, one of the largest boulders on the playa. The GPS antenna protrudes from Paula’s backpack, where the receiver is carried during field mapping.

Spatial PatternsThe trails of “Jacki” and “Julie”
suggest a high degree of similar motion. However, although somewhat congruent, the rocks apparently converged during their calligraphic journeys. There appeared to be no correlation between the size, shape, orlithology of a rock, and the length or straightness of its trail.
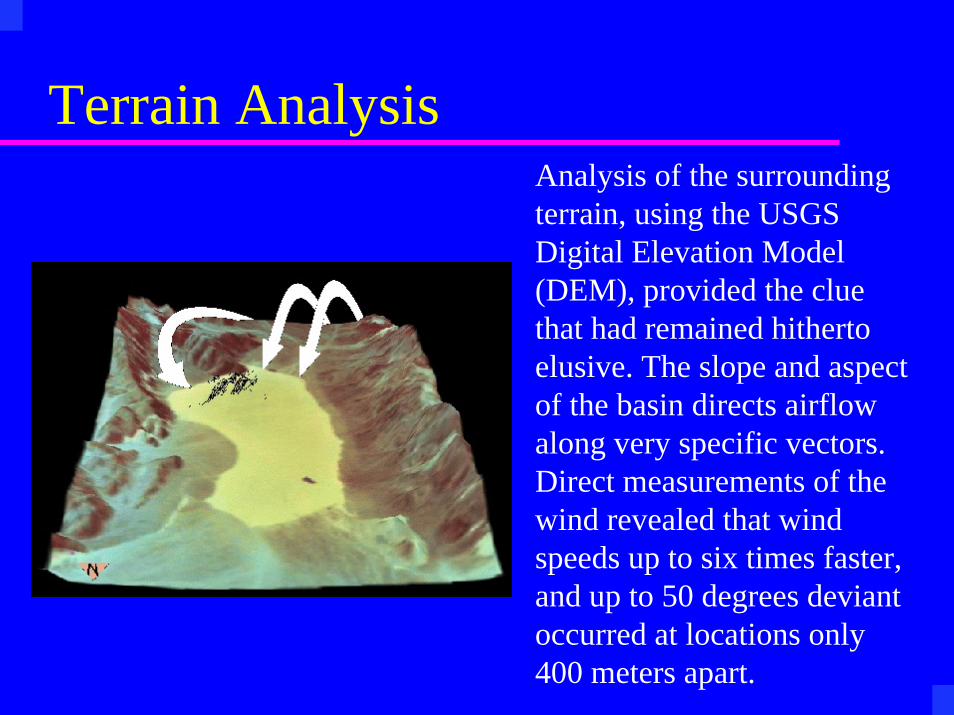
Terrain AnalysisAnalysis of the surrounding terrain, using the USGS Digital Elevation Model (DEM), provided the clue that had remained hitherto elusive. The slope and aspect of the basin directs airflow along very specific vectors. Direct measurements of the wind revealed that wind speeds up to six times faster, and up to 50 degrees deviant occurred at locations only 400 meters apart.

GIS Software and Data Used
ArcView GISArcView Spatial Analyst ExtensionUSGS Digital Elevation Model (DEM)Global Positioning System (GPS)Handheld anemometers

Results
The nature of a trail has more to do with the location of the rock that inscribed it than the physical characteristics of the rock itself. The Racetrack may be thought of as a mosaic of microclimates, with different wind regimes in adjacent locations. A few days after a rain, when fine, saturated clays coat the surface, a “near-Teflon” state supports mobilization of Racetrack Playa’s rocks by wind.

End