MAP REPRODUCTION Cartographic Design for GIS (Geog. 340) Prof. Hugh Howard American River College.

Rapid Watershed AssessmentsRapid Watershed AssessmentsGIS, Data, and Cartographic GIS, Data, and Cartographic
ElementsElements

Key TopicsKey TopicsProduct and Product and Representation Representation DecisionsDecisionsCrossing Political Crossing Political BoundariesBoundariesDataset Discussions Dataset Discussions and Examplesand ExamplesData Acquisition Data Acquisition Automation and Automation and Processing ToolsProcessing Tools

Product DecisionsProduct DecisionsPage Size and LayoutPage Size and LayoutPDF Document of PDF Document of 88½”½” x 11x 11”” sheets?sheets?PosterPoster--sized, highsized, high--resolution copies of resolution copies of maps for maps for presentations or presentations or public meetings?public meetings?Series of viewable Series of viewable Web Pages with Web Pages with hyperlinks?hyperlinks?

Cartographic Representation Cartographic Representation DecisionsDecisions
Page Size Page Size /Graphic Size/Graphic SizePage FormatsPage FormatsResultant Scale Resultant Scale --Reclassification?Reclassification?SymbologySymbologyRepresentation across Representation across political linespolitical linesRepresentation Representation ofofpolitical linespolitical linesCreate and review Create and review drafts!drafts!

Crossing Political BoundariesCrossing Political BoundariesTwo challenges:Two challenges:•• Work ProcessWork Process•• Consistent DataConsistent Data
Solutions:Solutions:•• Share work in a Share work in a
watershed or divide watershed or divide entire watersheds entire watersheds between statesbetween states
•• Obtain broader, Obtain broader, regional or national regional or national data as much as data as much as possiblepossible
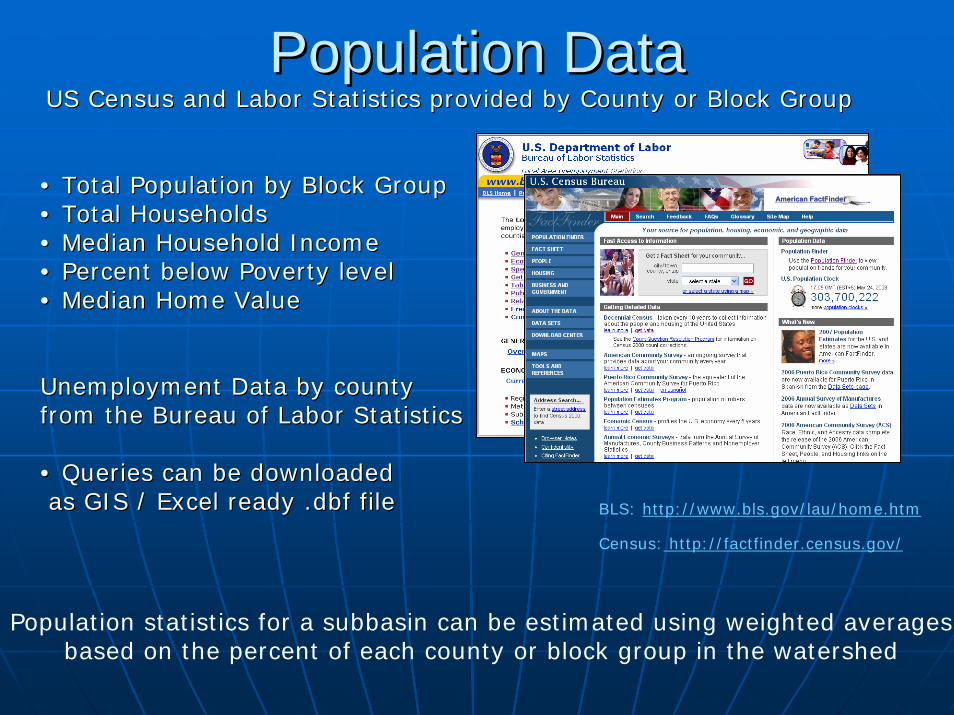
Population DataPopulation DataUS Census and Labor Statistics provided by County or Block GroupUS Census and Labor Statistics provided by County or Block Group
•• Total Population by Block GroupTotal Population by Block Group•• Total HouseholdsTotal Households•• Median Household IncomeMedian Household Income•• Percent below Poverty levelPercent below Poverty level•• Median Home ValueMedian Home Value
Unemployment Data by county Unemployment Data by county from the Bureau of Labor Statisticsfrom the Bureau of Labor Statistics
•• Queries can be downloaded Queries can be downloaded as GIS / Excel ready .dbf fileas GIS / Excel ready .dbf file
Census: http://factfinder.census.gov/
BLS: http://www.bls.gov/lau/home.htm
Population statistics for a subbasin can be estimated using weighted averagesbased on the percent of each county or block group in the watershed

NASS DATANASS DATA2002 Agricultural Census Data provided by county2002 Agricultural Census Data provided by county
•• Farm CountFarm Count•• Farms by SizeFarms by Size•• Total OperatorsTotal Operators•• Cropland AcresCropland Acres•• Irrigated LandsIrrigated Lands•• Animal CountsAnimal Counts•• Chemical ApplicationsChemical Applications
•• Queries can be downloaded Queries can be downloaded as GIS / Excel ready .dbf fileas GIS / Excel ready .dbf file
http://www.nass.usda.gov/Census/Create_Census_US_CNTY.jsp
Ag statistics for a subbasin can be estimated using a weighted average based on the percent of each county occurring in the selected watershed

Threatened and Endangered SpeciesThreatened and Endangered Species• Data Sources: Local data, DNRs
NRCS EFOTG Section II, USFWS
http://www.nrcs.usda.gov/technical/efotg/
• Meant to identify essentialhabitat and conservationopportunities
• Privacy Issues –Sensitive Data
• Only reflects occurrence in awatershed – locational datais stripped from output
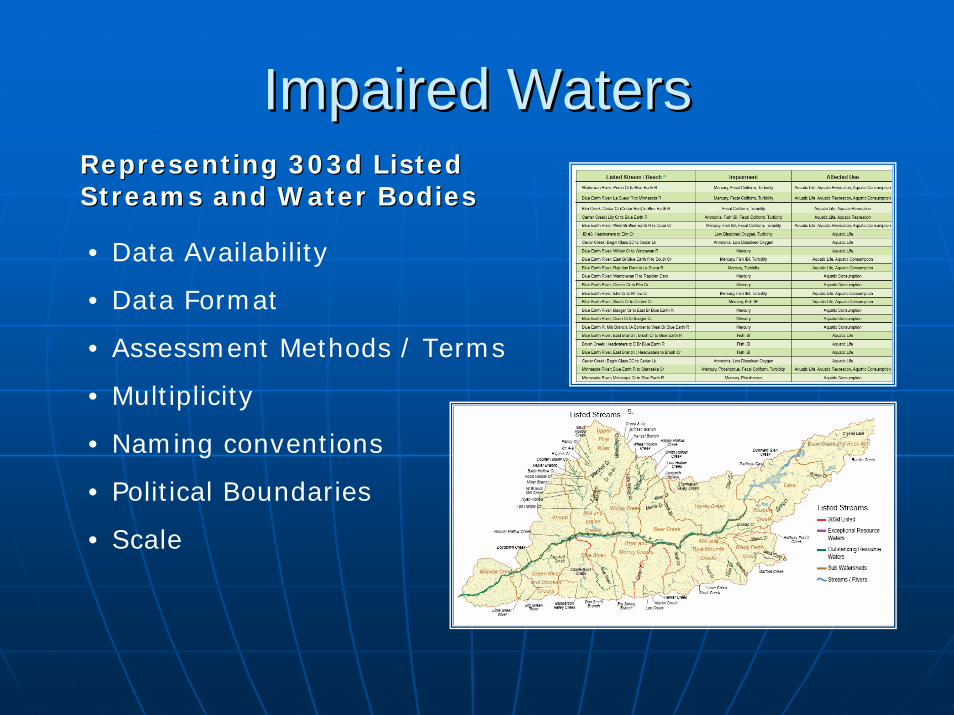
Impaired WatersImpaired WatersRepresenting 303d Listed Representing 303d Listed Streams and Water BodiesStreams and Water Bodies
• Data Availability
• Data Format
• Assessment Methods / Terms
• Multiplicity
• Naming conventions
• Political Boundaries
• Scale
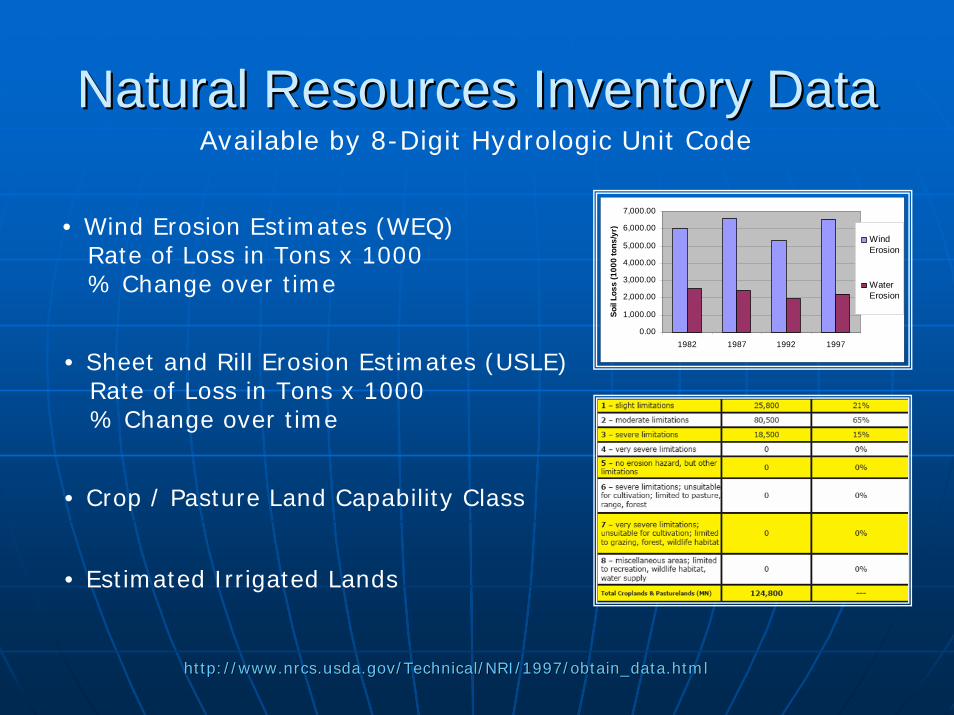
Natural Resources Inventory DataNatural Resources Inventory DataAvailable by 8-Digit Hydrologic Unit Code
0.00
1,000.00
2,000.00
3,000.00
4,000.00
5,000.00
6,000.00
7,000.00
1982 1987 1992 1997
Soil
Loss
(100
0 to
ns/y
r)
WindErosion
WaterErosion
• Wind Erosion Estimates (WEQ)Rate of Loss in Tons x 1000 % Change over time
• Sheet and Rill Erosion Estimates (USLE)Rate of Loss in Tons x 1000 % Change over time
• Crop / Pasture Land Capability Class
• Estimated Irrigated Lands
http://www.nrcs.usda.gov/Technical/NRI/1997/obtain_data.htmlhttp://www.nrcs.usda.gov/Technical/NRI/1997/obtain_data.html
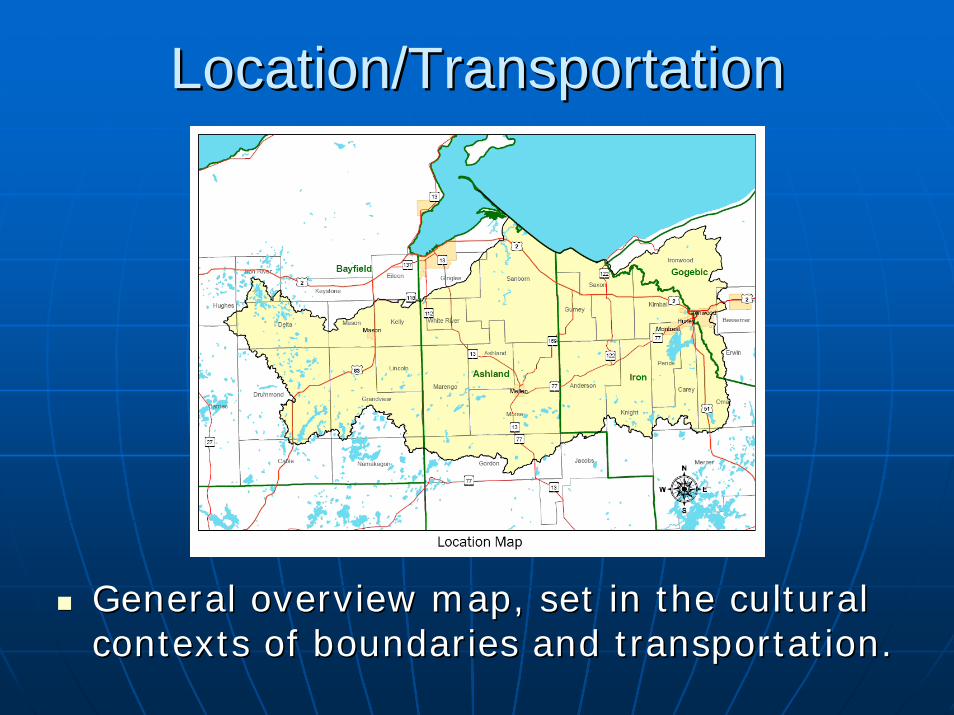
Location/TransportationLocation/Transportation
General overview map, set in the cultural General overview map, set in the cultural contexts of boundaries and transportation.contexts of boundaries and transportation.

Soil DerivativesSoil Derivatives
Suitable soils for agriculture as a general Suitable soils for agriculture as a general overview. The simple thematic map can reveal overview. The simple thematic map can reveal clusters or voids at a visual level.clusters or voids at a visual level.
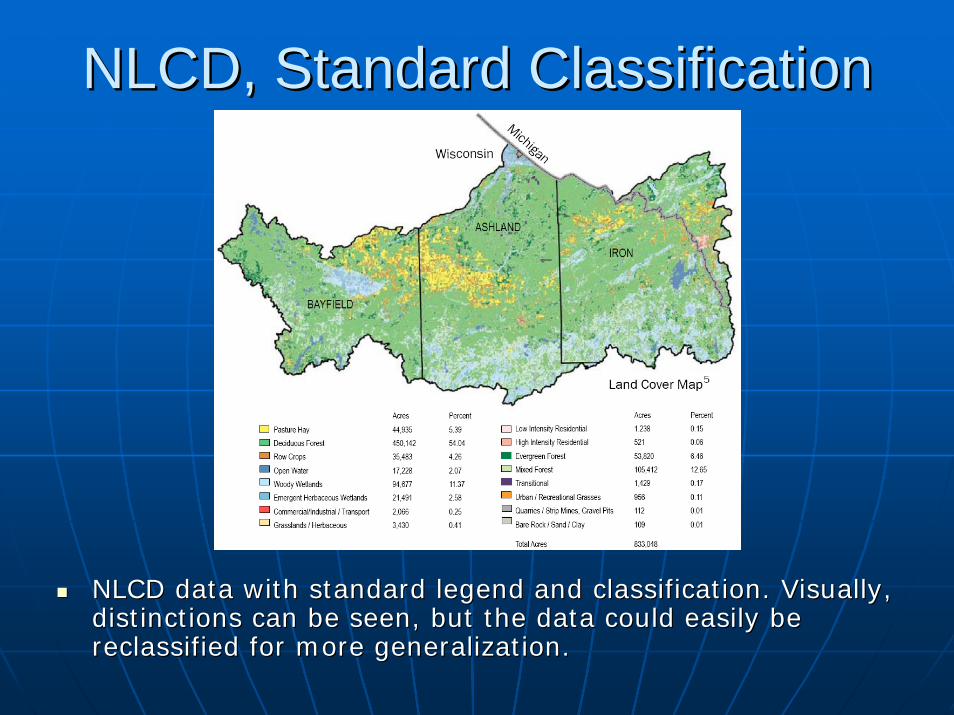
NLCD, Standard ClassificationNLCD, Standard Classification
NLCD data with standard legend and classification. Visually, NLCD data with standard legend and classification. Visually, distinctions can be seen, but the data could easily be distinctions can be seen, but the data could easily be reclassified for more generalization.reclassified for more generalization.

NLCD With Ownership ExtractionNLCD With Ownership Extraction
•NLCD Raster data clipped and exported to shapefile format
Estimates Private, Public, and Tribal lands for each land use / land cover type
•Land cover type extracted by Gridcode, reclassified & summarized in acres and percent
•Land cover type extracted to owner class polygons, reclassified & summarized in acres and percent

NLCD and Riparian AreasNLCD and Riparian AreasThe same process can be used to identify potentialThe same process can be used to identify potentialConservation opportunities in Riparian areasConservation opportunities in Riparian areas
• 100K Stream Data is Buffered to desired distance on all sides
• Land cover type extracted to bufferby Gridcode, reclassified & summarized

Elevation (NED)Elevation (NED)
30m cell size is typically adequate for an image product at 30m cell size is typically adequate for an image product at scales for 8scales for 8--digit subdigit sub--basins. Finer resolution needed for basins. Finer resolution needed for local projects is processing local projects is processing tmetme overkill on a product like overkill on a product like this.this.
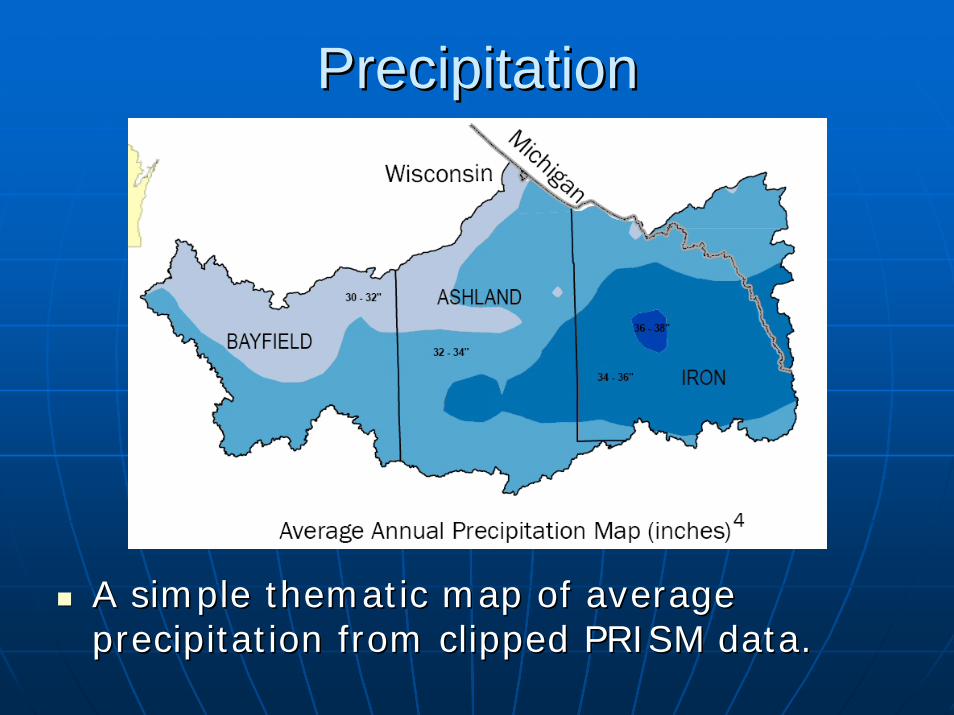
PrecipitationPrecipitation
A simple thematic map of average A simple thematic map of average precipitation from clipped PRISM data.precipitation from clipped PRISM data.

Ecological RegionsEcological Regions
EPA Level III and IV Ecological Regions were EPA Level III and IV Ecological Regions were incorporated instead of other, local datasets.incorporated instead of other, local datasets.

Data AcquisitionData Acquisition
Selecting Watershed BoundariesSelecting Watershed Boundaries•• Updated WBD, or traditional 1:250K dataUpdated WBD, or traditional 1:250K data
NRCS Geospatial Data GatewayNRCS Geospatial Data Gateway•• Helpful in acquiring a number of regional or Helpful in acquiring a number of regional or
national data layersnational data layers
PRS ReportsPRS ReportsNED, NLCD, NASS, Census, EPA NED, NLCD, NASS, Census, EPA TMDLsTMDLsand Ecological Regions, and Local and Ecological Regions, and Local Agencies round out the data sourcesAgencies round out the data sources
Watershed Boundary DatasetWatershed Boundary DatasetComplete Information Available at:Complete Information Available at:•• http://http://www.ncgc.nrcs.usda.govwww.ncgc.nrcs.usda.gov/products/datasets/watershed//products/datasets/watershed/
Information on WBD:Information on WBD:•• GoalGoal--Develop new national seamless WBD to the 12Develop new national seamless WBD to the 12--
digit level based on topographic and hydrologic featuresdigit level based on topographic and hydrologic features•• Scale: 1:24,000 for 10 and 12 digit product and base Scale: 1:24,000 for 10 and 12 digit product and base
data meets or exceeds 7.5 quadrangle sheetsdata meets or exceeds 7.5 quadrangle sheets•• Crosses stream at confluenceCrosses stream at confluence•• No delineations running down the centerlineNo delineations running down the centerline•• Cooperative development by many Federal agencies and Cooperative development by many Federal agencies and
local partner agencies under the leadership of the local partner agencies under the leadership of the Subcommittee on Spatial Water DataSubcommittee on Spatial Water Data
The WBD will supersede the original 1:250,000 The WBD will supersede the original 1:250,000 scale hydrologic units at two, four, six, and eight scale hydrologic units at two, four, six, and eight digits. (Use this if it is available to your state.)digits. (Use this if it is available to your state.)
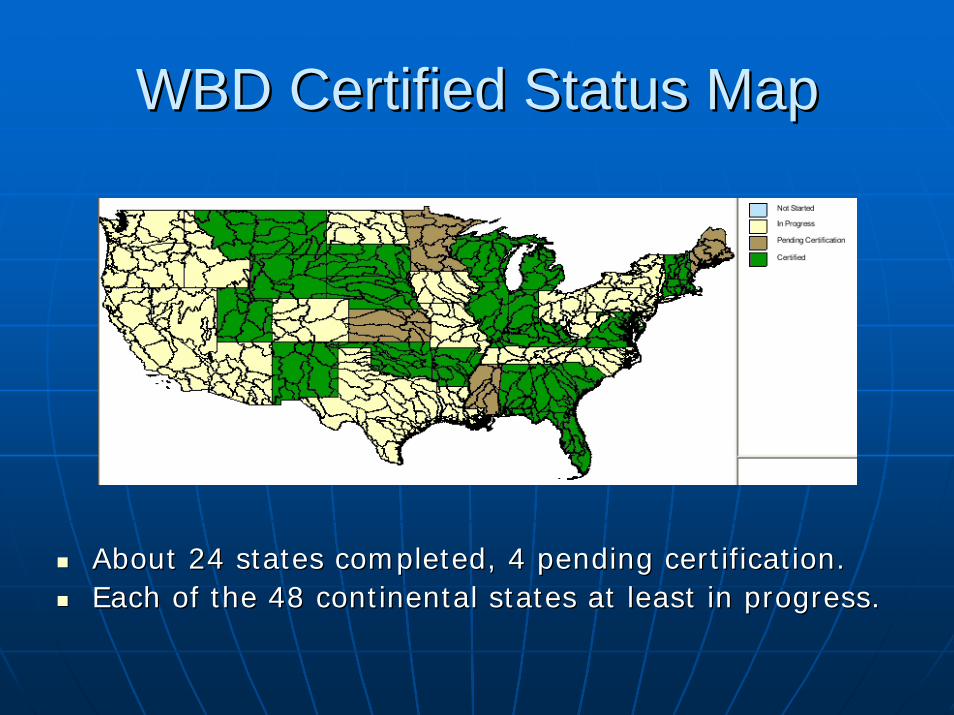
WBD Certified Status MapWBD Certified Status Map
About 24 states completed, 4 pending certification.About 24 states completed, 4 pending certification.Each of the 48 continental states at least in progress.Each of the 48 continental states at least in progress.
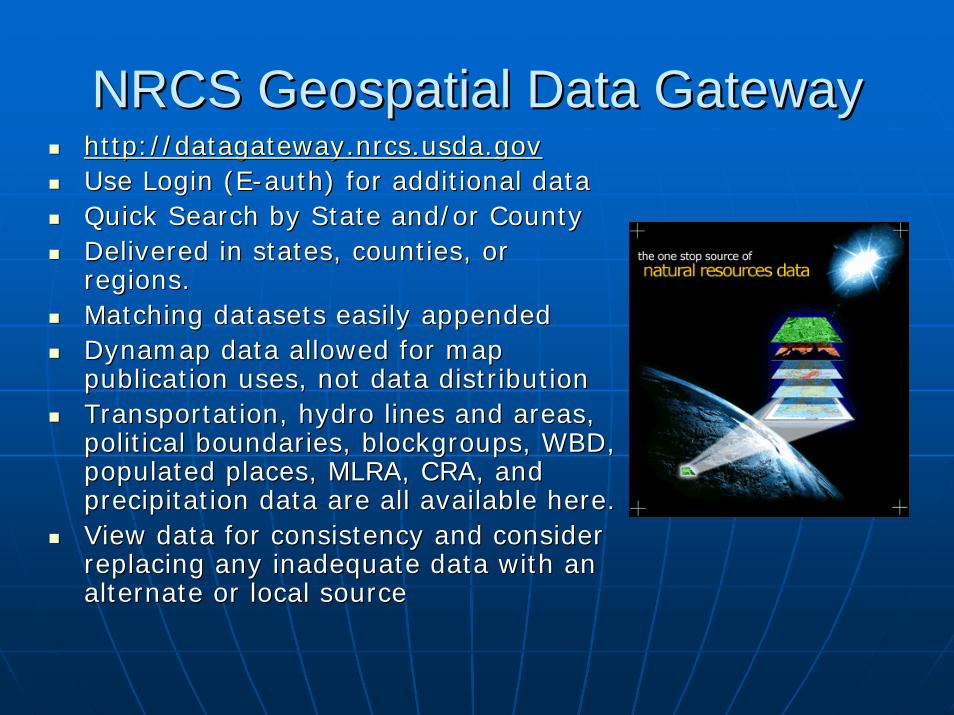
NRCS Geospatial Data GatewayNRCS Geospatial Data Gatewayhttp://datagateway.nrcs.usda.govhttp://datagateway.nrcs.usda.govUse Login (EUse Login (E--auth) for additional dataauth) for additional dataQuick Search by State and/or CountyQuick Search by State and/or CountyDelivered in states, counties, or Delivered in states, counties, or regions.regions.Matching datasets easily appendedMatching datasets easily appendedDynamapDynamap data allowed for map data allowed for map publication uses, not data distributionpublication uses, not data distributionTransportation, hydro lines and areas, Transportation, hydro lines and areas, political boundaries, political boundaries, blockgroupsblockgroups, WBD, , WBD, populated places, MLRA, CRA, and populated places, MLRA, CRA, and precipitation data are all available here.precipitation data are all available here.View data for consistency and consider View data for consistency and consider replacing any inadequate data with an replacing any inadequate data with an alternate or local sourcealternate or local source

PRS ReportsPRS Reports
Reports SectionReports SectionBe observant of year when Be observant of year when selecting reportsselecting reportsMany reports can be run Many reports can be run by HUC, but older HUC by HUC, but older HUC reports are clipped to state reports are clipped to state lines. This requires running lines. This requires running same HUC in all states same HUC in all states touched and summarizing touched and summarizing datadataTo our knowledge, PRS To our knowledge, PRS uses the 1:250K HUCs, so uses the 1:250K HUCs, so data adjustment data adjustment calculations may be calculations may be necessary in some casesnecessary in some cases
Other Data WebsitesOther Data WebsitesNED NED –– 30m, 30m, http://ned.usgs.gov/http://ned.usgs.gov/•• Also from NRCS Data GatewayAlso from NRCS Data Gateway
NLCD NLCD –– 30m, Links to the 1992 and 2001 30m, Links to the 1992 and 2001 NLCD: NLCD: http://http://landcover.usgs.gov/landcoverdata.php#regionallandcover.usgs.gov/landcoverdata.php#regional
•• Class definitions: Class definitions: http://http://landcover.usgs.gov/classes.phplandcover.usgs.gov/classes.php
•• Also from NRCS Data GatewayAlso from NRCS Data Gateway
NASS NASS –– Build custom query online and Build custom query online and download resultsdownload results•• http://http://www.nass.usda.govwww.nass.usda.gov//

Other Data Websites (contOther Data Websites (cont’’d.)d.)CensusCensus•• Home Home -- http://http://www.census.govwww.census.gov//•• Cites Cites --
http://www.census.gov/popest/cities/SUBhttp://www.census.gov/popest/cities/SUB--EST2005EST2005--4.html4.html
EPA TMDL EPA TMDL --http://http://www.epa.gov/owow/tmdlwww.epa.gov/owow/tmdl//EPA Ecological Regions EPA Ecological Regions --http://http://www.epa.gov/wed/pages/ecoregionwww.epa.gov/wed/pages/ecoregions/level_iv.htms/level_iv.htmLocal Agencies Local Agencies –– i.e. DNR, DOTi.e. DNR, DOT
Processing ToolsProcessing Tools
ArcGIS (ArcGIS (ArcCatalogArcCatalog and ArcMap)and ArcMap)MS Word MS Word –– Convert portions of Convert portions of document body or lists from Word.document body or lists from Word.MS Access MS Access –– Soils databases or other Soils databases or other locally constructed databaseslocally constructed databasesMS Excel MS Excel –– Numerous tablesNumerous tablesAdobe Adobe InDesignInDesign –– Brings everything Brings everything together for publication finishingtogether for publication finishing
GIS Automation ToolsGIS Automation Tools
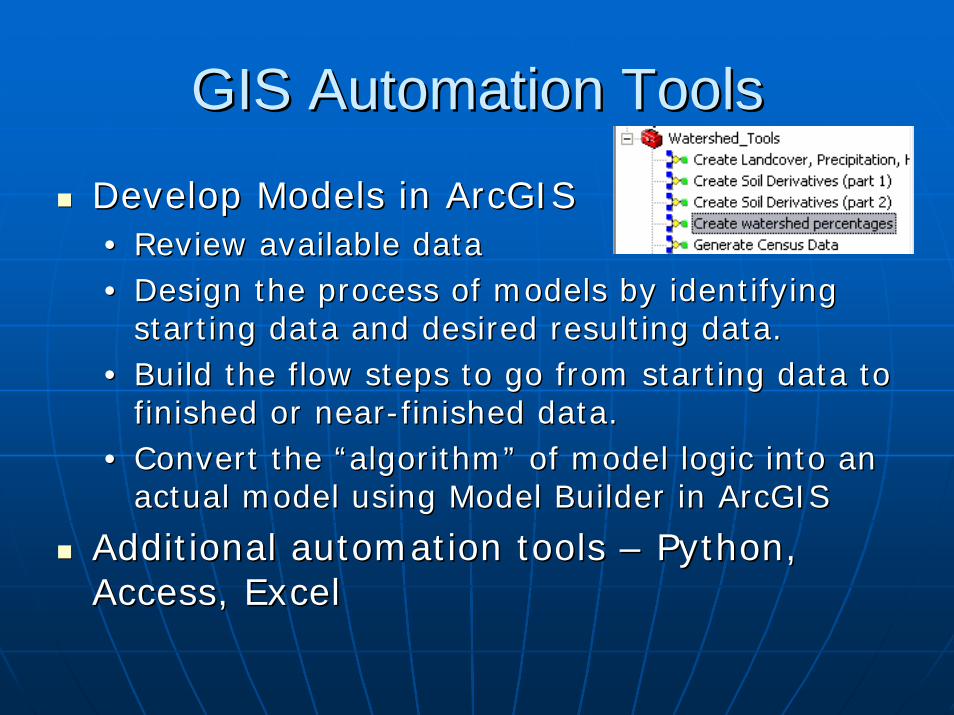
Develop Models in ArcGIS Develop Models in ArcGIS •• Review available dataReview available data•• Design the process of models by identifying Design the process of models by identifying
starting data and desired resulting data.starting data and desired resulting data.•• Build the flow steps to go from starting data to Build the flow steps to go from starting data to
finished or nearfinished or near--finished data.finished data.•• Convert the Convert the ““algorithmalgorithm”” of model logic into an of model logic into an
actual model using Model Builder in ArcGISactual model using Model Builder in ArcGIS
Additional automation tools Additional automation tools –– Python, Python, Access, ExcelAccess, Excel

GIS Automation Tools: TipsGIS Automation Tools: Tips
Batch Clip Layers wherever Batch Clip Layers wherever Possible (Python Scripts)Possible (Python Scripts)
Automate Time Consuming Automate Time Consuming Raster Processing TasksRaster Processing Tasks
Generate Summary Statistics Generate Summary Statistics to minimize user input and calculationsto minimize user input and calculations
Create ready to use tables for Create ready to use tables for easy importing into resource profileseasy importing into resource profiles
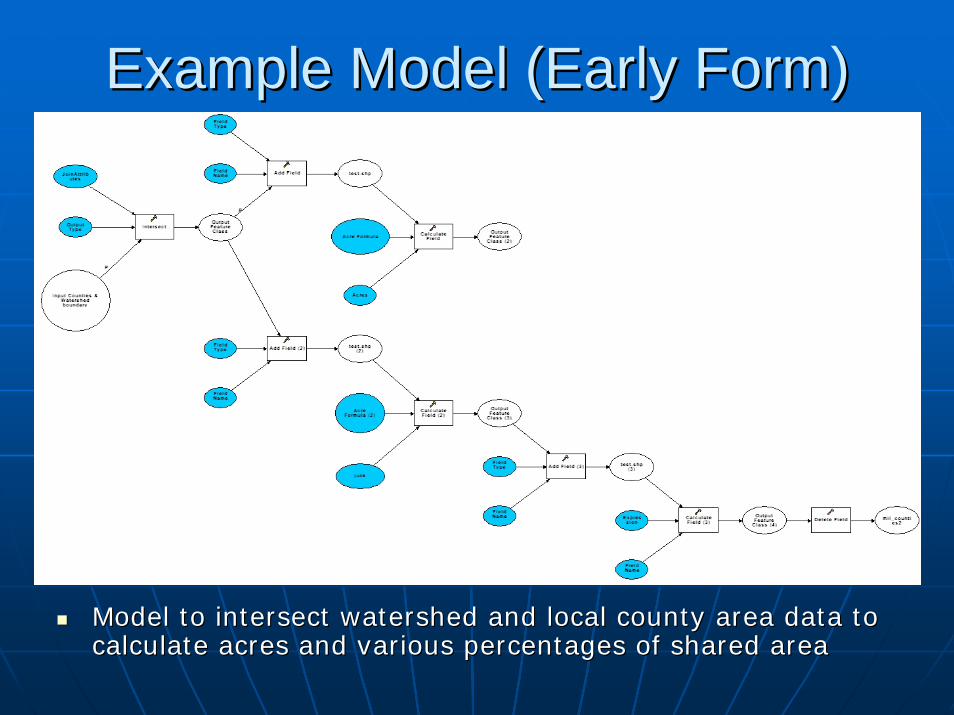
Example Model (Early Form)Example Model (Early Form)
Model to intersect watershed and local county area data to Model to intersect watershed and local county area data to calculate acres and various percentages of shared areacalculate acres and various percentages of shared area

Dialogue Screen For Same ModelDialogue Screen For Same Model
This model needs two This model needs two input layers input layers –– county county polygons that touch polygons that touch the watershed and the the watershed and the watershed boundary watershed boundary polygonpolygonInput watershed Input watershed requires an up to date requires an up to date acres calculationacres calculationModel needs an output Model needs an output layer specified.layer specified.Related table exported Related table exported from output layerfrom output layer

Example ModelExample Model
Calculates acres by ownership type and land cover type
Gives total acres and percentages occurring within each ownershipclass polygon
Model to extract and calculate land cover / land use by ownershiModel to extract and calculate land cover / land use by ownership typep type
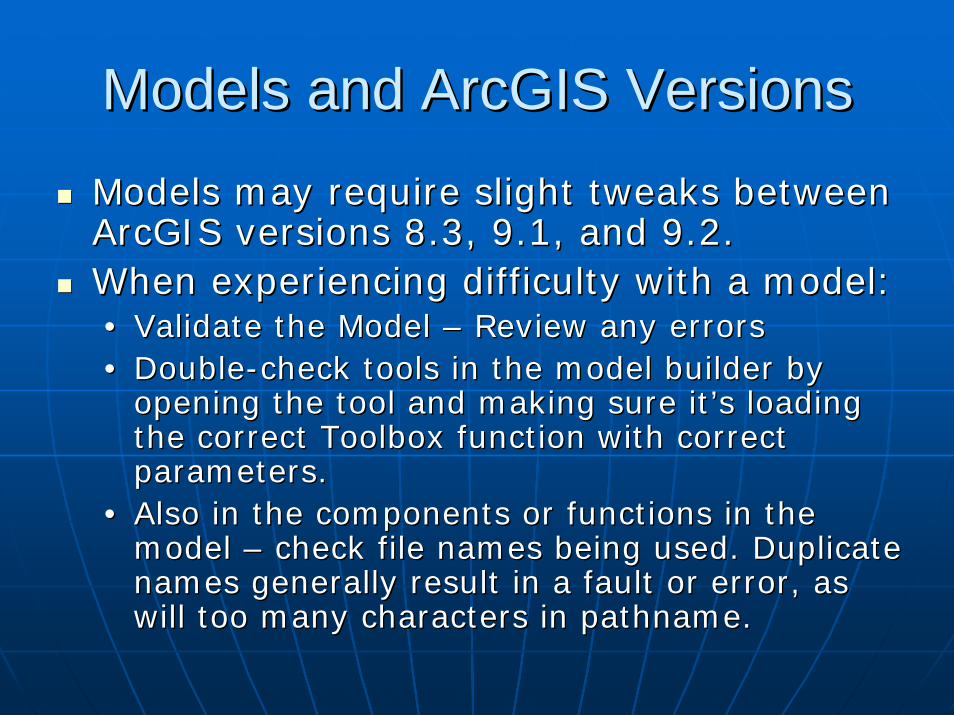
Models and ArcGIS VersionsModels and ArcGIS VersionsModels may require slight tweaks between Models may require slight tweaks between ArcGIS versions 8.3, 9.1, and 9.2.ArcGIS versions 8.3, 9.1, and 9.2.When experiencing difficulty with a model:When experiencing difficulty with a model:•• Validate the Model Validate the Model –– Review any errorsReview any errors•• DoubleDouble--check tools in the model builder by check tools in the model builder by
opening the tool and making sure itopening the tool and making sure it’’s loading s loading the correct Toolbox function with correct the correct Toolbox function with correct parameters.parameters.
•• Also in the components or functions in the Also in the components or functions in the model model –– check file names being used. Duplicate check file names being used. Duplicate names generally result in a fault or error, as names generally result in a fault or error, as will too many characters in pathname.will too many characters in pathname.
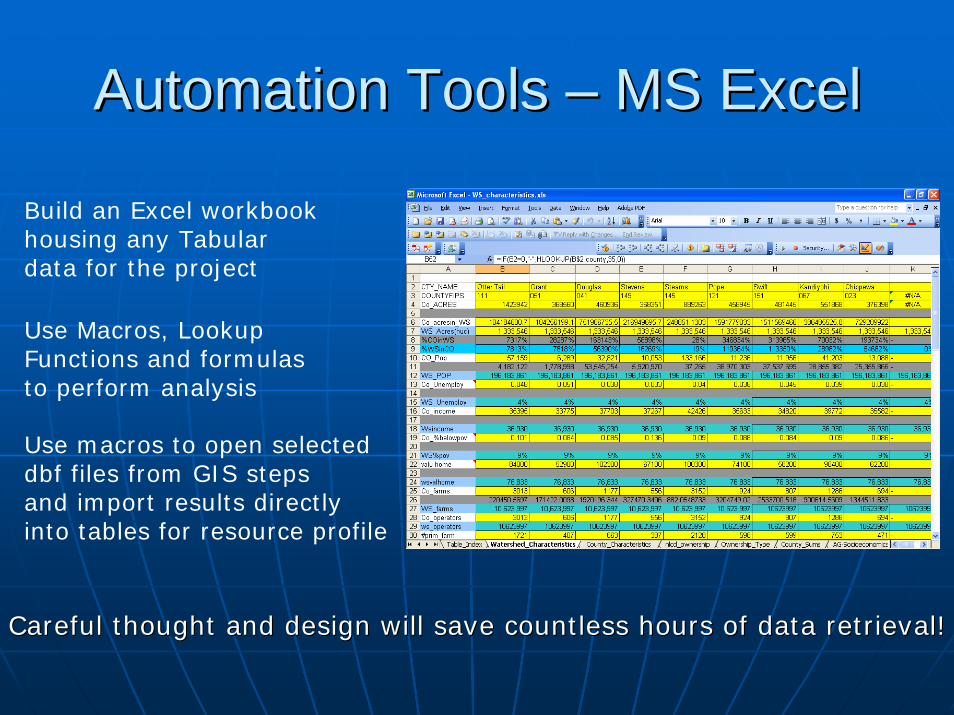
Automation Tools Automation Tools –– MS ExcelMS Excel
Build an Excel workbookhousing any Tabulardata for the project
Use Macros, Lookup Functions and formulas to perform analysis
Use macros to open selected dbf files from GIS steps and import results directly into tables for resource profile
Careful thought and design will save countless hours of data retCareful thought and design will save countless hours of data retrieval!rieval!

Product Design and PublishingProduct Design and Publishing
InDesign integrates smoothly with other members of the Adobe® software family, and works well with dbf and xls tables.
Create Multi-resolution .pdf files for Print and Web
Generate Web Pages Directly from RWA Documents
Tables and Map Images can be updated automatically
This translates to ease in creating, updating, and maintaining This translates to ease in creating, updating, and maintaining Resource Profiles as new data becomes available, and in Resource Profiles as new data becomes available, and in
providing multiple formats should the need arise. providing multiple formats should the need arise.
Copyright © 2008 Adobe Systems Incorporated.

Questions?Questions?
Contact InformationContact Information
Peter MeadPeter MeadSoil Conservation Technician, MN State OfficeSoil Conservation Technician, MN State OfficePhone: 651Phone: 651--602602--79287928
[email protected]@mn.usda.gov
Chris MorseChris MorseArea GIS Specialist, SE WisconsinArea GIS Specialist, SE Wisconsin920920--386386--9999, ext. 1249999, ext. [email protected]@wi.usda.gov