GHG-LCA of biofuels in Thailand – results from the field ...
48
Sustainable Palm Oil Production for Bio-Energy GHG-LCA of biofuels in Thailand – results from the field and building human and institutional capacity Sustainable Palm Oil Production for Bio-Energy capacity Mr.Daniel Mr.Daniel May May Project Director
Transcript of GHG-LCA of biofuels in Thailand – results from the field ...

Sustainable Palm Oil Production for Bio-Energy
GHG-LCA of biofuels in Thailand – results from
the field and building human and institutional
capacity
Sustainable Palm Oil Production for Bio-Energy
capacity
Mr.DanielMr.Daniel MayMayProject Director

Sustainable Palm Oil Production for Bio-Energy
ContentContent
ObjectiveObjective
Work flow
System boundary and methodology System boundary and methodology
Study result
Benefits
2

Sustainable Palm Oil Production for Bio-Energy
ObjectivesObjectives
1. Emission factors for all
stages of the palm oil life
cycle
2. GHG calculation
methodology to promote methodology to promote
consistency and good
practice
3. Recommendations on
GHG reduction options
4. Recommendations for
policy makers
3

Sustainable Palm Oil Production for Bio-Energy
ContentContent
Objective
Work flow Work flow
System boundary and methodology System boundary and methodology
Study result
Benefits
4

Sustainable Palm Oil Production for Bio-Energy
Work flowWork flow
(1)Preparation
(2)Implementation
(3)
Data verification
(4)
Result dissemination
5
Whole process takes overall two years!

Sustainable Palm Oil Production for Bio-Energy
11. Preparation. Preparation
Finding key partners
Set up GHG working group
(Advisor Board and Technical
Team)
Recruit PO industry
6
• Relevant institutes joined the workshop ⇨ seek for
potential partners
• All selected partners
joined the workshop to
define a mutual
agreement on roles and
responsibilities of each
institute
• Advisory Board signed
Implementation Agreement
• Technical Team signed
the working contract
• Office of Agricultural
Economics under MoAC
officially announced the
working group through
Letter of order
• Set up the meetings to
seek for participating
companies
• GIZ and participating
companies signed the data
confidentiality agreement

Sustainable Palm Oil Production for Bio-Energy
No. of participating companiesNo. of participating companies– Land use change (5 plantations in 5 provinces)
– Oil palm plantations (544 smallholders and 8 large-scale growers)
⇨ Location of planting areas selected from all over the
country and according to different growing conditions
⇨
country and according to different growing conditions
(rainfall, soil etc.)
– Mill: 14 plants (wet process) and 1 dry process
⇨ ~32% of total capacity
– Refinery: 6 plants
⇨ ~63% of total capacity
– Biodiesel: 7 plants
⇨ ~83% of total capacity7

Sustainable Palm Oil Production for Bio-Energy
22. Implementation. ImplementationTechnical Technical Team Team
(11 meetings)
• Identify system boundary and
calculation method
• Data collection – Data analysis –
GHG calculation
•Finalize the result
Advisory Advisory Board Board (7 meetings)
Monitor and steer the overall work
and ensure the result is correct
and suit for Thai PO industry
Regularly report
the work progress
Provide the
feedbacks
8
•Finalize the result
Coordinated by
External External ConsultantConsultant
Provide technical advise to keep Thai method be in line
with EU-RED requirement
feedbacks
Mid process : Working Group Workshop

Sustainable Palm Oil Production for Bio-Energy
• Data, calculation method and result are verified by the carbon footprint verifiers registered with Thailand Greenhouse Gas Management Organization (TGO).
• Advisory Board agreed with the calculation method and final result developed by Technical Team.
3. Data verification3. Data verification
final result developed by Technical Team.
• Set up the stakeholder consultation meeting to get agreement on result dissemination.
9

Sustainable Palm Oil Production for Bio-Energy
1. Capacity buildings for Thai Palm Oil Industry and Government concerned through several trainings.
2. Publish the result in any academic journals at national and international levels
3. Final reports will be published on TGO and OAE website
4. Result dissemination4. Result dissemination
3. Final reports will be published on TGO and OAE website
4. Emission factors (EFs) developed under the study were endorsed by TGO as specific EF for palm oil industry sector ⇨ product carbon footprint assessment
5. Data derived from the study will be further developed as Thai national life cycle inventory database Thai national life cycle inventory database for oil palm sector by MTEC and OAE
10
Sustainable Palm Oil Production for Bio-Energy
Thai national LCI databaseThai national LCI database
Aug 19, 2011 11

Sustainable Palm Oil Production for Bio-Energy
ContentContent
Objective
Work flow
System boundary and methodology System boundary and methodology System boundary and methodology System boundary and methodology
Study result
Benefits
12

Sustainable Palm Oil Production for Bio-Energy
System boundarySystem boundary
Oil palm
cultivation
Palm oil
milling
Land use
changeFresh fruit
bunches
Palm kernels
Wastewater
Empty fruit
bunches
Crude
palm oilCosmetic
JGSEE TEI
PSU
13
Refining
Biodiesel
productionBiodiesel
palm oil
Stearin Olein
Glycerol
Refined PO
Fractionation
To PKO refinery
Other uses
Cosmeticindustry
Vehicles
KU
TEI
PFAD

Sustainable Palm Oil Production for Bio-Energy
MethodologyMethodology
Life Cycle Assessment : LCA
14

Sustainable Palm Oil Production for Bio-Energy
Functional unit • 1,000 kg of each product
Data Allocation• By energy
MethodologyMethodology
Data Cut-off
• Emission factor of palm seed production
Data substitution
• Emission factor (EF) of Additives used in biodiesel
production => substituted by the highest EF of phenolic
group
15

Sustainable Palm Oil Production for Bio-Energy
ContentContent
Objective
Work flow
System boundary and methodology System boundary and methodology
Study result Study result
Benefits
16

Sustainable Palm Oil Production for Bio-Energy
% GHG saving
EUEU--RED requirementRED requirement50% (2017)60% (2018) 35% (2012)
17
Kg CO2 eq/ MJ fuel
6767%%
5454%%
6363%%
81%81%
Cultivation

Sustainable Palm Oil Production for Bio-Energy
ContentContent
Objective
Work flow
System boundary and methodology System boundary and methodology
Study result
BenefitsBenefits
18

Sustainable Palm Oil Production for Bio-Energy
BenefitsBenefits –– Private sectorPrivate sector
1. Data from the project study can be used
for product carbon footprinting and
labeling
2. GHG optimization options 2. GHG optimization options
recommended by the project can be
used for short and long term planning
towards the carbon neutral company
and Corporate social responsibility
policies
3. Increase the competitiveness

Sustainable Palm Oil Production for Bio-Energy
Benefits Benefits -- GovernmentGovernment
1. Supportive info for policy makers in formulating policies and strategies towards GHG reduction for whole supply chain of palm oil industry
⇨ low carbon economy⇨ low carbon economy
2. Development of Thai National Life Cycle Inventory Database of agricultural sector for further research concerning agricultural product
3. Supportive information for International Negotiations i.e. Climate negotiations

Sustainable Palm Oil Production for Bio-EnergySustainable Palm Oil Production for Bio-Energy
Contact Info:
Mr. Daniel May E: [email protected]
Ms. Kanokwan Saswattecha E: [email protected]
21

Sustainable Palm Oil Production for Bio-EnergySustainable Palm Oil Production for Bio-Energy
AnnexAnnex
22
AnnexAnnex

Sustainable Palm Oil Production for Bio-Energy
Land use changeLand use change•• Land use change scenarios Land use change scenarios were
chosen from data collected from 52
farmers in various parts of Thailand
• GHG calculations were done with
literature default values and literature default values and
equations based on the farming
practices.
• IPCC’s 2006 Guidelines for
National Greenhouse gases
Inventory
– Stock-Difference method is
chosen for the study
23

Sustainable Palm Oil Production for Bio-Energy
Land use change scenariosLand use change scenarios
• Cropland converted to cropland
– Rubber to Palm
– Crop farm to Palm
– Fruit orchard to Palm
Change in
biomass C
stock
Change in
biomass C
stock
– Paddy rice to Palm
• Land converted to cropland
– Forest to Palm
– Unused land to Palm
Land
use
change
Land
use
change
Change in
soil C stock
Change in
soil C stock
Non-CO2
GHG
emissions
from LUC
Non-CO2
GHG
emissions
from LUC
Change in
DOM C
stock
Change in
DOM C
stock
24

Sustainable Palm Oil Production for Bio-Energy
GHG balance comparisonGHG balance comparisonCase example GHG balance (Ton CO2eq /ha/yr)
First approach1 Second approach2
Rubber 8.72 -2.16
Field crop -17.55 -2.67
Fruit orchard -12.82 0
Paddy field -17.69 -1.79Paddy field -17.69 -1.79
Forest 8.51 24.41
Unused land -18.89 -2.98
Note: 1. Consider crop biomass and dead organic matter as ‘carbon stock’
2. Not consider crop biomass and dead organic matter as ‘carbon stock’
25

Sustainable Palm Oil Production for Bio-Energy
Active Ingredient
Production
Process
N-Fertilizer
Production
Process
P-Fertilizer
Production
Transportation
To Thailand
Ports
Transportation
To Thailand
Ports
Transportation
To Thailand
Mixed Fertilizer Production
Process
Transportation From
Suppliers To
Cultivation Fields
Transportation From
Agro-Chemical
Production Process
Transportation From
Suppliers To
Cultivation Fields
Local
Transportation
To Plant
Local
Transportation
To Plant
Local
Transportation
Import
CultivationCultivation
System boundary
Production
Process
K-Fertilizer
Production
Process
Boron-Fertilizer
Production
Process
Kieserite
Production
Process
To Thailand
Ports
Transportation
To Thailand
Ports
Transportation
To Thailand
Ports
Transportation
To Thailand
Ports
Oil Palm Seed
Production Process
Organic Fertilizer
Production Process
Transportation From
Suppliers To
Cultivation Fields
Transportation From
Suppliers To
Cultivation Fields
Oil Palm
Cultivation
Process
To Plant
Local
Transportation
To Plant
Local
Transportation
To Plant
Local
Transportation
To Plant
ElectricityProduction
FuelProduction
FFB
26
Sustainable Palm Oil Production for Bio-Energy
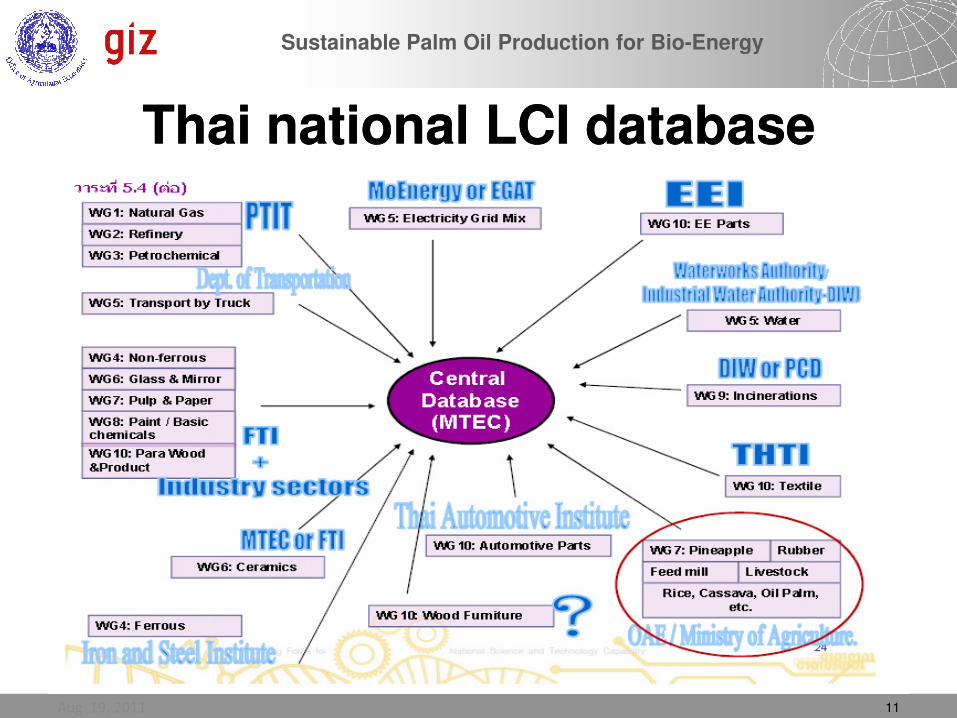
SubSub--SystemSystemSeeding
Pre-Nursery 0-2 years 3-5 years
CultivationNursery
27
Main-Nursery6-9 years
15-25 years
10-14 years

Sustainable Palm Oil Production for Bio-Energy
Upper Southern
Prachuapkhirikhan
Eastern
Chonburi, Trat
Eastern-Lower Southern
Chumphon, Suratthani,
Western-Lower
Data CollectionData Collection
Western-Lower Southern
Krabi, Trang,
Classified by amount of rainfall annually
28

Sustainable Palm Oil Production for Bio-Energy
– Eastern Thailand• Large Scale Cultivation• Small Farm Cultivation
– Upper Southern Thailand
• Large Scale Cultivation• Large Scale Cultivation• Small Farm Cultivation
– Eastern-Lower Southern Thailand
• Large Scale Cultivation• Small Farm Cultivation
– Western-Lower Southern Thailand
• Large Scale Cultivation• Small Farm Cultivation

Sustainable Palm Oil Production for Bio-Energy
% Study area coverage
Study area
No. of small
scaled plantatio
n
No. of large
scaled plantati
on
Sampled area
Rai
Planted area in 2009
% Sampled area covera
ge
30
n on ge 1. East 75 1 9,139 3,888,4
03
0.24
2. Upper south
50 2 1,646 3,888,4
03
0.04
3. Lower south –east coast
274 4 35,945 3,888,4
03
0.92
4. Lower 145 1 18,550 3,888,4 0.48Source: Office of agricultural
Economics

Sustainable Palm Oil Production for Bio-Energy
Oil PalmManagement:
Productive Period(0-2 Years)
Oil PalmManagement:e
eN
eP1
e
ePeTotal eS eN eP+ += eP eP1 eP2 eP3+ +=
eN eN1 eN2+=
GHG calculationGHG calculation
eP4+ eP5+
Seeding
Pre-Nursery
Main-Nursery
Management:Productive Period
(3-5 Years)
Oil PalmManagement:
Productive Period(6-9 Years)
eS eP2
eP3
eN1
eN2 Oil PalmManagement:
Productive Period(10-14 Years)
Oil PalmManagement:
Productive Period(16-25 Years)
eP4
eP5
31

Sustainable Palm Oil Production for Bio-Energy
MethodologyMethodology
Functional unit • 1,000 kg of FFB
Data Allocation• none• none
Data Cut-off
• Emission factor of seed production
Data substitution
• none
32

Sustainable Palm Oil Production for Bio-Energy
GHG calculation worksheetลำดับที่ ชื่อเกษตรกร พันธุ์ปาล์ม อายุ พื้นที่ปลูก ต้นปาล์ม ผลผลิตเฉลี่ย ผลผลิต รอบเก็บทะลาย จังหวัด
(ปี) (ไร่) (ต้น) (กิโลกรัม/ไร่/ปี) (กิโลกรัม/รอบ) (วัน/รอบ)
1.00 1
1.00 2
1.00 3
1.00 4
1.00 5
0.00 0.00
5.00 1
5.00 2
5.00 3
5.00 4
5.00 5
0.00 0.00
อายุ 0
-2 ปี
อายุ 3
-5 ปี
33
6.00 1
6.00 2
6.00 3
6.00 4
6.00 5
0.00 0.00
10.00 1
10.00 2
10.00 3
10.00 4
10.00 5
0.00 0.00
18.00 1
19.00 2
20.00 3
20.00 4
20.00 5
0.00 0.00
กรอกข้อมูล
อายุ 1
0-1
4 ปี
อายุ 1
5-2
5 ปี
อายุ 6
-9 ปี

Sustainable Palm Oil Production for Bio-Energy
Study resultStudy resultG
HG
em
iss
ion
(Kg
CO
2e
/ T
on
FF
B) Thailand average 74
Best observation 52
Study Area Small Large
34
GH
G e
mis
sio
n
(Kg
CO
2e
/ T
on
FF
B)
Study Area Small Large
East 71 76
Upper South 58 52
Lower South - east
coast 82 73
Lower South - west
coast 71 64

Sustainable Palm Oil Production for Bio-Energy
Palm oil millPalm oil millData collected from14 participating mills (10 mills with BG
capture and 4 mills w/o BG capture) ⇨ ~32% of total production capacity in Thailand
FFB Transport
CPO
PK
Product
35
FFB
Chemical
Fuel
Electricity
Transport
Transport
Transport
Fuel
CPO Process:
Fuel
combustion
PK
EFB
Shell
Fiber
Wastewater Treatment Plant
Decanter cake
By-Product
Waste
System Boundary
Empty package

Sustainable Palm Oil Production for Bio-Energy
MethodologyMethodology
Case I, Wastewater treatment system with biogas recovery system
EWastewater = EWastewater, treatment + ESludge, treatment + EWastewater,
ETotal = EFFB + EChemical + EEnergy + Ewastewater + ESolidWaste
36
EWastewater = EWastewater, treatment + ESludge, treatment + EWastewater,
discharge
+ ESludge, final + EFugitive + EBiomass + Eflaring
Case II, Wastewater treatment system without biogas recovery system
EWastewater = EWastewater, treatment + ESludge, treatment + EWastewater, discharge
+ ESludge, final
Remark : equation was referenced from UNFCCC guideline

Sustainable Palm Oil Production for Bio-Energy
MethodologyMethodology
Functional unit • 1,000 kg of CPO
Data Allocation• Energy• Energy
Data Cut-off
• None
Data substitution
• None
37

Sustainable Palm Oil Production for Bio-Energy
GHG calculation worksheetInputs Data Inputs Data Outputs Data
Item Unit Amount Name Unit Amount Referance Source
FFB usage FFB usage FFB usage
Total of FFB ton 0 - FFB 1.1 FFB produc
FFB ���������� % 0 FFB ���������� kg CO2e/ton FFB 71.135GIZ, 2011 FFB ����������
FFB ���������� % 0 FFB ���������� kg CO2e/ton FFB 64.099GIZ, 2011 FFB ���������
Total
FFB transportation FFB transportation 1.2 FFB transpo
1. �������-����� 1. �������-����� 1. �������-���
������ FFB % 0 10 km -80% kg CO2e/ton FFB 3.93GIZ, 2011 10 km -80%
20 km - 15% kg CO2e/ton FFB 7.86GIZ, 2011 20 km - 15%
38
30 km - 5% kg CO2e/ton FFB 11.79GIZ, 2011 30 km - 5%
Total
2. �������-������ ��� ����� - ������ 2. �������-������ ��� ����� - ������ 2. �������-����
����������� 1 ����������� 1 ����������� 1
������ 4 wheels truck Full load 4 wheels truck kg CO2e/ton-km 0.2247TGO,2010
������������ 1 ������ tons 1.5 No load 4 wheels truck kg CO2e/km 0.2523TGO,2010
������������ 1 ������ km 0
������ FFB �������� % 0
����������� 2 ����������� 2 ����������� 2
������ 10 wheels truck Full load 10 wheels truck kg CO2e/ton-km 0.0425TGO,2010
������������ 1 ������ tons 16 No load 10 wheels truck kg CO2e/km 0.5429TGO,2010
������������ 1 ������ km 0
������ FFB �������� % 0

Sustainable Palm Oil Production for Bio-Energy
Study resultStudy result
GH
G e
mis
sio
n
(Kg
CO
2e
/ T
on
Pro
du
ct)
Study case CPO Shell PK
Mill with CH4
capture750 322 536
39
GH
G e
mis
sio
n
(Kg
CO
2e
/ T
on
Pro
du
ct)
capture
Mill w/o CH4
capture1087 467 726
Thailand
average871 373 646
Best
observation440 192 -

Sustainable Palm Oil Production for Bio-Energy
Palm oil refineryPalm oil refinery
Data collected from 6
participating factories
⇨
Palm oil refining
CPO
1
Fuel Elec. Chemicals
participating factories
⇨ ~63% of total production
capacity in Thailand
System boundary
40
RBDPO PFAD
RBO Stearin RBO Olein
Fractionation
2

Sustainable Palm Oil Production for Bio-Energy
Functional unit • 1,000 kg of each product
Data Allocation• By energy
MethodologyMethodology
• By energy
Data Cut-off
• None
Data substitution
• None
41

Sustainable Palm Oil Production for Bio-Energy
GHG calculation worksheet
������������ : Waste water treatment
����������� : U4
������������ : Treated water 1 m3""""""" /
���������������������� :
���/�����/��:
�������� : ������������� ������������ MSDS ��������������������, cas number , %����������
������������
""""""""""""":
"""""""""""""""""""" (""." """ "".):
"""""""""""""""""""""""""""""""""
�������������������������������������
42
"""""""""""""""""""""""""""""""""
������������������������������������ (Effluent) ������
BOD mg/L
COD 80mg/l 0.00008ton/m3
Oil & Grease mg/L
Total Suspened solid mg/L
���������-�������� ������ ������-��������� ����� �������� 2009 ��������� PUEF (kgCO2eq/unit)GHG (kgCO2eq/unit)���������������������
Input """"""""""""""""" """"""""""""" m3
#DIV/0! #DIV/0!
Input """"" """"""" kWh #DIV/0! 0.5610 #DIV/0!
Output """""""""""""""" """"""""""""" m3
#DIV/0! #DIV/0!
Output CH4 """"""""""" kg #DIV/0! 25 #DIV/0!
Output """""""" """"""""""" kg #DIV/0! 2.5300 #DIV/0!
Output BOD """"""""""" kg #DIV/0! #DIV/0!
Output COD """"""""""" kg #DIV/0! #DIV/0!
Output Oil & Grease """"""""""" kg #DIV/0! #DIV/0!
Output Total Suspened solid""""""""""" kg #DIV/0! #DIV/0!
GHG/PU #DIV/0!

Sustainable Palm Oil Production for Bio-Energy
Study resultStudy result
GH
G e
mis
sio
n
(Kg
CO
2e
/ T
on
pro
du
ct)
Study case RBDPO PFAD Olein Stearin
Mill with CH4
capture 865 898 891 967
43
GH
G e
mis
sio
n
(Kg
CO
2e
/ T
on
pro
du
ct)
Mill w/o CH4
capture 1206 1252 1225 1329
Thailand
average 987 1205 1010 1096
Best
observation 466 494 461 500

Sustainable Palm Oil Production for Bio-Energy
CPO
Palm Stearine
RBDPO
Methanol
KOH
Foreign
Data collected from 7
participating factories
Biodiesel productionBiodiesel production
Biodiesel production
KOH
H2SO4
NaOH
HCl
H3PO4
Fuel oil
Oil palm shell
LPG
Harbour
⇨ ~87% of total
capacity in Thailand
Product
B100
By-product
Glycerin
System boundary
44

Sustainable Palm Oil Production for Bio-Energy
Which data are needed?Which data are needed?Palm oil _xx__ kg
Palm stearine xx kg
Energy used
-Electricity _xx_ kWh
- Steam __xx_ kg
Biodiesel _xx__ kg
Glycerine _xx__ kg
Wastewater __xx_ kg
GHGb= + +11 22 33
11
33
45
- Water _xx__ kg
Wastewater __xx_ kg
- BOD _xx__ kg
Air emission
- CO2 _xx__ kg
- SO2 _xx__ kg
Chemical substance
-NaOH _xx__ kg
- KOH _xx_ kg
- Methanol _xx_ kg
- CH3NaO _xx__ kg
GHG emissions from energy used 11
22 GHG emissions from chemical substance
33 GHG emissions from process or wastewater
22

Sustainable Palm Oil Production for Bio-Energy
MethodologyMethodology
Functinal unit• 1,000 kg of B100
Data Allocation• Energy
Data Cut-off
• None
Data substitution
• Emission factor of Additives => substituted by the highest EF of phenolic group
46

Sustainable Palm Oil Production for Bio-Energy
GHG calculation worksheetUnit Amount
Main product Biodiesel kg 1000.00
Crude Glycerine kg 124.42
K2SO4 kg 8.18
Unit Amount GHG emissions GHG emissions*
CPO kg 0.00 0.00
RBDPO kg 0.00 0.00
PFAD kg 0.00 0.00
Palm Stearin kg 0.00 0.00
CPO kg 0.00 0.00
RBDPO kg 0.00 0.00
PFAD kg 0.00 0.00
Palm Stearin kg 0.00 0.00
CPO kg 327.80 285.51 263.34
1. Production
Case 2
Case 1
Main Materials
Input
Allocation factor
0.92ProductCoproduct
Product
47
CPO kg 327.80 285.51 263.34
RBDPO kg 354.79 350.17 322.98
PFAD kg 10.08 12.15 11.20
Palm Stearin kg 323.65 354.72 327.17
CPO kg 0.00 0.00
RBDPO kg 0.00 0.00
PFAD kg 0.00 0.00
Palm Stearin kg 0.00 0.00
1002.55 924.69
Tap water kg 369.60 9.76E-03 9.00E-03
Softening water kg 605.27 1.56E-02 1.44E-02
Demin & clarified water kg 13.63 1.08E-02 9.98E-03
Alcohol Methanol kg 127.07 9.35E+01 8.63E+01
KOH kg 9.04 1.72E+01 1.58E+01
NaOH kg 0.40 4.85E-01 4.47E-01
NaOCH3 kg 2.86 1.39E+01 1.28E+01
H2SO4 kg 7.09 6.47E-01 5.97E-01
HCl kg 1.97 1.76E+00 1.63E+00
Citric acid kg 0.15 1.75E-01 1.61E-01
Base NaOH kg 0.18 1.91E-01 1.76E-01
H3PO4 kg 1.63 2.32E+00 2.14E+00
Beaching eart kg 5.24 1.53E-02 1.41E-02
Support materials
Water
Catalyst
Acid
Deguming & Beaching
Case 3
SUM
Case 4
Main Materials

Sustainable Palm Oil Production for Bio-Energy
Study resultStudy resultG
HG
em
iss
ion
(Kg
CO
2e
/ T
on
pro
du
ct)
Study case Biodiesel Glycerin
Mill with CH4
capture 971 577
48
GH
G e
mis
sio
n
(Kg
CO
2e
/ T
on
pro
du
ct)
capture 971 577
Mill w/o CH4
capture 1359 810
Thailand average 1087 646
Best observation 558 319