Getting the Numbers Right - Reloop Platform
17
This report was authored by Eunomia Research & Consulting Ltd and published by Reloop Platform February 2020 Getting the Numbers Right: A discussion paper on calculating & reporting separate collection of plastic beverage bottles
Transcript of Getting the Numbers Right - Reloop Platform

This report was authored by Eunomia Research & Consulting Ltd
and published by Reloop Platform February 2020
Getting the Numbers Right: A discussion paper on calculating
& reporting separate collection of plastic beverage bottles

1
1.0 Discussion Paper- Methodologies for the calculation and reporting of a separate collection target for beverage bottles
The purpose of this paper is to highlight issues with, and propose a way forward for, the development of methods for demonstrating achievement of the separate collection targets in Article 9 of the Directive on the reduction of the impact of certain plastic products on the environment (2019/904/EC, commonly referred to as the Single Use Plastics Directive, and referred to henceforth as ‘the SUP Directive’).
1.1 Legislation The relevant text from the SUP Directive is given below.
Article 9 of Directive (EU) 2019/904 concerning separate collection states:
1. Member States shall take the necessary measures to ensure the separate collection for recycling:
(a) by 2025, of an amount of waste single-use plastic products listed in Part F of the Annex equal to 77 % of such single- use plastic products placed on the market in a given year by weight;
(b) by 2029, of an amount of waste single-use plastic products listed in Part F of the Annex equal to 90 % of such single- use plastic products placed on the market in a given year by weight.
Single-use plastic products listed in Part F of the Annex placed on the market in a Member State may be deemed to be equal to the amount of waste generated from such products, including as litter, in the same year in that Member State.
In order to achieve that objective, Member States may inter alia:
(a) establish deposit-refund schemes;
(b) establish separate collection targets for relevant extended producer responsibility schemes.
Part F of the Annex defines single-use plastic products covered by Article 9 as:
Beverage bottles with a capacity of up to three litres, including their caps and lids, but not:
(a) glass or metal beverage bottles that have caps and lids made from plastic,
(b) beverage bottles intended and used for food for special medical purposes as defined in point (g) of Article 2 of Regulation (EU) No 609/2013 that is in liquid form.

Article 13(1)(c) and 13(4) of Directive (EU) 2019/904 concerning reporting of data on the separate collection of single-use plastic beverage bottles:
1. Member States shall, for each calendar year, report to the Commission the following:
[…] (c) data on single-use plastic products listed in Part F of the Annex that have been separately collected in the Member State each year, to demonstrate the attainment of the separate collection targets in accordance with Article 9(1)
4. […] By 3 July 2020, the Commission shall adopt implementing acts laying down the format for reporting data in accordance with points (c) and (d) of paragraph 1 [‘MS data reporting to COM’] and with paragraph 2 [‘quality check report’] of this Article.
[…] Those implementing acts shall be adopted in accordance with the examination procedure referred to in Article 16(2). The format developed according to Article 12 of Directive 94/62/EC shall be taken into consideration.
This makes clear that by mid-2020, an implementing act will be required which sets out the reporting which will be required to demonstrate attainment of the Article 9 targets.
Whilst recitals are not legally binding, they provide useful guidance as to the intention of the directive where the wording is not fully, or unambiguously defined. Recital 27 effectively reiterates Article 9 in stating:
The setting of the separate collection target should be based on the amount of single-use plastic beverage bottles placed on the market in a Member State or alternatively on the amount of waste single-use plastic beverage bottles generated in a Member State. The calculation of the amount of waste generated in a Member State should take due account of all waste single-use plastic beverage bottles generated, including those which become litter instead of being disposed of through waste collection systems.
Given the way in which the Article 9 targets are expressed, it is possible that the intent of the target related to ‘separate collection’ could be weakened as a result of forms of interpretation that, as well simplifying achievement of the targets themselves, also undermine the objectives of the Directive.
This paper first highlights where the problems might lie, and the implications of adopting too lax an approach to interpreting the wording used in the Directive. Following this, we propose a way forward which, we believe, interprets the Article 9 targets in a way that aligns with the objectives of Article 1 and the spirit and intent of the Directive more broadly.
2.0 Calculating the Separate Collection Rate Member States will be required to report a separate collection rate as per Article 9 of Directive (EU) 2019/904 according to the ratio:
The weight of sorted single use plastic (SUP) beverage bottles, potentially (depending on the method used) including a quantity of material which are not SUP beverage bottles

3
divided by:
The weight of SUP beverage bottles placed on the market, typically measured clean, dry, potentially ‘naked’ (no labels, no caps, no glues and no inks) and with no moisture and no extraneous materials attached to them
There are a number of ways in which this fraction may prove problematic, in particular:
• the measurement of PoM data in the denominator; and • the measurement of separately collected SUP beverage containers.
These issues are discussed in the following sections.
2.1 Understanding Placed on the Market Data and its Limitations
As stated in Article 9, the collection rate requires the ‘amount of waste single-use plastic products’ included in the ‘separate collection for recycling’ to exceed the target proportion of the placed on the market figure. The amount of waste SUP beverage bottles generated can be deemed to be equal to those placed on the market in a MS.
Reporting PoM can be inaccurate for a number of reasons:
1) Firstly, producers may differ in their approach to calculating what is PoM. Many large producers will manufacture and fill bottles in the same bottling plant, meaning the bottle is PoM at the same time as the product. It is less often the case that bottles are transported for filling. It is unclear however, at what stage of the process producers actually report bottles as PoM, and whether or not bottles are reported with the labels, glues and caps attached or not;
2) Second, producers themselves might not always have accurate data on what they are placing on the market and they may rely on figures available in databases (which may be held privately by third parties). Since there is a natural incentive to report lower weights being PoM, as it reduces the fees which producers pay to an EPR scheme or PRO, it follows that where there is a choice of different values for the weight of containers that could be used in estimations, producers may well be inclined to choose values at the low-end of any range that exists;
3) Third, two sources of under-reporting of PoM figures, whether intentional or unintentional, reduce the accuracy of the data. Two issues in particular increase the risk of mis-reported PoM data:
a. the use of a de minimis threshold for reporting standards, under which some producers may fall and therefore estimates for PoM are used; and
b. free-riding, typically facilitated by online sales and cross-border trade. 4) Fourth, methodologies, data sources and the level of validation for measuring plastic
beverage packaging PoM vary significantly across MS, again affecting the accuracy of PoM data. This might not affect calculations per se, but it might increase the extent to which producers are able to under-report as per point 2 above, or evade responsibility as per point 3b above.
As a result of the above factors, PoM figures tend, therefore, to be an underestimate of the amount of plastic beverage packaging on the market (as illustrated in Figure 1 below).

Figure 1: Illustration of how Reported PoM Figures May Understate True PoM Weights
2.2 Issues with Reporting the Weight of Collected Beverage Containers
In the EU currently, there is no discrete, or uniform, measure of the amount of plastic beverage bottles collected for recycling. Indeed, over recent years, the Commission has made efforts to move away from allowing the collection rate to be used as a metric for informing what the recycling rate is/should be, towards more accurate measurement methods based on what actually enters a recycling operation.
Previous studies by Eunomia in support of the Commission, including the 2018 Measurement Methods report and the 2017 Study on Waste Statistics, examined earlier methods of measuring waste management performance. Recently however, new rules outlined in Implementing Decision 2019/1004 with regards to the Waste Framework Directive, shift the point of measurement to the ‘output of a facility that sends municipal waste for recycling’, thus dictating future calculation approaches by MS.
At present, as regards municipal waste recycling, a key issue is that MS are reporting material as ‘recycled’ at different stages of the waste management process, ranging from the point of (separate) collection through to final reprocessing. Where packaging waste recycling is concerned, waste should not be counted as ‘recycled’ at the point of it being separately collected, but only at the output of a sorting process, and then only if ‘subsequent losses are not significant’: nonetheless, at least one MS reports at the point of collection. Where recycling rates are concerned, this has the effect of over-stating performance. The issue here, however, is accurate measurement of a collection rate achieved through separate collection, or ‘mingled’ collection under the derogation afforded by Article 10(3)(a) of the WFD.
2.2.1 The Difference Between PoM Bottle Weights and Bottle Weights as Collected
In 2016, PET beverage bottles represented over 91% (measured by units sold) of beverage bottles in the EU, with HDPE the second most used polymer (according to GlobalData estimates). Thus, SUP beverage bottles are most likely to be either PET or HDPE.
When reporting packaging waste recycled, most MS report on the weight of material being sent from a sorting process for further processing. MS are therefore likely to be reporting plastic packaging ‘recycling rates’ as a ratio of:

5
• the weight of sorted material (including a proportion of materials which will subsequently be lost to the process); and
• the weight of clean, dry plastic packaging PoM which has no moisture and/or non-targeted materials attached to or contained within it.
The important issue as regards collection rates, as specified by Article 9 of the SUP Directive, is that there is likely to be a weight difference between bottles which are collected as waste, and the same bottles weighed at the point where they are PoM. This is demonstrated in Figure 2, which highlights the fact that the weight of a SUP beverage container in the waste stream may differ significantly from the weight of a bottle at the point it is PoM.
The magnitude of this differential is not entirely distinct because:
a) it is not always completely clear to what PoM weights refer; and b) the attached (e.g. labels, sleeves, dirt) materials and contained (within the container)
liquid/other material which is present is not consistently measured or known.
What Eunomia has observed, however, is the considerable difference between reported PoM data for plastics (and packaging generally), expressed in terms of weight of each material, and the weight of the packaging fractions when they are analysed as part of waste composition studies.
Some light can be shed on this through other studies and reports. At a general level, data from EXPRA as well as other MS studies1, indicate losses within the plastic packaging sorting
1 See sources including: Extended Producer Responsibility Alliance (2014) The Effects of the Proposed EU Packaging Waste Policy on Waste Management Practice: A Feasibility Study, October 2014, www.expra.eu/downloads/expra_20141004_f_UGGge.pdf; and GVM (2009) Recycling-Bilanz für Verpackungen,
Figure 2: Difference in Weight between PoM and Collected for Recycling

and recycling process to be around 25% and 30% respectively. Not only is the accuracy of the material separation an issue, but moisture, impurities and non-plastics are also present in collected plastic packaging waste. Indeed, a study by WRAP of sorting facilities in England, notes that in the separated plastics stream, about 10% by weight is non-target materials (targeted materials include bottles as well as films, pots, tubs and trays)2.
More specifically, and in relation to PET, recent work for Plastics Recyclers Europe, PETCORE and EFBW indicated that, of the tonnage of PET bottles sent to reprocessors, around 8% was not PET and around 4% was PET trays.3 Despite this, the same report indicates that average plant rPET yields are only 73% of input tonnages. The report notes ‘better data may show the adjustment needed to account for quantities of moisture, labels, and non-PET content is substantially higher than 8%.’ Those receiving relatively clean streams of containers from DRS indicate a loss in weight of around 25%. The suggestion is that the weight of ‘stuff’ which might not be included in the PoM measurement may be of the order 20-25%, and possibly higher. This discussion is consistent with data from NAPCOR in the US. A 2016 report indicated the amount of clean flake produced from US bottle material as a percentage of reported incoming material purchased, according to originating category. In 2016, the rate for deposit bottles was 85%; for door-to-door collections, it was 66%; and for California CRV material, it was 81%.4
In essence, the numerator and denominator in the collection target calculation should be referencing ‘the same stuff’, but the weights reported as PoM, and the weights indicated by the quantity of waste generated and its composition, do not appear to be closely related (though in some jurisdictions, the amount of packaging waste generated is, effectively, derived not from PoM data, but from composition data, as in the Republic of Ireland). Some, though not all, of this difference is explained by the likely understating of the PoM figures (as indicated above). The remainder is assumed to be related to the difference in ‘what is being weighed’ – a plastic package when weighed ‘as collected’ weighs more than when under ‘PoM conditions’. We estimate that this quantity is likely to be of the order 25% in EPR schemes operating in the EU.
It is also worth noting that Article 5 of Decision 2005/270/EC (as amended) states:5
‘1. For the purposes of calculating and verifying attainment of the targets set in points (a) to (e) of Article 6(1) of Directive 94/62/EC, the weight of recovered or
Berichtsjahr 2009, Seite 51. In Eunomia’s Early Warning Mechanism Report (2018), it was noted that three studies from Denmark, Italy, and a study of the average loss rates across 11 Member States, report plastic waste loss rates of 20%, 40% and 47% respectively (an average of 36%).
2 WRAP (2015) Material Facility Reporting Portal: Q3 2015 – Commentary, www.wrap.org.uk/sites/files/wrap/Materials_Facility_reporting_portal_Q3_2015_commentary_0.pdf 3 The contamination and tray content assumptions are based on data from ICIS and Petcore Europe (2017) Annual Survey on the European PET Recycle Industry, and they are slightly higher than those reported by WRAP (depicted in Table 1 below). 4 NAPCOR and the Association of Plastics Recyclers (2017) Report on Postconsumer PET Container Recycling Activity in 2016, October 31 2017, https://www.plasticsrecycling.org/images/pdf/resources/reports/NAPCOR-APR_2016RateReport_FINAL.pdf . 5 Commission Implementing Decision (EU) 2019/665 of 17 April 2019 amending Decision 2005/270/EC establishing the formats relating to the database system pursuant to European Parliament and Council Directive 94/62/EC on packaging and packaging waste.

7
recycled packaging waste shall be measured using a natural humidity rate of the packaging waste comparable to the humidity rate of equivalent packaging put on the market
Corrections shall be made to measured data relating to the weight of recovered or recycled packaging waste, if the humidity rate of that packaging waste regularly and significantly differs from that of packaging placed on the market and if this factor risks leading to substantial over- or underestimates of packaging recovery or recycling rates.’
It proceeds to state that resorting to this approach should only be in exceptional cases. It is clear, however, that the cases we are referring to are not exceptional ones, but rather, they are the norm.
If the relevant adjustments are not made – to ensure that when weighing SUP beverage containers being collected, the weight equates to that of the same container when it is placed on the market – then the reported performance against the Article 9 targets will be over-stated, and perhaps significantly so.6 This is taken up further in Section 2.3 below.
2.2.2 Issues with Measuring Post-sorting Further complicating matters is that, outside deposit refund systems (DRS), the measurement of SUP beverage bottles collected needs to overcome the fact that SUP beverage bottles will not, in general, be collected separately from other plastics and/or materials: they are ‘mingled’ with others. It follows that they would need to be separated from the other plastics/materials alongside which they are being collected.
Outside of a DRS scheme, PET beverage bottles are most often separately collected with a range of other plastics; mostly packaging and often other (packaging) materials. These are typically sorted at sorting facilities, either into a PET bottles fraction (clear or ‘jazz’), or a PET fraction, which may include non-beverage PET bottles, such as for food items and cosmetics, as well as PET trays and a proportion of non-PET material. The relative proportion of the non-target items will depend on the nature of the sorting, including whether the PET is sorted by colour. Measuring the separate collection of SUP beverage containers requires that these other products, and the bottles used for products other than beverages, are excluded from the calculation. It follows that measuring a sorted PET stream would not give an acceptable figure for the separate collection of SUP beverage bottles (even if an appropriate adjustment was made for the weight differential alluded to above) because of the presence of non-target materials. Furthermore, PET bottles which were collected may be mis-sorted into other streams for various reasons.
Similar considerations apply to HDPE bottles, although there are some key differences worth noting. First, nearly all municipally collected HDPE is bottles, but a much lower percentage of HDPE bottles are beverage bottles. HDPE is more typically used for cosmetic and household cleaning product bottles. Second, given that the market demand for high quality HDPE is lower than that for PET, the quality of HDPE bales also tends to be of a lower
6 Note that the importance of this point might also be dependent partly on what is or is not considered ‘a beverage’ since the amount of non-target material attached to SUP containers may vary according to the beverage it contains.

standard; the quality of reported data is also hindered by the less buoyant nature of the market. Sorted HDPE bales thus tend to have more non-HDPE content, and a lower proportion of the HDPE bottles are beverage bottles. With regards to HDPE milk bottles, in MS where such bottles arise in significant volumes, these are likely to be separated out.
A selection of data presented in Table 1 and Table 2, shows the reported composition (by rows) of specific output categories (the column headers) sampled in the UK. These are outputs from Material Recovery Facilities (MRFs) and Plastics Recovery Facilities (PRFs), the latter being facilities that sort, by polymer, pre-segregated streams of plastics. Table 1 shows the output streams that were intending to sort various classes of PET. None of the outputs consist of 100% of target material. Where it was intended that bottles were targeted, non-bottle rigid pots, tubs and trays were also included, and whilst it was intended to sort only PET, varying amounts of other polymers were present. The final three rows indicate other plastics (films and non-packaging plastics), non-plastics, and other fine fractions/unidentified items. None of the sorted streams included, on average, less than 6% by weight of items that were not targeted.
Table 2 gives similar data for fractions where PET is less dominant. The data shows, for example, non-trivial proportions of PET bottles in the ‘HDPE bottles jazz’, and the ‘PP’ (polypropylene) streams, highlighting that tracking separately collected bottles post sorting might require sampling of outputs where the PET bottles should not be. Table 1 suggests the accuracy of positively sorting PET bottles into the PET streams may be greater than for HDPE, where PET bottles may also be found.
Table 1: Composition of MRF/PRF Output Streams
No of Samples 5 2 7 8 13
Type Polymer Category PET bottles Clear
PET bottles
jazz Mixed bottles
PET natural mix inc. bottles
PET
Bottles
Type 1 PET B_PET_NATURAL 92.0% 25.4% 38.5% 68.1% 77.3% Type 1 PET B_PET_JAZZ 0.5% 70.0% 4.5% 1.9% 1.4%
Type 2 HDPE B_HDPE_Milk Bottles 0.0% 0.0% 31.4% 0.2% 0.1%
Type 2 HDPE B_HDPE_All non-milk bottles 0.1% 0.0% 19.8% 0.1% 0.1%
Type 3 PVC B_PVC_ALL 0.0% 0.0% 0.1% 0.0% 0.0% Type 5 PP B_PP_ALL 0.0% 0.0% 1.1% 0.0% 0.0%
Plastic packaging, PTTs (PET and HDPE)
Type 1 PET Pack_PET_NATURAL 1.3% 2.6% 0.4% 23.6% 15.0%
Type 1 PET Pack_PET_JAZZ 0.2% 0.9% 0.1% 0.3% 0.3%
Type 2 HDPE Pack_HDPE_NATURAL 0.0% 0.0% 0.3% 0.0% 0.0%
Type 2 HDPE Pack_HDPE_JAZZ 0.0% 0.0% 0.7% 0.0% 0.0%
Other Other plastics 1.6% 0.4% 1.1% 1.5% 1.4% Non-plastic 3.5% 0.0% 1.4% 2.4% 2.9% Fines <45mm and Unidentified 0.8% 0.7% 0.6% 1.9% 1.5%
Note: PTT = pots, tubs and trays (non-bottle rigid packaging) Source: WRAP (2018) Composition of plastic waste collected via kerbside. Available at http://www.wrap.org.uk/content/composition-plastic-waste-collected-kerbside
9
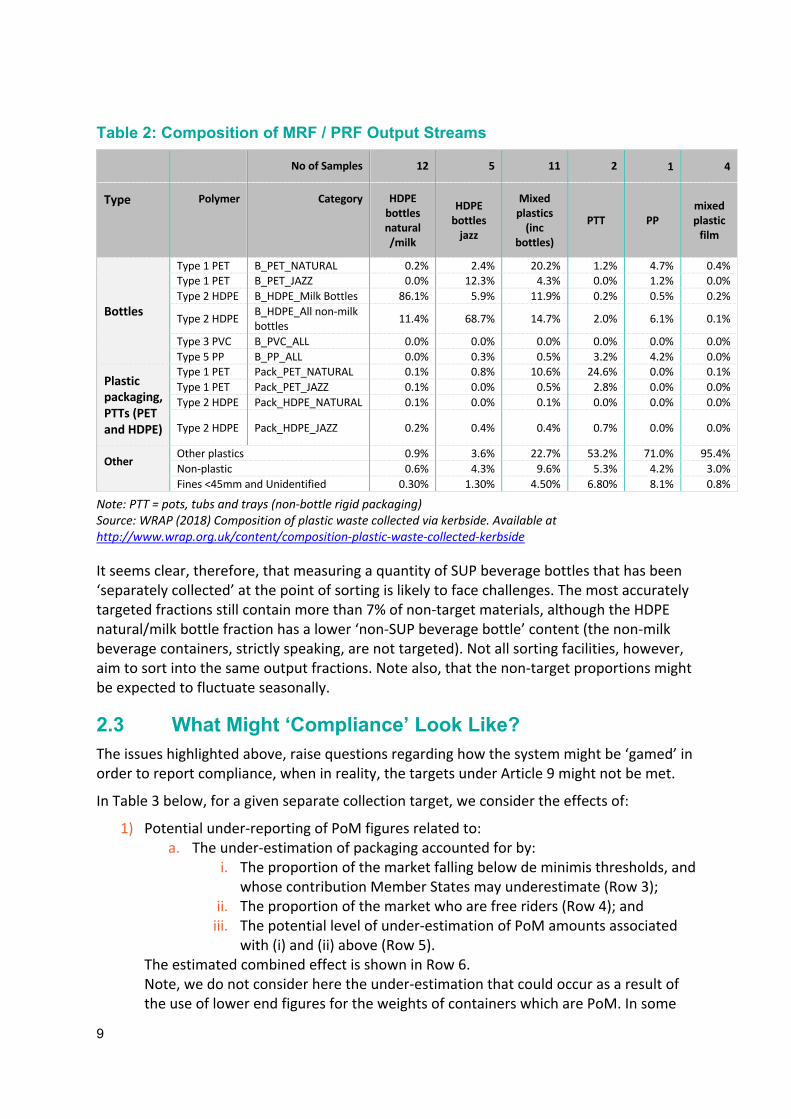
Table 2: Composition of MRF / PRF Output Streams
No of Samples 12 5 11 2 1 4
Type Polymer Category HDPE bottles natural /milk
HDPE bottles
jazz
Mixed plastics
(inc bottles)
PTT PP mixed plastic
film
Bottles
Type 1 PET B_PET_NATURAL 0.2% 2.4% 20.2% 1.2% 4.7% 0.4% Type 1 PET B_PET_JAZZ 0.0% 12.3% 4.3% 0.0% 1.2% 0.0% Type 2 HDPE B_HDPE_Milk Bottles 86.1% 5.9% 11.9% 0.2% 0.5% 0.2%
Type 2 HDPE B_HDPE_All non-milk bottles 11.4% 68.7% 14.7% 2.0% 6.1% 0.1%
Type 3 PVC B_PVC_ALL 0.0% 0.0% 0.0% 0.0% 0.0% 0.0% Type 5 PP B_PP_ALL 0.0% 0.3% 0.5% 3.2% 4.2% 0.0%
Plastic packaging, PTTs (PET and HDPE)
Type 1 PET Pack_PET_NATURAL 0.1% 0.8% 10.6% 24.6% 0.0% 0.1% Type 1 PET Pack_PET_JAZZ 0.1% 0.0% 0.5% 2.8% 0.0% 0.0% Type 2 HDPE Pack_HDPE_NATURAL 0.1% 0.0% 0.1% 0.0% 0.0% 0.0%
Type 2 HDPE Pack_HDPE_JAZZ 0.2% 0.4% 0.4% 0.7% 0.0% 0.0%
Other Other plastics 0.9% 3.6% 22.7% 53.2% 71.0% 95.4% Non-plastic 0.6% 4.3% 9.6% 5.3% 4.2% 3.0% Fines <45mm and Unidentified 0.30% 1.30% 4.50% 6.80% 8.1% 0.8%
Note: PTT = pots, tubs and trays (non-bottle rigid packaging) Source: WRAP (2018) Composition of plastic waste collected via kerbside. Available at http://www.wrap.org.uk/content/composition-plastic-waste-collected-kerbside
It seems clear, therefore, that measuring a quantity of SUP beverage bottles that has been ‘separately collected’ at the point of sorting is likely to face challenges. The most accurately targeted fractions still contain more than 7% of non-target materials, although the HDPE natural/milk bottle fraction has a lower ‘non-SUP beverage bottle’ content (the non-milk beverage containers, strictly speaking, are not targeted). Not all sorting facilities, however, aim to sort into the same output fractions. Note also, that the non-target proportions might be expected to fluctuate seasonally.
2.3 What Might ‘Compliance’ Look Like? The issues highlighted above, raise questions regarding how the system might be ‘gamed’ in order to report compliance, when in reality, the targets under Article 9 might not be met.
In Table 3 below, for a given separate collection target, we consider the effects of:
1) Potential under-reporting of PoM figures related to: a. The under-estimation of packaging accounted for by:
i. The proportion of the market falling below de minimis thresholds, and whose contribution Member States may underestimate (Row 3);
ii. The proportion of the market who are free riders (Row 4); and iii. The potential level of under-estimation of PoM amounts associated
with (i) and (ii) above (Row 5). The estimated combined effect is shown in Row 6. Note, we do not consider here the under-estimation that could occur as a result of the use of lower end figures for the weights of containers which are PoM. In some

situations, it has been shown that where audits are introduced in situations where they have not occurred previously, the quantities reported as PoM can be corrected upwards by a significant margin;7
2) Potential overestimation of collection rates (relative to PoM weights) related to the fact that bottles as collected in waste weigh more than when they are weighed as PoM. As above, we estimate this to be a margin of 25% (so a factor of 1.25) (Row 7)
We report, for a given target level of separate collection:
• the separate collection rate actually being achieved under the scenario (Row 8); and • the recycling rate which may be achieved, taking into account additional losses of
the targeted material that may occur in the processes which take place between the collection of the bottles and their being utilised in a recycling operation (Row 9). For this calculation, we assume that the loss of mass of SUP beverage bottles between the point of collection and the point of recycling is an additional 5% over and above the factor reported in Row 6 – see Section 2.2.1).
The figures are shown for both the 77% target and for the 90% target – we have presented two scenarios, representing what might be considered, erroneously perhaps, as ‘less’ and ‘more’ accurate data reporting situations.
Table 3: Collection and Recycling Rates Achieved Under Different Assumptions
Row
2025
Target, Less
Accurate
2025 Target,
More Accurate
2029 Target,
Less Accurate
2029 Target,
More Accurate
2 Target level separate collection rate 77% 77% 90% 90% 3 Proportion under de minimis threshold 30% 10% 30% 10% 4 Proportion free-riding 30% 10% 30% 10% 5 Under-statement of de minimis/free riders 20% 10% 20% 10% 6 Reported PoM as % Actual 88% 98% 88% 98% 7 Weight of bottle as collected relative to PoM 130% 120% 130% 120% 8 Real Collection Rate When Target Reported as Met 52% 63% 61% 74% 9 Effective Recycling Rate 50% 60% 59% 71%
As shown above, it may be possible – if undue care is taken to specify the measurement method for the collection rate target – for Member States to achieve the 77% and 90% targets with collection rates far below those which the Directive intended should be achieved. For instance:
• the 77% collection rate target might be reported as ‘achieved’ when the Real collection rate is much less, the figures above indicating a range of 52%-63%.
7 For example, the Estonian authorities saw a 20% increase in PoM figures when new inspections were introduced – this was after half the market had been targeted for inspections.

11
• Similarly, the 90% collection rate target might only deliver a Real collection rate of 61% to 74%.
The recycling rates are somewhat lower still, being in the range 50-60% in the case of the 77% collection rate target, and 59%-71% in the case of the 90% collection rate target. The way in which this outcome is arrived at is shown graphically in Figure 3.
This does not reflect the spirit of the Directive. Single-use plastic beverage bottles are one of the most common items found littered on beaches in the EU. As stated in the Directive, this is a result, partly, of ineffective separate collection systems and low participation by consumers. Indeed, the Directive aims to promote more effective separate collection systems which will impact collection rate, the quality of the collected material and the quality of the recyclates, offering opportunities for the recycling market.
Moreover, the aim of this Directive is to protect the environment and human health, requiring MS to ensure environmentally sound waste management to prevent and reduce marine litter from both sea and land sources. The Directive also works in conjunction with the EU Strategy for Plastics in a Circular Economy to close material loops and reduce leakage of plastic waste to the environment.
Ultimately, the current wording could allow actions and outcomes which are inconsistent with the objectives of the Directive: the aim should be to achieve the relevant collection rate targets, helping to address the issue of litter, and achieve the desired behaviour change. What is more, under EPR requirements, producers will be obliged to cover the costs of litter clean up regardless.
Our concern is that some of the mistakes of the past, in respect of the performance measurement of recycling systems, could be repeated if undue care is paid to the means of reporting conformity with the requirements of Article 9 of the SUP Directive. The reporting issues have recently been the subject of revisions to the WFD and PPWD, and associated Implementing Decisions, which have sought to address the inaccuracies in past reporting methods. It is important that we do not recreate the mistakes of the past.

Figure 3: How a 90% Collection Rate Target may be Reported as ‘Met’ Whilst Achieving a Real Collection Rate of 61%
Target: 90%
PoM = 79%

13
3.0 Proposed Approaches to Square the Circle
It should be noted that the Directive indicates two likely approaches to delivering the targets: deposit refund systems (DRS) or separate collection targets for relevant EPR schemes. It seems reasonable to suggest that the aim of the SUP Directive was to ensure that schemes implemented in all Member States attained collection rates similar to those achieved under well-designed DRS. In this respect, recent work for Plastics Recyclers Europe, PETCORE and EFBW highlights the range in performance apparently being achieved by different recycling systems in different Member States, as regards PET bottles. This is shown in Figure 4.
Figure 4: Collection Scheme Performance Range, PET Bottles, 2018
Source: Eunomia (2020) PET Markets in Europe: State of Play, Production and Recycling Data, Report for Plastics Recyclers Europe, PETCORE and EFBW, February 2020.
We know that most DRS will, generally, be able to report on the number of containers returned which are included within their scheme. These figures are in line with what the Directive requires, if not in the second target (90%), then certainly in the first (77%) (see Figure 4 above). Furthermore, there is no ‘adjustment’ required in terms of loss of non-target material since the collection rate is generally considered in terms of the proportion of containers collected by number, not by weight.
Hence, a 90% collection rate, measured in terms of items under a DRS, is likely to lead to a recycling rate of containers of the order 85%, and possibly higher. Although there may still
be losses of weight in respect of labels and glues, empirical evidence suggests that the loss of containers themselves is small.
It is worth noting that the term ‘beverage’ is not defined in the SUP Directive but is used in Recital 12 which states:
Examples of beverage containers to be considered as single-use plastic products are beverage bottles or composite beverage packaging used for beer, wine, water, liquid refreshments, juices and nectars, instant beverages or milk, but not cups for beverages as these are a separate category of single-use plastic products for the purposes of this Directive.
This listing of beverage types includes some beverages for which the containers are not always included in DRS schemes. It follows, therefore, that even in countries with DRS schemes in place, a full reporting of the performance data is likely to require some reference to the SUP beverage containers not included in the DRS, such as milk, which is often (though not always) excluded. That having been said, especially for those beverages more likely to be consumed ‘on-the-go’, there may be merit in considering their inclusion in the DRS. Where this is deemed difficult or undesirable, then the requirement to capture data on how many containers outside the scope of the DRS (as well as those for which the deposit has not been redeemed) are collected will depend on a range of factors. Important among these will be:
1) The level of the target; 2) The performance of the DRS; and 3) The share of the SUP beverage container market covered by the DRS.
If the DRS performance is high enough, and of broad enough scope (so that out of scope materials are a small share of total SUP beverage containers), then the separate collection rate target may be exceeded even without demonstrating any additional collection of the non-DRS (or unredeemed) containers.
Essentially, what this makes clear is that identifying, and correctly weighing, on a like-for-like basis, the weight of SUP beverage bottles collected, relative to the weight of PoM SUP beverage bottles, will require a range of steps to be taken in those cases where the bottles are collected along with other plastics and/or materials. These concerns are highlighted in the figure below, which indicates what would be required for an accurate measurement of the proportion of SUP beverage bottles which are separately collected.

15
Figure 5: Issues Regarding Reporting on Collection Rate for SUP Beverage Bottles

More generally, and in order to ensure the intention of the Directive is fulfilled, we propose the following approaches based on the current Directive wording:
1) It would be preferable to set the rate in terms of the proportion (implicitly by number) of all containers that are separately collected, or to set a target recycling rate, the measurement of this then being aligned with the measurement methodologies presented in recently published Implementing Act 2019/665. What is more, in order to align with other recent guidance, including the Commission’s draft new guidance for EPR schemes, it will be preferable for Member States to report data at a higher level of granularity than is currently the case. Reporting by container and polymer type for instance, while not currently mandatory, will be desirable, and might become a requirement in future.
2) PoM figures would be based on both weight and number of SUP beverage bottles. This would then allow for an average weight per container. Note that the PoM data should, as far as possible, be an accurate representation of the reality, not least through ensuring cross-checks are undertaken to verify the accuracy of data, and auditing of those reporting data is random and regular;
3) The target ‘weight to be collected’ would equate to the relevant percentage target (77% or 90%) multiplied by the total number of containers on the market multiplied by the average weight per container;
4) The weight of bottles collected would then be calculated using one of Method 1 or Method 2 in Figure 5 above:
a. Sampling of the composition of SUP beverage bottles in the separately collected stream would be required, and this would need to be sufficiently frequent to reflect seasonal variation;
b. The average weight of beverage containers of a given size would need to be sampled periodically;
c. Preferably according to size class and beverage, but failing that, at least by size class, ratios would be derived for the weight of SUP beverage bottles as placed on the market divided by the weight of SUP beverage bottles in collected waste;
d. The weight of collected bottles would be multiplied by the weighted average (from PoM numbers) of these ratios to give the separately collected quantity of SUP beverage bottles.
5) The target would be met where this figure exceeded that calculated in point 3 above.
This would effectively take into account all containers collected, but would not credit the excess weight related to non-target materials included in the beverage bottle stream when collected as part of the waste stream.
This approach is closest to the intention of the Directive. It also yields a performance similar to what would be achieved under a well-functioning DRS and ensures equality of treatment across DRS and EPR approaches. Finally, it is consistent with other initiatives undertaken by the Commission to ensure that the performance of waste and recycling systems are measured in an appropriate way, and in such a manner that all Member States are reporting on an equivalent basis.