
Getting Started with SAP Predictive Maintenance and ... · PDF fileGetting Started with SAP...
22
Getting Started PUBLIC SAP Predictive Maintenance and Service, on-premise edition 1.0 FP02 Document Version: 1.04 – 2017-02-22 Getting Started with SAP Predictive Maintenance and Service, on-premise edition 1.0 FP02
Transcript of Getting Started with SAP Predictive Maintenance and ... · PDF fileGetting Started with SAP...

Getting Started PUBLIC
SAP Predictive Maintenance and Service, on-premise edition 1.0 FP02Document Version: 1.04 – 2017-02-22
Getting Started with SAP Predictive Maintenance and Service, on-premise edition 1.0 FP02
Content
1 Document History. . . . . . . . . . . . . . . . . . . . . . . . . . . . . . . . . . . . . . . . . . . . . . . . . . . . . . . . . . . . . . 3
2 SAP Predictive Maintenance and Service, on-premise edition 1.0. . . . . . . . . . . . . . . . . . . . . . . . . . 4
3 Asset Health Control Center and Asset Health Fact Sheet. . . . . . . . . . . . . . . . . . . . . . . . . . . . . . . 6
4 Insight Providers. . . . . . . . . . . . . . . . . . . . . . . . . . . . . . . . . . . . . . . . . . . . . . . . . . . . . . . . . . . . . . . 7
5 Insight Provider Catalog. . . . . . . . . . . . . . . . . . . . . . . . . . . . . . . . . . . . . . . . . . . . . . . . . . . . . . . . . 8
6 Administration Launchpad. . . . . . . . . . . . . . . . . . . . . . . . . . . . . . . . . . . . . . . . . . . . . . . . . . . . . . . 9
7 Data Science Services. . . . . . . . . . . . . . . . . . . . . . . . . . . . . . . . . . . . . . . . . . . . . . . . . . . . . . . . . . 117.1 Anomaly Detection with Principal Component Analysis. . . . . . . . . . . . . . . . . . . . . . . . . . . . . . . . . . . . 127.2 Distance-Based Failure Analysis Using Earth Mover’s Distance. . . . . . . . . . . . . . . . . . . . . . . . . . . . . . 157.3 Remaining Useful Life Prediction Using Weibull. . . . . . . . . . . . . . . . . . . . . . . . . . . . . . . . . . . . . . . . . .16
8 Troubleshooting. . . . . . . . . . . . . . . . . . . . . . . . . . . . . . . . . . . . . . . . . . . . . . . . . . . . . . . . . . . . . . 19
2 P U B L I CGetting Started with SAP Predictive Maintenance and Service, on-premise edition 1.0 FP02
Content
1 Document History
CautionBefore you read this document, make sure you have the latest version of this document. You can find the latest version at the following location: https://uacp2.hana.ondemand.com/doc/49b4e78057764bfa9d5f9ef7a1c07591/1.0%20FP02/en-US/Getting_Started_with_SAP_Predictive_Maintenance_and_Service_on_premise_edition_1.0_FP02.pdf
TipYou might need to refresh your browser to see the latest version of this document.
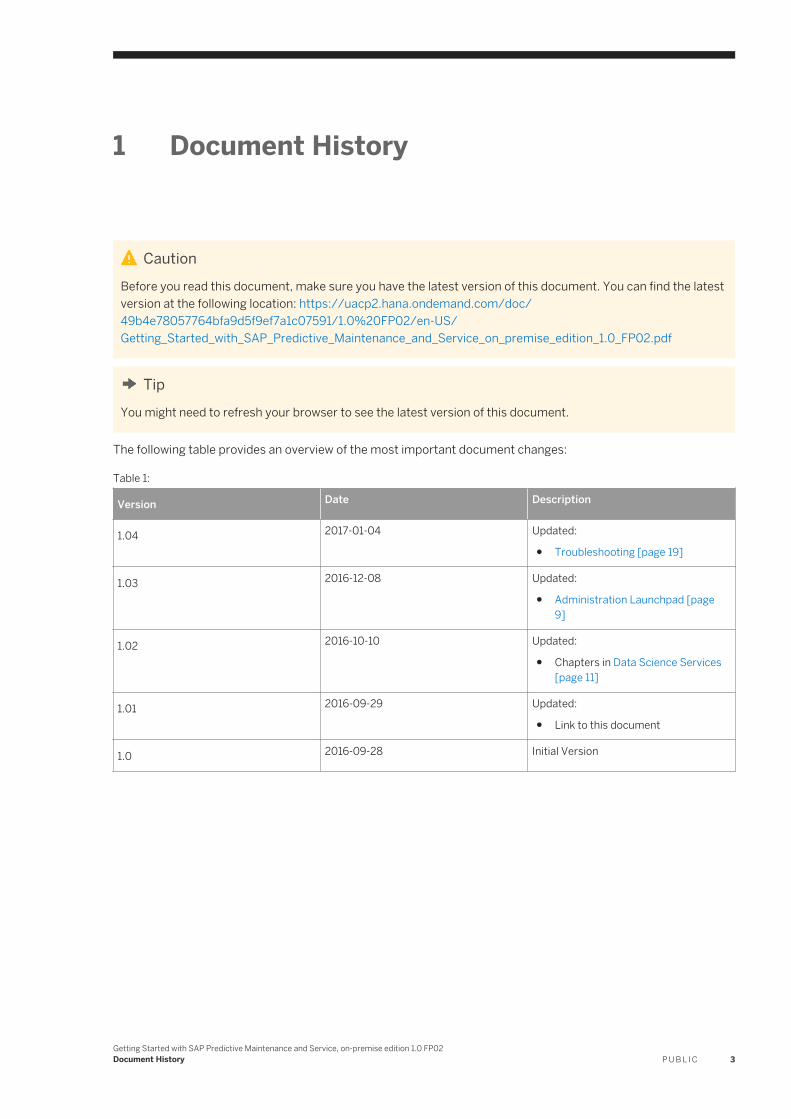
The following table provides an overview of the most important document changes:
Table 1:
Version Date Description
1.04 2017-01-04 Updated:
● Troubleshooting [page 19]
1.03 2016-12-08 Updated:
● Administration Launchpad [page 9]
1.02 2016-10-10 Updated:
● Chapters in Data Science Services [page 11]
1.01 2016-09-29 Updated:
● Link to this document
1.0 2016-09-28 Initial Version
Getting Started with SAP Predictive Maintenance and Service, on-premise edition 1.0 FP02Document History P U B L I C 3
2 SAP Predictive Maintenance and Service, on-premise edition 1.0
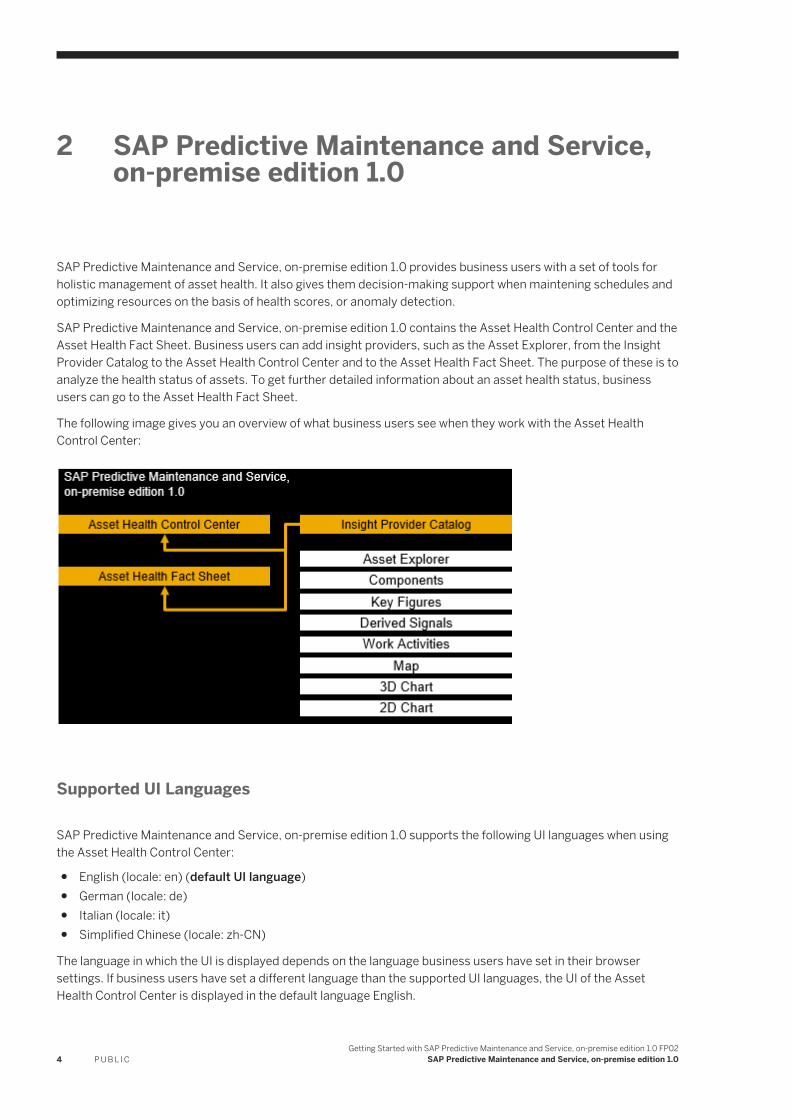
SAP Predictive Maintenance and Service, on-premise edition 1.0 provides business users with a set of tools for holistic management of asset health. It also gives them decision-making support when maintening schedules and optimizing resources on the basis of health scores, or anomaly detection.
SAP Predictive Maintenance and Service, on-premise edition 1.0 contains the Asset Health Control Center and the Asset Health Fact Sheet. Business users can add insight providers, such as the Asset Explorer, from the Insight Provider Catalog to the Asset Health Control Center and to the Asset Health Fact Sheet. The purpose of these is to analyze the health status of assets. To get further detailed information about an asset health status, business users can go to the Asset Health Fact Sheet.
The following image gives you an overview of what business users see when they work with the Asset Health Control Center:
Supported UI Languages
SAP Predictive Maintenance and Service, on-premise edition 1.0 supports the following UI languages when using the Asset Health Control Center:
● English (locale: en) (default UI language)● German (locale: de)● Italian (locale: it)● Simplified Chinese (locale: zh-CN)
The language in which the UI is displayed depends on the language business users have set in their browser settings. If business users have set a different language than the supported UI languages, the UI of the Asset Health Control Center is displayed in the default language English.
4 P U B L I CGetting Started with SAP Predictive Maintenance and Service, on-premise edition 1.0 FP02
SAP Predictive Maintenance and Service, on-premise edition 1.0

NoteUIs that can be used to configure insight providers, key figures, and data science services, and to load data are available in English only.
Getting Started with SAP Predictive Maintenance and Service, on-premise edition 1.0 FP02SAP Predictive Maintenance and Service, on-premise edition 1.0 P U B L I C 5

3 Asset Health Control Center and Asset Health Fact Sheet
The Asset Health Control Center supports you with monitoring the health status of assets while they are in operation.
Asset Health Control Center
The Asset Health Control Center is part of the SAP Predictive Maintenance and Service, on-premise edition. It is used for the holistic management of asset health and provides decision support for maintenance schedules and the optimization of resources based on health scores, anomaly detection, and machine learning.
To analyze the health status of assets, operations planners and technicians use insight providers that help them gain more knowledge about their assets.
The following screenshot is an example of what the Asset Health Control Center can look like having the Asset Explorer opened by default:
Asset Health Fact Sheet
The Asset Health Fact Sheet is part of the Asset Health Control Center and provides operations planners and technicians with details of a specific asset and its components, and the possibility to create work activities for the maintenance of assets.
The following screenshot is an example of what the Asset Health Fact Sheet can look like having the Asset Explorer opened by default:
Insight Providers
Users start working with the Asset Health Control Center by adding insight providers from the Insight Provider Catalog.
For more information about insight providers, see Insight Providers [page 7].
For more information about the Insight Provider Catalog, see Insight Provider Catalog [page 8].
6 P U B L I CGetting Started with SAP Predictive Maintenance and Service, on-premise edition 1.0 FP02
Asset Health Control Center and Asset Health Fact Sheet
4 Insight Providers
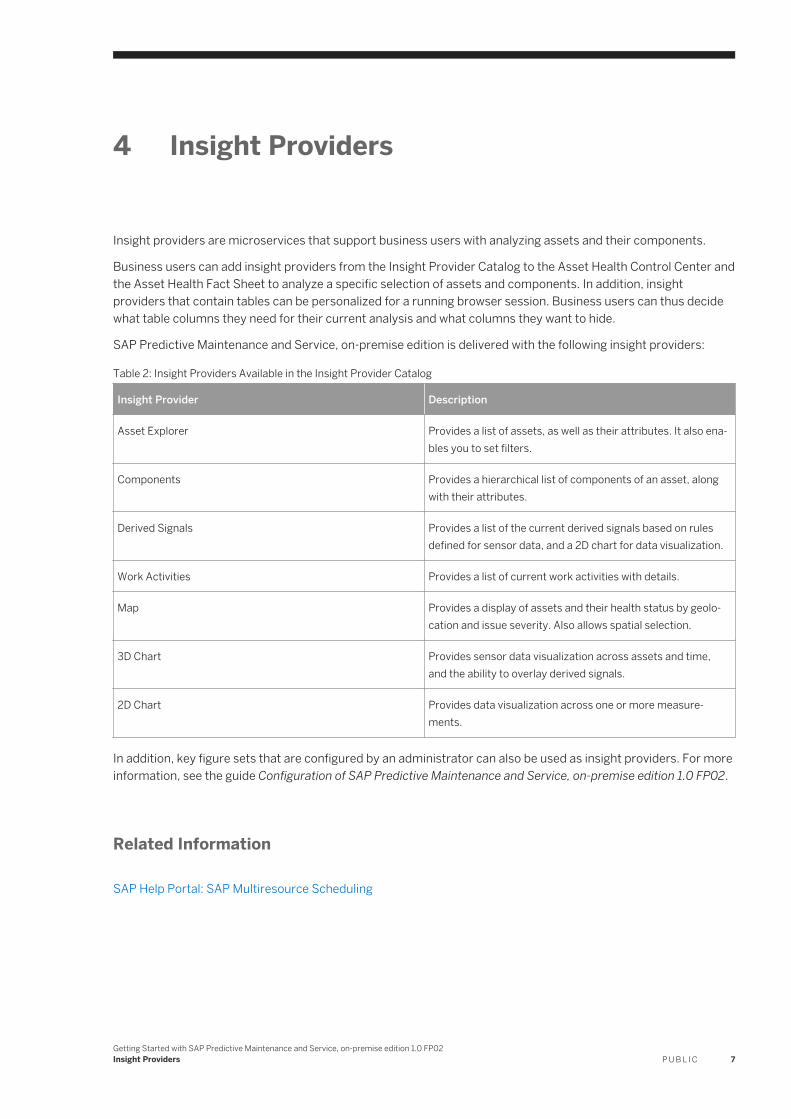
Insight providers are microservices that support business users with analyzing assets and their components.
Business users can add insight providers from the Insight Provider Catalog to the Asset Health Control Center and the Asset Health Fact Sheet to analyze a specific selection of assets and components. In addition, insight providers that contain tables can be personalized for a running browser session. Business users can thus decide what table columns they need for their current analysis and what columns they want to hide.
SAP Predictive Maintenance and Service, on-premise edition is delivered with the following insight providers:
Table 2: Insight Providers Available in the Insight Provider Catalog
Insight Provider Description
Asset Explorer Provides a list of assets, as well as their attributes. It also enables you to set filters.
Components Provides a hierarchical list of components of an asset, along with their attributes.
Derived Signals Provides a list of the current derived signals based on rules defined for sensor data, and a 2D chart for data visualization.
Work Activities Provides a list of current work activities with details.
Map Provides a display of assets and their health status by geolocation and issue severity. Also allows spatial selection.
3D Chart Provides sensor data visualization across assets and time, and the ability to overlay derived signals.
2D Chart Provides data visualization across one or more measurements.
In addition, key figure sets that are configured by an administrator can also be used as insight providers. For more information, see the guide Configuration of SAP Predictive Maintenance and Service, on-premise edition 1.0 FP02.
Related Information
SAP Help Portal: SAP Multiresource Scheduling
Getting Started with SAP Predictive Maintenance and Service, on-premise edition 1.0 FP02Insight Providers P U B L I C 7
5 Insight Provider Catalog
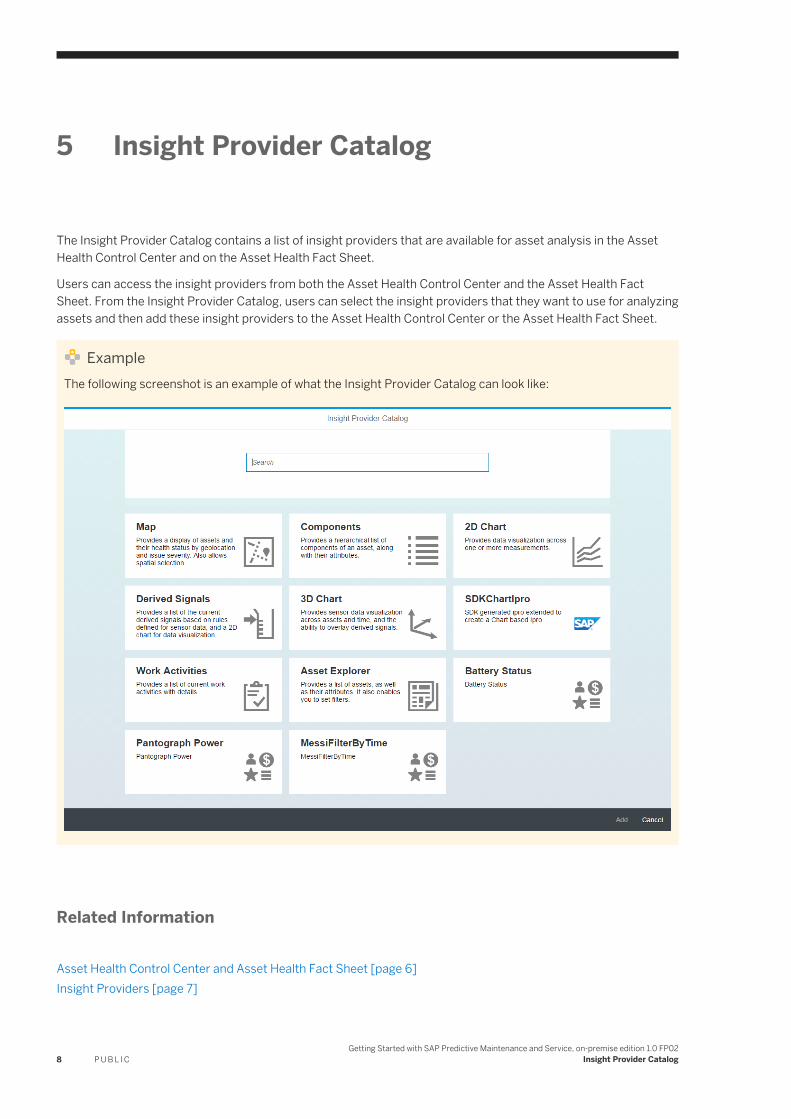
The Insight Provider Catalog contains a list of insight providers that are available for asset analysis in the Asset Health Control Center and on the Asset Health Fact Sheet.
Users can access the insight providers from both the Asset Health Control Center and the Asset Health Fact Sheet. From the Insight Provider Catalog, users can select the insight providers that they want to use for analyzing assets and then add these insight providers to the Asset Health Control Center or the Asset Health Fact Sheet.
ExampleThe following screenshot is an example of what the Insight Provider Catalog can look like:
Related Information
Asset Health Control Center and Asset Health Fact Sheet [page 6]Insight Providers [page 7]
8 P U B L I CGetting Started with SAP Predictive Maintenance and Service, on-premise edition 1.0 FP02
Insight Provider Catalog
6 Administration Launchpad
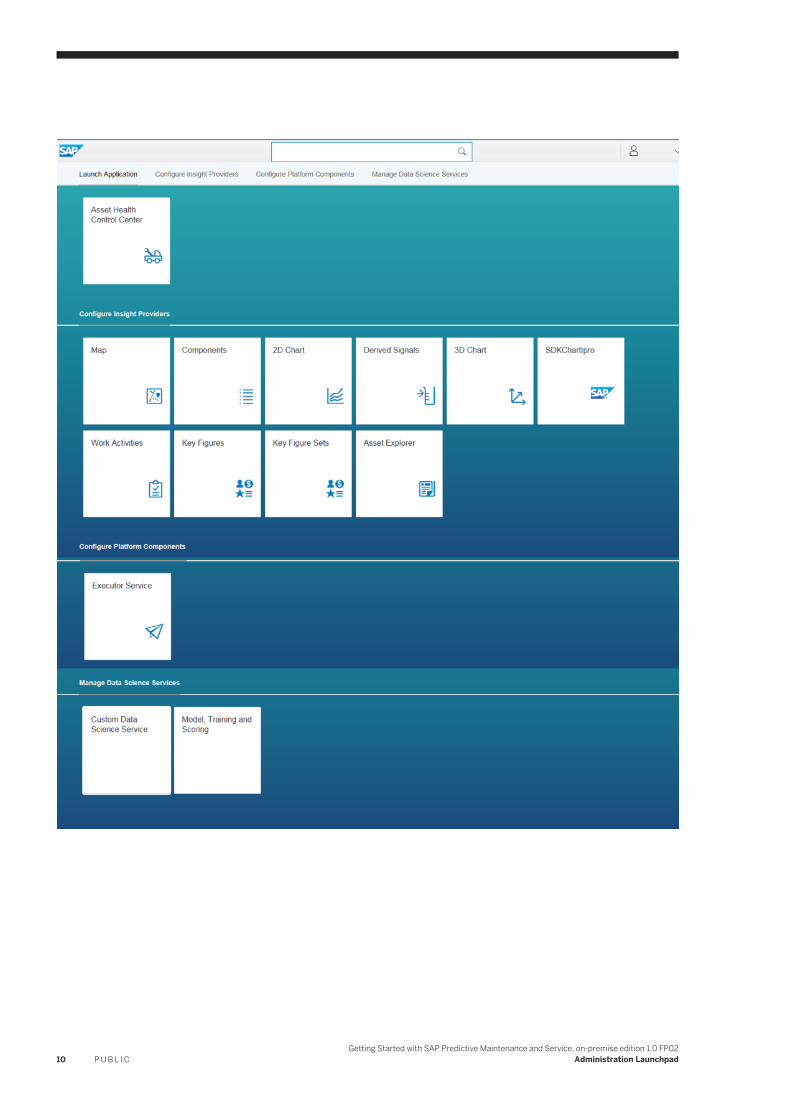
The administration launchpad is a common entry point for:
● Administrators to configure insight providers, and key figures, and upload data.● Data scientists and developers to create, train, and score models and to extend predelivered data science
services.● Business users to access the Asset Health Control Center.
Depending on the role collections that are assigned to a user, different apps available on the administration launchpad are displayed to that user.
ExampleThe following screenshot is an example of the administration launchpad when the following role collections are assigned to a user:
● <pdms-tech>● <pdms-datascience-role>
For more information about role collections, see the chapters Maintaining Roles and Users in SAP HANA and Role Templates for SAP Predictive Maintenance and Service, on-premise edition in the guide Installation of SAP Predictive Maintenance and Service, on-premise edition 1.0 FP02.
NoteThe background color of the UI in the screenshot my vary from the background color of your UI that you use.
Getting Started with SAP Predictive Maintenance and Service, on-premise edition 1.0 FP02Administration Launchpad P U B L I C 9
10 P U B L I CGetting Started with SAP Predictive Maintenance and Service, on-premise edition 1.0 FP02
Administration Launchpad
7 Data Science Services
Anomaly Detection with Principal Component Analysis
Use CaseBefore you get to know the details of anomaly detection with principal component analysis (PCA), you should first know when to use this algorithm. A typical use case would be the following:
ExampleA railway operator uses sensors in locomotives. Four motors each have four temperature sensors. If the motors work fine, all 16 sensors send data about a synchronous increase or decrease of temperature. PCA notes when this behavior changes. You would use this algorithm to monitor this behavior and to notice if sensors send temperature data that differ from other sensors, which might indicate that a motor might be damaged and needs to be maintained.
For more information, see Anomaly Detection with Principal Component Analysis [page 12].
Distance-Based Failure Analysis Using Earth Mover’s Distance
Use CaseBefore you get to know the details of distance-based failure analysis using earth mover’s distance (EMD) as known in computer science, or the Wasserstein metric as known in mathematics, you should first know when to use this algorithm. A typical use case would be the following:
ExampleAn airplane, for example, contains electric devices that have batteries inside. These electric devices are equipped with at least two sensors that send data. Sensor A sends data about measurements of electric current, sensor B sends data about voltage measurements. An eletric device could also have a sensor C that sends data about temperature measurements. The data that the three sensors send not only depend on the eletric device itself, but also on other factors that the electric device and thus the incorporated battery are confronted with. These factors could be weather conditions in several kilometers hight, how often is the device used in the cockpit, under which conditions does the pilote use the device and so on. It is therefore normal that data being sent from the three sensors might vary around a certain mean score. The data from each sensor can be visualized in a one-dimensional histogram. For multi-dimensional visualizations, scatterplots are used. Such a visualization is like a fingerprint of each battery in the airplane. To compare the sensor data of different batteries without looking at and comparing each visualization, a distance measure for probability distributions is needed. One of these measures is the Wasserstein metric or EMD. It can be used to measure deviation from a known good reference fingerprint of a battery, or to measure differences between several batteries of the same type, for example.
For more information, see Distance-Based Failure Analysis Using Earth Mover’s Distance [page 15].
Getting Started with SAP Predictive Maintenance and Service, on-premise edition 1.0 FP02Data Science Services P U B L I C 11
Remaining Useful Life Prediction Using Weibull
Use Case
The Weibull algorithm can be used to calculate the expected remaining useful life (RUL) of an asset, and to calculate the probability of failure of an asset.
NoteThe Weibull algorithm is commonly used in survival analysis.
A typical use case would be the following:
ExampleAt a car rental service, cars contain air condition units. These air condition units have a certain age, either the current age while they are still working, or the age when they failed and needed to be replaced. The owner of the car rental service wants to know how much time is left until running air conditioning units will fail, or when parts of air conditioning units need to be repaired or replaced with the next maintenance appointment. In addition, the owner might plan budget and time needed for spare parts and maintenance activities, and might also want to check if the vendors of the air conditioning units stick to their technical specifications.
For more information, see Remaining Useful Life Prediction Using Weibull [page 16].
7.1 Anomaly Detection with Principal Component Analysis
The principal component analysis (PCA) can be used to detect anomalies in mulitvariate sensor data.
What Does the Algorithm do?
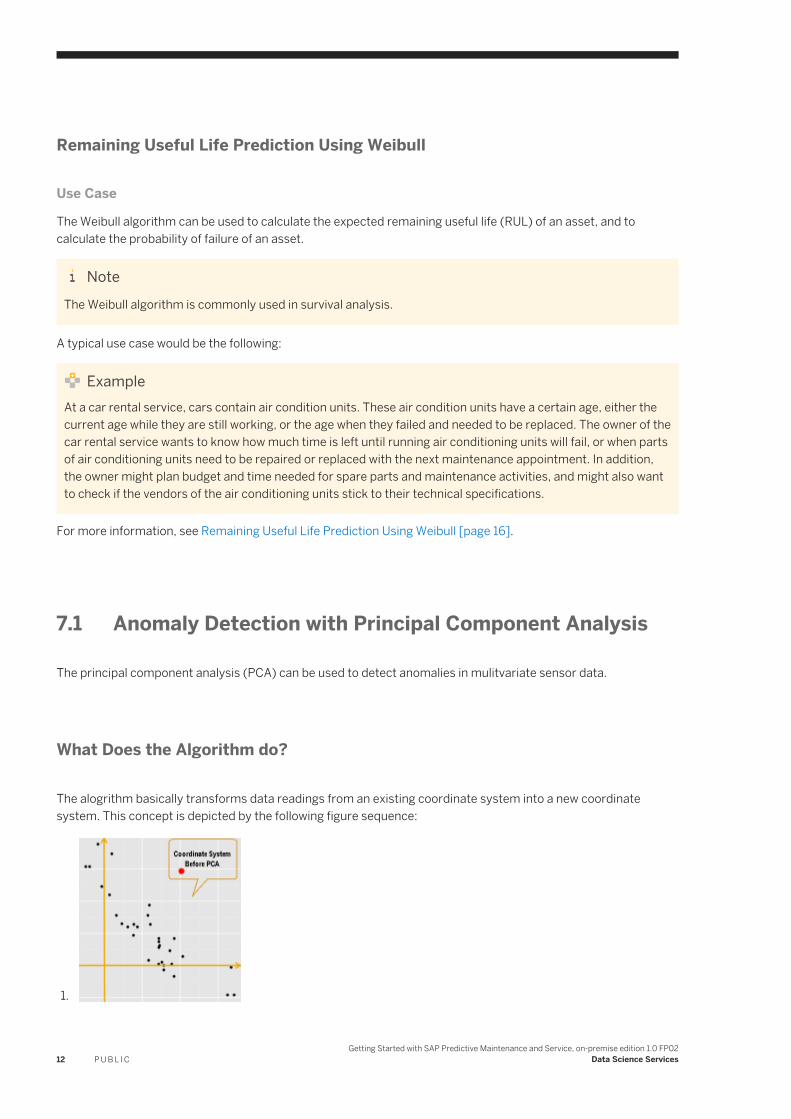
The alogrithm basically transforms data readings from an existing coordinate system into a new coordinate system. This concept is depicted by the following figure sequence:
1.
12 P U B L I CGetting Started with SAP Predictive Maintenance and Service, on-premise edition 1.0 FP02
Data Science Services
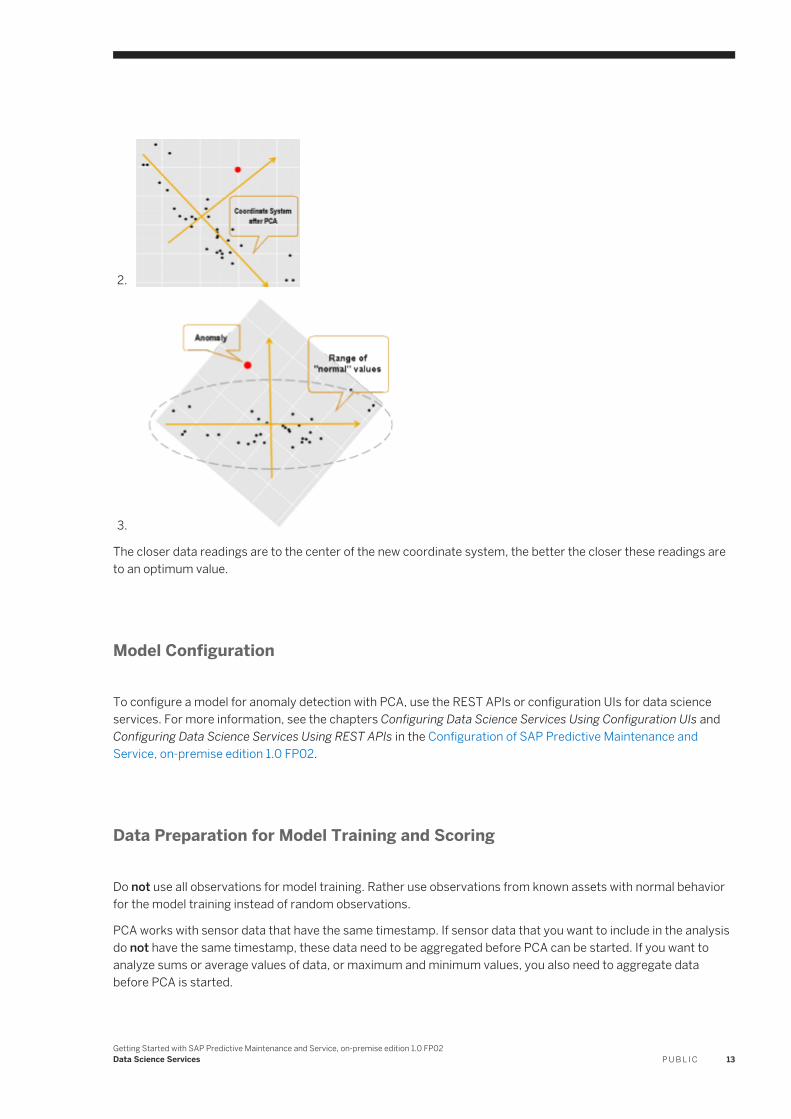
2.
3.
The closer data readings are to the center of the new coordinate system, the better the closer these readings are to an optimum value.
Model Configuration
To configure a model for anomaly detection with PCA, use the REST APIs or configuration UIs for data science services. For more information, see the chapters Configuring Data Science Services Using Configuration UIs and Configuring Data Science Services Using REST APIs in the Configuration of SAP Predictive Maintenance and Service, on-premise edition 1.0 FP02.
Data Preparation for Model Training and Scoring
Do not use all observations for model training. Rather use observations from known assets with normal behavior for the model training instead of random observations.
PCA works with sensor data that have the same timestamp. If sensor data that you want to include in the analysis do not have the same timestamp, these data need to be aggregated before PCA can be started. If you want to analyze sums or average values of data, or maximum and minimum values, you also need to aggregate data before PCA is started.
Getting Started with SAP Predictive Maintenance and Service, on-premise edition 1.0 FP02Data Science Services P U B L I C 13
Model Training
Model training for PCA mainly means to calculate the eigenvectors and eigenvalues of the covariance matrix of the training data.
NoteThe model size only depends on the number of dimensions, that is the sensors, that go into the model, but not on the number of the training examples.
Depending on the individual use case, PCA can be applied to any kind of reading, be it, for example, one-second-interval-readings of sensors or aggregated sensor readings.
To train a model for anomaly detection with PCA, use the REST APIs or configuration UIs for data science services. For more information, see the chapters Configuring Data Science Services Using Configuration UIs and Configuring Data Science Services Using REST APIs in the Configuration of SAP Predictive Maintenance and Service, on-premise edition 1.0 FP02.
Model Scoring
Anomaly Score
The anomaly score is calculated using the Mahalanobis distance between a sensor reading and the mean of all readings, which is the center of the transformed coordinate system.
Smoothing
In some case, anomaly scores can be high but for only a few seconds. This phenomenon usually is not critical, but represents a rather normal behavior if a machine is started, for example. Smoothing algorithms added to the anomaly score prevent anomaly alerts caused by sporadic anomalies. The smoothing of algorithms is done using the running median.
To score a model for anomaly detection with PCA, use the REST APIs or configuration UIs for data science services. For more information, see the chapters Configuring Data Science Services Using Configuration UIs and Configuring Data Science Services Using REST APIs in the Configuration of SAP Predictive Maintenance and Service, on-premise edition 1.0 FP02.
Related Information
Data Science Services [page 11]
14 P U B L I CGetting Started with SAP Predictive Maintenance and Service, on-premise edition 1.0 FP02
Data Science Services
7.2 Distance-Based Failure Analysis Using Earth Mover’s Distance
What Does the Algorithm do?
To explain what the algorithm does, a figurative example can be used: The algorithm solves a linear optimization problem, concretely a transportation problem. Suppose you want to transform a sand castle A into a sand castle B. Both sand castles consist of the same amount of sand. EMD measures how much sand you have to transport across which distance. The algorithm compares if both sand castle are located close to each other, or if the sand has to be transported a long distance from sand castle A to sand castle B. The algorithm also compares how the two sand castles are shaped, for example. If they have a similar shape, no or little rebuilding work needs to be done. If their shapes differ a lot from each other, a lot of effort is required to rebuild sand castle a that it looks like sand castle B. The conclusion is the closer and the more similar the sand castles are, the lower are the work effort and transport costs. According to the example mentioned above, the fingerprint of battery A is compared to the fingerprint of a well working battery B, for example. The lower the score calculated with EMD, the more similar the fingerprints are. Battery A is thus working like battery B. The higher the score, the more different the fingerprints are.
Model Configuration
To configure a model for distance-based failure analysis using earth mover's distance, use the REST APIs or configuration UIs for data science services. For more information, see the chapters Configuring Data Science Services Using Configuration UIs and Configuring Data Science Services Using REST APIs in the Configuration of SAP Predictive Maintenance and Service, on-premise edition 1.0 FP02.
Data Preparation for Model Training and Scoring
Before training and scoring, data scientists need to configure a model. In the configuration, they need to specify the names of one or more columns that contain values according to which data need to be grouped. These gouping columns are used for scoring. You can define as many grouping columns as required for your business case. The grouping columns are included in scoring only. In training, the grouping columns are used to exclude these columns from training.
Data scientists also need to prepare maxmimum four data columns to feed into the training process. These data columns are specified when the the model is being configured.
For training a model, data scientists also need to specify a number of bins, and the expected minimum and maximum values of data columns. The minimum and maximum values are used for binning.
Getting Started with SAP Predictive Maintenance and Service, on-premise edition 1.0 FP02Data Science Services P U B L I C 15

NoteFor defining minimum and maximum values, the following syntax needs to be followed:
Example<DATA_COLUMN_NAME>.min
<DATA_COLUMN_NAME>.max
Model Training
To train a model for distance-based failure analysis using earth mover's distance, use the REST APIs or configuration UIs for data science services. For more information, see the chapters Configuring Data Science Services Using Configuration UIs and Configuring Data Science Services Using REST APIs in the Configuration of SAP Predictive Maintenance and Service, on-premise edition 1.0 FP02.
Model Scoring
To score a model for distance-based failure analysis using earth mover's distance, use the REST APIs or configuration UIs for data science services. For more information, see the chapters Configuring Data Science Services Using Configuration UIs and Configuring Data Science Services Using REST APIs in the Configuration of SAP Predictive Maintenance and Service, on-premise edition 1.0 FP02.
Related Information
Data Science Services [page 11]
7.3 Remaining Useful Life Prediction Using Weibull
What Does the Algorithm do?
The Weibull algorithm calculates the distribution of lifetimes of assets based on age. For this calculation, the algorithm needs to be provided with the ages of assets when they failed, and the ages of assets that still work. The assets and their components need to be of the same type. The result is an estimate of the remaining useful life
16 P U B L I CGetting Started with SAP Predictive Maintenance and Service, on-premise edition 1.0 FP02
Data Science Services
(RUL) of each component at the time of the calculation. The algorithm can also calculate the probability of failure of components within a certain time period.
Model Configuration
To configure a model for a RUL prediction with the Weibull algorithm, use the REST APIs or configuration UIs for data science services. For more information, see the chapters Configuring Data Science Services Using Configuration UIs and Configuring Data Science Services Using REST APIs in the Configuration of SAP Predictive Maintenance and Service, on-premise edition 1.0 FP02.
Data Preparation for Model Training and Scoring
Before training and scoring, data scientists need to configure a model. In the configuration, they need to specify the column that contains the age when an asset failed, or the current age of an asset that is still working.
NoteMake sure that the age statements use the same time unit such as years, hours, or days.
The algorithm also needs the information if an asset is still working or if it is not working anymore. The status value 0 means the asset is still working, the status value 1 means the asset failed and is not working anymore.
If the probablity of failure needs to be calculated for a certain time period, this time period needs to be specified using the same time unit as for the age of assets.
To predict the probability of failure for a certain time period in a week's time, for example, this prediction period needs to be specified as well using the same time unit as for the age of assets.
Model Training
To train a model for RUL using the Weibull algorithm, use the REST APIs or configuration UIs for data science services. For more information, see the chapters Configuring Data Science Services Using Configuration UIs and Configuring Data Science Services Using REST APIs in the Configuration of SAP Predictive Maintenance and Service, on-premise edition 1.0 FP02.
Model Scoring
To score a model for RUL using the Weibull algorithm, use the REST APIs or configuration UIs for data science services. For more information, see the chapters Configuring Data Science Services Using Configuration UIs and Configuring Data Science Services Using REST APIs in the Configuration of SAP Predictive Maintenance and Service, on-premise edition 1.0 FP02.
Getting Started with SAP Predictive Maintenance and Service, on-premise edition 1.0 FP02Data Science Services P U B L I C 17

Related Information
Data Science Services [page 11]
18 P U B L I CGetting Started with SAP Predictive Maintenance and Service, on-premise edition 1.0 FP02
Data Science Services
8 Troubleshooting
If you experience issues installing or using SAP Predictive Maintenance and Service, on-premise edition, please report an incident under component CA-PDM-AHC.
I experience issues when looking at the 3D Chart insight provider in a language different than English.
When you open the Asset Health Control Center in a language other than English, you might experience issues in the 3D chart. The metric IDs that you can select for analysis from the drop-down menu in the 3D chart are not fully available in your browser language.
The metric IDs are a combination of a ThingType, PropertySetType, and a PropertyId. Their descriptions are maintained in the following SAP HANA views:
● com.sap.pdms.sdm::META.ThingTypeDescription● com.sap.pdms.sdm::META.PropertySetTypeDescription● com.sap.pdms.sdm::META.ObjectDescription
The ThingType and the PropertySetType are displayed in their original language. Only the PropertyId description can be translated.
I experience issues when trying to resolve results from data science serivce in insight providers.
If two models that score the same Thing have the same PropertySetTypeId, this results in ambiguous entries in the READINGS table. The reason is that the READINGS table does not work with keys. Insight providers might thus not be able to resolve scores in the Asset Health Control Center.
For more information about the READINGS table, see the chapter Data Model in the guide Installation of SAP Predictive Maintenance and Service, on-premise edition 1.0 FP02.
Please make sure that you either use one property set type ID per model, or you use the same property set type ID for different models only if the models score different Things related to this ID or Things of different Thing types related to this ID.
ExampleThe following sample scenarios illustrate a correct usage of the same property set type ID (PST ID) used for different models:
Things of Different Thing Types
Model A PST ID temperature Thing Type Battery Possibly all Things having the given Thing Type
Getting Started with SAP Predictive Maintenance and Service, on-premise edition 1.0 FP02Troubleshooting P U B L I C 19

Model B PST ID temperature Thing Type AirCondition Possibly all Things having the given Thing Type
Different Things of the Same Thing Type
Model A PST ID temperature Thing Type Battery Things 1-5
Model B PST ID temperature Thing Type Battery Things 6-9
20 P U B L I CGetting Started with SAP Predictive Maintenance and Service, on-premise edition 1.0 FP02
Troubleshooting

Important Disclaimers and Legal Information
Coding SamplesAny software coding and/or code lines / strings ("Code") included in this documentation are only examples and are not intended to be used in a productive system environment. The Code is only intended to better explain and visualize the syntax and phrasing rules of certain coding. SAP does not warrant the correctness and completeness of the Code given herein, and SAP shall not be liable for errors or damages caused by the usage of the Code, unless damages were caused by SAP intentionally or by SAP's gross negligence.
AccessibilityThe information contained in the SAP documentation represents SAP's current view of accessibility criteria as of the date of publication; it is in no way intended to be a binding guideline on how to ensure accessibility of software products. SAP in particular disclaims any liability in relation to this document. This disclaimer, however, does not apply in cases of willful misconduct or gross negligence of SAP. Furthermore, this document does not result in any direct or indirect contractual obligations of SAP.
Gender-Neutral LanguageAs far as possible, SAP documentation is gender neutral. Depending on the context, the reader is addressed directly with "you", or a gender-neutral noun (such as "sales person" or "working days") is used. If when referring to members of both sexes, however, the third-person singular cannot be avoided or a gender-neutral noun does not exist, SAP reserves the right to use the masculine form of the noun and pronoun. This is to ensure that the documentation remains comprehensible.
Internet HyperlinksThe SAP documentation may contain hyperlinks to the Internet. These hyperlinks are intended to serve as a hint about where to find related information. SAP does not warrant the availability and correctness of this related information or the ability of this information to serve a particular purpose. SAP shall not be liable for any damages caused by the use of related information unless damages have been caused by SAP's gross negligence or willful misconduct. All links are categorized for transparency (see: http://help.sap.com/disclaimer).
Getting Started with SAP Predictive Maintenance and Service, on-premise edition 1.0 FP02Important Disclaimers and Legal Information P U B L I C 21

go.sap.com/registration/contact.html
© 2017 SAP SE or an SAP affiliate company. All rights reserved.No part of this publication may be reproduced or transmitted in any form or for any purpose without the express permission of SAP SE or an SAP affiliate company. The information contained herein may be changed without prior notice.Some software products marketed by SAP SE and its distributors contain proprietary software components of other software vendors. National product specifications may vary.These materials are provided by SAP SE or an SAP affiliate company for informational purposes only, without representation or warranty of any kind, and SAP or its affiliated companies shall not be liable for errors or omissions with respect to the materials. The only warranties for SAP or SAP affiliate company products and services are those that are set forth in the express warranty statements accompanying such products and services, if any. Nothing herein should be construed as constituting an additional warranty.SAP and other SAP products and services mentioned herein as well as their respective logos are trademarks or registered trademarks of SAP SE (or an SAP affiliate company) in Germany and other countries. All other product and service names mentioned are the trademarks of their respective companies.Please see http://www.sap.com/corporate-en/legal/copyright/index.epx for additional trademark information and notices.