Gesture Authentication for Smartphones: Evaluation of ...
19
Gesture Authentication for Smartphones: Evaluation of Gesture Password Selection Policies Eunyong Cheon 1 , Yonghwan Shin 1 , Jun Ho Huh 2 , Hyoungshick Kim 3 and Ian Oakley 1 1 Department of Human Factors Engineering, UNIST, Republic of Korea 2 Samsung Research, Seoul, Republic of Korea 3 Department of Software, Sungkyunkwan University, Republic of Korea Email: [email protected], [email protected], [email protected], [email protected], [email protected] Abstract—Touchscreen gestures are attracting research atten- tion as an authentication method. While studies have showcased their usability, it has proven more complex to determine, let alone enhance, their security. Problems stem both from the small scale of current data sets and the fact that gestures are matched imprecisely – by a distance metric. This makes it challenging to assess entropy with traditional algorithms. To address these problems, we captured a large set of gesture passwords (N=2594) from crowd workers, and developed a security assessment frame- work that can calculate partial guessing entropy estimates, and generate dictionaries that crack 23.13% or more gestures in online attacks (within 20 guesses). To improve the entropy of gesture passwords, we designed novel blacklist and lexical policies to, respectively, restrict and inspire gesture creation. We close by validating both our security assessment framework and policies in a new crowd-sourced study (N=4000). Our blacklists increase entropy and resistance to dictionary based guessing attacks. I. I NTRODUCTION Smartphone password schemes like screen lock patterns and PINs suffer from the security issues that emerge from the biased ways in which users choose their passwords: they select easy-to-remember and quick-to-draw lock patterns [1] and PINs [2] that are also easy to guess. Free-form gestures are a potentially fast and secure way of authenticating users to smartphones that may address the problem. Rather than being constrained by a fixed grid or keypad layout and small password space (e.g., 389,112 possible lock patterns), users can freely draw one or more strokes on a touchscreen [3] or bespoke input surface [4]. The resultant stream of co- ordinates can be matched against stored templates, using mature algorithms [5], to grant or restrict access. The use of gestures conveys numerous advantages: the theoretical number of possible gestures is extremely large [3] and; gesture input may require less visual attention than input based on selecting buttons or targets [6] making it particularly suitable for mobile or wearable scenarios where users may be working on small displays [7] or busy and engaged in other dominant tasks [8]. While the potential benefits of gesture passwords are well- established, their applicability for use as a smartphone un- lock scheme and their inherent security and usability remain unclear. One issue is the small size of existing data sets – prior work has collected between 22 [9] and 345 [10] different predefined or user-proposed gestures from 34 to 45 users and the largest analysis to date [11] combines two proprietary data sets, captured in different studies/settings, to yield a corpus of 529 different gestures in total. This contrasts to existing analyses of passwords [12], PINs [13] and pattern locks [14] which based security assessments on data sets of several thousand examples. In light of these precedents, we argue it is necessary to complement existing claims about the high entropy of gesture passwords, based on controlled small scale studies in the lab or field, with the data and analysis from a larger online study of gesture passwords. A related problem is a lack of established metrics for assessing security – unlike the exact comparisons possible with passwords and PINs, gestures are matched via a simi- larity measure (e.g., cosine [15] or Dynamic Time Warping (DTW) [16] distance). There are currently no methods for es- tablishing common security metrics such as guessing entropy for gesture data sets, making it hard to contrast gestures against other authentication methods. Researchers have instead made security assessments based on, for example, calculations of Equal Error Rate (EER) [9], [3] or via resistance to manual [3], [17] or brute-force guessing attacks [11]. Improving the quality and scale of gesture data sets is an integral current requirement for work in this area; doing so will enable development of new forms of security analysis, provide a more comprehensive assessment of the security of the basic technique, and provide raw evidence required to determine the suitability of gesture passwords as a lock scheme for smartphones. This paper addresses these limitations and evaluates the fea- sibility and practicality of using gesture passwords as a main authentication technique on smartphones. In this scenario, we constrain gestures to involve single strokes by single fingers on a small screen region, similar to graphical pattern locks [4]. From this starting point, we describe a multi-stage study. We first capture the largest extant sample of gesture passwords (N=2594) from crowd workers. We analyze this to extract key security metrics, such as an EER for the gesture matching threshold, and as the basis for developing both a dictionary of the 20 most common gestures (Android only allows 20 con- secutive fail attempts), and an automated entropy assessment algorithm. We show the dictionary is effective at cracking the gesture passwords: 54.18% to 58.37% at the EER threshold value and 23.13% to 31.49% with a stricter threshold derived from closely related prior work [10]. This indicates user- chosen gesture passwords, just like other unlock schemes, are insecure against dictionary-based password guessing attacks.
Transcript of Gesture Authentication for Smartphones: Evaluation of ...

Gesture Authentication for Smartphones: Evaluationof Gesture Password Selection Policies
Eunyong Cheon1, Yonghwan Shin1, Jun Ho Huh2, Hyoungshick Kim3 and Ian Oakley11Department of Human Factors Engineering, UNIST, Republic of Korea
2Samsung Research, Seoul, Republic of Korea3Department of Software, Sungkyunkwan University, Republic of Korea
Email: [email protected], [email protected], [email protected], [email protected], [email protected]
Abstract—Touchscreen gestures are attracting research atten-tion as an authentication method. While studies have showcasedtheir usability, it has proven more complex to determine, letalone enhance, their security. Problems stem both from the smallscale of current data sets and the fact that gestures are matchedimprecisely – by a distance metric. This makes it challengingto assess entropy with traditional algorithms. To address theseproblems, we captured a large set of gesture passwords (N=2594)from crowd workers, and developed a security assessment frame-work that can calculate partial guessing entropy estimates, andgenerate dictionaries that crack 23.13% or more gestures inonline attacks (within 20 guesses). To improve the entropy ofgesture passwords, we designed novel blacklist and lexical policiesto, respectively, restrict and inspire gesture creation. We close byvalidating both our security assessment framework and policiesin a new crowd-sourced study (N=4000). Our blacklists increaseentropy and resistance to dictionary based guessing attacks.
I. INTRODUCTION
Smartphone password schemes like screen lock patterns
and PINs suffer from the security issues that emerge from
the biased ways in which users choose their passwords: they
select easy-to-remember and quick-to-draw lock patterns [1]
and PINs [2] that are also easy to guess. Free-form gestures
are a potentially fast and secure way of authenticating users
to smartphones that may address the problem. Rather than
being constrained by a fixed grid or keypad layout and small
password space (e.g., 389,112 possible lock patterns), users
can freely draw one or more strokes on a touchscreen [3]
or bespoke input surface [4]. The resultant stream of co-
ordinates can be matched against stored templates, using
mature algorithms [5], to grant or restrict access. The use of
gestures conveys numerous advantages: the theoretical number
of possible gestures is extremely large [3] and; gesture input
may require less visual attention than input based on selecting
buttons or targets [6] making it particularly suitable for mobile
or wearable scenarios where users may be working on small
displays [7] or busy and engaged in other dominant tasks [8].While the potential benefits of gesture passwords are well-
established, their applicability for use as a smartphone un-
lock scheme and their inherent security and usability remain
unclear. One issue is the small size of existing data sets –
prior work has collected between 22 [9] and 345 [10] different
predefined or user-proposed gestures from 34 to 45 users and
the largest analysis to date [11] combines two proprietary
data sets, captured in different studies/settings, to yield a
corpus of 529 different gestures in total. This contrasts to
existing analyses of passwords [12], PINs [13] and pattern
locks [14] which based security assessments on data sets of
several thousand examples. In light of these precedents, we
argue it is necessary to complement existing claims about the
high entropy of gesture passwords, based on controlled small
scale studies in the lab or field, with the data and analysis
from a larger online study of gesture passwords.
A related problem is a lack of established metrics for
assessing security – unlike the exact comparisons possible
with passwords and PINs, gestures are matched via a simi-
larity measure (e.g., cosine [15] or Dynamic Time Warping
(DTW) [16] distance). There are currently no methods for es-
tablishing common security metrics such as guessing entropy
for gesture data sets, making it hard to contrast gestures against
other authentication methods. Researchers have instead made
security assessments based on, for example, calculations of
Equal Error Rate (EER) [9], [3] or via resistance to manual [3],
[17] or brute-force guessing attacks [11]. Improving the quality
and scale of gesture data sets is an integral current requirement
for work in this area; doing so will enable development of
new forms of security analysis, provide a more comprehensive
assessment of the security of the basic technique, and provide
raw evidence required to determine the suitability of gesture
passwords as a lock scheme for smartphones.
This paper addresses these limitations and evaluates the fea-
sibility and practicality of using gesture passwords as a main
authentication technique on smartphones. In this scenario, we
constrain gestures to involve single strokes by single fingers
on a small screen region, similar to graphical pattern locks [4].
From this starting point, we describe a multi-stage study. We
first capture the largest extant sample of gesture passwords
(N=2594) from crowd workers. We analyze this to extract key
security metrics, such as an EER for the gesture matching
threshold, and as the basis for developing both a dictionary of
the 20 most common gestures (Android only allows 20 con-
secutive fail attempts), and an automated entropy assessment
algorithm. We show the dictionary is effective at cracking the
gesture passwords: 54.18% to 58.37% at the EER threshold
value and 23.13% to 31.49% with a stricter threshold derived
from closely related prior work [10]. This indicates user-
chosen gesture passwords, just like other unlock schemes, are
insecure against dictionary-based password guessing attacks.

To help users select stronger gesture passwords, we intro-
duce three novel policies: a lexical policy that involves present-
ing words that can inspire gestures, and two blacklist policy
variants that block users from choosing password gestures
that match popularly used gestures. We capture and analyze
a new crowd-sourced data set (N=4000) and compare the
usability and security of gestures generated with these policies
against those generated in a standard condition. The results
show that while our lexical policy is ineffective, our blacklist
policies increase both the entropy of gesture passwords and
their resistance to future dictionary based guessing attacks:
cracking as few as 14.93% of gestures when a consolidated
blacklist policy was enforced. Usability trade-offs were small
compared to the baseline policy: between 1.1 and 1.7 seconds
slower in mean authentication times, and approximately 3%
lower in 1-day recall tests (memorability).
The contributions are: 1) the largest data set of gesture pass-
words – over both studies 6594 unique participants produce
more than 67 thousand examples of 9188 different gesture
passwords. 2) a novel security assessment framework for
gesture-based authentication that can generate a dictionary of
representative gesture passwords, measure cracking rates, and
calculate the entropy of user-chosen gesture passwords. 3)
novel blacklist and lexical policies for improving the entropy
of the gesture passwords users create. Finally, 4) an assessment
of these policies in terms of both usability (over multiple recall
sessions) and our newly developed security metrics.
II. RELATED WORK
The use of gestures to authenticate an individual has a long
history; a written signature is, fundamentally, a 2D gesture.
With the emergence of large, high resolution touch-screens
on mobile devices, researchers began to explore how to apply
gesture authentication to this new space. Early work focused
on the biometric properties of gesture input, suggesting that
how users stroke the screen while producing single [18] or
multi-touch [9] gestures can provide identifying information
with an accuracy of between 77% – 90% for a single input.
A. Gesture Passwords
More recent work has focused on gestures as passwords in
and of themselves – when the strokes made, rather than how
they are performed, is the data examined to authenticate a
user [3]. Various aspects of performance have been examined
in this space. One prominent strand of work has focused on
gestures that contain one or more finger strokes, with the
requirement that multiple finger-strokes overlap temporally,
and examined optimal algorithms to recognize gesture pass-
words [5] and the usability and memorability of gesture pass-
words compared to text passwords after periods of one hour,
one day and one week [10]. The authors conclude that gestures
passwords achieve levels of usability equal to or exceeding text
passwords – for a set of 91 participants creating and recalling
pairs of gesture passwords, mean creation times of 69 seconds,
recall rates of 89.6% and recall times of 16.49 seconds were
indistinguishable from text password performance. We also
note that current touch screen gesture authentication work
focuses on input over the whole screen; no existing work
studies the use of gesture passwords on smartphones with a
more limited drawing canvas. We focus on the feasibility of
using gesture passwords as an alternative graphical password
(lock) scheme on smartphones – as such we restrict input to
the small phone screen regions typical in phone lock systems.
B. Gesture Password Security
Although the usability of gesture authentication schemes
can be assessed in much the same way as any other form
of password, assessing their security is more difficult. This
is fundamentally because, unlike traditional password sys-
tems, matches between stored gestures and those entered by
users (or attackers) is achieved not through an exact and
precise comparison but by exceeding a threshold value on
a similarity measure such as cosine distance (used in the
Protractor recognizer [15]) or DTW distance [18], [16]. The
key consequence of this approach is that there are many
possible valid variations of a gesture that would authenticate
a user and that different matching algorithms [5] and match
thresholds (or number of template gestures [3]) will yield
different levels of performance in terms of the proportion of
genuine or malicious gestures that are confirmed as a valid
match. In practice, this means that while a naıve analysis
of the entropy of gesture passwords, defined as the number
of possible strokes that can be made on a canvas of some
given resolution, is extremely high (e.g., 100 bits for 16 point
gestures drawn on an 8 by 9 grid [10]), the practical entropy
of the space is likely much lower, as multiple strokes within
this space will match one another. Unsurprisingly, as with
other forms of password, users are biased to produce specific
gestures more frequently than others [11].
Reflecting these problems, prior research assesses the se-
curity of gesture authentication schemes through alternative
approaches. A common one is empirical: gesture passwords
are attacked by either observers [3], [17], or via automated
processes such as through random geometric guesses [5] and
their resistance to these attacks is contrasted against data for
baseline cases such as passwords. Recent automated attacks
exploit information extracted from gesture data sets to improve
performance: the symmetry of gestures and a dictionary of
commonly selected gesture passwords [11]. Although it is not
applicable to an online attack scenario (with guessing attempt
limits), this attack was shown to be highly successful if used
for an offline attack – crack rates were between 47.71% and
55.9% with 109 guesses. We note that the large sets of gesture
password samples that would be necessary to generate and
validate attack dictionaries do not currently exist.
C. Password Policies
Password selection policies, such as mandated minimum
length or required special characters, can help users create
stronger passwords [19]. However, policies that are effective
at improving password entropy can negatively impact us-
ability [20]. System-assisted password selection policies [14]
can be effective. They try to guide users to create more
secure passwords – significantly improving security with small
compromises in recall rates and unlock times. Currently, only
limited work has examined password selection policies for
gesture passwords – Clark et al. [21] proposed three policies
that request users to create gestures that are fast, random or
use multiple fingers. Evaluations indicate they had limited
impact on security and may have negatively affected usability.
Given the importance of password policies in ensuring the
security of other forms of password system, we identify the
development of policies that can help users select more secure
gesture passwords as an underdeveloped area of research.
III. SECURITY EVALUATION FRAMEWORK
Here we discuss the challenges in measuring the security of
gesture passwords, and propose a novel evaluation framework
for gesture password security. Our framework consists of the
following three methods: (1) configuring gesture algorithm
parameters based on EERs, and measuring false acceptance
rates as the first security measure; (2) measuring entropy of
gesture passwords through an n-gram Markov Model; and (3)
measuring the resistance of gestures to a novel clustering-
based dictionary attack. This framework is used later to
compare the security of our gesture selection policies.
A. Online Attack Model for Smartphones
To mitigate online guessing attacks on smartphones, only kconsecutive fail unlock attempts are allowed (e.g., k = 20 for
Android and k = 10 for iOS). That is, after k unsuccessful
attempts, an attacker can no longer try unlocking the target
device. Thus, the attacker’s goal is to unlock a target device
within k guessing attempts. If the attacker has no information
about the gesture password being used, the best attack strategy
is to try the top k most commonly used gesture passwords
first. If a gesture password data set is available, the attacker
could use a data-driven approach to build this list of top
k gesture passwords, and try them sequentially to unlock
victims’ devices. In the next section, we explain why building
a guessing dictionary for gesture passwords is challenging.
B. Challenges in Evaluating Security
We identify two key problems with assessing the security
of gesture passwords in response to online attacks. The first
relates to modelling the gesture space – as the theoretical
space is very large, it is an open question how to best
identify common gesture forms. Prior work has proposed
manual classification of gestures into broad categories (e.g.
digits, letters, geometric shapes [11]) to support offline attacks.
There is no prior work exploring automated approaches to
this problem, such as n-gram models or Probabilistic Context-
Free Grammars (PCFG) [22] capable of computing probability
scores for all possible gestures, or clustering algorithms that
group gestures in a set based on their similarity. Due to this
lack, we believe that exploring mechanisms to automatically
determine common gesture classes is an important first step
to support online attacks on gesture authentication systems.
The second relates to the fact that multiple possible vari-
ations of a gesture, effectively multiple different gestures,
will authenticate any given user. This is because thresholded
distance metrics, as opposed to exact similarity, are used
to determine matches between entered gestures and stored
templates. To create maximally effective dictionaries for online
attack, it is therefore important to be able to generate or select
highly representative gesture exemplars from common gesture
classes. Prior online approaches to this problem [11], focused
on making large numbers of diverse guesses by distorting
randomly selected gesture examples, do not apply to an online
attack scenario in which the maximum number of guesses is
low (e.g., 10 or 20). A viable online attack against gesture
passwords must be able to identify optimal guesses for each
gesture class. In the next sections, we explain how our gesture-
tailored n-gram model and clustering-based dictionary have
been designed to address these challenges.
C. Preprocessing and Equal Error Rates
Prior to performing recognition or other analysis, gestures
need to be normalized. We follow recommendations from prior
work [5] and apply scale and position normalization, making
these proprieties effectively invariant – two gestures depicting
similar leftward arrows should therefore be matched regardless
of any differences in the scale or location of the strokes on
the canvas. We do not apply rotation normalization, making
gestures rotation variant – a leftward arrow would therefore
not be matched to an otherwise similar rightward arrow.
There are many existing algorithms for gesture recognition.
Our framework applies two recognizers that have been widely
used in recent studies of gesture passwords: Protractor [3],
[10] and Dynamic Time Warping (DTW) [11]. We describe
the configuration of these algorithms below:
Protractor: We used the reference $N Protractor imple-
mentation [23]. Gestures are compared by the inverse cosine
distance between their vectors. We configured the recognizer
to allow only single stroke gestures and to allow gestures to
be matched on drawn shape rather than stroke sequence (i.e.,
to use original and inverted stroke sequences as templates).
Rotation invariance was applied at the default thresholds: +-
30◦ degrees for the initial stroke, defined as 1/8 of the gesture
length, and 45◦ for the gesture as a whole.
DTW: We used a standard DTW implementation based on
a Euclidean distance measure [16]. No additional processes
are required to maintain rotation variance.
A key final normalization of gestures is re-sampling: both
protractor and DTW algorithms require that gestures being
matched are the same size. They meet this constraint by re-
sampling all strokes to a preset size; optimal values for this
size parameter vary depending on the gesture set. As in prior
work [11], we determine optimal values for this parameter by
creating multiple sets of re-sampled gestures and examining
Equal Error Rates (EERs). Specifically, we create 12 gesture
sets with re-sampled lengths of between 8 and 96 points, in
steps of 8. We calculate EERs by adapting processes described
in Sherman et al. [3]. For a given data set, False Rejection

Rates (FRRs), which measure the proportions of users’ gen-
uine gestures that are rejected by a gesture algorithm, are
calculated by matching different examples of each individual’s
gestures against each other. False Acceptance Rates (FARs),
which measure the proportion of others’ gestures being mis-
classified as users’ own, are based on matching an individual’s
stored gesture template against those from all other individu-
als. FARs reflect the rate at which attackers might succeed in
guessing users’ gestures. By calculating FRRs and FARs for
a range of distance threshold values, we can derive an EER
at their intersection. Re-sampling size is then set to minimize
EERs across the data-sets being examined.
D. Entropy Analysis with n-gram Markov Model
Measuring the guessing entropy of passwords is commonly
achieved by analyzing the probability distribution of real-
world passwords. However, as we can only collect samples
representing a small portion of the theoretically possible space
of gesture passwords, we need to develop a probabilistic
password model [22] that uses collected samples to estimate
the probability distribution of all gesture passwords. We do this
by developing n-gram Markov models that can calculate the
probability of each gesture password. n-gram Markov models
are an appropriate technique as they have successfully been
used to estimate the probability distribution of other graphical
password schemes [1], [14]. In an n-gram Markov model,
the probability of the next stroke in a graphical password is
calculated based on a prefix of length n. The idea is that
adjacent strokes in user-chosen graphical passwords are not
independent, but follow certain high probability patterns.
In order to produce an n-gram model, based on sequences
of discrete tokens, from a continuous two-dimensional gesture
representation we need to design a discretization process that
minimizes error. Our multi-stage process is described below
and illustrated in Figure 1.
Discretization: First, we apply Douglas-Peucker (DP) line
simplification [24] to each gesture. We examine the relation-
ship between the DP simplification tolerance value and the
number of simplified strokes, selecting the knee point as the
optimal value. Based on the resultant set of simplified strokes,
we create discrete symbols based on stroke length and stroke
angle. To identify a mapping that minimizes error, we consider
multiple divisions of stroke length (dividing the full range of
all observed stroke lengths into 2, 3 or 4 equally sized length
regions) and angle (into 6, 8, 10, 12 and 14 equally sized
angular regions). This leads to 15 differently sized models
containing from between 12 (2 lengths by 6 angles) and 56
(4 lengths by 14 angles) possible symbols, roughly equivalent
to the number of symbols in a pattern (9 points) or PIN (10
symbols) and an alphanumeric password (about 95 symbols).
In addition, we also consider two possible phases for the
angular regions: with an origin at 0◦ and an origin at half
the region angular width (e.g., 22.5◦ if there are 8 regions).
We refer to these phases as aligned and offset. This leads to a
total of 30 different approaches. Following this transformation,
we are able to represent each gesture as a series of discrete
symbols each representing a single stroke.
Generation: To estimate the probability of any possible
gesture password from a set of gesture samples, it is es-
sential to develop a probabilistic password model (e.g., n-
gram Markov model) that effectively represents the probability
distribution of real-world gesture passwords. Therefore, we
build a number of reasonable n-gram Markov models across
various discretizations and n-gram Markov parameters. Using
a 5-fold process, we create a set of nine 2-gram models using
each of the 30 discretizations: 270 models in total. Each set
explores a grid search over two additional variables: smooth-
ing method (“add-1 Laplace smoothing”, “add-1/(number of
symbols) Laplace smoothing” and “Good-Turing smoothing”)
and; exclusion policy for short gestures. Specifically, we create
models that 1) include all gestures, 2) exclude single stroke
gestures, and 3) exclude single and dual stroke gestures. The
use of smoothing methods enables n-gram models to cover
rare n-gram cases. We explore excluding extremely short
gestures as their probability may be over-weighted, potentially
biasing the n-gram models. In each model, we apply end-point
normalization to ensure the sum of probabilities of all possible
gesture passwords is 1. We opt not to examine 3-gram models
due to the difficulty of collecting a data set large enough to
yield an acceptably low proportion of unseen cases.
Selection: To select reasonable models, we apply three cri-
teria. The first two rely on comparisons between original user-
chosen gestures and gestures derived from the discretization
process and n-gram Markov models. In order to make these
comparisons, we reconstitute gestures from their symbolic
forms in the models. This is done by creating a contiguous
sequence of strokes, with each stroke’s length and angle
set to the central values of its length/angle segment – see
steps 6 and 7 in Figure 1. The first criteria based on this
process is the crack rate using k guesses at a specific distance
threshold t. We believe models achieving a higher crack
rate more accurately reflect the probability distribution of the
collected samples. The second criteria is the similarity between
each original user-chosen gesture and its discretized n-gram
representation. For a given n-gram model, we calculate this
as the proportion of gestures that are more similar than a
specific distance threshold t. We believe models in which
gesture representations are more similar to the originals will
be more accurate. The third criteria we apply is the model
completeness. We surmise that models in which we observe
a larger proportion of possible n-gram cases will be more
accurate. We calculate these values for all models. Models
should be selected for further study through manual inspection
to achieve a good balance of performance across these criteria.
Optimization: Any discretization method for n-gram
Markov models yields degenerate cases (e.g., strokes on an
edge). Thus, to improve n-gram Markov model performance,
we need to handle degenerate cases in each selected model. We
do this during discretization of strokes into length and angle
categories by treating cases within b% of boundary edges as
ambiguous and incrementing the n-gram sequence frequency

A3
Length Angle Symbol
L1 A3 L1A3
������������ ������
���������������������������������
!����"�#���������$��������
%����������&����$��������������'���������#�(��������������
)��������������$���������������������������$��
L1 A2 L1A2
L0 A3 L0A3
*��+��������������$�����������������,����������������#�������
Full symbolic representationL1A3 L1A2 L0A3
A0A1
A2
L0
-��+������$�����$��������������������������
L1
Fig. 1. Overview of discretization process from a gesture (step 1) to angle-region symbols for building n-gram Markov models (step 5) and the gesturereconstitution process for evaluating them (steps 6 and 7). Illustration uses a simple model with 2 length and 4 angle discretization regions.
of both the actual and adjacent length or angle region by iand j respectively, where the sum of these values is always 1.
This reflects the fact that strokes near the discretization region
boundaries may be erroneously (or noisily) classified. For each
selected n-gram Markov model, we perform a grid search over
values of b in the range 1% to 10% for angle and length with
both i and j set to 0.5, thus generating an additional 100 n-
gram models. The final model is selected based on balanced
improvements to the metrics defined above.
Calculating partial guessing entropy: With the best per-
forming n-gram Markov model(s), we calculate partial guess-
ing entropy to evaluate the security of the gesture passwords.
Partial guessing entropy estimates [25] are useful because
real-world attackers might only be interested in cracking
just a fraction of an entire password set. This is a popular
technique for estimating the average number of trials needed
to successfully crack a fraction (α) of an entire password set.
We report these data in terms of “bits of information.”
E. Clustering-based Dictionary Attack
To evaluate the security of gesture passwords against guess-
ing attacks, we introduce a novel dictionary attack based on
clustering to group gestures according to the similarity of their
shape. The goal is to identify common gesture classes and,
within each class, select the most representative gestures to
support guessing attacks. We use a 5-fold process as follows:
Calculate distances: We calculate distances between all
gestures in the training set using a gesture distance metric
(e.g., Protractor or DTW). This data is identical to the FAR
calculation described in Section III-C.
Cluster gestures and select representative examples: We
apply the affinity propagation clustering algorithm [26] to
these distances. The key advantage of affinity propagation
over alternative approaches is that it is an exemplar-based
clustering algorithm that identifies representative examples (in
our case, typical gestures) within the data-set. We believe this
can be useful for creating a dictionary of gesture passwords.
The results of this algorithm are a set of clusters containing
similar gestures. Each cluster has a specific gesture at its
geometric center. We argue this central gesture will be the
optimal representative gesture for the cluster it is derived from.
Rank gestures and create dictionary: We order the clus-
ters by size and create a dictionary of center gestures of the
largest k clusters. We evaluate the fit of clustering model by
examining the number of clusters generated and the meaninter-cluster distance, defined as the mean distance between
all gestures in each cluster. A larger number of clusters
likely reflects a more diverse gesture set. Similarly, clusters
containing gestures that are more distant from one another
can be assumed to contain gestures with more diverse shapes
– center gestures may therefore be less representative of the
full cluster contents.
Perform dictionary attack: With the dictionary of k center
gestures, we match all test set gestures against the dictionary.
The crack rate is the proportion of test set gestures that match
at least one gesture in the dictionary. We report crack rates
for a continuum of distance thresholds and/or corresponding
FRRs. This serves as the primary metric for evaluating the
security of a set of gesture passwords. If different conditions,
models, algorithms or policies are being compared, the crack
rates may also be tested for significant differences using
contingency tests. Testing or other comparisons should take
place at standardized FRR levels such as 2.5%, 5% or 10%,
or those used in relevant prior literature.
IV. FIRST STUDY: GESTURE PASSWORD SECURITY
We designed, implemented and executed an on-line study
to capture the largest set of password gestures to date. The
gestures were captured in a homogeneous study protocol and
outside traditional lab or university environments. The goals of
capturing this data set were to (1) move beyond the small scale
security analyses enabled by prior research and remove biases,
such as the experimenter effect or a lab based population bias,
from the data, (2) measure the security of gesture passwords
using the proposed framework, (3) gauge the effectiveness of
the framework, and (4) acquire a large set of gesture samples
to build blacklist policies. The ethical aspects of the study
were approved by the host university IRB.

A. Gesture Recognizer
During data capture, we used Protractor, configured as
described in Section III-C, as it is mature and has been
deployed in a number of closely related studies [3], [10].
Protractor’s similarity measure is the inverse cosine distance:
when two gestures are compared, larger scores indicate greater
similarity. While data about specific thresholds used in prior
gesture authentication systems is scarce, one prior study with
Protractor uses a threshold of 2.0 [10]. Considering our goals,
we opted to set Protractor’s matching threshold to be more
permissive: 1.0. We explicitly used this permissive threshold
in order to capture a greater proportion of the raw gestures
that participants produce; as our study protocol used gesture
matching to ensure validity of the input gestures (see next sec-
tion), stricter thresholds that increase the difficulty of matching
gestures might serve to filter or restrict the gestures that
participants were able to create during the study. A permissive
threshold ensured participants entered meaningful gestures
that resembled each other while minimally constraining the
form and type of those gestures. This best met the goals
of our study. We also note this is a typical approach in
empirical work to capture gestures – rather than constrain
examples to fit a given algorithm during collection, gathered
examples are considered as valid gestures that can be studied to
develop optimal recognition algorithms in subsequent offline
analysis. In this way, the use of a permissive threshold allows
capture of a valid but minimally restricted set of gestures
that can support the broadest possible set of future analyses
– by, for example, examining the impact of increasingly strict
thresholds or applying different comparison algorithms.
B. User Study Design
The study was implemented as a website and participants
were recruited via Amazon Mechanical Turk (MTurk). The
MTurk listing summarized study activities, requested partici-
pants to complete it on a mobile device and provided both a
link and a QR code to the study site. We screened participants
who arrived at the study site as to whether they were on
a mobile device or not – we checked for a touchscreen
device with a portrait orientation, common criteria for browser-
based mobile device detection. Participants not satisfying these
criteria were reminded to complete the study on a mobile
device and again provided with the study link and QR code.
Participants accessing the study site on a mobile device were
first presented with instructions requesting they create a pass-gesture they would use to secure access to their mobile device.
Two incentives were provided to encourage the creation of
secure, memorable gestures. Firstly, we informed participants
they would also create an attack-gesture that would be used
to guess the gestures of other study participants; similarly,
the attack-gestures of other study participants would be used
to guess their own pass-gesture [1]. If these guesses were
successful, they would not receive compensation. Secondly,
we told participants they would be asked to recall their pass-
gesture up to one day after creating it.
(a) Create (b) Match (c) No match
Fig. 2. The first study running on a Samsung Galaxy 8 Android mobile phonein Google Chrome. Figures show limited input region (following Androidpattern lock) and pass-gesture creation after an example gesture has beendrawn (a) and pass-gesture confirmation screens for gestures that match (b)and fail to match (c) the example gesture (a).
Participants then moved on to a screen that asked basic
demographics (handedness and categories for age, educational
level, occupation and ethnicity). They then progressed to a
screen where they first created and, on a subsequent screen,
confirmed their pass-gestures. Confirmation pass-gestures were
required to match creation pass-gestures, using the Protractor
recognizer configured as described in Section IV-A. A failure
to match these gestures led to both being deleted and the pass-
gesture set up process starting again. Participants were also
able to cancel the set up process at any stage, resulting in
a similar deletion of the templates and restart of the process.
Once gestures had been matched successfully, and participants
were satisfied, they tapped on a button to finalize their gestures
and move on in the study. This interface was closely modeled
on the pattern lock set up process on Android mobile phones
and can be seen in the screen shots in Figure 2. We note
the input region used was limited, following typical phone
pattern lock and PIN implementations. This helped ensure the
input region was accessible to users regardless of their physical
size, handedness and phone grip – the area is reachable by
the thumb of most users in a single handed grip, a practical
constraint for any realistic phone unlock system.
The next stage of the study involved a similar process
of gesture creation and then confirmation for the attack-
gesture. Additionally, attack-gestures were matched against
pass-gesture templates; if matched, participants were informed
attack-gestures needed to differ from pass-gestures and the
attack-gesture creation process was restarted. The attack ges-
ture served as a distracter task to clear each participants short-
term memory. Finally, participants completed a recall task for
their pass-gesture. They had a maximum of five attempts to
match either their creation or confirmation pass-gesture. The
limit of five was derived from the Android security system –
after five incorrect entries, users need wait 30 seconds before
making further attempts. After either a successful match or
five failures, the study terminated with a screen informing
participants of their correctness in the recall task, by thanking
them for them time and with a numerical code that enabled
them to register the study as complete on MTurk.

C. Measures
For each participant we recorded the following measures.
All measures relating to gesture creation and confirmation
were logged for both pass- and attack-gestures; measures for
recall only relate to pass-gestures.
All gestures. We logged all entered gestures at all phases
of the study. Gestures were tagged with the study stage and
participant ID and recorded at the native resolution (both
temporal and spatial) of the participant’s device. Additionally,
we tagged all final or correct creation, confirmation and recall
gestures. If a user failed to recall their pass-gesture within five
attempts, no correct recall gesture was recorded.
Setup time. We measured the time to create and confirm
gestures from first presentation of the gesture creation screen
through to when the confirmation gesture was accepted by the
user via a explicit button press to move on with the study.
Setup cancels. We logged the number of times the gesture
set up process was intentionally canceled by a user wishing
to revise or change their gesture.
Setup failures. We stored the number of times that confir-
mation gestures failed to match creation gestures.
Recall rate. We logged the number of participants who
failed to recall their pass-gesture within five attempts.
Recall attempts. We logged the number of recall failures
regardless of final success or failure in the overall recall task.
These failures were due to either matching one of the attack-
gestures or failing to match any gesture.
Recall time. For those participants who successfully re-
called their pass-gestures, we logged the recall time from
the first presentation of the gesture entry screen through to
successful entry of the gesture.
D. Participants
In total, 2619 unique Amazon Mechanical Turk workers
completed the study, each rewarded with 0.25 USD. On
manual inspection, we removed 25 participants from the set, as
they created essentially identical (and highly unique) gestures
in close temporal proximity – we assumed they were created
by a single individual with access to a large number of separate
MTurk accounts. The final gesture set thus contains data
from 2594 separate MTurk workers. Participants completed
the study, from initial gesture creation through attack gesture
creation to final recall entry, in a median of 47 seconds,
corresponding to a median hourly wage of 19 USD.
E. Usability Results
1) Demographics: The majority of participants identified as
white (56.32%), Asian (18.47%), Hispanic (9.48%) or black
/ African-American (7.94%) and fell in the 18-24 (31.8%),
25-34 (46.72%) or 35-44 (15.42%) age groups. Most were
educated post-graduate (13.61%), college (49.46%) or high
school level (33.73%) and they worked in a wide range of
fields; the largest group were students (15.38%).
2) Setup Cancels, Failures and Time: Data for setup of
pass- and attack-gestures is shown in Table I. Due to positive
skews in the majority of data we report means, SDs and
medians for all measures. We note the 24.38 seconds setup
time is substantially below figures in the literature of gesture
passwords – for example Yang et al. [10] report a setup time of
69 seconds for their multi-finger gesture passwords. The most
likely explanation for this variation lies in the different partic-
ipant populations (MTurk workers vs lab study participants)
and our focus on single finger, single stroke gestures over the
more complex multi-finger or multi-stroke gestures studied
by Yang et al. [10]. Although shorter than prior free-form
password systems, these setup times remain representative of
online studies of other graphical authentication schemes – in a
recent crowd sourced study of pattern locks, mean setup times
for a standard system are reported to be 22.05 seconds [14],
broadly similar to data reported here. We interpret this to mean
that users both appropriately engaged with the gesture creation
task, and were also able to create gestures at reasonable speeds.
3) Recall Success Rate and Time: The overall recall rate
in the study was 92.1% (95% confidence interval: 91.05%-
93.13%). From the 2594 participants, 205 failed to enter their
pass-gestures within five attempts. We divided participants
into two groups depending on their success in the recall task
and present their data in Table II. Once again, due to the
the simpler format of our gestures, recall times are quick
(5.11 seconds) compared to those reported in prior studies
of gesture passwords (16.49 seconds) [10]. However, recall
rates are low – for short-term recall, figures of 98.9% have
been previously reported [10]. Examining the data in detail,
its clear that the attack gesture task strongly impacted recall
rates – for participants who recalled their pass-gestures, 68%
of errors involved entering a match for their attack-gesture;
for participants who failed recall this figure was 60%. We
also note that, from the set of 2389 participants who correctly
recalled their gesture, the number of attempts in which an
entered gesture failed to match either pass- or attack-gestures
was 0.11 – this figure corresponds closely to the number of
errors (12.1%) recorded in an in-the-wild study of Android
pattern locks [27]. We argue this suggests that the somewhat
reduced recall rates recorded in this study are due to the attack
gesture distracter task rather than a reflection of fundamental
user performance during gesture authentication recall.
F. Security Results: Preprocessing and EER
To evaluate the security of the collected gesture passwords,
we apply methods from the initial stage of our framework (see
TABLE ISETUP CANCELS, FAILURES AND TIMES IN THE FIRST STUDY (μ: MEAN,
σ: STANDARD DEVIATION, μ: MEDIAN)
Pass-Gesture Attack-GestureMeasure (units) μ σ μ μ σ μSetup Cancels (#) 0.6 2.58 0 0.14 0.64 0Confirm Failures (#) 0.14 0.52 0 0.77 1.88 0Setup Time (s) 24.38 30.13 15.52 17.82 22.08 11.48
Section III-C). We first studied and described the gestures.
To gain an understanding of the types of gesture produced,
we adapted an existing categorization of gesture passwords
from prior work featuring seven categories: digits, geometric
shapes, letters, math functions, math symbols, music symbols,
and special characters [11]. Two independent raters manually
examined the same random 10% of the gestures, categorizing
each according to this prior scheme and extending it where
necessary. They then discussed their ratings, agreed on four
additional categories – compound, cursive, iconic and other
– and applied this new scheme to a second random 10% of
the gestures. More details on these categories and the results
from this process are shown in Appendix A. The results are
broadly similar to those in a prior study [11], suggesting that
the gestures captured in this work are reasonable. In addition,
Appendix B shows the distribution of all raw points input in
creation gestures, binned into three by three grids with start
and final points separated out. The data suggests that, as with
other forms of graphical password such as patterns [14], users
tend to start strokes from the top left of the available drawing
area and, to a lesser extent, finish them in the bottom right.
In contrast, points entered during the course of an ongoing
gesture were more central – less prevalent around all edges
(and particularly corners) of the drawing area.
We measured FRRs from each user’s creation, confirmation
and, if present, recall gestures. We generated FAR data from
the full set of all users’ creation gestures. For Protractor, EERs
improved consistently with increasing re-sampling sizes, so
we opted to set the re-sampling size to 96 (the default for
Protractor’s reference implementation). For DTW, minimum
EERs were observed when gestures were re-sampled to 24
points, slightly larger than the 16 point optimal value reported
in prior work [11]. At these values, the EER for DTW is 3.59%
(AUROC 0.984 and corresponding to a DTW distance of 18.4)
and for Protractor 4.14% (AUROC 0.974 and corresponding
to an inverse cosine distance of 1.25). Figure 3, shows the
ROC curves contrasting these algorithms. We note the EER
value for Protractor is somewhat lower than reported in the
literature – Sherman et al. [3], for example, report 7.07% and
15.97% with Protractor for two different data sets and when
matching against two templates. Examining their data in detail
suggests the reduction we observe is due to a lower FRR,
rather than any change in FAR. This suggests the difference is
predominantly due to our decision to conduct the study with
a permissive match threshold (1.0) to gather a greater range
of user inputs. While no specific match threshold is reported
TABLE IIRECALL FAILURES DUE TO MATCHING ATTACK GESTURES (ATTACK
ENTRIES) OR NO GESTURE (NO MATCH ENTRIES) AND RECALL TIMES IN
THE FIRST STUDY (μ: MEAN, σ: STANDARD DEVIATION, μ: MEDIAN)
Successful Recall Unsuccessful RecallMeasure (units) μ σ μ μ σ μAttack entries (#) 0.23 0.66 0 3 1.81 3No match entries (#) 0.11 0.39 0 2 1.81 2Recall Time (s) 5.11 5.52 3.12 N/A N/A N/A
Fig. 3. Receiver Operating Characteristic (ROC) curves contrasting relativeFRR and FAR performance for Protractor and DTW recognizers. The Pro-tactor EER is 4.14% (AUROC: 0.974) at a threshold value of 1.25 and theDTW EER is 3.59% (AUROC: 0.984) at a threshold value of 18.4.
in [3], if we assume use of a stricter value, such as the 2.0
used in related work [10], a greater number of false rejections,
and correspondingly, a higher EER would be expected.
G. Security Results: Entropy Analysis
We then followed the entropy analysis processes in our
framework. We created 270 different 2-gram models and
applied selection criteria to choose a subset of models for
optimization, as described in Section III-D. We used DTW
to calculate these metrics due to this algorithm’s improved
performance over Protractor in terms of EERs, and set the
threshold t to the value corresponding to 10% FRR, one of
the standardized FRR levels introduced in our assessment
framework (see Section III-E). Appendix C includes results
in terms of our selection criteria for all models achieving a
crack rate of greater than 10%. We choose three models for
optimization – see Table III. The first achieves the overall best
crack rate and is based on discretization into two length and
ten angular regions (“2x10”). However, gestures reconstituted
from this model show a relatively low similarity to the original
user-chosen gestures, suggesting some information in complex
strokes may be lost. Accordingly, we selected two additional
models with increasing numbers of either length (“3x10”)
or both length and angle (“4x12”) discretization regions that
combine high crack rates with improvements in similarity
and small reductions in model completeness. The outcomes
from the optimization process are also depicted in Table III.
Appendix D shows the optimized boundary region sizes and
distribution of start, center and final strokes in these three
models. These figures show that initial strokes tend to involve
vertical and/or right movement (matching the gesture start
locations shown in Appendix B), while central strokes are
short (likely due to users drawing curves) and final strokes
have a relatively even distribution. Based on a review of this
material, we believe that the model based on discretization
into three length and ten angle regions (3x10) provides a
well balanced combination of high crack rate, close accuracy
to the original user-chosen gestures, and high proportion of

TABLE IIISELECTED n-GRAM MODELS AFTER OPTIMIZATION SHOWING CRACK
RATE (CR), SIMILARITY (SM) AND COMPLETENESS (CP) METRICS.
Name Model Parameters Model PerformanceLen Ang Phase Smoothing Excl. CR SM CP
2x10 2 10 offset Good-Turing single 18.24% 62.72% 94.78%3x10 3 10 offset Add-1 dual 16.85% 86.16% 90.73%4x12 4 12 offset Add-1 dual 15.46% 84.70% 73.67%
TABLE IVCOMPARISON OF PARTIAL GUESSING ENTROPY (“BITS OF INFORMATION”)
WITH CRACKING FRACTION (α) ACROSS PASSWORD DATA SETS.
Datasetα
0.1 0.2 0.3 0.4 0.7 1.02x10 Pass-gestures 6.29 8.39 11.39 13.31 16.11 17.98
3x10 Pass-gestures 6.97 9.69 13.26 15.41 18.57 20.68
4x12 Pass-gestures 7.47 11.27 15.94 18.40 21.68 23.98
4-digit PINs [2] 5.19 7.04 8.37 9.38 11.08 11.83
Patterns [14] 5.04 5.82 6.54 7.19 9.20 12.71
observed n-gram cases. We note that the model based on
discretization into two length and ten angle regions (2x10)
may perform better in terms of crack rate when gestures in a
set are relatively simple.
Partial guessing entropy results from the three optimized
models, converted to “bits of information” are shown in
Table IV. The results of two additional data sets are included:
4-digit PINs [2], and screen lock patterns [14]. The results
indicate that gestures, across all three n-gram models, poten-
tially have higher entropy estimates compared to PINs and
patterns at different α levels. Although our n-gram models can
be further optimized in the future (to more accurately estimate
the probabilities of real-world gesture passwords), these early
comparisons provide some evidence that guessing gestures
might be more challenging compared to PINs or patterns. We
note the models show a steep rise in partial guessing entropy
levels between α values of 0.1 and 0.4. This likely reflects the
“weak subspace” of gestures [11] – the idea that a subset of
user created gestures (at low α levels) take simple forms that
are relatively easy to guess, while the remainder (encountered
at higher α levels) are more challenging.
H. Security Results: Clustering-based Dictionary Attack
We then applied methods from the third stage of our
framework: performing clustering-based dictionary attacks on
the collected gestures and measuring cracked rates. Following
the processes outlined in Section III-E, we generated clusters,
dictionaries and attack data for DTW and Protractor recogniz-
ers. We report data for the full gesture sets. Dictionaries are
shown in Figure 4. Protractor led to a total of 325 clusters
with a mean (inverse) inter-cluster distance of 4.69 for the
top 20 dictionary clusters. DTW resulted in a total of 290
clusters and a mean inter-cluster distance of 8.97 for the top
20 dictionary clusters. These thresholds are substantially more
permissive than EERs thresholds, indicating that, in general,
gestures in each cluster would be matched with each other
if EER thresholds are used as a criteria. This suggests the
clustering algorithm was effective at grouping similar gestures.
Protractor dictionary DTW dictionary
Fig. 4. Dictionaries created from clustering the full sets of pass-gestures inthe first study for both Protractor (left) and DTW (right).
Fig. 5. Proportion of cracked gestures with dictionaries at FRRs from 0%-15% with Protractor and DTW recognizers in the first study. Vertical linesshow EER values for each recognizer.
As we are primarily interested in online attack on mobile
phone unlock screens, we used dictionaries generated from
training sets to guess gesture passwords when k = 20, the
default number of guesses before an Android device locks
out further attempts. The results, for both dictionaries and
recognizers, are shown in Figure 5. At thresholds correspond-
ing to EER values, the dictionaries are highly effective. They
crack between 54.18% (DTW) and 58.37% (Protractor) of
gestures. In general, fewer gestures are guessed with DTW
than Protractor, suggesting that future gesture authentication
systems should use DTW in preference. More generally, this
data also highlights that data-set wide EERs may overestimate
the security of gesture passwords – stricter thresholds need
be applied to create a viable system. The limited data on
thresholds used in prior work confirms this – a threshold of 2.0
with Protractor has been previously proposed [10]. In our data
set, increasing the Protractor threshold to 2.0 corresponds to
an FRR for genuine users of 11.54%, which would reduce the
effectiveness of the clustering-based dictionary attack against
Protractor from 58.37% to 31.49%. Applying a threshold
corresponding to the same 11.54% FRR to DTW drops the
performance of clustering attack from 54.18% to 23.13%.
For comparison, dictionary attacks performed on patterns
achieve between 13.33% crack rate in a real-world mobile
application [28], and 32.55% in an MTurk study [14] and real-
world pattern lock error rates, FRRs, are 12.1% [27].
We note our dictionary attacks are more effective than the
offline guessing attack reported in Liu et al. [11] – they crack
a comparable 55.9% of gestures using DTW but required
109 guesses. There are a number of reasons for this: the
gestures generated in more controlled settings may be more
complex, distinct and consistent [29] than those generated by
MTurk workers online (though which group generates content
more representative of genuine password gestures is an open
question), and the gestures used in the current work are inten-
tionally constrained to be simple single strokes in the small,

practical “screen-lock” region of smartphones rather than the
multi-stroke full-screen gestures that have been previously
studied [5]. However, the strength of the dictionaries likely
reflects the presence of a “weak subspace” [11] of gesture
passwords – a large subset of the gestures users create are
insecure due to, for example, their similarity to common
reference points such as letters, their simplicity or the tendency
for other users to create highly similar strokes. We identify the
lack of diversity in users’ gestures revealed by this analysis
as a major problem undermining the potential of gesture
passwords as a smartphone lock scheme.
V. SECOND STUDY: GESTURE SELECTION POLICIES
To increase the entropy of gesture passwords, we conducted
a second study exploring the impact of four policy conditions:
a standard baseline condition, similar to that used in the
first study; a novel lexical policy in which participants were
provided with words that could inspire their gestures; a novel
blacklist policy that prevents users from creating pass-gestures
matching those in a displayed dictionary and; a consolidatedblacklist policy with a refined set of blocked gestures. The
lexical, blacklist and consolidated policies were intended to
increase the entropy of the gestures participants generate by,
respectively, inspiring users to create more diverse forms and
restricting the use of dictionary items. We apply our security
assessment framework to data from this study to determine if
resistance to dictionary based attacks is improved; this work
also serves to further validate our framework. We also report
on usability outcomes from the policies over two recall study
sessions. The ethical aspects of the study were IRB approved.
A. Blacklist Policy Design
For the blacklist policy we created a dictionary consisting
of the representative gestures from the largest 20 clusters
of pass-gestures in the first study. We presented them to
participants and informed them they could not use these
gestures as their pass-gesture. We enforced this by testing
creation pass-gestures against the dictionary and generating
a policy violation error message if there was a match; this
policy explicitly checked for compliance. The dictionary is
only shown during the pass-gesture creation phase.
B. Consolidated Policy Design
The consolidated policy design used the full set of clusters
from the first study. We ordered the clusters by size and
extracted the central representative gestures. We then traversed
the ordered list to create a consolidated set of clusters by
matching each subsequent gesture against the set of those
already examined (using Protractor and the first study EER
value of 1.25). In the case of a match, the list cluster was
merged with the one in the consolidated set. If there was no
match, the list cluster was added to the set. After examining all
original clusters, we produced a consolidated dictionary from
the 20 largest clusters in the consolidated set. This process
aimed to produce a dictionary with minimal replication by
merging small clusters of similar gestures to create a more
representative set of final clusters and gestures. Beyond these
differences in dictionary generation, the consolidated policy
was identical to the blacklist policy in how it was presented.
C. Lexical Policy Design
The lexical policy displayed words, which users can update,
during pass-gesture creation and indicated participants can
use these terms to inspire their gestures. The words are
shown only during the initial gesture creation and not stored
with the gesture templates or intended to serve as mnemonic
cues or “gesture hints.” The policy resembles prior gesture
password policies [21] in some ways: it is not enforceable
and seeks to provide open-ended guidance for creating diverse
or unique gestures. It differs by presenting semantic content
rather than guidance or advice. For this policy we constructed
a dictionary of sixty English words starting from a combined
set of 3000 monosyllabic [30] and 3000 disyllabic [31] words
rated for imageability, a construct which captures how easily
a given word elicits or evokes a mental image or picture
of what it refers to. While this clearly relates to the idea
that words may inspire gestures, the relationship is hard to
predict. High imageability words might lead to a large number
of similar gestures (e.g., all gestures for “ice-cream” might
be frosty cones), while low imageability words might have
more diversity, as users think of different things, or might
poorly support the task by failing to inspire gestures at all.
Consequently, our dictionary was built from a spread of words:
20 words from the top end of the imageability scale, 20 words
from the center of the scale and 20 words from the bottom
of the scale. We also filtered words by further criteria to
ensure they avoided extremes of affect [35] and were widely
known [34], [33]; see Table V for full details.
D. User Study Design
This study was largely similar to first study; it used MTurk,
ran on a website, required completion on a mobile device and
used the same Protractor gesture recognizer. In addition to the
introduction of the four policy conditions, there were a number
of differences: Protractor was adjusted to reflect the first study
EERs with an elevated match threshold of 1.25 – we kept this
low threshold to maintain our ability to capture the broadest
range of possible gestures; we introduced a gesture practice
phase, common in similar studies [36]; we replaced the attack
gesture task, due to its impact on recall rates, with a typical
TABLE VWORDS SETS USED IN LEXICAL POLICY – REPRESENTATIVE EXAMPLES
AND DESCRIPTIVE STATISTICS (μ: MEAN, σ: STANDARD DEVIATION)
Imageability Level High Medium LowExample words Rug, Boat Cruise, Plot Echo, UnionMeasure (units) μ σ μ σ μ σImageability Rating (0-7) [30], [31] 6.59 0.23 4.79 0.99 3.83 0.72Concreteness Rating (0-5) [32] 4.9 0.13 3.72 0.73 2.83 0.66Prevalence (z-score) [33] 2.4 0.1 2.42 0.08 2.44 0.12Age of acquisition (years) [34] 4.26 0.59 7.42 1.61 7.75 1.23Valance Rating (0-7) [35] 5.66 0.55 5.6 0.56 5.54 0.49Arousal Rating (0-7) [35] 3.78 0.45 3.76 0.53 3.73 0.51Dominance Rating (0-7) [35] 5.72 0.46 5.67 0.38 5.64 0.5
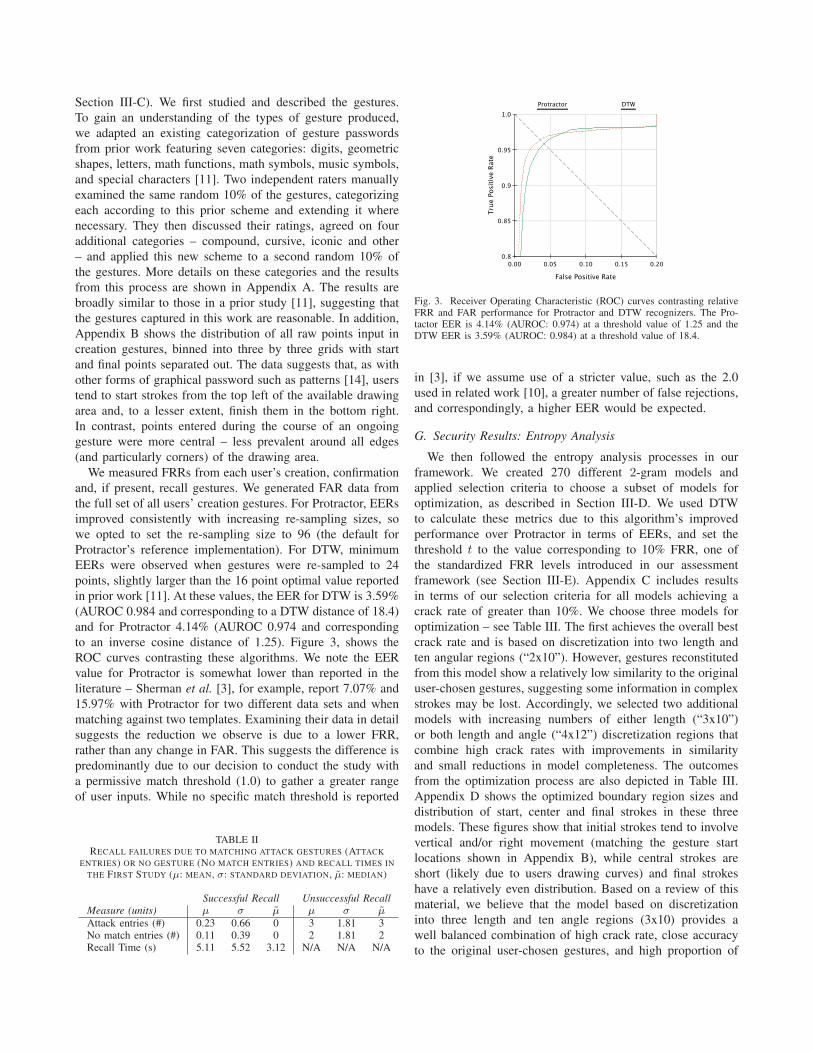
(a) Blacklist (b) Consolidated (c) Lexical
Fig. 6. The second study on a Samsung Galaxy 8 Android mobile phonein Google Chrome. Blacklist and Consolidated policies presenting banneddictionary gestures (a), (b). Lexical policy with the term “shadow” displayedto inspire gestures; it can be changed via the bottom left button (c). Both thegesture dictionary and lexical word disappear as soon as a user’s finger liftsfrom the screen during pass-gesture creation; neither is shown again.
memory game distracter task and; there was a follow-up recall
session 24-72 hours after the initial session – a recall period
similar to that used in prior work [14] to reflect real-world
smart phone unlocking frequencies. For this more involved
study, participants received 1 USD for completion of the first
session and 0.5 USD for completion of the second session.
Details of the study structure are described below; for brevity,
we omit details that replicate those in the first study.
Study instructions were similar to the first study – they were
modified to reflect the revised study structure and included
a brief description of the policy; each participant completed
only one policy condition. Although participants did not create
attack-gestures, we retained this section of the instructions to
motivate participants to create stronger gesture passwords. In
the baseline policy condition, creation and confirmation of the
pass-gesture proceeded identically to the first study. In the
blacklist and consolidated policy conditions, participants were
shown the gesture dictionary on the password creation screen
and informed they cannot use these gestures; all creation pass-
gestures were tested against the dictionary. If there was a
match, participants received a policy error message and needed
to restart the pass-gesture creation process. In the lexical
policy condition, the creation screen prominently displayed a
word, the instruction to use this word to inspire their gesture,
and the ability to change this word to another one. The first
presented word was determined by the participant ID number
(from the database logging the study results) in order to more
evenly balance initial word presentation. Changed words were
delivered in a random order. Participants were able to change
the word multiple times. Figure 6 shows all policy interfaces.
After confirming their pass-gestures, participants practiced
them 10 times. Gestures during practice were matched against
creation and confirmation gestures and feedback as to whether
they matched was provided to users after each gesture entry.
Success was not mandated. Following prior study designs [14],
we then had participants complete a distracter task to wipe
their short term memory: they played a color matching game
in which they flipped over pairs of cards looking for similar
colors. The study session finished with a recall task and closing
feedback that was identical to the first study. Those participants
who successfully recalled their gestures within five attempts
were invited back to a second recall session. This was achieved
via the bonus feature of MTurk that allows the owners of a
task to send an email and provide an additional payment to
workers who complete their task. The email was sent 24 hours
after completion of the study and included a link and a QR
code for the recall study. The follow up task was a single
recall test, identical in structure to the initial recall test. The
link expired after 48 hours of receiving the invite.
E. Measures
We measured all data captured in the first study. In addition,
we logged the number of practice gestures participants cor-
rectly matched against their creation or confirmation templates
and a new set of recall data for participants who completed the
second session. For participants in the blacklist and consoli-
dated policies we additionally logged the number of times they
matched the dictionary gestures during pass-gesture creation
while in the lexical policy we logged the lexical cue displayed
when they created their gesture, and the number of times they
changed this cue.
F. Usability Results
1) Demographics: In total, 4000 unique US based MTurk
workers completed the study: 1000/policy. They were predom-
inantly white (65.1%), black or African American (11.4%),
Hispanic (9.7%) or Asian (7.8%) and 18-24 (23.5%), 25-34
(48.6%) or 35-44 (19.5%) years old. Education level (post-
graduate (11.7%), college (49.2%), high school level (37%))
and profession were diverse; 11% were students. Participants
completed the study tasks on the first day (from the start of
gesture creation until the final gesture recall) in a median of
132 seconds, and the gesture password recall task (equivalent
to the recall time measure, see section IV-C) on the second
day in a median of 4 seconds; the hourly compensation rates
were 27 USD per hour and 450 USD per hour respectively.
2) Setup, Participation and Recall: Usability measures are
summarized in Table VI while participation and recall rates
are in Table VII. For the majority of measures, the data was
homogeneous and exhibited strong positive skews; accordingly
we applied non-parametric testing. Kruskal-Wallis tests on
Setup Time (χ2 = 1076.5, p < 0.001), Day 1 Recall
Time (χ2 = 133.15, p < 0.001) and Day 2 Recall Time
(χ2 = 34.525, p < 0.001) revealed significant differences.
Bonferroni corrected post-hoc Wilcoxon tests on these mea-
sures revealed the following comparisons to be significant: all
differences in Setup Time (at p < 0.001); all bar between
baseline and lexical in Day 1 Recall Time (at p < 0.003) and;
between baseline-blacklist, baseline-consolidated and lexical-
consolidated in Day 2 Recall Time (at p < 0.003). Recall
Attempts did not vary on day 1 (χ2(2) = 5.66, p = 0.129)
or day 2 (χ2(2) = 4.43, p = 0.22). Bonferroni corrected
Chi-squared tests of independence revealed the following
differences in participation and recall rates: the consolidated
condition recorded reduced Day 1 Recall Rate compared to
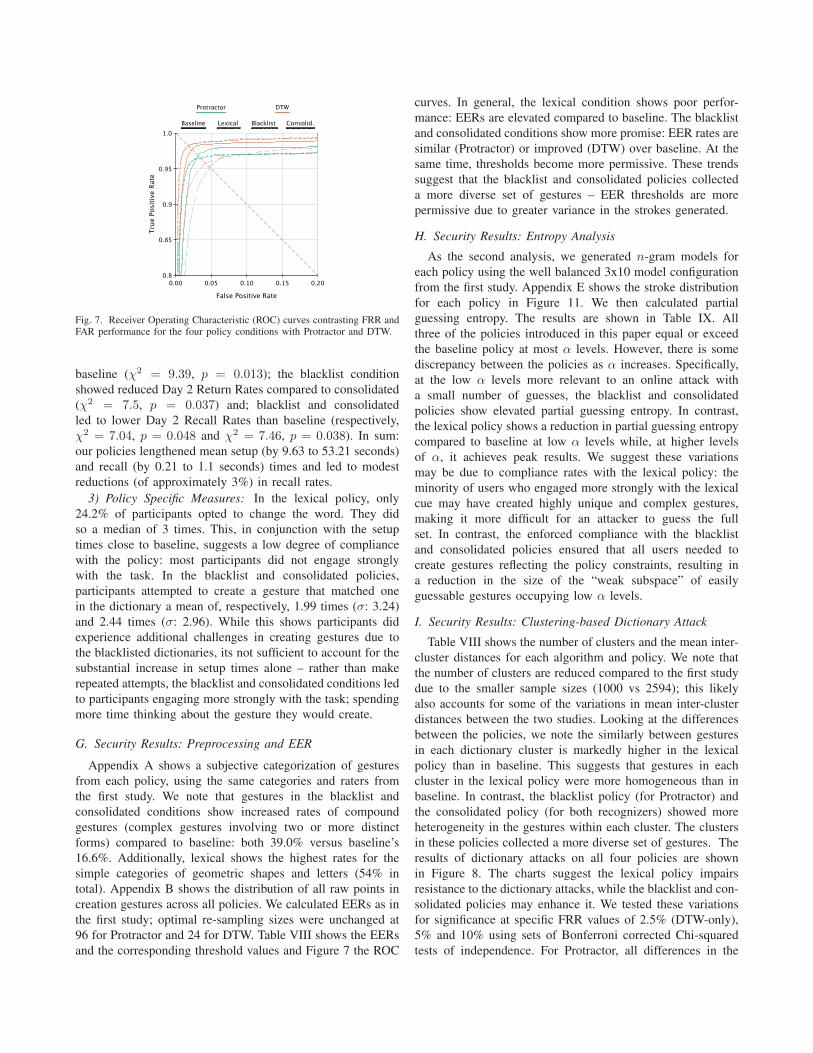
Fig. 7. Receiver Operating Characteristic (ROC) curves contrasting FRR andFAR performance for the four policy conditions with Protractor and DTW.
baseline (χ2 = 9.39, p = 0.013); the blacklist condition
showed reduced Day 2 Return Rates compared to consolidated
(χ2 = 7.5, p = 0.037) and; blacklist and consolidated
led to lower Day 2 Recall Rates than baseline (respectively,
χ2 = 7.04, p = 0.048 and χ2 = 7.46, p = 0.038). In sum:
our policies lengthened mean setup (by 9.63 to 53.21 seconds)
and recall (by 0.21 to 1.1 seconds) times and led to modest
reductions (of approximately 3%) in recall rates.
3) Policy Specific Measures: In the lexical policy, only
24.2% of participants opted to change the word. They did
so a median of 3 times. This, in conjunction with the setup
times close to baseline, suggests a low degree of compliance
with the policy: most participants did not engage strongly
with the task. In the blacklist and consolidated policies,
participants attempted to create a gesture that matched one
in the dictionary a mean of, respectively, 1.99 times (σ: 3.24)
and 2.44 times (σ: 2.96). While this shows participants did
experience additional challenges in creating gestures due to
the blacklisted dictionaries, its not sufficient to account for the
substantial increase in setup times alone – rather than make
repeated attempts, the blacklist and consolidated conditions led
to participants engaging more strongly with the task; spending
more time thinking about the gesture they would create.
G. Security Results: Preprocessing and EER
Appendix A shows a subjective categorization of gestures
from each policy, using the same categories and raters from
the first study. We note that gestures in the blacklist and
consolidated conditions show increased rates of compound
gestures (complex gestures involving two or more distinct
forms) compared to baseline: both 39.0% versus baseline’s
16.6%. Additionally, lexical shows the highest rates for the
simple categories of geometric shapes and letters (54% in
total). Appendix B shows the distribution of all raw points in
creation gestures across all policies. We calculated EERs as in
the first study; optimal re-sampling sizes were unchanged at
96 for Protractor and 24 for DTW. Table VIII shows the EERs
and the corresponding threshold values and Figure 7 the ROC
curves. In general, the lexical condition shows poor perfor-
mance: EERs are elevated compared to baseline. The blacklist
and consolidated conditions show more promise: EER rates are
similar (Protractor) or improved (DTW) over baseline. At the
same time, thresholds become more permissive. These trends
suggest that the blacklist and consolidated policies collected
a more diverse set of gestures – EER thresholds are more
permissive due to greater variance in the strokes generated.
H. Security Results: Entropy Analysis
As the second analysis, we generated n-gram models for
each policy using the well balanced 3x10 model configuration
from the first study. Appendix E shows the stroke distribution
for each policy in Figure 11. We then calculated partial
guessing entropy. The results are shown in Table IX. All
three of the policies introduced in this paper equal or exceed
the baseline policy at most α levels. However, there is some
discrepancy between the policies as α increases. Specifically,
at the low α levels more relevant to an online attack with
a small number of guesses, the blacklist and consolidated
policies show elevated partial guessing entropy. In contrast,
the lexical policy shows a reduction in partial guessing entropy
compared to baseline at low α levels while, at higher levels
of α, it achieves peak results. We suggest these variations
may be due to compliance rates with the lexical policy: the
minority of users who engaged more strongly with the lexical
cue may have created highly unique and complex gestures,
making it more difficult for an attacker to guess the full
set. In contrast, the enforced compliance with the blacklist
and consolidated policies ensured that all users needed to
create gestures reflecting the policy constraints, resulting in
a reduction in the size of the “weak subspace” of easily
guessable gestures occupying low α levels.
I. Security Results: Clustering-based Dictionary Attack
Table VIII shows the number of clusters and the mean inter-
cluster distances for each algorithm and policy. We note that
the number of clusters are reduced compared to the first study
due to the smaller sample sizes (1000 vs 2594); this likely
also accounts for some of the variations in mean inter-cluster
distances between the two studies. Looking at the differences
between the policies, we note the similarly between gestures
in each dictionary cluster is markedly higher in the lexical
policy than in baseline. This suggests that gestures in each
cluster in the lexical policy were more homogeneous than in
baseline. In contrast, the blacklist policy (for Protractor) and
the consolidated policy (for both recognizers) showed more
heterogeneity in the gestures within each cluster. The clusters
in these policies collected a more diverse set of gestures. The
results of dictionary attacks on all four policies are shown
in Figure 8. The charts suggest the lexical policy impairs
resistance to the dictionary attacks, while the blacklist and con-
solidated policies may enhance it. We tested these variations
for significance at specific FRR values of 2.5% (DTW-only),
5% and 10% using sets of Bonferroni corrected Chi-squared
tests of independence. For Protractor, all differences in the

TABLE VIUSABILITY RESULTS FROM THE SECOND STUDY (μ: MEAN, σ: STANDARD DEVIATION, μ: MEDIAN). TABLE SHOWS # SETUP CANCELS (SC), # CONFIRM
FAILURES (CF), SETUP TIME (S) (ST), # PRACTICE MATCHES (PM), DAY 1 RECALL TIME (S) (D1-RT), # DAY 1 RECALL ATTEMPTS (D1-RA), DAY 2RECALL TIME (S) (D1-RT) AND # DAY 2 RECALL ATTEMPTS (D1-RA) FOR ALL POLICIES.
Baseline Lexical Blacklist ConsolidatedMeasure μ σ μ μ σ μ μ σ μ μ σ μ
SC 0.78 2.55 0.0 0.81 1.76 0.0 0.31 1.22 0.0 0.32 1.22 0.0
CF 0.2 0.62 0.0 0.25 0.64 0.0 0.27 0.61 0.0 0.35 0.7 0.0
ST 29.48 41.21 17.26 39.11 37.83 27.87 67.35 69.57 48.96 82.69 94.01 59.64
PM 9.33 1.69 10.0 9.14 1.94 10.0 8.99 2.14 10.0 8.94 2.17 10.0
D1-RT 3.03 3.25 2.13 3.24 3.53 2.29 3.54 4.03 2.58 3.92 3.85 2.8
D1-RA 1.08 0.4 1.0 1.12 0.52 1.0 1.07 0.36 1.0 1.09 0.41 1.0
D2-RT 5.13 5.4 3.55 5.61 5.88 3.7 6.86 11.63 4.09 6.23 6.01 4.23
D2-RA 1.22 0.61 1.0 1.25 0.63 1.0 1.27 0.62 1.0 1.29 0.71 1.0
performance of clustering dictionary attack were significant (at
p ≤ 0.0014 or lower, χ2 = 13.6 to 149.32) except between
blacklist and consolidated (all p ≥ 0.27, χ2 = 0.78 to 4.02)
and between baseline and consolidated at the 5% FRR level
(p = 0.2, χ2 = 4.57). Data for DTW tells a similar story.
All differences were significant except between blacklist and
consolidated (all p = 1). Blacklist significantly improved over
baseline at the 5% FRR level (p = 0.029, χ2 = 7.95) and all
other significant differences were at p < 0.001 (χ2 = 17.48to 609.9). To provide some specifics: using DTW and at the
11.54% FRR level derived from prior work and discussed in
the first study, the best performing policy is consolidated. The
dictionary attack cracks 14.93% of gestures generated under
the consolidated policy, an improvement of 30.69% over the
21.54% cracked in the baseline condition at the same FRR.
We conclude our blacklist and consolidated policies improve
the security of gesture passwords, while our lexical policy
reduces it. A possible explanation is that the lexical policy
does not require compliance, while it is mandated in other
two policies, ensuring that participants can not use one of the
blocked gestures. In addition, participants generated relatively
simple (see Appendix A) and homogeneous (see Table VIII)
gestures with the lexical policy. We also note the lack of
significant security improvements with the consolidated policy
compared to the blacklist policy suggests that this more
comprehensive set of restrictions on gestures may only provide
marginal benefits. Finally, we also note the results are aligned
with those from the first study: DTW outperforms Protractor
by offering an increased resistance to dictionary attacks.
TABLE VIIPARTICIPATION AND RECALL RATES IN THE SECOND STUDY; 500
PARTICIPANTS STARTED DAY 1 IN EACH POLICY. ALL PROPORTIONS
SHOWN NUMERICALLY, AS % AND WITH CONFIDENCE INTERVALS (CI).
Day 1 Day 2Recall Rate Participants Recall Rate(#, %, CI) (#, %, CI) (#, %, CI)
Baseline1000,983, 98.3%, 570, 57.98%, 559, 98.07%,
97.49%-99.1% 54.9%-61.07% 96.94%-99.19%
Lexical1000,977, 97.7%, 546, 55.88%, 526, 96.33%,96.77%-98.62% 52.77%-58.99% 94.76%-97.91%
Blacklist1000,969, 96.9%, 516, 53.25%, 490, 94.96%,95.82%-97.97% 50.1%-56.39% 93.07%-96.84%
Consolidated1000,959, 95.9%, 571, 59.54%, 542, 94.92%,94.67%-97.12% 56.43%-62.64% 93.12%-96.72%
Fig. 8. Crack rates in each policy using Protractor and DTW dictionaries.
VI. DISCUSSION
By applying the proposed framework to the first study,
we made two integral observations: (1) EERs alone cannot
adequately represent the security of gesture passwords, often
overestimating their security, and (2) our clustering-based
dictionary attack is highly effective, and many baseline gesture
passwords are vulnerable to online attacks due to the biased
ways in which people select easy-to-draw (simple) gestures.
Password policies may be able to mitigate these biases.
However, designing policies is challenging and characterized
by trade-offs; increasing security reduces usability [37]. Our
three gesture policy designs sought to improve security while
minimizing costs to usability through two different strategies:
the lexical policy sought to inspire and the blacklist and con-
solidated policies to restrict. The lexical policy maintained us-
ability, but reduced security. A major problem was compliance;
behavioral data (in terms of setup time and word update rate)
suggest participants did not engage with the task. Alternatively,
the inherent imageability [30] of words may have led them to
create homogeneous forms – this assertion is backed up by the
high similarity of gestures within each cluster (see Table VIII)
and data from the qualitative categorization of the gestures
that indicates the lexical policy led to a high proportion of
gestures based on simple shapes and letters – see Appendix A.
On the other hand, the blacklist and consolidated policies
enforced compliance and improved security at the cost of
increased setup and recall times. This may be due to increased
heterogeneity of the gestures: in qualitative categorization,
they led to high rates of compound categorizations, referring
to gestures with two or more elements, that we suggest will
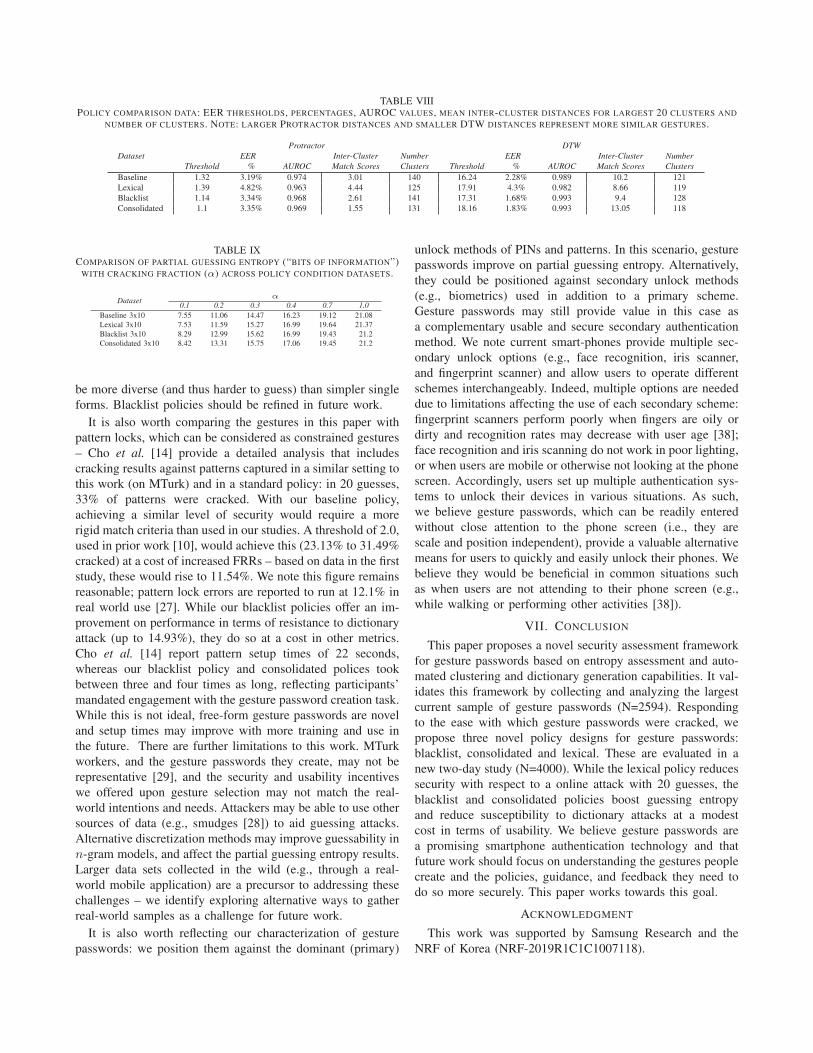
TABLE VIIIPOLICY COMPARISON DATA: EER THRESHOLDS, PERCENTAGES, AUROC VALUES, MEAN INTER-CLUSTER DISTANCES FOR LARGEST 20 CLUSTERS AND
NUMBER OF CLUSTERS. NOTE: LARGER PROTRACTOR DISTANCES AND SMALLER DTW DISTANCES REPRESENT MORE SIMILAR GESTURES.
DatasetProtractor DTW
EER Inter-Cluster Number EER Inter-Cluster NumberThreshold % AUROC Match Scores Clusters Threshold % AUROC Match Scores Clusters
Baseline 1.32 3.19% 0.974 3.01 140 16.24 2.28% 0.989 10.2 121
Lexical 1.39 4.82% 0.963 4.44 125 17.91 4.3% 0.982 8.66 119
Blacklist 1.14 3.34% 0.968 2.61 141 17.31 1.68% 0.993 9.4 128
Consolidated 1.1 3.35% 0.969 1.55 131 18.16 1.83% 0.993 13.05 118
TABLE IXCOMPARISON OF PARTIAL GUESSING ENTROPY (“BITS OF INFORMATION”)
WITH CRACKING FRACTION (α) ACROSS POLICY CONDITION DATASETS.
Datasetα
0.1 0.2 0.3 0.4 0.7 1.0Baseline 3x10 7.55 11.06 14.47 16.23 19.12 21.08
Lexical 3x10 7.53 11.59 15.27 16.99 19.64 21.37
Blacklist 3x10 8.29 12.99 15.62 16.99 19.43 21.2
Consolidated 3x10 8.42 13.31 15.75 17.06 19.45 21.2
be more diverse (and thus harder to guess) than simpler single
forms. Blacklist policies should be refined in future work.
It is also worth comparing the gestures in this paper with
pattern locks, which can be considered as constrained gestures
– Cho et al. [14] provide a detailed analysis that includes
cracking results against patterns captured in a similar setting to
this work (on MTurk) and in a standard policy: in 20 guesses,
33% of patterns were cracked. With our baseline policy,
achieving a similar level of security would require a more
rigid match criteria than used in our studies. A threshold of 2.0,
used in prior work [10], would achieve this (23.13% to 31.49%
cracked) at a cost of increased FRRs – based on data in the first
study, these would rise to 11.54%. We note this figure remains
reasonable; pattern lock errors are reported to run at 12.1% in
real world use [27]. While our blacklist policies offer an im-
provement on performance in terms of resistance to dictionary
attack (up to 14.93%), they do so at a cost in other metrics.
Cho et al. [14] report pattern setup times of 22 seconds,
whereas our blacklist policy and consolidated polices took
between three and four times as long, reflecting participants’
mandated engagement with the gesture password creation task.
While this is not ideal, free-form gesture passwords are novel
and setup times may improve with more training and use in
the future. There are further limitations to this work. MTurk
workers, and the gesture passwords they create, may not be
representative [29], and the security and usability incentives
we offered upon gesture selection may not match the real-
world intentions and needs. Attackers may be able to use other
sources of data (e.g., smudges [28]) to aid guessing attacks.
Alternative discretization methods may improve guessability in
n-gram models, and affect the partial guessing entropy results.
Larger data sets collected in the wild (e.g., through a real-
world mobile application) are a precursor to addressing these
challenges – we identify exploring alternative ways to gather
real-world samples as a challenge for future work.
It is also worth reflecting our characterization of gesture
passwords: we position them against the dominant (primary)
unlock methods of PINs and patterns. In this scenario, gesture
passwords improve on partial guessing entropy. Alternatively,
they could be positioned against secondary unlock methods
(e.g., biometrics) used in addition to a primary scheme.
Gesture passwords may still provide value in this case as
a complementary usable and secure secondary authentication
method. We note current smart-phones provide multiple sec-
ondary unlock options (e.g., face recognition, iris scanner,
and fingerprint scanner) and allow users to operate different
schemes interchangeably. Indeed, multiple options are needed
due to limitations affecting the use of each secondary scheme:
fingerprint scanners perform poorly when fingers are oily or
dirty and recognition rates may decrease with user age [38];
face recognition and iris scanning do not work in poor lighting,
or when users are mobile or otherwise not looking at the phone
screen. Accordingly, users set up multiple authentication sys-
tems to unlock their devices in various situations. As such,
we believe gesture passwords, which can be readily entered
without close attention to the phone screen (i.e., they are
scale and position independent), provide a valuable alternative
means for users to quickly and easily unlock their phones. We
believe they would be beneficial in common situations such
as when users are not attending to their phone screen (e.g.,
while walking or performing other activities [38]).
VII. CONCLUSION
This paper proposes a novel security assessment framework
for gesture passwords based on entropy assessment and auto-
mated clustering and dictionary generation capabilities. It val-
idates this framework by collecting and analyzing the largest
current sample of gesture passwords (N=2594). Responding
to the ease with which gesture passwords were cracked, we
propose three novel policy designs for gesture passwords:
blacklist, consolidated and lexical. These are evaluated in a
new two-day study (N=4000). While the lexical policy reduces
security with respect to a online attack with 20 guesses, the
blacklist and consolidated policies boost guessing entropy
and reduce susceptibility to dictionary attacks at a modest
cost in terms of usability. We believe gesture passwords are
a promising smartphone authentication technology and that
future work should focus on understanding the gestures people
create and the policies, guidance, and feedback they need to
do so more securely. This paper works towards this goal.
ACKNOWLEDGMENT
This work was supported by Samsung Research and the
NRF of Korea (NRF-2019R1C1C1007118).

REFERENCES
[1] S. Uellenbeck, M. Durmuth, C. Wolf, and T. Holz, “Quantifyingthe security of graphical passwords: The case of android unlockpatterns,” in Proceedings of the 2013 ACM SIGSAC Conference onComputer & Communications Security, ser. CCS ’13. NewYork, NY, USA: ACM, 2013, pp. 161–172. [Online]. Available:http://doi.acm.org/10.1145/2508859.2516700
[2] H. Kim and J. H. Huh, “PIN selection policies: Are they reallyeffective?” Computers & Security, vol. 31, no. 4, 2012.
[3] M. Sherman, G. Clark, Y. Yang, S. Sugrim, A. Modig, J. Lindqvist,A. Oulasvirta, and T. Roos, “User-generated free-form gestures forauthentication: Security and memorability,” in Proceedings of the 12thAnnual International Conference on Mobile Systems, Applications, andServices, ser. MobiSys ’14. New York, NY, USA: ACM, 2014, pp. 176–189. [Online]. Available: http://doi.acm.org/10.1145/2594368.2594375
[4] A. De Luca, E. von Zezschwitz, N. D. H. Nguyen, M.-E. Maurer,E. Rubegni, M. P. Scipioni, and M. Langheinrich, “Back-of-deviceauthentication on smartphones,” in Proceedings of the SIGCHIConference on Human Factors in Computing Systems, ser. CHI ’13.New York, NY, USA: ACM, 2013, pp. 2389–2398. [Online]. Available:http://doi.acm.org/10.1145/2470654.2481330
[5] C. Liu, G. D. Clark, and J. Lindqvist, “Where usability andsecurity go hand-in-hand: Robust gesture-based authentication formobile systems,” in Proceedings of the 2017 CHI Conferenceon Human Factors in Computing Systems, ser. CHI ’17. NewYork, NY, USA: ACM, 2017, pp. 374–386. [Online]. Available:http://doi.acm.org/10.1145/3025453.3025879
[6] A. Pirhonen, S. Brewster, and C. Holguin, “Gestural and audiometaphors as a means of control for mobile devices,” in Proceedings ofthe SIGCHI Conference on Human Factors in Computing Systems, ser.CHI ’02. New York, NY, USA: ACM, 2002, pp. 291–298. [Online].Available: http://doi.acm.org/10.1145/503376.503428
[7] T. Nguyen and N. Memon, “Tap-based user authentication forsmartwatches,” Computers & Security, vol. 78, pp. 174 – 186,2018. [Online]. Available: http://www.sciencedirect.com/science/article/pii/S0167404818303778
[8] A. Oulasvirta, S. Tamminen, V. Roto, and J. Kuorelahti, “Interactionin 4-second bursts: The fragmented nature of attentional resourcesin mobile hci,” in Proceedings of the SIGCHI Conference onHuman Factors in Computing Systems, ser. CHI ’05. NewYork, NY, USA: ACM, 2005, pp. 919–928. [Online]. Available:http://doi.acm.org/10.1145/1054972.1055101
[9] N. Sae-Bae, K. Ahmed, K. Isbister, and N. Memon, “Biometric-richgestures: A novel approach to authentication on multi-touch devices,” inProceedings of the SIGCHI Conference on Human Factors in ComputingSystems, ser. CHI ’12. New York, NY, USA: ACM, 2012, pp. 977–986.[Online]. Available: http://doi.acm.org/10.1145/2207676.2208543
[10] Y. Yang, G. D. Clark, J. Lindqvist, and A. Oulasvirta, “Free-formgesture authentication in the wild,” in Proceedings of the 2016 CHIConference on Human Factors in Computing Systems, ser. CHI ’16.New York, NY, USA: ACM, 2016, pp. 3722–3735. [Online]. Available:http://doi.acm.org/10.1145/2858036.2858270
[11] C. Liu, G. D. Clark, and J. Lindqvist, “Guessing attacks on user-generated gesture passwords,” Proc. ACM Interact. Mob. WearableUbiquitous Technol., vol. 1, no. 1, pp. 3:1–3:24, Mar. 2017. [Online].Available: http://doi.acm.org/10.1145/3053331
[12] S. Komanduri, R. Shay, P. G. Kelley, M. L. Mazurek, L. Bauer,N. Christin, L. F. Cranor, and S. Egelman, “Of passwords and people:Measuring the effect of password-composition policies,” in Proceedingsof the SIGCHI Conference on Human Factors in Computing Systems,ser. CHI ’11. New York, NY, USA: ACM, 2011, pp. 2595–2604.[Online]. Available: http://doi.acm.org/10.1145/1978942.1979321
[13] J. Bonneau, S. Preibusch, and R. Anderson, “A birthday present everyeleven wallets? the security of customer-chosen banking pins,” in Finan-cial Cryptography and Data Security, A. D. Keromytis, Ed. Berlin,Heidelberg: Springer Berlin Heidelberg, 2012, pp. 25–40.
[14] G. Cho, J. H. Huh, J. Cho, S. Oh, Y. Song, and H. Kim, “Syspal: System-guided pattern locks for android,” in 2017 IEEE Symposium on Securityand Privacy (SP). IEEE, May 2017, pp. 338–356.
[15] Y. Li, “Protractor: A fast and accurate gesture recognizer,” inProceedings of the SIGCHI Conference on Human Factors in ComputingSystems, ser. CHI ’10. New York, NY, USA: ACM, 2010, pp. 2169–2172. [Online]. Available: http://doi.acm.org/10.1145/1753326.1753654
[16] E. M. Taranta II, A. Samiei, M. Maghoumi, P. Khaloo, C. R. Pittman,and J. J. LaViola Jr., “Jackknife: A reliable recognizer with fewsamples and many modalities,” in Proceedings of the 2017 CHIConference on Human Factors in Computing Systems, ser. CHI ’17.New York, NY, USA: ACM, 2017, pp. 5850–5861. [Online]. Available:http://doi.acm.org/10.1145/3025453.3026002
[17] A. Sahami Shirazi, P. Moghadam, H. Ketabdar, and A. Schmidt,“Assessing the vulnerability of magnetic gestural authentication tovideo-based shoulder surfing attacks,” in Proceedings of the SIGCHIConference on Human Factors in Computing Systems, ser. CHI ’12.New York, NY, USA: ACM, 2012, pp. 2045–2048. [Online]. Available:http://doi.acm.org/10.1145/2207676.2208352
[18] A. De Luca, A. Hang, F. Brudy, C. Lindner, and H. Hussmann,“Touch me once and i know it’s you!: Implicit authentication basedon touch screen patterns,” in Proceedings of the SIGCHI Conferenceon Human Factors in Computing Systems, ser. CHI ’12. NewYork, NY, USA: ACM, 2012, pp. 987–996. [Online]. Available:http://doi.acm.org/10.1145/2207676.2208544
[19] S. Komanduri, R. Shay, P. G. Kelley, M. L. Mazurek, L. Bauer,N. Christin, L. F. Cranor, and S. Egelman, “Of passwords and people:Measuring the effect of password-composition policies,” in Proceedingsof the SIGCHI Conference on Human Factors in Computing Systems,ser. CHI ’11. New York, NY, USA: ACM, 2011, pp. 2595–2604.[Online]. Available: http://doi.acm.org/10.1145/1978942.1979321
[20] R. Shay, S. Komanduri, P. G. Kelley, P. G. Leon, M. L. Mazurek,L. Bauer, N. Christin, and L. F. Cranor, “Encountering strongerpassword requirements: User attitudes and behaviors,” in Proceedingsof the Sixth Symposium on Usable Privacy and Security, ser. SOUPS’10. New York, NY, USA: ACM, 2010, pp. 2:1–2:20. [Online].Available: http://doi.acm.org/10.1145/1837110.1837113
[21] G. D. Clark, J. Lindqvist, and A. Oulasvirta, “Composition policies forgesture passwords: User choice, security, usability and memorability,”in 2017 IEEE Conference on Communications and Network Security(CNS). IEEE, Oct 2017, pp. 1–9.
[22] J. Ma, W. Yang, M. Luo, and N. Li, “A study of probabilistic passwordmodels,” in 2014 IEEE Symposium on Security and Privacy, May 2014,pp. 689–704.
[23] L. Anthony and J. O. Wobbrock, “$n-protractor: A fast andaccurate multistroke recognizer,” in Proceedings of Graphics Interface2012, ser. GI ’12. Toronto, Ont., Canada, Canada: CanadianInformation Processing Society, 2012, pp. 117–120. [Online]. Available:http://dl.acm.org/citation.cfm?id=2305276.2305296
[24] D. H. Douglas and T. K. Peucker, “Algorithms for the reduction ofthe number of points required to represent a digitized line or itscaricature,” Cartographica: The International Journal for GeographicInformation and Geovisualization, vol. 10, no. 2, pp. 112–122, 1973.[Online]. Available: https://doi.org/10.3138/FM57-6770-U75U-7727
[25] J. Bonneau, “The science of guessing: Analyzing an anonymized corpusof 70 million passwords,” in Proceedings of the 33rd IEEE Symposiumon Security and Privacy, May 2012, pp. 538–552.
[26] B. J. Frey and D. Dueck, “Clustering by passing messages betweendata points,” Science, vol. 315, no. 5814, pp. 972–976, 2007. [Online].Available: http://science.sciencemag.org/content/315/5814/972
[27] M. Harbach, A. De Luca, and S. Egelman, “The anatomy of smartphoneunlocking: A field study of android lock screens,” in Proceedings ofthe 2016 CHI Conference on Human Factors in Computing Systems,ser. CHI ’16. New York, NY, USA: ACM, 2016, pp. 4806–4817.[Online]. Available: http://doi.acm.org/10.1145/2858036.2858267
[28] S. Cha, S. Kwag, H. Kim, and J. H. Huh, “Boosting theguessing attack performance on android lock patterns with smudgeattacks,” in Proceedings of the 2017 ACM on Asia Conference onComputer and Communications Security, ser. ASIA CCS ’17. NewYork, NY, USA: ACM, 2017, pp. 313–326. [Online]. Available:http://doi.acm.org/10.1145/3052973.3052989
[29] S. T. Haque, M. Wright, and S. Scielzo, “A study of user passwordstrategy for multiple accounts,” in Proceedings of the Third ACMConference on Data and Application Security and Privacy, ser.CODASPY ’13. New York, NY, USA: ACM, 2013, pp. 173–176.[Online]. Available: http://doi.acm.org/10.1145/2435349.2435373
[30] M. J. Cortese and A. Fugett, “Imageability ratings for 3,000monosyllabic words,” Behavior Research Methods, Instruments, &Computers, vol. 36, no. 3, pp. 384–387, Aug 2004. [Online]. Available:https://doi.org/10.3758/BF03195585

[31] J. Schock, M. J. Cortese, and M. M. Khanna, “Imageabilityestimates for 3,000 disyllabic words,” Behavior Research Methods,vol. 44, no. 2, pp. 374–379, Jun 2012. [Online]. Available:https://doi.org/10.3758/s13428-011-0162-0
[32] M. Brysbaert, A. B. Warriner, and V. Kuperman, “Concreteness ratingsfor 40 thousand generally known english word lemmas,” BehaviorResearch Methods, vol. 46, no. 3, pp. 904–911, Sep 2014. [Online].Available: https://doi.org/10.3758/s13428-013-0403-5
[33] M. Brysbaert, P. Mandera, S. F. McCormick, and E. Keuleers,“Word prevalence norms for 62,000 english lemmas,” BehaviorResearch Methods, Jul 2018. [Online]. Available: https://doi.org/10.3758/s13428-018-1077-9
[34] V. Kuperman, H. Stadthagen-Gonzalez, and M. Brysbaert, “Age-of-acquisition ratings for 30,000 english words,” Behavior ResearchMethods, vol. 44, no. 4, pp. 978–990, Dec 2012. [Online]. Available:https://doi.org/10.3758/s13428-012-0210-4
[35] A. B. Warriner, V. Kuperman, and M. Brysbaert, “Norms of valence,arousal, and dominance for 13,915 english lemmas,” Behavior ResearchMethods, vol. 45, no. 4, pp. 1191–1207, Dec 2013. [Online]. Available:https://doi.org/10.3758/s13428-012-0314-x
[36] I. Oakley, J. H. Huh, J. Cho, G. Cho, R. Islam, and H. Kim,“The personal identification chord: A four buttonauthentication systemfor smartwatches,” in Proceedings of the 2018 on Asia Conferenceon Computer and Communications Security, ser. ASIACCS ’18.New York, NY, USA: ACM, 2018, pp. 75–87. [Online]. Available:http://doi.acm.org/10.1145/3196494.3196555
[37] R. Shay, S. Komanduri, A. L. Durity, P. S. Huh, M. L. Mazurek,S. M. Segreti, B. Ur, L. Bauer, N. Christin, and L. F. Cranor, “Canlong passwords be secure and usable?” in Proceedings of the SIGCHIConference on Human Factors in Computing Systems, ser. CHI ’14.New York, NY, USA: ACM, 2014, pp. 2927–2936. [Online]. Available:http://doi.acm.org/10.1145/2556288.2557377
[38] L. Qiu, A. De Luca, I. Muslukhov, and K. Beznosov, “Towardsunderstanding the link between age and smartphone authentication,”in Proceedings of the 2019 CHI Conference on Human Factors inComputing Systems, ser. CHI ’19. New York, NY, USA: ACM,2019, pp. 163:1–163:10. [Online]. Available: http://doi.acm.org/10.1145/3290605.3300393
APPENDIX A
SUBJECTIVE CATEGORIZATION OF GESTURES
Table X reports subjective categorization rates for gestures.
The first seven categories appear in prior work [11], while
the remaining four categories of Compound, Cursive, Iconic
and Other were newly introduced. Compound gestures are
complex, involving at least two or more elements (e.g., a shape
and a letter); cursive gestures involve short sequences of letters
(e.g., hand-writing) and; iconic gestures depict objects (e.g.,
hands and flowers). Other collects any remaining gestures.
TABLE XMEAN SUBJECTIVE CATEGORIZATION RATES FROM TWO INDEPENDENT
RATERS OF GESTURES IN BOTH STUDIES. CATEGORIZATIONS USED A
RANDOM 10% OF FIRST STUDY DATA (260 GESTURES) AND A RANDOM
25% OF EACH POLICY IN THE SECOND STUDY (250 GESTURES), SAMPLES
SELECTED TO BE NUMERICALLY SIMILAR IN SIZE. INTER-RATER
AGREEMENT SCORES (COHEN’S KAPPA) ARE SHOWN IN THE FINAL ROW.THE RIGHTMOST COLUMN REPORTS THE MEAN CATEGORIZATION RATES
FROM BOTH DATA SETS IN [11] FOR REFERENCE.
Category First Study Baseline lexical Blacklist Consolidated Prior work [11]Digit 9.04% 11.20% 7.00% 12.60% 9.20% 9.25%Geometric Shape 22.50% 30.00% 33.80% 20.60% 11.60% 44.90%Letter 22.89% 21.80% 20.20% 11.60% 14.80% 28.45%Math Function 2.89% 3.20% 5.00% 6.60% 9.80% 9.10%Math Symbol 9.81% 2.80% 2.40% 4.80% 4.40% 4.40%Music Symbol 0.96% 0.20% 0.40% 0.00% 0.40% 2.70%Special Character 0.00% 4.80% 1.40% 2.40% 1.20% 2.20%Compound 22.12% 16.60% 14.40% 35.20% 39.00% N/ACursive 4.04% 2.80% 7.60% 3.00% 3.80% N/AIconic 5.19% 6.20% 7.60% 3.00% 5.00% N/AOther 0.58% 0.40% 0.20% 0.20% 0.80% N/A
RaterAgreement N/A
κ = 0.40 κ = 0.29 κ = 0.38 κ = 0.50 κ = 0.44p < .001 p = .003 p < .001 p = .001 p < .001Moderate Fair Fair Moderate Moderate
First study and second study baseline and lexical catego-
rizations are broadly consistent. Second study blacklist and
consolidated policies show reductions in gestures categorized
as geometric shapes and letters and elevated rates for com-
pound categorizations. Compared to prior work (right column),
gesture categorizations show reduced rates for geometric
shapes and letters due to the introduction of new categories
(particularly compound) and a reduced occurrence of math
and music symbols, possibly due to different populations
(university students in [11] versus MTurk workers here).
APPENDIX B
DISTRIBUTION OF GESTURE POINTS IN POLICY
CONDITIONS IN FIRST AND SECOND STUDIES
Figure 9 depicts the distribution of gesture points in both
studies. All results show bias in start and final point locations;
first study data and the second study baseline policy are most
strongly biased (to left corners) in start position and the lexical
policy most evenly distributed in start and final positions.
����������� ������������ ��������
����
���
����
���
������
����
���
����
������
���
��������
����
���
����������
Fig. 9. Distribution of stroke points in user-chosen gestures in both studies.Columns depict start (left), final (right) and all other points (center) whilerows depict data from first study (top) and second study baseline (center-top),lexical (center), blacklist (center-bottom) and consolidated (bottom).
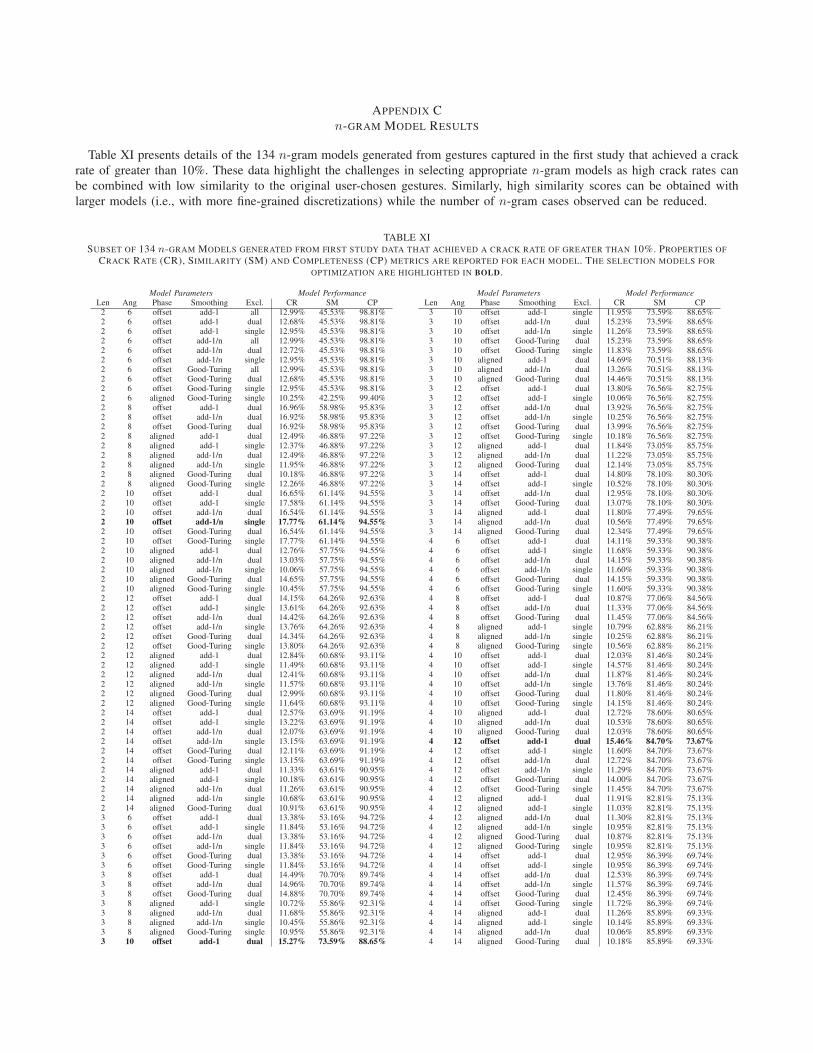
APPENDIX C
n-GRAM MODEL RESULTS
Table XI presents details of the 134 n-gram models generated from gestures captured in the first study that achieved a crack
rate of greater than 10%. These data highlight the challenges in selecting appropriate n-gram models as high crack rates can
be combined with low similarity to the original user-chosen gestures. Similarly, high similarity scores can be obtained with
larger models (i.e., with more fine-grained discretizations) while the number of n-gram cases observed can be reduced.
TABLE XISUBSET OF 134 n-GRAM MODELS GENERATED FROM FIRST STUDY DATA THAT ACHIEVED A CRACK RATE OF GREATER THAN 10%. PROPERTIES OF
CRACK RATE (CR), SIMILARITY (SM) AND COMPLETENESS (CP) METRICS ARE REPORTED FOR EACH MODEL. THE SELECTION MODELS FOR
OPTIMIZATION ARE HIGHLIGHTED IN BOLD.
Model Parameters Model Performance Model Parameters Model PerformanceLen Ang Phase Smoothing Excl. CR SM CP Len Ang Phase Smoothing Excl. CR SM CP
2 6 offset add-1 all 12.99% 45.53% 98.81% 3 10 offset add-1 single 11.95% 73.59% 88.65%2 6 offset add-1 dual 12.68% 45.53% 98.81% 3 10 offset add-1/n dual 15.23% 73.59% 88.65%2 6 offset add-1 single 12.95% 45.53% 98.81% 3 10 offset add-1/n single 11.26% 73.59% 88.65%2 6 offset add-1/n all 12.99% 45.53% 98.81% 3 10 offset Good-Turing dual 15.23% 73.59% 88.65%2 6 offset add-1/n dual 12.72% 45.53% 98.81% 3 10 offset Good-Turing single 11.83% 73.59% 88.65%2 6 offset add-1/n single 12.95% 45.53% 98.81% 3 10 aligned add-1 dual 14.69% 70.51% 88.13%2 6 offset Good-Turing all 12.99% 45.53% 98.81% 3 10 aligned add-1/n dual 13.26% 70.51% 88.13%2 6 offset Good-Turing dual 12.68% 45.53% 98.81% 3 10 aligned Good-Turing dual 14.46% 70.51% 88.13%2 6 offset Good-Turing single 12.95% 45.53% 98.81% 3 12 offset add-1 dual 13.80% 76.56% 82.75%2 6 aligned Good-Turing single 10.25% 42.25% 99.40% 3 12 offset add-1 single 10.06% 76.56% 82.75%2 8 offset add-1 dual 16.96% 58.98% 95.83% 3 12 offset add-1/n dual 13.92% 76.56% 82.75%2 8 offset add-1/n dual 16.92% 58.98% 95.83% 3 12 offset add-1/n single 10.25% 76.56% 82.75%2 8 offset Good-Turing dual 16.92% 58.98% 95.83% 3 12 offset Good-Turing dual 13.99% 76.56% 82.75%2 8 aligned add-1 dual 12.49% 46.88% 97.22% 3 12 offset Good-Turing single 10.18% 76.56% 82.75%2 8 aligned add-1 single 12.37% 46.88% 97.22% 3 12 aligned add-1 dual 11.84% 73.05% 85.75%2 8 aligned add-1/n dual 12.49% 46.88% 97.22% 3 12 aligned add-1/n dual 11.22% 73.05% 85.75%2 8 aligned add-1/n single 11.95% 46.88% 97.22% 3 12 aligned Good-Turing dual 12.14% 73.05% 85.75%2 8 aligned Good-Turing dual 10.18% 46.88% 97.22% 3 14 offset add-1 dual 14.80% 78.10% 80.30%2 8 aligned Good-Turing single 12.26% 46.88% 97.22% 3 14 offset add-1 single 10.52% 78.10% 80.30%2 10 offset add-1 dual 16.65% 61.14% 94.55% 3 14 offset add-1/n dual 12.95% 78.10% 80.30%2 10 offset add-1 single 17.58% 61.14% 94.55% 3 14 offset Good-Turing dual 13.07% 78.10% 80.30%2 10 offset add-1/n dual 16.54% 61.14% 94.55% 3 14 aligned add-1 dual 11.80% 77.49% 79.65%2 10 offset add-1/n single 17.77% 61.14% 94.55% 3 14 aligned add-1/n dual 10.56% 77.49% 79.65%2 10 offset Good-Turing dual 16.54% 61.14% 94.55% 3 14 aligned Good-Turing dual 12.34% 77.49% 79.65%2 10 offset Good-Turing single 17.77% 61.14% 94.55% 4 6 offset add-1 dual 14.11% 59.33% 90.38%2 10 aligned add-1 dual 12.76% 57.75% 94.55% 4 6 offset add-1 single 11.68% 59.33% 90.38%2 10 aligned add-1/n dual 13.03% 57.75% 94.55% 4 6 offset add-1/n dual 14.15% 59.33% 90.38%2 10 aligned add-1/n single 10.06% 57.75% 94.55% 4 6 offset add-1/n single 11.60% 59.33% 90.38%2 10 aligned Good-Turing dual 14.65% 57.75% 94.55% 4 6 offset Good-Turing dual 14.15% 59.33% 90.38%2 10 aligned Good-Turing single 10.45% 57.75% 94.55% 4 6 offset Good-Turing single 11.60% 59.33% 90.38%2 12 offset add-1 dual 14.15% 64.26% 92.63% 4 8 offset add-1 dual 10.87% 77.06% 84.56%2 12 offset add-1 single 13.61% 64.26% 92.63% 4 8 offset add-1/n dual 11.33% 77.06% 84.56%2 12 offset add-1/n dual 14.42% 64.26% 92.63% 4 8 offset Good-Turing dual 11.45% 77.06% 84.56%2 12 offset add-1/n single 13.76% 64.26% 92.63% 4 8 aligned add-1 single 10.79% 62.88% 86.21%2 12 offset Good-Turing dual 14.34% 64.26% 92.63% 4 8 aligned add-1/n single 10.25% 62.88% 86.21%2 12 offset Good-Turing single 13.80% 64.26% 92.63% 4 8 aligned Good-Turing single 10.56% 62.88% 86.21%2 12 aligned add-1 dual 12.84% 60.68% 93.11% 4 10 offset add-1 dual 12.03% 81.46% 80.24%2 12 aligned add-1 single 11.49% 60.68% 93.11% 4 10 offset add-1 single 14.57% 81.46% 80.24%2 12 aligned add-1/n dual 12.41% 60.68% 93.11% 4 10 offset add-1/n dual 11.87% 81.46% 80.24%2 12 aligned add-1/n single 11.57% 60.68% 93.11% 4 10 offset add-1/n single 13.76% 81.46% 80.24%2 12 aligned Good-Turing dual 12.99% 60.68% 93.11% 4 10 offset Good-Turing dual 11.80% 81.46% 80.24%2 12 aligned Good-Turing single 11.64% 60.68% 93.11% 4 10 offset Good-Turing single 14.15% 81.46% 80.24%2 14 offset add-1 dual 12.57% 63.69% 91.19% 4 10 aligned add-1 dual 12.72% 78.60% 80.65%2 14 offset add-1 single 13.22% 63.69% 91.19% 4 10 aligned add-1/n dual 10.53% 78.60% 80.65%2 14 offset add-1/n dual 12.07% 63.69% 91.19% 4 10 aligned Good-Turing dual 12.03% 78.60% 80.65%2 14 offset add-1/n single 13.15% 63.69% 91.19% 4 12 offset add-1 dual 15.46% 84.70% 73.67%2 14 offset Good-Turing dual 12.11% 63.69% 91.19% 4 12 offset add-1 single 11.60% 84.70% 73.67%2 14 offset Good-Turing single 13.15% 63.69% 91.19% 4 12 offset add-1/n dual 12.72% 84.70% 73.67%2 14 aligned add-1 dual 11.33% 63.61% 90.95% 4 12 offset add-1/n single 11.29% 84.70% 73.67%2 14 aligned add-1 single 10.18% 63.61% 90.95% 4 12 offset Good-Turing dual 14.00% 84.70% 73.67%2 14 aligned add-1/n dual 11.26% 63.61% 90.95% 4 12 offset Good-Turing single 11.45% 84.70% 73.67%2 14 aligned add-1/n single 10.68% 63.61% 90.95% 4 12 aligned add-1 dual 11.91% 82.81% 75.13%2 14 aligned Good-Turing dual 10.91% 63.61% 90.95% 4 12 aligned add-1 single 11.03% 82.81% 75.13%3 6 offset add-1 dual 13.38% 53.16% 94.72% 4 12 aligned add-1/n dual 11.30% 82.81% 75.13%3 6 offset add-1 single 11.84% 53.16% 94.72% 4 12 aligned add-1/n single 10.95% 82.81% 75.13%3 6 offset add-1/n dual 13.38% 53.16% 94.72% 4 12 aligned Good-Turing dual 10.87% 82.81% 75.13%3 6 offset add-1/n single 11.84% 53.16% 94.72% 4 12 aligned Good-Turing single 10.95% 82.81% 75.13%3 6 offset Good-Turing dual 13.38% 53.16% 94.72% 4 14 offset add-1 dual 12.95% 86.39% 69.74%3 6 offset Good-Turing single 11.84% 53.16% 94.72% 4 14 offset add-1 single 10.95% 86.39% 69.74%3 8 offset add-1 dual 14.49% 70.70% 89.74% 4 14 offset add-1/n dual 12.53% 86.39% 69.74%3 8 offset add-1/n dual 14.96% 70.70% 89.74% 4 14 offset add-1/n single 11.57% 86.39% 69.74%3 8 offset Good-Turing dual 14.88% 70.70% 89.74% 4 14 offset Good-Turing dual 12.45% 86.39% 69.74%3 8 aligned add-1 single 10.72% 55.86% 92.31% 4 14 offset Good-Turing single 11.72% 86.39% 69.74%3 8 aligned add-1/n dual 11.68% 55.86% 92.31% 4 14 aligned add-1 dual 11.26% 85.89% 69.33%3 8 aligned add-1/n single 10.45% 55.86% 92.31% 4 14 aligned add-1 single 10.14% 85.89% 69.33%3 8 aligned Good-Turing single 10.95% 55.86% 92.31% 4 14 aligned add-1/n dual 10.06% 85.89% 69.33%3 10 offset add-1 dual 15.27% 73.59% 88.65% 4 14 aligned Good-Turing dual 10.18% 85.89% 69.33%

APPENDIX D
n-GRAM STROKE DISTRIBUTIONS IN FIRST STUDY
Figure 10 depicts the stroke distribution in the three n-gram models chosen in the first study. Bias in the start stroke direction
is towards rightwards and downwards, while center strokes tend to be short and final strokes are more likely to involve rightward
motion.
����
������
��� ������������������
������ ������������
������� �
����
������
��� ������������������
���
���� �������������
������� �
����
������
��� ������������������
������ ������������
������� �
������������ ������������ !��� �������
Fig. 10. Distribution of strokes in optimized 2x10 (top row), 3x10 (center row) and 4x12 (bottom row) n-gram models in the first study. Left column showsdata from start strokes, right column shows data from final strokes and all other strokes are shown in the center column. Each figure is divided into thediscretization regions available in the given n-gram model, with the frequency of sub-strokes observed in each region marked in % and by color. Boundaryregions are shown to scale as grey areas for both length and angle. The proportion of strokes used in each region (black text) and boundary (grey text) isshown at the boundary (for angles) and the bottom of each diagram (for lengths).

APPENDIX E
n-GRAM STROKE DISTRIBUTIONS IN SECOND STUDY
Figure 11 depicts stroke distribution in n-gram models generated for all four policies in the second study. Bias in the start
stroke direction is greatest in baseline. Center strokes are short while final strokes tend to be rightward.
"���
�������
����
���
���� �����
���
����������� ��������� ����������
����
�������
����
���
�����
�������
����
�������
����
���
������� �
������
����
�������
����
���
����� ������
������
Fig. 11. Distribution of strokes in baseline (top row), lexical (center-top row) and blacklist (center-bottom row) and consolidated (bottom row) n-gram modelsin the second study. Each model uses the configuration of the optimized 3x10 model from the first study. Left column shows data from start strokes, rightcolumn shows data from final strokes and all other strokes are shown in the center column.