Biometric authentication based on face and gesture recognition
48
BACHELOR THESIS Artificial Intelligence Radboud University Nijmegen Biometric authentication based on face and gesture recognition “Wink twice if it’s you!” Robert-Jan Drenth [email protected] s0815357 Supervisor: Martijn van Otterlo Second assessor: Louis Vuurpijl December 20, 2012
Transcript of Biometric authentication based on face and gesture recognition

BACHELOR THESISArtificial Intelligence
Radboud University Nijmegen
Biometric authenticationbased on
face and gesture recognition“Wink twice if it’s you!”
Robert-Jan [email protected]
s0815357
Supervisor:Martijn van Otterlo
Second assessor:Louis Vuurpijl
December 20, 2012


Abstract
It is possible to fool an authentication system based on face recognition with a picture of aperson’s face. This can be made impossible by introducing gesture recognition to the authenticationprocess. In this thesis an authentication system is investigated that combines face and gesturerecognition by instructing a user to perform a sequence of randomly determined gestures. In thissystem, every image in a stream of camera images is inspected to see if it contains a face. Thisis done by using the Viola-Jones object detection algorithm, which also looks for other regions ofinterest (the eyes and mouth in a face) if a face is found. After that, face and gesture recognitiontakes place based on the results of the Viola-Jones cascades along with the principal componentanalysis algorithm. If the recognised gestures correspond with the given instructions and facerecognition is successful, authentication will succeed. Experiments showed that the Viola-Jonescascades performed their task well. In contrast, the performance of the gesture recognition processwas poor and unreliable, as its performance was dependent on the subject using the system anddifferent lighting conditions. This makes it difficult to use the proposed system and additional workis required to make the system suitable for real world usage.


Contents
1 Introduction 1
1.1 Extending Face Recognition . . . . . . . . . . . . . . . . . . . . . . . . . . . . . . . . 2
1.2 Challenges . . . . . . . . . . . . . . . . . . . . . . . . . . . . . . . . . . . . . . . . . . 2
1.3 Research Questions . . . . . . . . . . . . . . . . . . . . . . . . . . . . . . . . . . . . . 3
2 Methods 5
2.1 Viola-Jones Object Detector . . . . . . . . . . . . . . . . . . . . . . . . . . . . . . . . 5
2.1.1 Integral Image and Rectangle-Features . . . . . . . . . . . . . . . . . . . . . . 6
2.1.2 Computational Costs . . . . . . . . . . . . . . . . . . . . . . . . . . . . . . . . 7
2.2 Principal Component Analysis . . . . . . . . . . . . . . . . . . . . . . . . . . . . . . 8
2.2.1 Mathematical Procedure for PCA . . . . . . . . . . . . . . . . . . . . . . . . 9
2.2.2 Computational Costs . . . . . . . . . . . . . . . . . . . . . . . . . . . . . . . . 10
3 Approach 11
3.1 Defining and Locating Regions of Interest . . . . . . . . . . . . . . . . . . . . . . . . 11
3.2 Face Recognition . . . . . . . . . . . . . . . . . . . . . . . . . . . . . . . . . . . . . . 12
3.3 Gesture Recognition . . . . . . . . . . . . . . . . . . . . . . . . . . . . . . . . . . . . 13
3.4 Training the Program and Gathering Data . . . . . . . . . . . . . . . . . . . . . . . . 15
3.5 Authentication Process . . . . . . . . . . . . . . . . . . . . . . . . . . . . . . . . . . . 16
3.6 Implementation and Technical Details . . . . . . . . . . . . . . . . . . . . . . . . . . 18
4 Experiments & results 21
4.1 Experimental Setup . . . . . . . . . . . . . . . . . . . . . . . . . . . . . . . . . . . . 21
4.1.1 Determining Recognition Rates of Gestures . . . . . . . . . . . . . . . . . . . 21
4.1.2 Authentication Success Rate . . . . . . . . . . . . . . . . . . . . . . . . . . . 22
4.1.3 A Classifier’s Ability to Generalise . . . . . . . . . . . . . . . . . . . . . . . . 23
4.2 Experimental Results . . . . . . . . . . . . . . . . . . . . . . . . . . . . . . . . . . . . 23
4.2.1 Recognition Rates of Gestures . . . . . . . . . . . . . . . . . . . . . . . . . . 24
4.2.2 Results of Authentication Experiments . . . . . . . . . . . . . . . . . . . . . . 28
4.2.3 Results of Generalisation Experiments of Trained Classifiers . . . . . . . . . . 28
4.3 Discussion of Results . . . . . . . . . . . . . . . . . . . . . . . . . . . . . . . . . . . . 30
4.3.1 Finding Regions of Interest . . . . . . . . . . . . . . . . . . . . . . . . . . . . 30
4.3.2 Gesture Recognition . . . . . . . . . . . . . . . . . . . . . . . . . . . . . . . . 31
4.3.3 Face Recognition . . . . . . . . . . . . . . . . . . . . . . . . . . . . . . . . . . 31
4.3.4 Capability to Generalise . . . . . . . . . . . . . . . . . . . . . . . . . . . . . . 32
iii

5 Discussion 335.1 Usability . . . . . . . . . . . . . . . . . . . . . . . . . . . . . . . . . . . . . . . . . . . 335.2 Future Research . . . . . . . . . . . . . . . . . . . . . . . . . . . . . . . . . . . . . . 335.3 Conclusion . . . . . . . . . . . . . . . . . . . . . . . . . . . . . . . . . . . . . . . . . 34
A Experiment Confusion Matrixes 37
iv

Chapter 1
Introduction
Digital security has become a prominent aspect of modern society and some form of authenticationis required for activities that are of any importance. Such activities include online banking andsubmitting governmental forms online, but also customary actions like checking your e-mail oraccessing a personal device like a smart-phone. Such personal devices are literally finding their wayinto the hands of people as they become part of managing everyday life by keeping track of an agendaor providing access to the internet and email (Google and MediaCT, 2011). The information thatcan be accessed with such a device is private and access to it must be regulated and/or protectedlest it be obtained by an unauthorised person who could use it for malevolent purposes. Thereforesome method of authenticating oneself to one’s own devices has become mandatory.
The established way of authentication is “authentication by something you know” which meansthat you authenticate yourself by providing a password, a Personal Identification Number (PIN) ora chosen pattern. There are a number of risks to this way of authentication like forgetting/losingpasswords or people watching over your shoulder as you enter your password. An additional risk isthe use of a single password for multiple applications, because if someone else obtains this passwordthey will be able to access all of the applications. All these dangers combined pose a great securitythreat to your personal data.
Another way of authentication that is much less susceptible to these dangers, if at all, is “au-thentication by something you are” which typically uses biometric data as a form of authentication.Examples of this form of authentication include fingerprint matching (Shihai and Xiangjiang, 2010),retinal scanning (Ortega, Mario, Penedo, Blanco, and Gonzlez, 2006), outer ear image matching(Moreno, Sanchez, and Velez, 1999) and face recognition (Turk and Pentland, 1991; Le, 2011).
From the above-mentioned methods, face recognition is easy to implement, user friendly andcomes at no additional cost in equipment for smart-phones as those already have a built-in camera.This makes face recognition a great candidate to become an alternative method of authentication asopposed to the established password-based methods. Indeed, this type of authentication has alreadybeen extensively researched and various methods have been developed using principal componentanalysis (PCA) (Turk and Pentland, 1991; Yang, Zhang, Frangi, and Yang, 2004), independentcomponent analysis (ICA) (Bartlett, Movellan, and Sejnowski, 2002) or neural networks (Lin,Kung, and Lin, 1997; Le, 2011). Also, its use in combination with a password for securing moneytransactions with a bank has been investigated (Kumar, Kumar, Kumar, and Karthick, 2012).
1
1.1 Extending Face Recognition
Unfortunately, face recognition has been proven to be insecure or at least the implementationin the smart-phone operating system Android, as this implementation also accepts the photo ofa person’s face (Newton, 2011). Obviously this is undesirable as it is not difficult to obtain apicture of someone’s face. Because it is likely that this is not simply a flaw in the aforementionedimplementation, but a more fundamental problem of this method of authentication, a solution tothis problem has to be found.
Luckily a solution exists that is based on a simple principle. Photos are static images, whichmeans that by introducing movement into the authentication process you can ensure that it isimpossible for a person to authenticate as someone else with their picture. When thinking ofintroducing movement the use of intended facial gestures comes to mind in order to do this in awell-defined way. This results in a setting where a person is able to perform a number of facialgestures from a small set, which can be applied in various ways. The intended purpose for its useis as a security check, for which there are two options to achieve this goal.
The first option is to generate a random sequence of gestures which a person must perform whilein the background a face recognition check is being performed. The second option is based on theestablished password-based methods and lets a user determine a sequence of gestures themselveswhich they must perform if they want to authenticate themselves. In such a setup, face recognitioncould be optional, as knowing the sequence of gestures would be sufficient. However, determiningthe sequence of gestures a person is using is probably a lot easier compared to determining a writtenpassword, so if face recognition would be turned off, none of the advantages of biometrics would bepresent. Unfortunately, in the case that face recognition would be turned on it would be possible torecord a video of a person while they perform the required sequence of gestures. It would then bepossible to display this video to the system and gain access in this manner. Of course this can alsobe done with the first option, but due to the fact that the sequence of gestures would be determinedrandomly, there would be too many possibilities to be feasible. It is because of these drawbacksthat the first option is preferred
Also, such a system could be used for creating a hands free interface or as an additional wayfor entering input, as each possible gesture could be linked to a command. For example, in a webbrowser environment a wink with the left eye could stand for ’go to the previous page’, a wink withthe right eye for ’go to the next page’ and tilting your head left or right could respectively standfor ’scroll up’ or ’scroll down’. The idea to use facial gestures for interaction is not new, as it hasbeen previously suggested, both seriously (Algorri and Escobar, 2004) and as a joke when Operaused the very idea of facial gestures for browser control (Opera, 2009). Clearly the idea has beenaround for a while and it is just a matter of time before it finds its way into an application.
1.2 Challenges
In order to create a system which combines face recognition and gesture recognition certain chal-lenges have to be overcome. When the only task that needs to be performed is face recognition, twosteps are sufficient to reach the goal. The first step is to locate a face in a presented image. Afterfinding a face in the image, the second step will follow: comparing the found face to a databaseof faces and find the closest match. When adding gesture recognition to the process, there are anumber of extra steps that have to be performed besides the two required steps for face recognition.
2

The first step is to locate any additional regions of interest (ROI). A ROI is an area in an imagethat contains information that must be further processed. For example, the ROIs that must belocated for face recognition are the faces in an image.
An algorithm that performs these steps can be summarised in three phases:
1. Locate regions of interest - In the first phase the algorithm locates all relevant regions ofinterest (ROIs). First, the face-region must be located and once it has been found, otherROIs (like eyes) must be found within the face-region.
2. Perform face recognition - In the second phase a detected face must be matched with a savedface which must belong to a person that is authorized to access the device.
3. Perform gesture recognition - In the last phase the detected faces and their correspondingROIs are compared and differences are measured in order to determine what gestures aremade.
Now that the problem has been defined at a high level and the required steps have been determined,an implementational solution has to be found to solve it. For each of these steps a lot of research hasalready been performed and various algorithms exist for solving them. For face detection, variousalgorithms have been developed of which a selection has been surveyed by Degtyarev and Seredin(2010) and the recent advances in face detection algorithms by Zhanh and Zhang (2010). The mostextensively discussed by far is the Viola-Jones face detection algorithm (Viola and Jones, 2004)which is based on their object detection algorithm (Viola and Jones, 2001).
Just like face detection, various algorithms have been developed for face recognition whichuse different approaches, including PCA features (also known as Eigenfaces) (Turk and Pent-land, 1991)(Yang, Zhang, Frangi, and Yang, 2004), independent component analysis (ICA) features(Bartlett, Movellan, and Sejnowski, 2002) as well as neural networks (Lin, Kung, and Lin, 1997)(Le,2011).
However, in the area of facial gesture recognition it seems that a lot less fundamental workhas been done and a clear direction has yet to be found. Currently two major directions arebeing explored. The first utilises principal component analysis, which is borrowed from regularface recognition. The second direction investigates the use of support vector machines (SVMs) forclassifying gestures.
There are two main methods possible for using PCA: the first one uses a face as a whole asinput and tries to classify its corresponding Eigenface as displaying a certain gesture or emotion(Banerjee and Sanyal, 2012). The second method that has been explored uses subparts of theface like the eyes or mouth and calculates the corresponding Eigeneyes and Eigenmouths (Algorriand Escobar, 2004). The same method of looking at subparts of the face can be applied whenusing SVMs to classify images (Fazekas and Snta, 2005) after which the individual classificationsare combined for recognising emotion. More recently SVMs have also been applied in order torecognise yes/no gestures as opposed to recognising expressions of emotion (Baltes, Seo, Cheng,Lau, and Anderson, 2011).
1.3 Research Questions
As described in Section 1.2, there are many different possibilities to build the different componentsof an authentication algorithm based on face and gesture recognition. However, when selecting the
3

components for such an algorithm there are certain constraints that must be met in order for itto be practical in use. Perhaps it is stating the obvious, but an authentication system has to bedependable in accepting the right and rejecting the wrong people. This means that any algorithmmust have a high classification performance with a low amount of false positives and false negatives.
Keeping in mind that authentication by face recognition is already in use on smart-phones, it isdesirable that an alternative authentication method should also be fit to run on such devices. Thereis one big constraint when running an application on such a device, which is its limited processingcapabilities. Therefore it is important that potential algorithms have a low computational complex-ity, or at least one that can be scaled to manageable proportions for the available computationalpower. If this turns out to be a difficult constraint to satisfy, an acceptable alternative would be touse other methods to make the process as a whole more efficient. Such methods could be the clevercombining of used algorithms so they complement each other or the construction of a cascade ofclassifiers could be used to reduce the computational requirements.
Lastly, an authentication system should be available for use straight away. This means that ifany form of training is required, it should not take much time for users and they should not berequired to keep training the algorithm. If this constraint is met, the result is that there will notbe a lot of training data available for algorithms to train on, so the selected algorithms should beable to cope with this.
These constraints can be expressed in the following research questions:
1. For the suggested application, what algorithms for the three phases are suitable in terms of:
- accuracy (few false positives and few false negatives)?
- computational complexity?
- sparse training data?
2. How can unrelated algorithms be combined in such a way that they complement each otherand save unnecessary computations?
3. What techniques (for example, cascade classifiers) can be used to to improve the overallefficiency of the algorithm?
To answer these questions, a prototype program has been made which performs the required taskby making use of the Viola-Jones object detection and principal component analysis algorithms.These algorithms will be explained in detail in Chapter 2, after which the proposed method willbe discussed in Chapter 3. Then, the performed experiments and their results will be described inChapter 4, followed by a discussion and conclusion in Chapter 5.
4

Chapter 2
Methods
This chapter serves to introduce the used algorithms and inform the reader about what they canbe used for before they are referred to. First the Viola-Jones object detection algorithm will beintroduced, followed by the principal component analysis algorithm.
2.1 Viola-Jones Object Detector
The Viola-Jones Object Detection algorithm was first described in the paper ’Rapid Object De-tection using a Boosted Cascade of Simple Features’ by P. Viola and M. Jones (Viola and Jones,2001) and the goal of the algorithm is to detect the objects it is trained to recognize in a giveninput image. The authors demonstrated its use in the field of face detection where they achievedexceptionally low computation times while improving detection accuracy (Viola and Jones, 2004).
When given a grey-scale image, the algorithm will look at sub-images of the original image oneby one until every sub-image of a certain size is considered. Then, the size of the sub-images thatare considered is scaled up by a chosen factor and the process repeats until the sub-image is as largeas the input image. For every sub-image a cascade of classifiers decides whether or not it containsthe object it is trained for to detect. A cascade is a collection of classifiers placed in a certainorder and one by one they accept or reject a sub-image as containing the object or not. Shoulda sub-image get rejected by any of the classifiers, it is immediately discarded and not consideredfurther. On the other hand, if a sub-image gets accepted by every classifier in the cascade, it isclassified as containing the object. This process is visualised in Figure 2.1.
Within such a cascade the order of classifiers is chosen carefully and the first few are weakclassifiers (which means that they base their decision on very few features) which have a high truenegative rate. By selecting the first few classifiers in this manner, a lot of uninteresting regionsthat definitely do not contain the object that is being searched for get rejected. Only images thatpass the first few classifiers and therefore potentially contain the object will get processed furtherby more complex, and thus computationally more expensive, classifiers. This way a very highdetection accuracy is achieved while maintaining a low computation time.
5

Figure 2.1: An abstract visualisation of a cascade of classifiers. Based on Viola and Jones (2004).
2.1.1 Integral Image and Rectangle-Features
To further understand the algorithm, it is important to be familiar with the kind of features theclassifiers base their decision on and how these are calculated. The used features are called two-,three- and four-rectangle features. Each of these features consist of a number of rectangles that areequal in size and lie adjacent to each other at a position relative to the selected sub-image. Foreach feature, the sum of the pixel values within one or more rectangles is subtracted from the sumof the pixel values within the remaining rectangles. In Figure 2.2a these features are visualised andwithin this image the sum of the pixel values inside the white rectangles are subtracted from thesum of the pixel values inside the grey rectangles.
These features are calculated from an intermediate representation of the original image, calledthe integral image which is no more than a summed area table. This representation of the imagemakes computing the sum of pixel values within a rectangle a lot more efficient, as it is not requiredto sum up the pixel values in every rectangle, which would be the case if the original image wereused. Instead using the values at the corners of the rectangles is sufficient. The integral imageformula calculates the sum of all the pixel values above and to the left of every position in theoriginal image. This formula is expressed as:
ii(x, y) =∑
x′≤x,y′≤yi(x′, y′)
where ii is the integral image, ii(x, y) is a position in the integral image, i the original image andi(x’, y’) refers to a position in the original image. The integral image can also be computed moreefficiently using a recursive formula:
ii(x, y) = ii(x− 1, y) + ii(x, y − 1) − ii(x− 1, y − 1) + i(x, y)
This integral image has to be computed only once per image, after which every feature forevery sub-image can be efficiently calculated (as mentioned, one only has to use the integral imagevalues at the corners of a rectangle). How this is done is best explained when considering Figure2.2b. In this figure, four different locations and regions are marked. The question is how one canobtain the sum of the pixels within D as this region represents any random rectangle within the
6

(a) Example rectangle features. A and B showtwo-rectangle features, C shows a three rect-angle feature and D shows a four rectanglefeature.
(b) The integral image-value at position 1 is thesum of the pixels within A, the value at position 2is A + B, the value at position 3 is A + C and thevalue at position 4 is A + B + C + D.
Figure 2.2: Taken from Viola and Jones (2004).
image (that is not against the border of the image). Expressed in the marked locations within theintegral image, the answer is 4 + 1 - (2 + 3). It is this simplicity that makes calculating the featuresso efficient. One rectangle can be computed with just 4 references to the integral image by usingsimple additions and subtractions. A two-rectangle feature can be computed with 6 references,a three-rectangle feature with 8 references and a four-rectangle feature with 9 references. Thus,by computing the integral image a priori, a lot of computations on the original image that wouldotherwise be required are prevented.
2.1.2 Computational Costs
The computational cost of using the Viola-Jones algorithm is determined by three major factors.The first factor is the cascade itself. The higher the amount of classifiers in the cascade and themore features they use, the more calculations that need to be performed. Luckily this should notmatter too much if the cascade has been constructed correctly, but it matters enough that it isworth mentioning. The second contributing factor is the image resolution. The larger the image,the more possible sub-images there are that need to be considered and thus more time is consumedby judging them. The last factor is the scaling factor of the size of the sub-images, as the smallerthis factor is, the longer it will take before the size of the sub-images is as large as the imageitself. This means that more sub-images will be considered by the algorithm before it stops, whichconsumes more time.
The last two factors can be directly influenced, the first one however can not as pre-trainedclassifiers are used (see Section 3.6 for more information on this) and unfortunately influencing theother two has a direct influence on the results of the algorithm. However, preliminary tests haveshown that there is room to finetune the settings so that acceptable results can be achieved whilemaintaining reasonable computation times.
7

(a) (b)
Figure 2.3: Figure (a) shows sample data with a dimenstionality of two, along with the first and secondprincipal components. The first principal component is the bottom line in the figure, the second principalcomponent is the top line. In Figure (b) the data has been restructured according to the first principalcomponent,which accounts for the most variability in the data. This data can now be displayed on a singleaxis. Taken from (Albanese, Visintainer, Merler, Riccadonna, Jurman, and Furlanello, 2012).
2.2 Principal Component Analysis
The foundation of principal component analysis (PCA), formerly known as the Karhunen-Loeveprocedure, was laid in 1901 by K. Pearson (Pearson, 1901). It was first applied in a facial contextby M. Kirby and L. Sirovich in their paper ’Application of the Karhunen-Loeve Procedure for theCharacterization of Human Faces’ (Kirby and Sirovich, 1990) in which they explained how PCAcould be used to represent images of faces in a way that they could be further processed by acomputer. Their approach is best summarised by quoting the authors directly: ”The goal of theapproach is to represent a picture of a face in terms of an optimal coordinate system. (. . . ) The setof basis vectors which make up this coordinate system will be referred to as eigenpictures. Theyare simply the eigenfunctions of the covariance matrix of the ensemble of faces.”. Their idea wasthen expanded upon by A. Turk and A. Pentland who expressed new images in terms of this newcoordinate system and used this vector to compare it to the eigenvectors of sample pictures. Theresult of such a comparison is the Euclidian distance between two vectors, which can be seen as ameasure of error. By determining which of the existing vectors has the lowest distance to a newvector, the image corresponding to this vector can be labeled as containing or displaying the personthat is depicted in the picture of the closest existing vector.
Explained in just a few sentences, PCA is a technique for transforming data from one coordinatesystem into another that describes the variance in the data more optimally. During this processdimensionality reduction can take place for data compression or to make further processing easier.How this is done will be explained in the next section, Section 2.2.1 and a visualisation of exampleinput for the algorithm and the corresponding result is shown in Figure 2.3a and 2.3b.
8

2.2.1 Mathematical Procedure for PCA
This section explains the mathematical procedure which performs PCA step by step in order to tryand increase the understanding of the technique. The structure of this section and the explanationwere based on the writings of Lindsay I. Smith (Smith, 2002).
The kind of data that is used in face recognition by PCA are grey-scale images of N by Mpixels and one image can be seen as a point in an N*M dimensional space in which every pixel isa feature.
Step one: subtract the mean In order for PCA to function properly, for every variable(dimension) in the gathered data the mean of that variable must be subtracted. The mean of a setof numbers is calculated as:
X =
∑ni=1Xi
n
Step two: calculate covariance matrix Step two is to calculate the covariance matricesbetween the features of the data. Covariance is a measure of how much features vary from theirmean with respect to each other. The formula to calculate the covariance is
cov(X,Y ) =
∑ni=1(Xi − X)(Yi − Y )
(n− 1)
where X and Y are features (pixels in the images), Xi an element of X from training image i, Xthe mean of feature X (the mean of the pixel value over all the training images) and n is the totalnumber of data samples.
Because a lot of features are involved with images (every pixel is a feature), there are also a lotof covariance matrices involved. The amount of covariance matrices can be calculated with n!
2∗(n−2)!where n is the number of features, which becomes an awful lot when dealing with a large numberof features. However, these matrices can be put together in one big n * n matrix.
Step three: calculate the eigenvectors and eigenvalues of the covariance matrixFor any square matrix of n ∗n there are n eigenvectors and n eigenvalues. Every eigenvector has acorresponding eigenvalue, which can be seen as some sort of ’weight’ for the eigenvector (see stepfour). All these eigenvectors are orthogonal to each other within the dimensions in which they aredefined and they can be seen as a line within n-dimensional space. Making the jump back to theoriginal data, an eigenvector can be seen as a new axis within the original space which can be usedto express the data.
Step four: choosing features and forming a feature vector As previously mentioned,an eigenvalue can be seen as some sort of weight for its corresponding eigenvector and the eigenvectorwith the highest eigenvalue is called the principle component of a data set. This means that it bestcaptures the variance between the data points in the data set on just one axis. Of course, if justone single eigenvector would be used to describe the data, a lot of information would be lost asonly all eigenvectors together describe the data completely. Leaving out any eigenvector results ina loss of information.
This is where dimension reduction becomes possible. If you order all the eigenvectors based ontheir eigenvalues you could choose to discard the eigenvectors with lower eigenvalues, as they are of
9

Figure 2.4: Visual representation of examples of eigenfaces (eigenvectors of faces). Notice that just aseigenvectors go from very descriptive to less descriptive the images become less expressive.
the least importance in describing the data. By doing this information is lost, but your new dataset expressed in terms of the remaining eigenvectors has a lower dimensionality. The remainingeigenvectors become the new features of your data and they together form your new feature vector.
Step five: transforming the original data set into one based on the new featurevector The next step is to actually transform the original data into a new data set based on theselected features in the feature vector. This actually is the most simple step, as can be seen in theformula below:
NewData = FeatureVector x OriginalData
This formula can also be applied on new data to transform it to the newly determined dimensions.
2.2.2 Computational Costs
The computational costs of the recognition part of the PCA algorithm is only dependent on twofactors. The first factor is the length of the chosen feature vector, since the longer this vector is,the more computations have to be done when expressing an input image in these features and thelonger it takes to calculate the distance between pictures (although this last point is negligible). Thesecond factor is the image resolution since a higher resolution directly leads to more computations.The advantage here though, is that both these factors can be influenced if there is a need for it,which allows experimenting with different settings.
10

Chapter 3
Approach
Now that the selected algorithms have been explained, their role in the algorithm that solves theface and facial gesture recognition problem can be examined more closely. Previously in Section1.2 the three phases or subproblems for such an algorithm were defined as:
1. Locate regions of interest (ROIs)
2. Perform face recognition
3. Perform gesture recognition
In the next sections these phases will be investigated in detail and for each phase, possible solutionswill be explored.
3.1 Defining and Locating Regions of Interest
Defining the gestures and regions of interest for this application Before any ROI’sare located it must first be defined what a ROI actually is and what regions qualify for beingclassified as interesting. A region of interest is a sub-image which contains something of importance.For this application it is clear that an area in an image containing a face is an interesting region,as within such a region the facial gestures will be performed. Also, in order to perform a facerecognition algorithm the image of a face is required as input. However, it is still not clear whatregions within the facial area must be monitored in order to recognize any performed gestures, asthe gestures themselves have not yet been selected and defined yet. A list of gestures which areused in this application is listed below along with a short description (see Figure 3.1 for examplesof some of the gestures).
• Eye winking - A wink-gesture is considered as being performed when an eye is closed. Thisgesture can be performed by both eyes individually. This means that two possibilities existfor performing this gesture, effectively making it two different gestures for the program.
• Smiling - A smile-gesture is a gesture when one simply uses his or her mouth to smile.
• Sticking tongue out - This gesture is considered as being performed when a person stickstheir tongue out of their mouth so that it can be clearly observed.
11

Figure 3.1: Examples of possible gestures that can be performed.
• Head tilting - The head tilting gesture can be performed by either tilting the head to theleft or to the right. Just as with the wink-gesture, this means that effectively there are twogestures that can be performed.
It is also useful to define the neutral state of a face when no gestures are performed. This neutralstate is when both eyes are open, the mouth is closed in a relaxed state while the head is heldstraight.
Now that the gestures have been defined, it is easy to deduct from the first three gestures thatthe eyes and mouth are regions of interest. However, the head tilting gesture has no specific regionsof interest, apart from the whole face perhaps. Because it might be difficult for an algorithm todetermine from an image of a face whether a head is tilted or not, another option might be moresuitable. One such option is to use the information that can be deducted from regions of interestthat have already been defined, the eye regions. How this and each of the other gestures arerecognised will be explained in detail in Section 3.3. In summary, the regions of interest that mustbe located are:
• The face region
• The eye regions
• The mouth region
Of these regions the last two can be found within the first region. Therefore, finding a face regionis considered to be stage one and finding any other regions is considered stage two in the processof finding ROI’s.
Finding the regions of interest After defining the relevant regions of interest, the problemof actually finding them has to be solved. This is not a trivial task as finding an object in an imageis difficult for a computer. This is where the Viola-Jones object detector is utilised. The first stepfor finding all regions of interest is scanning every image in the camera stream for faces with aViola-Jones classifier. Once a facial region has been found, other Viola-Jones object detectors willfurther process the selected sub-image in order to locate the eye and mouth regions. This processof finding the relevant ROIs is visualised in Figure 3.2.
3.2 Face Recognition
For the face recognition task the PCA algorithm is used. The input images the algorithm operatesupon are the facial regions of interest that are found in the first stage in the process of finding the
12

Figure 3.2: Process of locating the regions of interest.
ROIs (see Figure 3.2). Normally PCA classification gives the distance between an input image andthe closest image and the corresponding label as output, thereby determining who is shown in theinput image. However, in this setup the algorithm has been trained with images of just one person,so the decision whether the correct person is shown must be made differently. Instead the distanceis transformed to a confidence score between [-1, 1] where a score of -1 means the distance is biggerthan the default threshold of the implementation of the algorithm and a score of 1 means the inputimage is exactly the same as one of the input images. Using such a score, a threshold value can bepicked and if the score for an input image is above this threshold, it is considered as being similarenough to the images of the faces it has been trained with in order to be accepted.
However, the determination of such a threshold requires careful consideration, as a programthat is too lenient might result in someone getting unauthorised access to the program. On theother hand, a threshold that is too strict might lead to the denial of access to a person that actuallyis entitled to access, resulting in frustration, annoyance and a generally undesirable situation. Inreality the chance of someone being wrongfully rejected is higher than the chance of someone beingwrongfully accepted, due to the variance in conditions and the effect it has on the PCA algorithm.Therefore it is possible to choose a relatively lower threshold of 0.4. This is sufficiently low for aperson to authenticate himself in different conditions, but high enough to prevent an unauthorisedperson from gaining access. See Section 4.2.3 for supporting numbers on why this threshold hasbeen chosen.
3.3 Gesture Recognition
The used methods for determining if any gestures are performed differ per type of gesture. In thefollowing paragraphs the methods that were used for each type will be explained shortly. The onefactor that is constant between the used methods is that they all use the ROI’s that were found inthe second stage of the process of locating the ROI’s (see Figure 3.2)
Mouth gestures Any of the possible mouth gestures (smiling and sticking the tongue out) arerecognised by using the PCA algorithm. As this algorithm requires sample pictures for training,there is a training process during which those are gathered. For more information on the training
13

Figure 3.3: Calculating the angle α so it can be determined if a head is tilted to the left, to the right ornot at all.
process, see Section 3.4. As opposed to how PCA is used in this application for face recognition (asdescribed in Section 3.2), it is sufficient for the algorithm to find the closest training image and itscorresponding label and classify the input image with this label. As the label corresponds directlyto the performed gesture, no further processing is required.
Eye gestures For recognising eye gestures (winking with the left or right eye) two Viola-Jonesobject detectors are used. The first one is a detector that detects both open and closed eyes. Thesecond detector only detects open eyes. Every frame serves as input for both detectors and from thedifference between the output of these detectors it can be deducted whether or not a wink-gestureis performed. This is because if the first detector does detect an eye where the second detector doesnot detect an eye, it is likely that the eye is closed. The results of two Viola-Jones cascades are usedhere as opposed to the PCA algorithm is because preliminary tests showed a poor performance ofthe PCA algorithm when it was used to detect the different eye gestures. Experiment 5 as describedin Section 4.1 aims to provide numbers to back up this claim.
Head gestures Instead of using an advanced recognition algorithm for detecting the head tilt-ing gestures, a simple calculation which uses some of the information that is already available issufficient. This calculation is based on the detected eye regions by the Viola-Jones detector thatdetects both open and closed eyes. First, the centers of the detected eye regions are calculated.Between these two centers you could hypothetically draw a line and then measure the angle betweenthat line and the horizontal axis. See Figure 3.3 for an illustration of this concept. Below are themathematical steps that must be performed in order to calculate the angle.
x′ = C2.x− C1.x
y′ = C1.y − C2.y
α = tan−1x′
y′
where C1 is the center of the left eye region and C2 the center of the right eye region.
Once α has been calculated it can be determined how much it differentiates from the 0-degreemark, which is what you get if the center of the eye regions are at exactly the same height. Based onpilot studies it was concluded that a head can be classified as being tilted if the absolute differenceis larger than 10 degrees. Whether it is tilted to the left or the right depends on whether or notthe angle is positive or negative (of course an angle cannot be negative, but the result from theequation can be negative). If it is positive the head is tilted to the left (in the image) and if it isnegative it is tilted to the right (in the image).
14

Figure 3.4: Visualisation of the training process during which data is gathered of the user performinggestures.
3.4 Training the Program and Gathering Data
In order for the system to work properly, personalised data must be gathered of all the possiblegestures that are recognised with the PCA algorithm (the Viola-Jones object detectors also needto be trained, see Section 3.6 for information on how that is handled). As face recognition wasalso performed with PCA, sample faces also must be obtained. So in order for a user to be ableto use this authentication method, they must first go through a training process during which therequired samples are gathered. During this process, the user is asked to perform every relevantgesture (a gesture that is classified by PCA) twice. Every time a gesture is performed, two samplesare taken which means that there are in total four samples per gesture. The reason that two samplesare taken per time the user performs a gesture, is because the detected regions within which thegestures are performed are different for each input frame. This means that the exact same gestureis captured, but that the sample image is different which gives PCA extra data to train with. Thewhole training process can be described in the following steps, which are also visualised in Figure3.4:
1: Give standby command - allow user to relax2: Wait 2000 ms.3: Give gesture command - instruct user to perform a gesture4: Take sample pictures at 1800ms. and 2200 ms5: After 3000 ms. repeat steps 1 through 46: Display end-of-training-message7: Train classifiers on gathered data
It has not been explained yet why the sample pictures are taken at 1800 and 2200 ms. Thereason for these times is that first and foremost the user must be able to react to the given commandof what gesture to perform. Various research has shown for human reaction times to range fromanywhere between 200 ms. to 600 ms. depending on the type of stimulus, the type of response thatis required and if a person is primed for the stimulus or not (Kosinski, 2010). Instead of taking allthese factors into account, simply rounding it up to 1000 ms. should be enough time for a person toreact to a given command. Also, the correct estimation of a user’s reaction time is of no importance
15

Figure 3.5: Sample training data that is obtained during the training process. The top two rows showfaces performing the various gestures and are used to train the face recognition algorithm. The two middlerows show the left and right eye for the two possible gestures (note how in the second eye row a nose gotclassified as an eye by the Viola-Jones cascade). The last row shows the collected data for mouth gestures.The resolution of the obtained images have a resolution of respectively 130 x 180, 36 x 24 and 50 x 30 pixels.
whatsoever for this application, so it is not further investigated. This leaves 2000 ms. to pick twomoments for gathering data and around halfway the remaining time is the logical choice. This isbecause if the picked moment is too early the user’s face might not yet be perfectly still. On theother hand, if a picked moment is too late, the user might either get tired from performing thegesture or anticipate the end of the period during which they have to perform the gesture and relaxtheir face. Also, these moments must not be too close together as the time it takes for the camerastream to supply a new image cannot be guaranteed. Because of these reasons the two chosenmoments are at 1800 ms. and 2200 ms.: they are 400 ms. apart which should be enough for thecamera to supply a new image and the moments are nicely around the 1000 (+1000) ms. mark,which is half of the remaining 2000 ms. After the user has completed the training process, the PCAalgorithm will be trained on the gathered data so that it can be used for detection straight after.Sample data which is the result of the training process is displayed in Figure 3.5.
3.5 Authentication Process
Every time a user wants to authenticate himself, they must successfully complete the authenticationprocess. This process is visualised in Figure 3.6. In order to complete the process, a sequence ofrandomly determined gestures must be correctly performed by the user. The number of gesturesthat needs to be performed is predetermined and is consistent between authentication attempts.A gesture is considered performed after it has been recognised for a period of 1000 ms. withoutinterruption. Straight after a gesture has been performed the command is given for the next gesture(but only if the user has not yet performed the complete sequence of gestures). The program doesnot start monitoring for the new gesture start straight away, but instead it waits for 1000 ms. toallow the user to actually react to the command (see Section 3.4 for a short explanation aboutthis). After this time the monitoring for the new gesture starts. Should the program detect theperformance of any other gesture than the required one for a 1000 ms. or more, the authenticationprocess fails immediately.
However, the correct performance of the required gestures is not the only criterion. In the
16

Figure 3.6: Visualisation of the authentication process.
background the face recognition algorithm is checking whether or not the face of the person thatis trying to authenticate matches with the face of the person that trained the algorithm. Only ifall gestures are performed correctly and the faces match will a person succeed in authenticatinghimself. This process can be summarised in the following steps, which have also been visualised inFigure 3.6:
1: Start face recognition process in background2: Give first gesture command to user3: Wait 1000 ms. to allow for reaction time4: Monitor if any gesture is performed for at least 1000 ms.5:
6: if gesture is detected and it is correct then7: if more gestures then8: repeat steps 2 through 69: else
10: continue with step 1611: end if12: else13: abort authentication and inform user14: end if15:
16: if detected face similar enough to trained face then17: continue with step 2218: else19: abort authentication and inform user20: end if21:
17

22: authentication successful and grant access
It is likely that not every input image of a face passes the threshold required in order for it tobe classified as being the correct face. Because of this, it is not required that every image passesthe threshold, but rather a percentage of the total amount of frames.
3.6 Implementation and Technical Details
This section describes the program that has been created according to the processes as described inSection 3.4 and 3.5. A screenshot along with an explanation of the different interface componentscan be found in Figure 3.7. It has been programmed in the programming language Java, which isthe native language of the Android Operating System. The usage of the Java language facilitatedthe use of the JavaCV library, which is the wrapper of OpenCV library, an open source computervision library. This library contains implementations of the Viola-Jones Object Detection algorithmas well as the Principal Component Analysis algorithm. Both these implementations where used inthe program that was written. JavaCV version 0.2 and OpenCV version 2.4.2 were used which canbe obtained respectively from http://code.google.com/p/javacv/ and http://opencv.org/.
Instead of training my own Viola-Jones detectors, pretrained cascades were used. Two of thedetectors, the face detector and the open eye detector, were included with the OpenCV library.Three other detectors that were used, a mouth detector and a left and a right eye detector for bothopen and closed eyes, were created by M. Castrillon et al. for their research (Castrillon-Santana,Deniz-Suarez, Anton-Canalis, and Lorenzo-Navarro, 2008) and are freely available.
This proof-of-concept program has been used mainly for experiments which could be betterperformed on a regular computer than a smart-phone. Therefore parts of the program, like theobtaining of images from the camera stream, are specifically designed for the Windows operatingsystem. However, the algorithms themselves are platform independent. Any platform specific codehas been coded for both the Windows and Android operating systems and a transition betweenthese systems should not be a problem. The only expected difference between these platformscould be increased computation times due to the fact that the Android operating system typicallyis installed on devices with limited computing capabilities. This fact should have no impact on theaccuarcy of the suggested application. The used laptop is equipped with a Amd Athlon II Dual-Core M300 2.0 Ghz CPU, 4096MB RAM and had the Windows 7 Professional 64 bit operatingsystem installed.
Because of the low computing power of smart-phones everything must be run on a lower res-olution in order for the algorithms to run at real-time. In order to get results when running theprogram on a computer with Windows OS that are comparable to the results you would get whenrunning the program on a smart-phone with Android OS, the difference in resolution is taken intoaccount. All obtained camera images are resized to to a resolution of 240 * 160 pixels, which isone of the possible resolution settings for camera’s in a smart-phone. This image gets downsizedwith a factor of 4, resulting in an image of 60 * 40 pixels. It is in this small image that the ViolaJones algorithm searches for faces. When it has found a face region, the region is translated to thelarger image. Then the region in the larger image is used to find the other ROI’s. The advantageof scaling the original image down is to save the computing time which would be necessary for thefull-scale image. The larger image is then used again because the Viola-Jones detectors are unableto find the other ROI’s within the small region that would be left over from the 60 * 40 pixels.
18

Figure 3.7: Interface of the program that was used to perform the experiments. A) shows the originalcamera input image from the input stream, which has a resolution of 640 x 480 pixels. B) shows the originalimage scaled down to the possible size of the images from a smartphone, a resolution of 240 x 160 pixels,and marks the found ROIs. C) shows the image of B) scaled down by factor 4, resulting in a resolution of60 x 40 pixels, which is used for face detection. D) Is the gesture-feedback area and shows which gesturesare performed. E1 & 2) are buttons that were useful in setting up the experiments and gathering illustrativepictures. F), G) and H) are buttons that respectively start the training process, train the classifier on thegathered data and start the authentication process. I) is the instruction area where the user can see whathas to be done. J) shows the similarity value as result of the face recognition algorithm.
19

20
Chapter 4
Experiments & results
In order to be able to judge the chosen algorithms and the authentication method as a whole, variousexperiments have been performed. In the next Section, Section 4.1, every performed experimentand what it aims to investigate will be explained in detail. The results will be presented in Section4.2 and shortly discussed in Section 4.3.
4.1 Experimental Setup
The performed experiments can be divided into three categories: experiments that determine therecognition rate of gestures, experiments that determine if the program can be used successfullyfor authentication and experiments that determine the generalisation capabilities of the classifiers.The order in which these categories are listed is also the order in which the experiments will bepresented in the following sections.
4.1.1 Determining Recognition Rates of Gestures
The first thing that is interesting to determine is the recognition rate of all performable gestures inorder to be able to evaluate the chosen algorithms. By doing this, both the ROI’s that were foundby the Viola-Jones cascades and the gesture recognition methods can be evaluated. When doingthis, it is interesting to see how the different methods perform in different conditions compared tothe standard conditions. The standard conditions of an experiment are defined as:
• The experiment is performed straight after training• The resolution of the images in which is searched for the non-face ROI’s is 240*160• Two Viola-Jones cascades are used to determine the performed eye gestures
During such an experiment a subject is asked to perform all gestures in succession during whichall detected ROI’s are recorded and classified. From this data the relevant results can be derived.
Experiment 1: Baseline performance The first experiment aims to establish a baselinewith the standard conditions so that the results from the other experiments can be compared to
21

the results from this experiment. Also, the average time it takes to process one frame is measuredin order to be able to determine differences in computation time.
Experiment 2: Different lighting conditions Different conditions than the conditions aperson trained to program in can affect the performance of the PCA algorithm. The goal of thisexperiment is to investigate the effect of different lighting conditions by training the program inconditions where the face is evenly and clearly lit. Testing then takes place in darker conditionswith less uniform lighting. This was achieved by simply switching the lights on and off while asecond source of lighting, sunlight coming in through a window in the roof of the room, remainedunchanged.
Experiment 3: Data from two training sessions The amount of training data mightinfluence the performance of the PCA algorithm, especially if the data is gathered in differentlighting conditions. In this experiment data from two different lighting conditions is taken (thedata of the first and second experiment) and the performance is measured. The average processingtime per frame is also measured in order to determine the influence of extra data data samples onthe processing time.
Experiment 4: Different resolution In this experiment a higher resolution than normal isused: a resolution of 360*240 pixels which increases the amount of pixels by a factor of 2.25. Thismeans that the found ROI’s are of a higher resolution as well and thus contain more information.This could be of effect for the Viola-Jones cascades and the trained PCA classifier, which is inves-tigated in this experiment. This experiment also measures the average processing time per frameto determine the influence of higher resolutions.
Experiment 5: Using PCA for eye gestures In the final experiment it is investigatedhow a PCA classifier performs at the task of classifying eye gestures in comparison to the twoViola-Jones cascades. Undoubtedly this will also influence the average processing time per frame,which will be measured as well.
4.1.2 Authentication Success Rate
Of course it is important to measure the success rate of authentication and different experimentsare performed to determine this rate. The starting point is the same as the standard conditionsas previously defined in Section 4.1.1. For every experiment 20 attempts at authentication wereperformed and in order to succeed the subjects had to perform a random gesture sequence of 4gestures. The similarity threshold for faces is set at 0.5 as it is expected to provide a high enoughbar which is expected to be unreachable when another face is presented. The required percentage offaces of which the similairty value must exceed this threshold of the total amount of frames duringan authentication attempt was set at 7.5%, because it is expected that different lighting conditionswill make it difficult for the correct face to reach this threshold. These experiments were performedby three subjects.
Experiment 6: Straight after training This experiment aims to establish a baseline againstwhich the other authentication experiments can be compared and it is performed straight after
22

training the program. The experiment is performed as described directly above: 20 authenticationattempts are performed during which a sequence of 4 random gestures must be completed.
Experiment 7: Different conditions than training conditions In different lightingconditions this method of authentication should also be usable and this experiment aims to deter-mine if this is possible. Again, a subject has to try and authenticate himself 20 times by completinga sequence of 4 random gestures. However, this time the experiment is performed in different light-ing conditions than the algorithm was trained in.
Experiment 8: Using a classifier trained with data from two conditions As pre-viously suggested in experiment 4, extra training data might be of influence on the performance ofthe algorithm. This algorithm investigates if there is an increase in the authentication success rateif training is performed with data gathered in two different lighting conditions.
4.1.3 A Classifier’s Ability to Generalise
An important question to ask is whether or not a trained classifier generalises well and if it is ableto classify the gestures of a person if it is trained to detect the gestures of another person? Theanswer to this question is of direct importance for the security of this authentication method. If theclassifiers generalises well, it becomes more important that a face is properly recognised and thepurpose of using gestures will be solely to make sure that no picture of a face is shown. However,should the classifiers not be able to generalise well and it cannot recognise the gestures of a personit is not trained for, it adds to the security value of the program and the face recognition itselfbecomes of less importance. These experiments were performed by two subjects, the same as thosewho performed experiment 1 through 5.
Experiment 9: Recognition of gestures between subjects This experiment aims todetermine whether or not a classifier can recognise the gesture of one person when it is trained forrecognising the gestures of another person. The conditions in which this is tested are the same asdescribed in Section 4.1.1, however, the images that were used for training are the images of theother subject.
Experiment 10: Distance between faces in different settings and between personsLastly, it is important to determine how much the face recognition classifier considers person to bethe same in order to be able to determine a proper threshold for face recognition as described inSection 3.2. This experiment aims to determine a threshold by inspecting the obtained similarityvalues from the experiments 1, 2, 3 and 9. When these experiments where performed, the requireddata for this experiment automatically collected and it should provide insight what the influencesof the different settings are. It should also become clear what happens if a person other than theperson the program got trained to recognise is presented.
4.2 Experimental Results
The results of the performed experiments will be presented in this section. They are ordered in thesame manner as they were listed in Section 4.1.
23

4.2.1 Recognition Rates of Gestures
The results of the experiments that determine the performance of the gesture recognition methodsare described here. These experiments were performed by two subjects and the results of theseexperiments will be presented per gesture per subject. For every combination, two numbers willbe reported: the precision value for the Viola-Jones cascades and the recall value of every gesture.Both precision and recall are measurements of performance. Precision is a measure for determininghow many detections are actually correct. Recall measures how many instances of a class actuallygot detected. Precision is defined as:
Precision =TruePositives
nTruePositives + nFalsePositives
and recall is defined as:
Recall =nTruePositives
nTruePositives + nFalseNegatives
In Appendix A the confusion matrices are listed, which is the data on which the presentedprecision and recall values are based. Such a matrix displays how many times a gesture getsclassified correctly or as another gesture. A row stands for the actual performed gesture and thecolumns are the gestures it is recognised as. In the cells the percentages are displayed as measureof how many times an event occurred. Within these matrices, there are also a row and a columnlabeled “v-j fault”. The number in the cell where this row and column cross stands for the amountof times the viola-jones algorithm selected the wrong ROI as a percentage of the total number offrames. A Viola-Jones error always leads to the wrong classification of the supposedly displayedgesture as there is no right answer. These misclassifications are not taken into account in othercells, hence the extra cell to display this error.
When relevant, the mean and standard deviation of the processing time per frame will bereported (in ms.). Note that the processing time in the Viola-Jones tables also includes the detectiontime of the second eye cascade, which detects only open eyes (except for experiment 5). Theprocessing times listed in the gesture recognition methods tables correspond to the time it takesfor the PCA algorithm to classify mouth gestures (and in experiment 5 also eye gestures) and fordetermining the gestures of the other regions.
Experiment 1: Baseline performance In Table 4.1 and Table 4.2 the precision and recallvalues are listed for experiment 1 of which the purpose was to establish a baseline for performance.In these tables it can be observed that the Viola-Jones cascades perform their job adequately andachieve high precision values.
Where the gestures are concerned, the head gestures get recognised reasonably well, except forthe ‘Head: tilt right’ gesture for subject s02. This is due to mistakes in the located eye regions bythe Viola-Jones cascade, as no special classifier is in charge of classifying head gestures. Also, the‘Head: straight’ and ‘Head: left’ are correctly classified and these are determined in the exact samemanner as the ’Head: right’ gesture and which have just as much chance of getting misclassified.
For the eye gestures, the ‘Eye: wink’ gesture poses a problem (especially for subject s02), whilethe ‘Eye: open’ gesture is classified reasonably fine. This could indicate that the second Viola-Jonescascade (the one that only recognises open eyes) might actually perform too well in the sense that
24
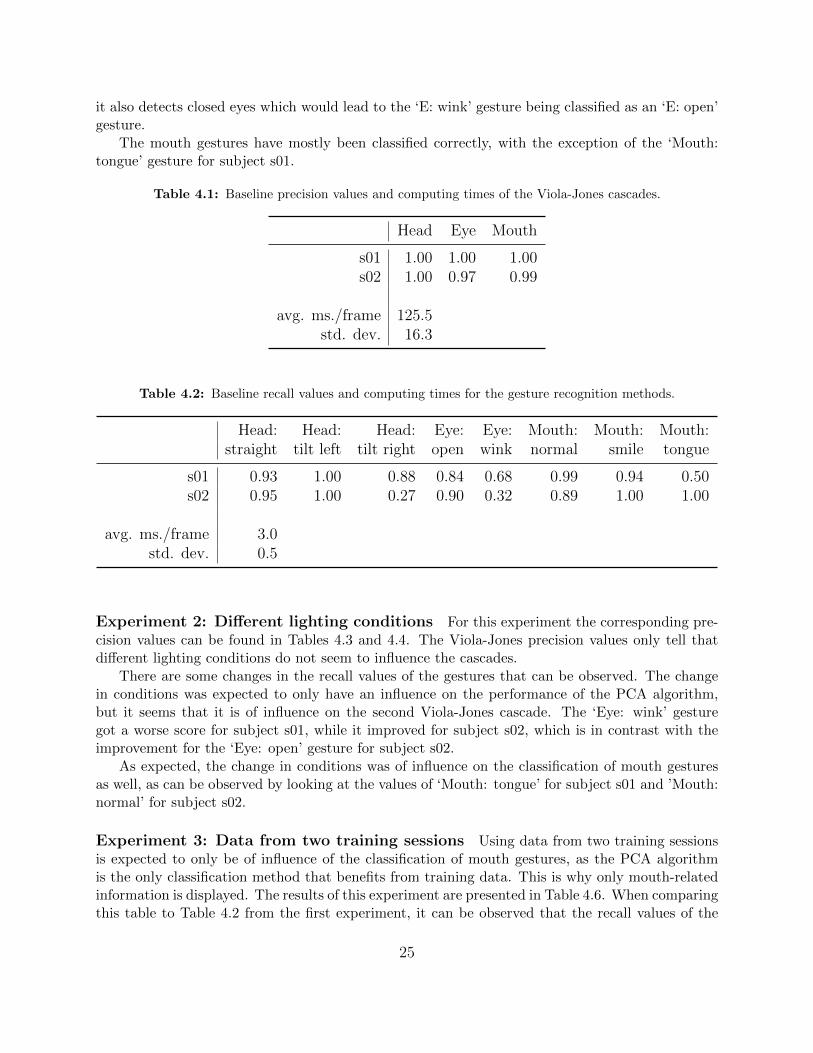
it also detects closed eyes which would lead to the ‘E: wink’ gesture being classified as an ‘E: open’gesture.
The mouth gestures have mostly been classified correctly, with the exception of the ‘Mouth:tongue’ gesture for subject s01.
Table 4.1: Baseline precision values and computing times of the Viola-Jones cascades.
Head Eye Mouth
s01 1.00 1.00 1.00s02 1.00 0.97 0.99
avg. ms./frame 125.5std. dev. 16.3
Table 4.2: Baseline recall values and computing times for the gesture recognition methods.
Head: Head: Head: Eye: Eye: Mouth: Mouth: Mouth:straight tilt left tilt right open wink normal smile tongue
s01 0.93 1.00 0.88 0.84 0.68 0.99 0.94 0.50s02 0.95 1.00 0.27 0.90 0.32 0.89 1.00 1.00
avg. ms./frame 3.0std. dev. 0.5
Experiment 2: Different lighting conditions For this experiment the corresponding pre-cision values can be found in Tables 4.3 and 4.4. The Viola-Jones precision values only tell thatdifferent lighting conditions do not seem to influence the cascades.
There are some changes in the recall values of the gestures that can be observed. The changein conditions was expected to only have an influence on the performance of the PCA algorithm,but it seems that it is of influence on the second Viola-Jones cascade. The ‘Eye: wink’ gesturegot a worse score for subject s01, while it improved for subject s02, which is in contrast with theimprovement for the ‘Eye: open’ gesture for subject s02.
As expected, the change in conditions was of influence on the classification of mouth gesturesas well, as can be observed by looking at the values of ‘Mouth: tongue’ for subject s01 and ’Mouth:normal’ for subject s02.
Experiment 3: Data from two training sessions Using data from two training sessionsis expected to only be of influence of the classification of mouth gestures, as the PCA algorithmis the only classification method that benefits from training data. This is why only mouth-relatedinformation is displayed. The results of this experiment are presented in Table 4.6. When comparingthis table to Table 4.2 from the first experiment, it can be observed that the recall values of the
25

Table 4.3: Precision values of the Viola-Jones cascades in different conditions.
Head Eye Mouth
s01 1.00 1.00 1.00s02 1.00 1.00 1.00
Table 4.4: Recall values and for the gesture recognition methods in different conditions.
Head: Head: Head: Eye: Eye: Mouth: Mouth: Mouth:straight tilt left tilt right open wink normal smile tongue
s01 1.00 1.00 0.53 0.96 0.53 1.00 0.86 0.00s02 0.97 0.75 0.00 0.29 0.95 0.64 0.89 1.00
‘Mouth: smile’ and ‘Mouth: tongue’ gestures improved, but that for subject s01 the value for the‘Mouth: normal’ gesture decreased. Also, just like the amount of training images doubled, theprocessing time for classifying the gestures doubled.
Table 4.5 shows the corresponding Viola-Jones precision values and the processing time, whichare not much different from the values presented in Table 4.1 from experiment one. Table 4.5 is onlypresented to validate the claim that extra training is not of influence for the Viola-Jones cascades(and thus not of influence on the classification of the other gestures that are not listed).
Table 4.5: Precision values and computing times of the Viola-Jones cascades with data from two trainingsessions.
Mouth
s01 1.00s02 1.00
avg. ms./frame 126.3std. dev. 21.1
Experiment 4: Different resolution The use of higher resolution input images could in-fluence the gesture recognition methods, as more information is available and this experimentinvestigates this.
In Table 4.7 the precision values and computing times are reported and when these are comparedto the precision values in Table 4.1 from experiment 1, it can be observed that the eye cascadesperformed worse, if only slightly. Aalso apparent is the fact that the average computation time perframe more than doubled. This does not come as a surprise as the amount of pixels in the inputimages increased by a factor of 2.25.
When comparing the recall values from this experiment as displayed in Table 4.8 to the recallvalues from experiment 1 in Table 4.2, the lack of recognition of the ‘Eye: wink’ gesture can not
26

Table 4.6: Recall values and computing times for the mouth gesture recognition method trained with datafrom two training sessions.
Mouth: Mouth: Mouth:normal smile tongue
s01 0.79 1.00 1.00s02 0.92 1.00 1.00
avg. ms./frame 6.0std. dev. 0.8
be missed. The recognition of mouth gestures seems to have improved for subject 1, while no ‘M:tongue’ gestures are recognised anymore for subject 2. Also the average computation time perframe doubled here, just like the time for the Viola-Jones cascades.
Table 4.7: Precision values and computing times of the Viola-Jones cascades with a base resolution of 360x 240 pixels.
Head Eye Mouth
s01 1.00 0.96 1.00s02 1.00 0.98 1.00
avg. ms./frame 266.3std. dev. 42.8
Table 4.8: Recall values and computing times for the gesture recognition methods with a base resolutionof 360 x 240 pixels.
Head: Head: Head: Eye: Eye: Mouth: Mouth: Mouth:straight tilt left tilt right open wink normal smile tongue
s01 0.98 1.00 1.00 1.00 0.00 0.98 1.00 1.00s02 1.00 1.00 0.29 1.00 0.00 0.89 1.00 0.00
avg. ms./frame 6.5std. dev. 1.0
Experiment 5: Using PCA for eye gestures As this experiment determines whetherthere is a difference between using two Viola-Jones cascades or the PCA algorithm to classify eyegestures, only eye-related information is of relevance and will be displayed.
When comparing the precision values in Table 4.9 from this experiment to values in Table4.1 from experiment 1 the difference in the average processing time per frame becomes clear. It
27

seems that the second Viola-Jones cascade for eye detection added roughly 25 ms. to the averagecomputation time per frame to detect open eyes.
The recall values in table 4.10 show that the detection of winks has worsened when comparedto the results displayed in Table 4.2 of experiment 1. Also, the average processing time per framedid increase by roughly 5 ms. which is no surprise as the PCA algorithm is now performing anadditional task.
Table 4.9: Precision values and computing times of the Viola-Jones cascades when PCA was used to classifyeye gestures.
Eye
s01 0.99s02 1.00
avg. ms./frame 101.4std. dev. 14.9
Table 4.10: Recall values and computing times when PCA was used to classify eye gestures.
Eye: Eye:open wink
s01 0.89 0.43s02 1.00 0.00
avg. ms./frame 8.2std. dev. 1.3
4.2.2 Results of Authentication Experiments
In this section the results of the authentication experiments, experiments 6, 7 and 8, are shortlypresented and are shown in Table 4.11. What is directly apparent is the fact that only subject s01managed to authenticate successfully using the program. Using the training data from two trainingsessions did improve results somewhat, but only for subject s01 while subject s03 and s04 were stillunable to authenticate themselves. For subject s03 this was due to the fact that only every eyegesture got classified as a wink, while for subject s04 only the smile-gesture got recognised in themouth region. This means that authentication would fail the moment any other gestures wouldhave to be performed, as gestures must be performed exclusively and not in combination with othergestures.
4.2.3 Results of Generalisation Experiments of Trained Classifiers
The results of the experiments that determine the generalisation capabilities of a trained classifierare described in this section.
28

Table 4.11: Results of the authentication experiments
.
Straight after training Different conditions Combined data
s01 success rate 0.10 0 0.35s03 success rate 0 0 0s04 success rate 0 0 0
Experiment 9: Recognition of gestures between subjects The only relevant resultsfor this experiment are the recall values of the mouth gestures, as the mouth region is the onlyregion that is classified by the PCA algorithm, which is the only algorithm that is influenced bytraining. These recall values are presented in Table 4.12. When comparing these values to therecall values in Table 4.2 from experiment 1 the first noticeable fact is that the recognition of the‘Mouth: normal’ gesture got a little bit worse. The recognition of the ‘Mouth: tongue’ gestureactually improved for subject s01, while classifying it correctly failed completely for subject s02.
Table 4.12: Recall values and for the mouth gesture recognition method of the between-subject gesturerecognition experiment.
Mouth: Mouth: Mouth:normal smile tongue
s01 vs s02 0.94 1.00 1.00s02 vs s01 0.85 1.00 0.00
Experiment 10: Distance between faces in different settings and between personsThe purpose of this experiment was to determine the similarity values of faces in different settingsand of different persons. In Table 4.13 the obtained similarity values are reported in intervals of0.05 and they are sorted per subject, per experiment. The last two columns display the obtainedsimilarity values when the program was trained with the data from subject s02 (from experiment1) and presented with subject s01 and the similarity values of the opposite setup respectively. Thedisplayed values are percentages of the total amount of frames that were obtained in their respectiveexperiments.
What can be observed is that in the settings from experiment 2 (different lighting conditionscompared to training) the similarity values for both subjects is considerably lower, although thereare a few outliers for subject s01. Also, the obtained similarity values are higher with the setupfrom experiment 3 (2 training sessions in different lighting conditions) compared to experiment 2,although this effect is pretty small for subject s02.
The last two columns that display the data from experiment 9 (between subject values) showthat it is possible to obtain similarity values not much different from the values which were obtainedwith experiment 2. However, they are unmistakingly lower than the similarity values obtained withthe settings from experiment 1 and 3.
29

Table 4.13: Similarity values of faces taken from data of different experiments.
experiment 1 2 3 1 2 3 9 9
Bin s01 s01 s01 s02 s02 s02 s01 vs s02 s02 vs s01<0.1 0 0 0 0 0 0 0 0
0.1 - 0.15 0 0 0 0 0 0 0 00.15 - 0.2 0 0 0 0 0 0.04 0.01 00.2 - 0.25 0.06 0.02 0 0 0.01 0.04 0.02 0.130.25 - 0.3 0.16 0.44 0 0 0.24 0.04 0.26 0.380.3 - 0.35 0.16 0.26 0 0 0.61 0.14 0.43 0.160.35 - 0.4 0.11 0.13 0.09 0 0.12 0.37 0.25 0.120.4 - 0.45 0.13 0.05 0.53 0.02 0.01 0.24 0.02 0.100.45 - 0.5 0.09 0.04 0.17 0.11 0 0.13 0 0.010.5 - 0.55 0.05 0.03 0.07 0.30 0 0 0 0.050.55 - 0.6 0.07 0.01 0.10 0.32 0 0 0 0.040.6 - 0.65 0.04 0 0.04 0.17 0 0 0 00.65 - 0.7 0.05 0.01 0 0.08 0 0 0 00.7 - 0.75 0.06 0 0 0 0 0 0 00.75 - 0.8 0 0 0 0 0 0 0 0
>0.8 0 0 0 0 0 0 0 0
mean 0.43 0.33 0.46 0.56 0.31 0.38 0.32 0.32std dev 0.14 0.08 0.06 0.06 0.04 0.07 0.04 0.09
4.3 Discussion of Results
In this section the experimental results are discussed. However, before this is done it must be notedthat no statistical tests have been performed to check for any significance of the results. This isbecause only two subjects performed the experiments (three subjects performed experiments 6, 7and 8) and it is unlikely that any overwhelmingly convincing statistical significance would be found.However, as long as this is kept in mind the results are suitable for drawing rough conclusions.
4.3.1 Finding Regions of Interest
The Viola-Jones object detection algorithm was utilised to find all relevant regions of interest forthe suggested application. Pre-trained cascades were used for every relevant ROI and they allperformed well: the cascade for finding faces always achieved a precision value of 1.00 while the eyeand mouth detection cascades never achieved lower precision values than 0.96 an 0.99 respectively.The only setting that had a (negative) effect on the precision values was the increasing of theresolution of the input images that were given to the algorithm.
However, these cascades require a significant amount of time to perform their task. Findingthe bare regions of interest where only one cascade is used to find eye regions takes 101.4 ms. onaverage on the computer the experiments were performed on. Adding the second eye detection
30

cascade increases the required time to 125.5 ms. on average. These numbers are influenced linearly(by estimation) by the resolution of the input images: increasing the resolution by a factor of 2.25increased the average computation time to 266.3 ms. Unfortunately these numbers will only worsenwhen the algorithm is run on a smart-phone, thereby reducing the amount of frames that can beprocessed per second.
4.3.2 Gesture Recognition
Eye gestures Two Viola-Jones cascades were used to recognise eye gestures and the experimen-tal results were not encouraging. Winks were never reliably detected with recall values in normalconditions of 0.68 and 0.32 for the two subjects. Open eyes were detected more reliably, but thehighest obtained recall value did not get above 0.90. In different conditions the cascades seemedto get a preference for either closed or open eyes, depending on the subject. This emphasizes thatthe current method for detecting winks is undependable. When higher resolutions were used nowink-gestures were recognised at all, so nothing can be gained by trying this.
An alternative possibility to detect eye gestures that was investigated was to use the PCAalgorithm for eye gesture classification. However, this was to no avail as for subject s01 the recallvalue for winks was 0.43 while for subject s02 no wink gestures were recognised at all.
Mouth gestures For recognising mouth gestures the PCA algorithm was used. In normalconditions these gestures were recognised pretty well with an average recall value of 0.89 (averagedover both subjects and all gestures) , although in different conditions the average recall valuedropped to 0.73. With extra training data from two different condition the average recall valueincreased to 0.95. When higher resolution images were used, there was a general improvementand for subject s01 almost perfect recall rates were obtained, although no tongue-gestures wererecognised for subject s02. This led to an average recall value of 0.81.
Head gestures The recognition of head gestures is done by calculating the result of a simplemathematical formula on which the different -experimental setups had no influence. Therefore theonly possible influence on the outcome of this formula is the input and if the input is wrong, theoutput will be wrong too. Any of the low recall values (for example, 0.27 for a ’tilt right’ gesturefor subject s02 in normal conditions) indicate that the found eye regions were not correct and thatthe cascades might have a problem finding tilted eyes.
4.3.3 Face Recognition
The PCA algorithm was used for face recognition and similarity values between the set of trainingfaces and presented faces were used to determine if these faces belonged to the same person. Thesimilarity values obtained with the experiments indicate that this method can be reliably used aslong as data is used from two training sessions in different conditions. This yields average similarityvalues of 0.46 and 0.38 for both subjects. The necessity to use two training sessions becomesclear when comparing the similarity values obtained in Experiment 2: Different conditions andExperiment 9: Recognition of gestures between subjects. For Experiment 2 the average similarityvalues for both subjects were 0.33 and 0.31, which are very much like the obtained average similarityvalues of 0.32 for both subjects in Experiment 9. This shows that the training data from just one
31

condition is not sufficient for the algorithm to reliable distinguish between two subjects, but thatthe distinction can be made with training data from two different conditions.
4.3.4 Capability to Generalise
The PCA algorithm was able to generalise by recognising gestures from a subject while it wastrained with the gestures of another surprisingly well. The average recall value was 0.80 for mouthgestures, which is worse than the baseline average of 0.89, but not far below. However, this isnot well enough in order to be able to use another person’s training data to recognise one’s owngestures. This is a good thing though, as it adds to the security of the application because it mustbe trained for a person specifically in order to recognise gestures correctly. Even though this is true,the difference is not big enough to be able to be counted upon as a full-fledged security measureby itself.
32

Chapter 5
Discussion
5.1 Usability
The implementation of the proposed method of authentication which was used for the experimentsis not usable for its intended purpose. This becomes evident from the results from Experiments 6, 7and 8 as presented in Section 4.2.2. This is the result from the imperfect recognition of all possiblegestures, as the chance on erroneous classifications of gestures increases with lower recall valuesand longer gesture sequences that need to be performed when authenticating. It also appears thatsubjects tend to have at least one gesture that the system would (almost) never classify correctly.This means that if such a gesture were to be included in the sequence of gestures that needs to beperformed, the authentication process will fail. Possible solutions will be discussed in Section 5.2.
5.2 Future Research
As mentioned in Section 5.1 the current implementation is not fit for use, but there are variousaspects that can be improved. The first aspect is the Viola-Jones cascades. Sometimes the eyeand mouth cascades would make a mistake and classify a nose as an eye or a mouth region. Suchmistakes can possibly be filtered out by inspecting where the found region is located relative tothe face region, as eyes or mouths are not positioned in the middle of the face. Doing this couldimprove the precision values of the cascades, providing an opportunity for overall improvement.
Secondly, gesture recognition itself could possibly be improved by finding optimal parametersfor the PCA algorithm in terms of the amount of training data that is used and the resolution ofinput images. Also, the results from experiment 1 and 2 show that the Viola-Jones cascades arenot fit for detecting eye gestures, so the use of PCA for recognising eye gestures could be furtherand more thoroughly investigated.
Another method that could possibly improve the results of the PCA algorithm is the use of adifferent colourspace. Currently, the input images are defined in the RGB (Red, Green and Blue)colourspace before they are converted to greyscale images. However, these images could first beconverted to the HSL colourspace, which stands for Hue, Saturation and Lightness. This wouldallow for the normalisation of images on the Lightness-axis relative to the training images. Thiscould possibly reduce the influence of different lighting conditions and improve recognition rates.
33

After normalisation, the images could be converted to greyscale and serve as input just as before.Whether or not this has any effect, would have to be investigated.
Should the proposed efforts to improve the performance of the PCA algorithm fail, alternativealgorithms for recognising gestures can be investigated. Examples of possible algorithms were pre-viously listed in Section 1.2. An important consideration in choosing an alternative is that currentlyno actual movement-information is used as feature: input images are considered individually. Itmight be beneficial for performance as well as security to choose an algorithm that is able to useactual movement-information. The computational costs of algorithms that do this are high thoughand this factor should not be overlooked.
Should one of the proposed methods make the suggested authentication system fit for real worlduse, the possibilities of using it as a widespread method of authentication should be investigated.However, if this would be achieved attempts will be made to try and hack the system and findweaknesses to abuse it. To stay one step ahead, research would have to be performed to try andidentify such weaknesses so the system can be improved and made more secure.
5.3 Conclusion
The precision of the Viola-Jones algorithm and the used cascades are more than sufficient for findingthe regions of interest for this authentication method. The computational costs of the algorithmare high and the performance is good.
The used gesture recognition methods do not achieve sufficiently high recall values in order tobe usable in this application. However, there is potential for improving these methods, which wouldbe especially beneficial for the PCA algorithm. The current manner in which the PCA algorithmis utilised does not achieve sufficiently high recognition rates in order to be useful, but if it can bemade to work reliably it definitely pays off as the required computational time is very low.
Overall, the current implementation of an authentication method based on face recognitioncombined with facial gesture recognition is unfit for use. However, there are enough possibilitiesfor improvement and it has been shown that there definitely is potential.
34

Bibliography
Davide Albanese, Roberto Visintainer, Stefano Merler, Samantha Riccadonna, Giuseppe Jurman,and Cesare Furlanello. mlpy - machine learning python, 2012.
M. E. Algorri and A. Escobar. Facial gesture recognition for interactive applications. In Proceedingsof the Fifth Mexican International Conference in Computer Science (ENC04), 2004.
J. Baltes, S. Seo, C. T. Cheng, M. C. Lau, and J. Anderson. Learning of facial gestures usingSVMs. Communications in Computer and Information Science, 212:147–154, 2011.
S. Banerjee and G. Sanyal. Indentification of facial gestures using principal component analysis andminimum distance classifier. Internation Journal of Computer Applications, 48 - No. 21, 2012.
M. S. Bartlett, J. R. Movellan, and T. J. Sejnowski. Face recognition by independant componentanalysis. IEEE Transactions on Neura, 13:1450–1464, 2002.
M. Castrillon-Santana, O. Deniz-Suarez, L. Anton-Canalis, and J. Lorenzo-Navarro. Face and facialfeature detection evaluation. In Proceedings of the Third International Conference on ComputerVision Theory and Applications, VISAPP08, 2008.
N. Degtyarev and O. Seredin. Comparative testing of face detection algorithms. ProceedingICISP’10 Proceedings of the 4th international conference on Image and signal processing, 6134:200–209, 2010.
A. Fazekas and I. Snta. Recognition of facial gestures based on support vector machines. LectureNotes in Computer Science, 3522/2005:477–487, 2005.
Google and IPSOS OTX MediaCT. The mobile movement - Understanding smartphone users.Google, April 2011. http://www.gstatic.com/ads/research/en/2011_TheMobileMovement.
pdf, visited in August 2012.
M. Kirby and L. Sirovich. Application of the Karhunen-Loeve procedure for the characterization ofhuman faces. IEEE Transactions on Pattern Analysis and Machine Intelligence, 12:01:103–108,1990.
Robert J. Kosinski. A literature review on reaction time. Clemson University, September 2010.http://biology.clemson.edu/bpc/bp/Lab/110/reaction.htm, visited in August 2012.
35

A. Arun Kumar, R. Ashok Kumar, P. Dinesh Kumar, and P. Karthick. Face recognition forauthentication. In International Conference on Computing and Control Engineering (ICCCE2012), 2012.
T. H. Le. Applying artificial neural networks for face recognition. Advances in Artificial NeuralSystems, 2011.
S. Lin, S. Kung, and L. Lin. Face recognition/detection by probabilistic decision-based neuralnetwork. IEEE Transactions on Neural Networks, volume 8, number 1:114–132, 1997.
B. Moreno, A. Sanchez, and J. F. Velez. On the use of outer ear images for personal identification insecurity applications. IEEE 33rd Annual 1999 International Carnahan Conference on SecurityTechnology, pages 469–476, 1999.
Thomas Newton. Ice Cream Sandwich Face Unlock fooled? Recombu, November 2011.http://www.manticmoo.com/articles/jeff/programming/latex/bibtex-types.php, visitedin January 2012.
Opera. Opera Face Gestures. Recombu, March 2009. http://www.youtube.com/watch?v=
kkNxbyp6thM, visited in June 2012.
M. Ortega, C. Mario, M. G. Penedo, M. Blanco, and F. Gonzlez. Biometric authentication usingdigital retinal images, 2006.
K. Pearson. On lines and planes of closest fit to systems of points in space. Philosophical Magazine,2:06:559–572, 1901.
Z. Shihai and L.U. Xiangjiang. Fingerprint identification and its applications in information securityfields. In International Conference of Information Science and Management Engineering, 2010.
Lindsay I Smith. A tutorial on Principal Component Analysis, 2002. http://www.sccg.sk/
~haladova/principal_components.pdf, visited in July 2012.
M. Turk and A. Pentland. Eigenfaces for recognition. Journal of Cognitive Neuroscience, volume3, number 1:71–86, 1991.
P. Viola and M. Jones. Rapid object detection using a boosted cascade of simple features. InProceedings of the Conference on Computer Vision and Pattern Recognition, 2001.
P. Viola and M. Jones. Robust real-time face detection. Internation Journal of Computer Vision,57(2):137–154, 2004.
J. Yang, D. Zhang, A. F. Frangi, and J. Yang. Two-dimensional PCA: a new approach toappearance-based face representation and recognition. IEEE Transactions on Pattern Analy-sis and Machine Intelligence, volume 26 number 1:131–137, 2004.
Cha Zhanh and Zhengyou Zhang. A survey of recent advances in face detection. Technical ReportMSR-TR-2010-66, Microsoft Research, Redmond, WA 98052, 2010.
36

Appendix A
Experiment Confusion Matrixes
In a confusion matrix a row stands for the actual performed gesture and the columns are thegestures it is recognised as. In the cells the percentages are displayed as measure of how manytimes an event occurred. This is illustrated in Table A.1.
Table A.1: Example confusion matrix.
observed class
actualclass
Table A.2: Confusion matrix of experiment 1. Subject 1: Head gestures. 111 frames total.
normal tilt left tilt right v-j fault
normal 0.93 0.00 0.07tilt left 0.00 1.00 0.00
tilt right 0.13 0.00 0.88v-j fault 0.00
Table A.3: Confusion matrix of experiment 1. Subject 1: Eye gestures. 222 frames total.
open wink v-j fault
open 0.84 0.17wink 0.32 0.68
v-j fault 0.00
37

Table A.4: Confusion matrix of experiment 1. Subject 1: Mouth gestures. 111 frames total.
normal smile tongue v-j fault
normal 0.99 0.01 0.00smile 0.06 0.94 0.00
tongue 0.38 0.13 0.50v-j fault 0.00
Table A.5: Confusion matrix of experiment 1. Subject 2: Head gestures. 105 frames total.
normal tilt left tilt right v-j fault
normal 0.95 0.00 0.05tilt left 0.00 1.00 0.00
tilt right 0.73 0.00 0.27v-j fault 0.00
Table A.6: Confusion matrix of experiment 1. Subject 2: Eye gestures. 210 frames total.
open wink v-j fault
open 0.90 0.10wink 0.68 0.32
v-j fault 0.00
Table A.7: Confusion matrix of experiment 1. Subject 2: Mouth gestures. 105 frames total.
normal smile tongue v-j fault
normal 0.89 0.02 0.08smile 0.00 1.00 0.00
tongue 0.00 0.00 1.00v-j fault 0.01
Table A.8: Confusion matrix of experiment 2. Subject 1: Head gestures. 106 frames total.
normal tilt left tilt right v-j fault
normal 1.00 0.00 0.00tilt left 0.00 1.00 0.00
tilt right 0.47 0.00 0.53v-j fault 0.00
38

Table A.9: Confusion matrix of experiment 2. Subject 1: Eye gestures. 212 frames total.
open wink v-j fault
open 0.96 0.04wink 0.47 0.53
v-j fault 0.00
Table A.10: Confusion matrix of experiment 2. Subject 1: Mouth gestures. 106 frames total.
normal smile tongue v-j fault
normal 1.00 0.00 0.00smile 0.14 0.86 0.00
tongue 1.00 0.00 0.00v-j fault 0.00
Table A.11: Confusion matrix of experiment 2. Subject 2: Head gestures. 78 frames total.
normal tilt left tilt right v-j fault
normal 0.97 0.03 0.00tilt left 0.25 0.75 0.00
tilt right 1.00 0.00 0.00v-j fault 0.00
Table A.12: Confusion matrix of experiment 2. Subject 2: Eye gestures. 156 frames total.
open wink v-j fault
open 0.29 0.71wink 0.05 0.95
v-j fault 0.00
Table A.13: Confusion matrix of experiment 2. Subject 2: Mouth gestures. 78 frames total.
normal smile tongue v-j fault
normal 0.64 0.30 0.06smile 0.00 0.89 0.11
tongue 0.00 0.00 1.00v-j fault 0.00
39

Table A.14: Confusion matrix of experiment 3. Subject 1: Mouth gestures. 81 frames total.
normal smile tongue v-j fault
normal 0.79 0.19 0.01smile 0.00 1.00 0.00
tongue 0.00 0.00 1.00v-j fault 0.00
Table A.15: Confusion matrix of experiment 3. Subject 2: Mouth gestures. 105 frames total.
mouth gestures:
normal smile tongue v-j faultnormal 0.92 0.05 0.03
smile 0.00 1.00 0.00tongue 0.00 0.00 1.00
v-j fault 0.00
Table A.16: Confusion matrix of experiment 4. Subject 1: Head gestures. 64 frames total.
normal tilt left tilt right v-j fault
normal 0.98 0.00 0.02tilt left 0.00 1.00 0.00
tilt right 0.00 0.00 1.00v-j fault 0.00
Table A.17: Confusion matrix of experiment 4. Subject 1: Eye gestures. 128 frames total.
open wink v-j fault
open 1.00 0.00wink 1.00 0.00
v-j fault 0.04
Table A.18: Confusion matrix of experiment 4. Subject 1: Mouth gestures. 64 frames total.
normal smile tongue v-j fault
normal 0.98 0.00 0.02smile 0.00 1.00 0.00
tongue 0.00 0.00 1.00v-j fault 0.00
40

Table A.19: Confusion matrix of experiment 4. Subject 2: Head gestures. 77 frames total.
normal tilt left tilt right v-j fault
normal 1.00 0.00 0.00tilt left 0.00 1.00 0.00
tilt right 0.43 0.29 0.29v-j fault 0.00
Table A.20: Confusion matrix of experiment 4. Subject 2: Eye gestures. 154 frames total.
open wink v-j fault
open 1.00 0.00wink 1.00 0.00
v-j fault 0.02
Table A.21: Confusion matrix of experiment 4. Subject 2: Mouth gestures. 77 frames total.
normal smile tongue v-j fault
normal 0.89 0.11 0.00smile 0.00 1.00 0.00
tongue 1.00 0.00 0.00v-j fault 0.00
Table A.22: Confusion matrix of experiment 5. Subject 1: Eye gestures. 258 frames total.
open wink v-j fault
open 0.89 0.11wink 0.57 0.43
v-j fault 0.01
Table A.23: Confusion matrix of experiment 5. Subject 2: Eye gestures. 206 frames total.
open wink v-j fault
open 1.00 0.00wink 1.00 0.00
v-j fault 0.00
41

Table A.24: Confusion matrix of experiment 9. Subject 1: Mouth gestures. 81 frames total.
normal smile tongue v-j fault
normal 0.94 0.00 0.06smile 0.00 1.00 0.00
tongue 0.00 0.00 1.00v-j fault 0
Table A.25: Confusion matrix of experiment 9. Subject 2: Mouth gestures. 99 frames total.
normal smile tongue v-j fault
normal 0.85 0.04 0.11smile 0.00 1.00 0.00
tongue 1.00 0.00 0.00v-j fault 0
42