Terry Barber Commissioner Precinct 1 Commissioner Precinct 3

Geotechnical Report
Southern River Precinct 3D
Lots 9 and 1792 Holmes Street Southern River
January 2018
Southern River Precinct 3D

Southern River Precinct 3D Geotechnical Report
2
Integrating Resource Management
Lots 9 and 1792 Holmes Street, Southern River
Geotechnical Report
January 2018
Prepared for: Land owners of lots 9 and 1792 Holmes Street, Southern River
Prepared by:
Bioscience Pty Ltd
488 Nicholson Road
Forrestdale WA 6112
Phone: (08) 9397 2446
Email: [email protected]
www.biosciecnewa.com
Document Control
Issue Date Author Reviewer Approved
1 01/07/2012 R. Bromfield P. Keating P. Keating
2 10/01/2018 D. Alanoix P. Keating P. Keating

Southern River Precinct 3D Geotechnical Report
3
Integrating Resource Management
Contents 1.0 Executive Summary ................................................................................................................... 5
2.0 Introduction .............................................................................................................................. 6
3.0 Proposed Development ............................................................................................................ 6
4.0 Site Description ......................................................................................................................... 9
4.1 Land Use ................................................................................................................................ 9
4.2 Topography ........................................................................................................................... 9
4.3 Vegetation ............................................................................................................................. 9
4.4 Geology and Geomorphology ............................................................................................... 9
4.5 Groundwater ....................................................................................................................... 10
4.6 Site Surface Drainage .......................................................................................................... 10
4.7 Wetlands ............................................................................................................................. 10
5.0 Geotechnical Investigation ..................................................................................................... 15
5.1 Objectives ............................................................................................................................ 15
5.2 Field Investigations ............................................................................................................. 15
5.3 Soil Profiles .......................................................................................................................... 15
5.4 Groundwater ....................................................................................................................... 17
5.5 Laboratory Investigations ................................................................................................... 17
5.5.1 Particle Size Distribution .............................................................................................. 17
5.5.2 Attergberg Limit ........................................................................................................... 18
5.5.3 Acid Sulphate Soil Exclusion Tests ............................................................................... 21
6.0 Site Evaluation and Recommendations .................................................................................. 23
6.1 Site Classification ................................................................................................................ 23
6.2 Soil Reactivity ...................................................................................................................... 23
6.3 Soil Permeability and Drainage ........................................................................................... 25
6.4 Site Preparation .................................................................................................................. 25
6.5 Excavation and Dewatering ................................................................................................ 26
6.6 Compaction ......................................................................................................................... 27
6.7 Fill Material ......................................................................................................................... 28
7.0 References .............................................................................................................................. 28
8.0 Limitations ............................................................................................................................... 29

Southern River Precinct 3D Geotechnical Report
4
Integrating Resource Management
List of Figures
Figure 1: Site Location ..................................................................................................................... 7
Figure 2: Outline Development Plan ............................................................................................... 8
Figure 3: Topography and Groundwater ...................................................................................... 12
Figure 4: Soil Geology ................................................................................................................... 13
Figure 5: Wetlands ........................................................................................................................ 14
Figure 6: Geotechnical Investigation Locations ............................................................................ 16
Figure 7: Particle Size Distribution Graph ..................................................................................... 18
Figure 8: Atterberg Graph ............................................................................................................. 20
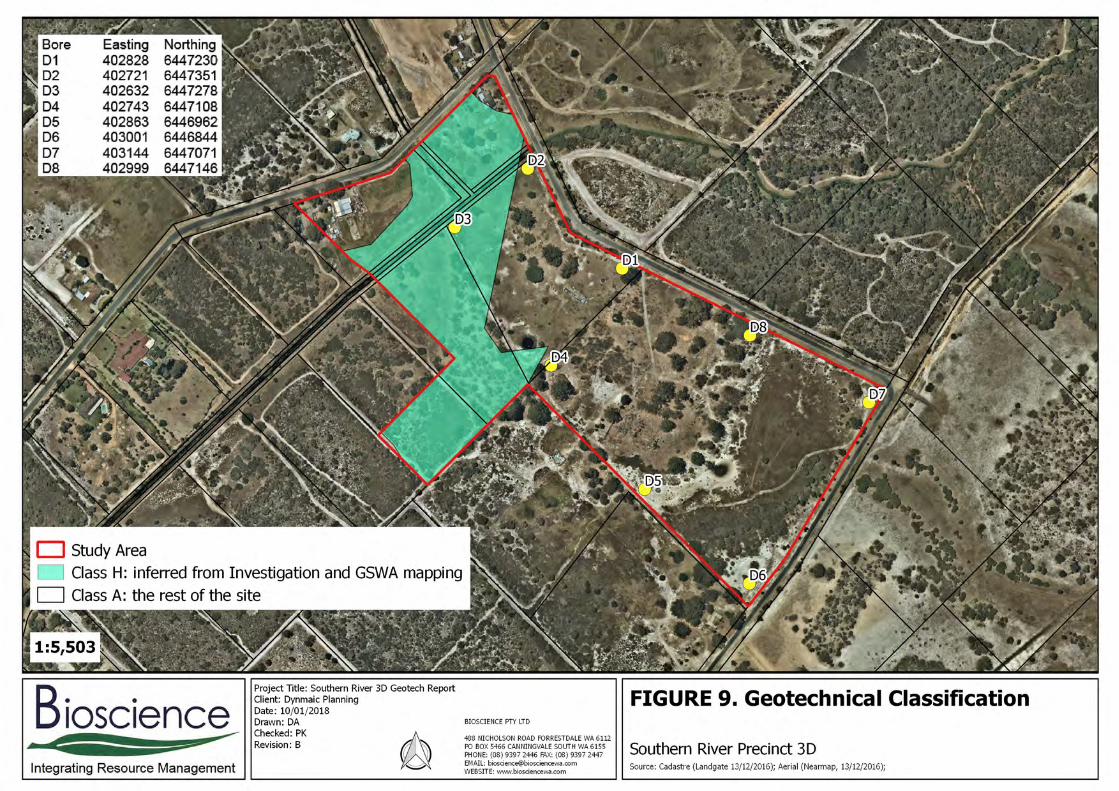
Figure 9: Site Classification ........................................................................................................... 24
List of Tables
Table 1: Atterberg Testing Results ................................................................................................ 19
Table 2: Acid Sulphate Testing Results ......................................................................................... 22
Table 3: Acid Sulphate Soils Project Risk Assessment .................................................................. 27
List of Appendices
Appendix 1: Soil Profile Logs ......................................................................................................... 30
Appendix 2: Groundwater Monitoring Data ................................................................................. 38

Southern River Precinct 3D Geotechnical Report
5
Integrating Resource Management
1.0 Executive Summary
This report covers lots 9 and 1792 Holmes street, contained within precinct 3D of the Southern
River structure plan. The objective of this report is to determine the suitability of the area for
urban development from a geotechnical perspective. The site is gently undulating Bassendean
sand ranging in height from 21 - 24m AHD, with the Forrestdale main drain forming the
northwest boundary of the site. Groundwater occurs between 0.7 and 2.6 metres below
ground level over the site at maximum levels.
Bioscience undertook field and laboratory investigations of the soils over the site to determine
their physical and chemical properties to in relation to soil profiles, permeability, reactivity and
acid sulphate potential. Field investigation consisted of 8 mechanically augered holes from
which soils profiles were logged, and samples taken for laboratory analysis.
Acid sulphate soil testing showed low acid sulphate potential, with none of the tested samples
displaying properties of potential acid sulphate soils, however, soils are generally acid in nature
and further investigation would be required if there is to be large scale excavation of natural
soils.
Soil profiles show the site to be Bassendean sand of varying depth over Guilford formation clays
of low reactivity. Sands were found to be medium textured with thickness ranging from 2.25 to
4.2 metres, whilst clays are sandy clays. Coffee rock (indurated iron rich silty sands) was
intersected in some of the holes at varying depths generally at the interface between the clays
and sandy clays.
The majority of the site is Class A” as defined in the Residential Slab and Footings (Australian
Standard 2870). An area with sandy clay at the surface, which full extent was inferred from the
GSWA mapping, was defined as Class H.

Southern River Precinct 3D Geotechnical Report
6
Integrating Resource Management
2.0 Introduction
This report describes the geotechnical investigations undertaken by Bioscience Pty Ltd in the
precinct 3D area of Southern River, with a specific focus on Lots 9 and 1792 Holmes street,
Southern River (figure1). The investigation was commissioned by the owners of the properties
who are seeking to develop the land into an urban subdivision. The lots collectively cover
15.94ha.
This report has been developed for the owners, based on the proposals presented and their
contained terms of reference which have been accepted. The advice contained within this
report is based on the information obtained and the assumptions which are expressed herein.
Should the information received or the assumptions be incorrect, then Bioscience shall accept
no liability in respect of the advice whether under law of contract, tort or otherwise.
Within Southern River region, the City of Gosnells has identified several precincts, of which the
site is located within Precinct 3D. Precinct 3D is bounded by Passmore street, Holmes Street,
Matison street, Phoebe street, the Forrestdale main drain and Furley road and is characterised
by areas of flat, low lying land and a relatively high water table. Bioscience was asked to
investigate the land, with the objective of determining the geotechnical condition present, and
whether it is suitable for rezoning to urban, and any requirements to enable development.
3.0 Proposed Development
The site is proposed to be developed into a residential subdivision consisting of varying
densities of housing, a retirement living area, a commercial area and areas of public open space
(figure 2).

Figure 1: Site Location
N
0 1.5 2.5 5.0km
Site Location

13m R
oad Rese
rve
16m Road Reserve
15m
Roa
d Res
erve
16m
Roa
d Res
erve
15m
Road
Reserve
PROPOSED FUTUREHOLMES ROAD REALIGNMENT
9
1792
AREA SUBJECT TOFUTURE ODP
8
6
13m
Roa
d R
eser
ve
6
15m
Roa
d Res
erve
15m
Roa
d Res
erve
15m Road Reserve
13m R
oad Rese
rve
16m Road Reserve
15m
Roa
d Res
erve
15m
Roa
d Res
erve
13m
Roa
d Res
erve
13m
Roa
d R
eser
ve
13m Road Reserve
16m Road Reserve
16m Road Reserve
15m R
oad Reserve
GH
GH
Public Open Space
R30
R30
P. O. S.
R30
R30
R30
R40
R40
R30
R40
HO
LME
S
PASSM
OR
E
STR
EET
PHOEBE
STREET
STREET
AREA SUBJECT TOFUTURE ODP
P. O. S.
R40
R30
P. O. S.
R30
MATISON
STREET
R30
R30
16m Road Reserve
16m Road Reserve
15m Road Reserve
13m Road Reserve
15m Road Reserve
NOISE WALL TO BE CONSTRUCTED ALONG THE HOLMES STREET
BOUNDARY IN ACCORDANCE WITH STATE PLANNING POLICY No. 5.4. NOISE
WALL HEIGHT TO BE CONFIRMED.
R40GH
15m
Roa
d Res
erve
15m
Roa
d Res
erve
13m
Roa
d Res
erve
13m Road Reserve
R40
LOT 9 (No. 419) HOLMES STREETSOUTHERN RIVERCOPYRIGHT RESERVED BASE PLAN COURTESY OF LANDGATE
FILE: 072_09.01.2018.dwg
SCALE: 1:3000 @ A3
DATE: 9th JANUARY 2018
DRAW: - SB
CHECKED: -
W E
S
N
DISCLAIMER: This document is and remains the property of Dynamic Planning and Developments and may not be copied in whole or in part without the written consent of Dynamic Planning and Developments. All areas, distances and angles are approximate only and are subject to survey.
DYNAMIC PLANNINGA N D D E V E L O P M E N T S
UrbanDevelopmentInstitute ofAustraliaWESTERN AUSTRALIA
e: [email protected]: (08) 9275 4433f: (08) 9275 4455
SUITE 15, 29 COLLIER ROADMORLEY WA 6062
ABN: 99 169 411 705
PROPOSED OUTLINEDEVELOPMENT PLAN - R30/40
Subject Land
Residential R30
Residential R40
Unrestricted Public Open Space
Restricted Public Open Space
Noise Wall
Water Courses
DEVELOPMENT TABLE:
ODP Area: 15.94ha
Unrestricted P.O.S. 1.2389ha
Restricted P.O.S. 5138m²
Water Courses: 4545m²
Residential R40: 2.50ha
Residential R30: 6.45ha
Holmes Street
Road Widening: 2.00ha

Southern River Precinct 3D Geotechnical Report
9
Integrating Resource Management
4.0 Site Description
4.1 Land Use
The land is used for horse paddocks and stables, with horses grazing lots 9 and 1972 Holmes
street, and a stable on lot 1792. There are fences around the lots and numerous rubbish and
rubble piles. The remnants of a small piggery are present on lot 1792 Holmes street.
4.2 Topography
The area has a low relief with minor variations in topography. The area generally lies between
20m AHD and 22m AHD with some areas above 22m AHD (figure 3).
4.3 Vegetation
The site is mostly devoid of native vegetation as it has been cleared for grazing. The majority of
vegetation on the site is introduced trees, pasture and low scrub.
4.4 Geology and Geomorphology
The subject site is located on the Swan Coastal Plain within the Bassendean dune system, an
area characterised by low dunes of siliceous sand interspersed with poorly drained areas or
wetlands. Soils tend to be a deep bleached grey colour sometimes with a pale yellow B horizon
or a weak iron-organic hardpan at depths generally greater than 2 m.
Underlying the Bassendean formation is the Guildford formation. The soils of the Guildford
formation are complex, and comprise a successive layering of soils formed from erosion of
material from the scarp to the east. Rivers and streams have mostly carried the eroded
material, which is deposited from the water as fans of alluvium. The Guildford formation is
characterised by poor drainage due to the low permeability of sub-soil clays which prevent the
downward infiltration of rainfall, consequently during the winter month’s water logging and
surface inundation can occur. In addition, the clay fraction of the Guildford formation is known
to have highly variable Plasticity Indices (Hillman et al., 2003).
The geology at the site as per the Geological Survey of Western Australia 1:50000
Environmental Geological Series Armadale Map part of sheet 2033 I and part of sheet 2133 IV
is:
S8 – SAND – Very light grey at surface, yellow at depth, fine to medium grained,
sub-rounded quartz, moderately well sorted of eolian origin

Southern River Precinct 3D Geotechnical Report
10
Integrating Resource Management
S10 – SAND – As for S8 over sandy clay to clayey sand of the Guilford formation,
of eolian origin
Sp1 – PEATY SAND – grey to black, fine to medium grained, moderately sorted
quartz sand, slightly peaty, of lacustrine origin
A soil geology map can be seen in figure 4.
4.5 Groundwater
The hydrology of the Southern River area on a broad scale is characterised by flat land of
Bassendean sand dunes with quite low relief hosting a superficial aquifer which is about 30 m
thick. The Southern River itself acts as a local discharge point for this superficial aquifer and is
thus the lowest local groundwater level. The Perth Groundwater Atlas (2004) shows the
groundwater contours slope downwards in a north easterly direction towards the Southern
River, but also strongly influenced by the Forresdale main drain. The groundwater atlas
suggests that groundwater is approximately 1 to 2.5 m below the surface across the site, based
on May 2003 data when local groundwater would be approaching annual minimum levels
(Figure 3). Groundwater monitoring and modelling of the southern river district was conducted
initially by JDA (2002) and then by Rockwater (2005). Both the JDA and Rockwater reports
indicate that groundwater flow on the site is in a north easterly direction towards the Southern
River with an Average Annual Maximum Groundwater Levels (AAMGL) of 20 mAHD.
4.6 Site Surface Drainage
The major surface water drainage feature of the site is the Forrestdale main drain which forms
the north west boundary of the site, whilst in the eastern portion of the site, a seasonal lake
forms as an expression of the groundwater, but is also a significant drainage feature. The
topography of the site, with the high central area splits the surface drainage between west and
east.
4.7 Wetlands
The Geomorphic Wetlands Dataset displays the location, boundary, geomorphic classification
and management category of wetlands on the Swan Coastal Plain. The information contained
within the dataset was originally digitised from the Wetlands of the Swan Coastal Plain Volume
2B Wetland Mapping, Classification and Evaluation: Wetland Atlas, which was captured at a
scale of 1:25,000 (Hill et al. 1996b). According to the dataset the site has areas of Multiple Use
Wetlands (MUW) (15633 Dampland, 15772 Dampland, and 15781 Dampland). On the north
site of Holmes street there is a Conservation Category Wetland (CCW), Dampland 7720. Both

Southern River Precinct 3D Geotechnical Report
11
Integrating Resource Management
Dampland 15781 and 15633 which are on the site abut the CCW. Forrestdale main drain also
flows into the CCW as a natural floodplain area before discharging into the Southern River.
There are also numerous Resource Enhancement Wetlands (REW) near the site. The location of
the wetlands can be seen in figure 5.
Around one third of lot 1792 has been classified by the City of Gosnells as an Environmental
Protection Policy (Swan Coastal Plains) 1992 (EPP) lake in their 2004 structure plan (Figure 7).
EPP lakes are generally recognised as having significant conservation value; however this seems
to contradict the current MUW classification in regards to both management category and
boundaries. The lake also appears to be experiencing increasing dry periods as observed by
aerial photography. Bioscience is preparing a request to have the wetland removed from the
EPP lakes register by following the guidance for modifying wetlands.


Southern River Precinct 3D Geotechnical Report
15
Integrating Resource Management
5.0 Geotechnical Investigation
5.1 Objectives
Determine soil and groundwater (if encountered) conditions to a depth of 2.5 metres
below current ground level.
Provide advice on any need for groundwater control or subsoil drainage
Determine soil permeability and suitability for stormwater infiltration.
Determine the site classification according to AS 2870 (1996), and recommend
measures to upgrade classification if required.
Provide advice in relation to excavation control requirements, site preparation
earthworks, characteristics of fill requirements and compaction control.
5.2 Field Investigations
Field investigations took place in April 2011 with 8 boreholes dug using a mechanical hollow
tipped auger drill rig that provides core samples of the soil profile as the hole is drilled. From
the soils cores, soil profiles were logged and samples taken for laboratory analysis (Figure 6).
Piezometers were installed into the drilled boreholes for groundwater investigations.
5.3 Soil Profiles
The site has a typical soil profile of sand over sandy clays, with a layer of weakly cemented iron
rich silty sand (coffee rock) commonly found between the sand and clays.
The common soil profile was found at all boring locations except for D3, which was loamy and
clayey sands all the way through the profile. The depth of sand at each location varied between
4200mm at D4 and 2250mm at D5, the sand was generally grey and white medium textured
Bassendean sand. Coffee rock was intersected at all except two of the locations, D3 and D 6,
and occurred at variable locations within the soil profile, most commonly at the interface
between sands and clayey sands. Clayey sands are of the Guilford formation and varied from
grey to brown in colour. Soil profile logs and photos can be seen in Appendix 1.


Southern River Precinct 3D Geotechnical Report
17
Integrating Resource Management
5.4 Groundwater
Groundwater conditions at the site have been assessed through the use of piezometers
installed during drilling and collection of soil cores. Groundwater has since been monitored on
a regular basis to determine seasonal fluctuations in groundwater levels and how they may
impact upon development of the site. Groundwater at the site has occurs between 0.7 and 2.6
metres below ground level and has a seasonal fluctuation of up to 2m. Groundwater levels can
be seen in Appendix 2. Given that the Forrestdale Main Drain runs through the site it will have
a lowering effect on the groundwater of the site when the groundwater rises and intersects the
level of the drain.
5.5 Laboratory Investigations
At the completion of the fieldwork, a program of laboratory tests was performed on selected
soil samples. Test results have been used to assist with the classification and determination of
engineering properties of the soil for this geotechnical investigation.
Particle size distribution – AS1289.3.6.1
Atterberg limit
Liquid limit – AS1289.3.1.2
Plastic limit - AS1289.3.2.1
Plasticity index – AS1289.3.3.1
Linear shrinkage – AS1289.3.4.1
Acid Sulfate Soil DEC field test plus total Carbon and Sulphur
The laboratory tests were carried out in accordance with the requirements specified in AS
1289 by Bioscience’s soil laboratory in Forrestdale.
5.5.1 Particle Size Distribution
Particle size distribution (PSD) was determined on soils collected during the field investigation
that gave a representative example of the soils present in the soil profiles of the site. The
results of the PSD analysis show that the sands on the site are generally a medium textured,
poorly to uniformly sorted sand with less than 5 per cent fines (<0.075mm). The clays on the
site are actually clayey sands with a fines content between 15 and 30 per cent. Graphs of PSD
can be seen in figure 7.
Fours samples contained more than 12 per cent fines and were therefore classified as clayey
sands, four of the samples contained less than 5 per cent fines and are classed as clean sands

Southern River Precinct 3D Geotechnical Report
18
Integrating Resource Management
generally poorly or uniformly sorted. The remaining three samples that underwent PSD are
borderline classifications between sands and clayey sands, with two of them being closer to
sands with between 5 and 8 per cent fines, and the other closer to clayey sands at 11.57 per
cent fines.
Figure 7: Particle Size Distribution Graph
5.5.2 Attergberg Limit
The Atterberg limits tests are simple standardized tests that were developed to determine the
water contents that will induce particular behaviour, and provides a useful measure of potential
soil reactivity and ground movements, which are fundamental in foundation design. Samples
that contained more than 20% of fines in PSD analysis underwent Atterberg testing.
Both samples plotted above the "A" Line , with sample D7 2900-4400 classified as a clay of low
plasticity. Sample D3 1200-1500 classified as a clay of high plasticity, making it a highly reactive
clay. The raw results for these tests are summarised in table 1.
0
10
20
30
40
50
60
70
80
90
100 D1 0 3500
D2 2750 3500
D3 1200 1500
D3 1500 2200
D3 2200 3500
D4 0 2250
D4 3750 4250
D5 2250 3150
D6 1500 +
D7 2900 4400
D8 3750 4350

Southern River Precinct 3D Geotechnical Report
19
Integrating Resource Management
Table 1: Atterberg Testing Results
Borehole Sample Depth
(m)
Soil Weight Liquid Limits Plastic Limits (PL)
Plastic Index (PI)
Linear Shrinkage
(LS)
Atterberg Classification Total
soil Weight
(g)
% fines (<425um)
No Blows (15 to
35)
Water content
(%)
Liquid Limits
(LL)
Water content (%) OR Plastic Limits (PL)
PI = LL - PL
Linear Shrinkage
(LS) (%)
D3 1200 1500 208.6 89.07 28 92.02 92.91 27.56 65.35 6.67 CH
D7 2900 4400 246.5 147.8 26 31.52 31.57 17.68 13.89 8.00 CL
NOTE: M = Silt, C = Clay, L = Low plasticity, I = Intermediate plasticity, H = High plasticity
These can be seen in Figure 8 where the A - Line separates soils that behave in the way of
organics and silts, plotting below the A - Line, to those that are clays and plot above the A -
Line. Given the fact that both soils have a high percentage of sand fraction and are classified as
clayey sands, the reactivity of the clay will not cause as much ground movement as if they were
more pure clays. Also the depth of the sand cover at D7 limits any impact the clay would have
on the surface.

Southern River Precinct 3D Geotechnical Report
20
Integrating Resource Management
CH
CL
MH
& O
H
ML
& O
L
A -
Line
Figure 8: Atterberg Graph

Southern River Precinct 3D Geotechnical Report
21
Integrating Resource Management
5.5.3 Acid Sulphate Soil Exclusion Tests
The acid sulphate risk maps for the site shows a large area of lot 1792 Holmes street to have a
high to moderate risk of acid sulphate soils occurring within 3m of the natural soil surface. The
rest of the site has a moderate to low risk of acid sulphate soils occurring within 3m of the
natural soil surface, but high to moderate risk below 3m. As a result of this, exclusion testing
was done on the soils collected during field investigation to determine the acid sulphate
potential.
Acid sulphate soils (ASS) exclusion testing involves the use of field testing and determination of
total sulphur content. If the Field test procedure indicated potential or actual acid sulphate
soils, determining the total sulphur can confirm or eliminate the result. For a sample to be
classified as potential acid sulphate soil the minimum “oxidisable” (SPOS) sulphur present must
be greater than 0.03% for a sand, or greater than 0.06% for sandy loams and light clay or
greater than 0.1% for silts and clays. Therefore if total sulphur is less than the specified levels,
then the sample cannot be potential or actual ASS.
The field test procedure involves measuring the field pH of the soil (pHF) and then using
hydrogen peroxide to oxidize the soil and then measure its oxidized pH (pHFOX). A field pH of
less than 3 can indicate an actual acid sulphate soil whereas if the field pH was not low and the
oxidized pH drops to less than 3, then the soil may be a potential acid sulphate soil. Drops in pH
of greater than 2 ph units indicate that a soil has potential to be oxidised and could be a risk of
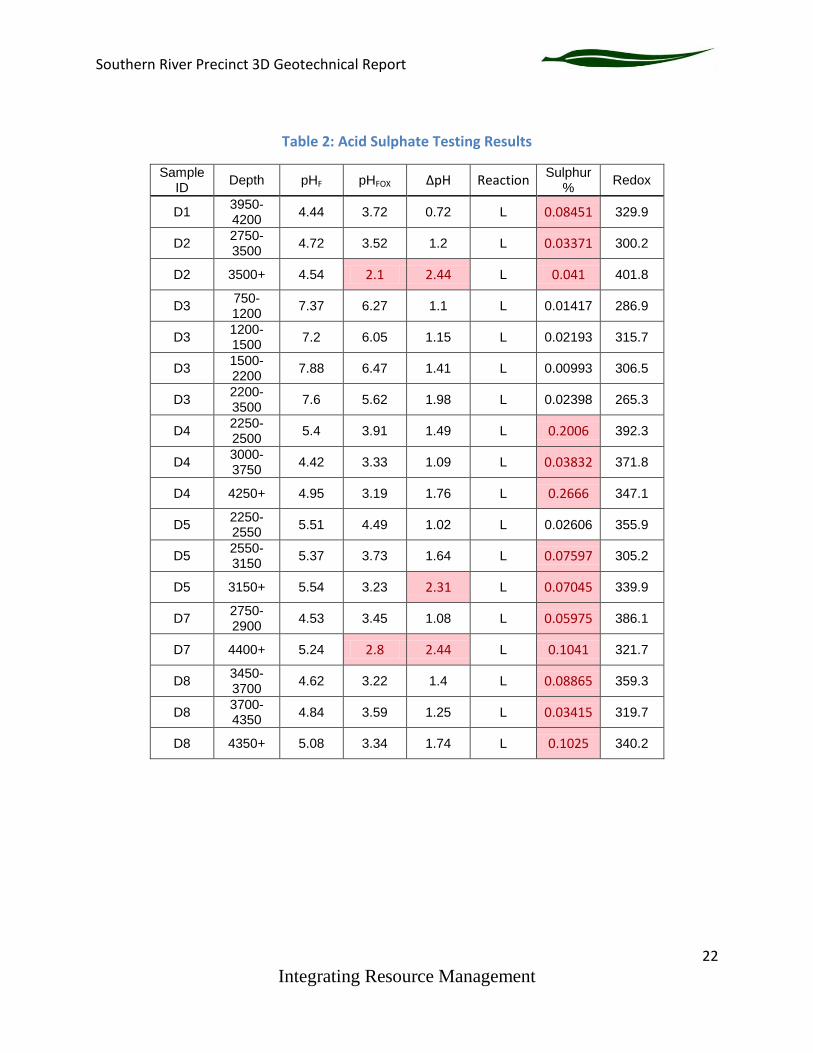
becoming acid sulphate soils. Table 2 summarises the results of the acid sulphate testing.
Selected soil samples collected during geotechnical investigation were analysed using the DEC
field test procedure as well as LECO carbon sulphur analyser and redox potential. Overall these
give an indication of whether or not soils are actual, potential or non acid sulphate soils.
Twenty samples underwent these tests and 3 samples came back as being potential acid
sulphate soils. These soils are generally soils deeper than 2.5 metres with higher clay contents,
or the presence of coffee rock. 13 samples returned results that indicate they are not acid
sulphate soils but have a sulphur content above the 0.03% threshold for treatment of acid
sulphate soils.
Any excavations of natural soils on the site will require more detailed investigation of the soils
in order to develop an acid sulphate soils management plan specific to the excavations that
would take place. If dewatering is to be required as part of any excavations, a dewatering
management plan would be required and a groundwater abstraction licence needed before any
dewatering can take place.
Southern River Precinct 3D Geotechnical Report
22
Integrating Resource Management
Table 2: Acid Sulphate Testing Results
Sample ID
Depth pHF pHFOX ∆pH Reaction Sulphur %
Redox
D1 3950-4200
4.44 3.72 0.72 L 0.08451 329.9
D2 2750-3500
4.72 3.52 1.2 L 0.03371 300.2
D2 3500+ 4.54 2.1 2.44 L 0.041 401.8
D3 750-1200
7.37 6.27 1.1 L 0.01417 286.9
D3 1200-1500
7.2 6.05 1.15 L 0.02193 315.7
D3 1500-2200
7.88 6.47 1.41 L 0.00993 306.5
D3 2200-3500
7.6 5.62 1.98 L 0.02398 265.3
D4 2250-2500
5.4 3.91 1.49 L 0.2006 392.3
D4 3000-3750
4.42 3.33 1.09 L 0.03832 371.8
D4 4250+ 4.95 3.19 1.76 L 0.2666 347.1
D5 2250-2550
5.51 4.49 1.02 L 0.02606 355.9
D5 2550-3150
5.37 3.73 1.64 L 0.07597 305.2
D5 3150+ 5.54 3.23 2.31 L 0.07045 339.9
D7 2750-2900
4.53 3.45 1.08 L 0.05975 386.1
D7 4400+ 5.24 2.8 2.44 L 0.1041 321.7
D8 3450-3700
4.62 3.22 1.4 L 0.08865 359.3
D8 3700-4350
4.84 3.59 1.25 L 0.03415 319.7
D8 4350+ 5.08 3.34 1.74 L 0.1025 340.2

Southern River Precinct 3D Geotechnical Report
23
Integrating Resource Management
6.0 Site Evaluation and Recommendations
6.1 Site Classification
The “Residential Slab and Footings Australian Standard 2870” provides a site classification
system and associated generic foundation design recommendations, for residential
development. The site classification system is based on the potential soil reactivity, and
associated ground movements, attributable to seasonal soil moisture variations or potential
problems sites due to adverse geotechnical conditions.
Where the sand is only a thin layer overlying clay substrate, the depth of sand will have a major
impact on the classification and hence the type and consequent cost of the slab and footing
construction. This classification is related to the amount of movement that the foundation can
accommodate without causing damage to the structure. This movement can be either
settlement or seasonal movement due to the swelling and shrinkage of the clayey soils due to
the wetting and drying caused by the varying water levels.
The site classification was determined using a combination of field and laboratory
investigations. Spatial variation in soils and topography mean caution must be observed when
assuming that site classification is continuous between any two investigation sites.
All of the site except the area around D3 (inferred from the GSWA mapping) is "Class A", as
defined in the Residential Slab and Footings (Australian Standard 2870), as these areas have
1.5m or greater sand over loamy/clayey soils. Site D3 is a "Class H" classification as defined in
the Residential Slab and Footings (Australian Standard 2870), as there is less than 1.5m of sand
cover over the loamy/clayey soils and surface movement may result from the reactive soils due
to moisture changes (Figure 9). This can be improved to a class A by the application of
engineered fill to the site after the removal of the reactive clays and creation of a separation of
1.5m to the loamy/clayey soils.
6.2 Soil Reactivity
Of the two samples tested for Atterberg limits D7 2900-4400 displayed low reactivity and D3
1200-1500 displayed high reactivity. As a result of this there is likely to be minimal surface
movement at D7 as a result of changes in moisture of the subsoil clays. Surface movement at
D3 are likely due to the proximity of the reactive clays to the surface and the shallow depth to
groundwater. Post development surface levels should be carefully considered to ensure any
ground movements from clays do not detrimentally impact upon buildings.

Southern River Precinct 3D Geotechnical Report
25
Integrating Resource Management
Further investigation of the class H area around D3 is recommended so as to determine the
true extent of the reactive clays to allow determination of appropriate treatment of that area.
The extent of the S10 soil type was assumed to be Class H. This should be confirmed through
the excavation of more test pits in the vicinity.
6.3 Soil Permeability and Drainage
The Bassendean sand surface soils have a permeability in the order of 10-3and 10-5 m/s based
on particle size distribution. This is generally suitable for onsite disposal of stormwater,
however the underlying low permeability coffee rock and clays, with permeabilities between
10-7 and 10-9m/s, mean drainage will have to be carefully considered. Fill material can be used
to increase the separation to clays to ensure effective performance of soak wells and infiltration
areas.
6.4 Site Preparation
The following site preparation procedure is recommended
Identification and diversion or protection of any buried services within the work area.
Removal of topsoil, organics, root, old services and other deleterious material from the
site.
Contouring/shaping of the ground surface to ensure surface runoff drains appropriately
form the site.
Proof compact the exposed surface using a suitable compaction plant. A minimum of 12
tonne static mass vibratory smooth drum roller is preferred to achieve densification of
sandy soil at depth. A minimum of eight overlapping passes should be provided.
Where the surface deforms excessively during compaction or wet and/or weak material
is exposed, over-excavation and replacement with compacted free draining sand fill may
be required.
Site works and preparation should be undertaken in summer or autumn, where
groundwater levels are near their seasonal lows, as soil will become very difficult to
work with in wet conditions.
Dewatering or drainage may be required to control groundwater levels. Experience
indicates that difficulties with compaction may occur when groundwater is present
within about 1.0 to 1.5m of the level at which compaction is applied.
Confirm that adequate compaction is achieved as outlined below.
Should compaction to satisfactory depth not be achieved by surface compaction it may
be necessary to over excavate, compact the base of the excavation and replace the soil
in compaction layers.

Southern River Precinct 3D Geotechnical Report
26
Integrating Resource Management
Place and compact approved clean free draining fill material in layers of no greater than
0.3m thickness, up to the level required.
6.5 Excavation and Dewatering
Based on the observed soil properties intersected during the fieldwork it is anticipated that
excavations across the site should be achieved using standard earthmoving equipment.
Excavations in sand areas are prone to instability; consequently care must be exercised in such
excavation and appropriate safety measures adapted where necessary.
Where excavations are required to extend into the clayey Guildford formation soils, before
building up with sand fill it’s will be necessary to re-establish a smooth clay surface to prevent
“tanking” of groundwater. Tanking of groundwater has the potential to significantly decrease
foundation stability.
Where excavations extend close to groundwater levels, dewatering may be required to draw
down the groundwater levels to 1m below the base of the excavation to achieve adequate
compaction. If possible, site preparation should occur during dry periods to reduce or cease the
dewatering requirements. Should dewatering be required, care must be taken to ensure nearby
groundwater dependent ecosystems are not adversely affected.
There remains a small potential of ASS occurring during dewatering and/or excavation,
consequently Bioscience recommends that site works attempt to maintain a low project risk
and defined by table 3 below. A dewatering licence would need to be obtained from the
Department of Water before any such work is undertaken. Any dewatering would require a
dewatering management plan and effluent discharge carefully monitored due to the proximity
to the Southern River.
Southern River Precinct 3D Geotechnical Report
27
Integrating Resource Management
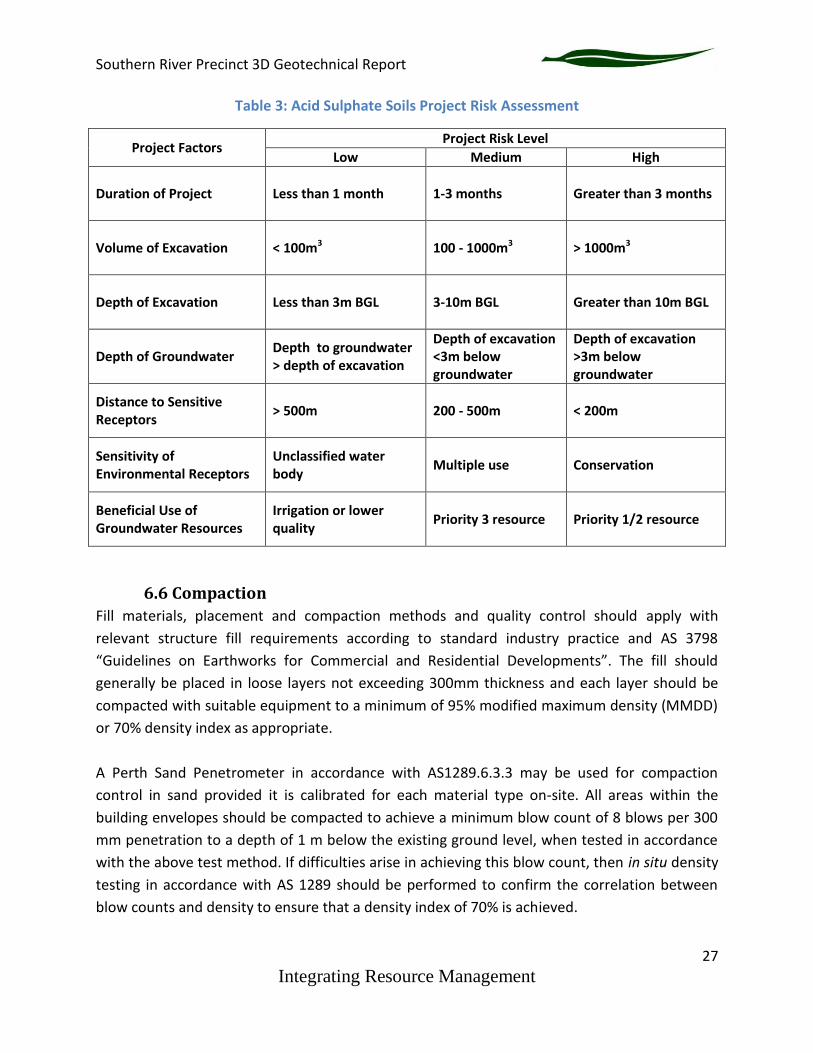
Table 3: Acid Sulphate Soils Project Risk Assessment
Project Factors Project Risk Level
Low Medium High
Duration of Project Less than 1 month 1-3 months Greater than 3 months
Volume of Excavation < 100m3 100 - 1000m3 > 1000m3
Depth of Excavation Less than 3m BGL 3-10m BGL Greater than 10m BGL
Depth of Groundwater Depth to groundwater > depth of excavation
Depth of excavation <3m below groundwater
Depth of excavation >3m below groundwater
Distance to Sensitive Receptors
> 500m 200 - 500m < 200m
Sensitivity of Environmental Receptors
Unclassified water body
Multiple use Conservation
Beneficial Use of Groundwater Resources
Irrigation or lower quality
Priority 3 resource Priority 1/2 resource
6.6 Compaction
Fill materials, placement and compaction methods and quality control should apply with
relevant structure fill requirements according to standard industry practice and AS 3798
“Guidelines on Earthworks for Commercial and Residential Developments”. The fill should
generally be placed in loose layers not exceeding 300mm thickness and each layer should be
compacted with suitable equipment to a minimum of 95% modified maximum density (MMDD)
or 70% density index as appropriate.
A Perth Sand Penetrometer in accordance with AS1289.6.3.3 may be used for compaction
control in sand provided it is calibrated for each material type on-site. All areas within the
building envelopes should be compacted to achieve a minimum blow count of 8 blows per 300
mm penetration to a depth of 1 m below the existing ground level, when tested in accordance
with the above test method. If difficulties arise in achieving this blow count, then in situ density
testing in accordance with AS 1289 should be performed to confirm the correlation between
blow counts and density to ensure that a density index of 70% is achieved.

Southern River Precinct 3D Geotechnical Report
28
Integrating Resource Management
6.7 Fill Material
Fill material will be required on site to ensure that an adequate separation of groundwater is
maintained (i.e. greater than 1.5m above AAMGL) on the provision that it contains less than 5%
fines (i.e. <0.075mm) and has a maximum particle size of 40mm and is free of any organic or
deleterious material.
7.0 References
AS 1289-2000. Methods of Testing Soils for Engineering Purposes. Standards Australia.
AS 1729-1993. Geotechnical Site Investigations. Standards Australia.
Davidson, W.A., 1995, Hydrogeology and Groundwater Resources of the Perth Region, Western
Australia. Geological Survey of West. Australia, Bull. 142.
Hillman M, Cocks, G and Ameratunga J. (2003) Guildford Formation, Australian Geomechanics
38: 31-39
JDA., (2002) Main Report: Impact of Existing Drains and Proposed Living Streams on
Groundwater Table and Nutrient Export. In Southern River/Forrestdale/Brookdale/Wungong,
Structure Plan, Urban Water Management Strategy.
Jordan J.E. (1986), Armadale, part sheets 2033 I and 2133 IV, Perth Metropolitan Region,
Environmental Geology Series, Geological Survey of Western Australia.
Perth Groundwater Atlas (2004) - Department of Water.

Southern River Precinct 3D Geotechnical Report
29
Integrating Resource Management
8.0 Limitations Bioscience Pty Ltd has prepared this report for Lots 9 & 1792 Holmes Street, Southern River,
WA. The work was carried out under Bioscience’s Conditions of Engagement. This report is
provided for the exclusive use of the landholders for this project only and for the purposes
described in the report. It should not be used by or relied upon for other projects or purposes
on the same or other site or by a third party. In preparing this report Bioscience has necessarily
relied upon information provided by the client and/or their agents.
The results provided in the report are indicative of the sub-surface conditions only at the
specific sampling or testing locations, and then only to the depths investigated and at the time
the work was carried out. Sub-surface conditions can change abruptly due to variable geological
processes and also as a result of anthropogenic influences. Such changes may occur after
Bioscience's field testing has been completed.
Bioscience's advice is based upon the conditions encountered during this investigation. The
accuracy of the advice provided by Bioscience in this report may be limited by undetected
variations in ground conditions between sampling locations. The advice may also be limited by
budget constraints imposed by others or by site accessibility.
This report must be read in conjunction with all of the attached notes and should be kept in its
entirety without separation of individual pages or sections. Bioscience cannot be held
responsible for interpretations or conclusions made by others unless they are supported by an
expressed statement, interpretation, outcome or conclusion given in this report.
This report, or sections from this report, should not be used as part of a specification for a
project, without review and agreement by Bioscience. This is because this report has been
written as advice and opinion rather than instructions for construction.

Southern River Precinct 3D Geotechnical Report
30
Integrating Resource Management
Appendix 1: Soil Profile Logs
D1 Depth
Type Colour Grade Shape Condition Consistency Structure From To
0 3500 Sand white grey uniform sub
rounded dry soft/loose layer
3500 3950 Sand grey
brown uniform
sub
rounded wet soft/loose layer
3950 4200 Sand brown uniform sub
rounded wet hard layer

Southern River Precinct 3D Geotechnical Report
31
Integrating Resource Management
D2 Depth
Type Colour Grade Shape Condition Consistency Structure From To
0 1250 Sand grey uniform sub
rounded dry soft layer
1250 2250 Sand white uniform dry soft layer
2250 2750 Sand brown uniform moist soft layer
2750 3500 Sand brown fine
uniform wet hard layer
3500 + Clayey
Sand
grey
brown well wet firm layer

Southern River Precinct 3D Geotechnical Report
32
Integrating Resource Management
D3 Depth
Type Colour Grade Shape Condition Consistency Structure From To
0 500 loamy
sand
light
brown well dry firm layer
500 750 loamy
sand yellow well moist firm layer
750 1200 clayey
sand
grey
mottled
orange
well moist firm layer
1200 1500 sandy clay
orange
mottled
grey
well moist firm layer
1500 2200 clayey
sand
grey
mottled
orange
coarse
well sorted moist firm layer
2200 3500 sandy clay grey well wet firm layer
3500 + sandy clay grey fine well
sorted wet firm layer

Southern River Precinct 3D Geotechnical Report
33
Integrating Resource Management
D4 Depth
Type Colour Grade Shape Condition Consistency Structure From To
0 2250 Sand grey unifrom dry soft/ loose layer
2250 2500 Sand brown fine
uniform moist soft layer
2500 3000 Sand grey
brown unifrom moist soft layer
3000 3750 Sand brown wet soft layer
3750 4250 Sand grey
brown wet soft layer
4250 + Sand brown wet firm layer

Southern River Precinct 3D Geotechnical Report
34
Integrating Resource Management
D5 Depth
Type Colour Grade Shape Condition Consistency Structure From To
0 750 Sand white
uniform
meduim
texture
dry soft layer
750 1500 Sand grey white
uniform
meduim
texture
dry soft layer
1500 2250 Sand brown
white
uniform
meduim
texture
dry soft layer
2250 2550 silty sand brown uniform wet soft layer
2550 3150 silty sand light
brown
fine
uniform wet soft layer
3150 + silty sand white poorly
sorted wet hard layer

Southern River Precinct 3D Geotechnical Report
35
Integrating Resource Management
D6 Depth
Type Colour Grade Shape Condition Consistency Structure From To
0 1500 Sand grey white unifrom sub
rounded dry soft/loose layer
1500 + Sand white unifrom sub
rounded moist to wet soft layer

Southern River Precinct 3D Geotechnical Report
36
Integrating Resource Management
D7 Depth
Type Colour Grade Shape Condition Consistency Structure From To
0 1500 Sand dark grey uniform dry soft/loose layer
1500 2750 Sand off white uniform moist soft/loose layer
2750 2900 silty sand brown poor moist firm layer
2900 4400 sandy clay brown well moist firm layer
4400 + silty sand brown poor wet firm layer

Southern River Precinct 3D Geotechnical Report
37
Integrating Resource Management
D8 Depth
Type Colour Grade Shape Condition Consistency Structure From To
0 1500 Sand grey uniform dry soft/loose layer
1500 3450 Sand
light
yellow
brown
uniform damp soft/loose layer
3450 3700 Sand dark
brown poor wet fard layer
3700 4350 Sandy clay brown well wet firm layer
4350 + silty sand brown well wet firm layer

Southern River Precinct 3D Geotechnical Report
38
Integrating Resource Management
Appendix 2: Groundwater Monitoring Data
17.5
18
18.5
19
19.5
20
20.5
21
21.5
mA
HD
Grounwater mAHD
D1
D2
D3
D4
D5
D6
D7
D8