Geophysicae over Brazil Annales - core.ac.uk · and imagers located at Cachoeira Paulista (45.0 ......
6
Annales Geophysicae (2005) 23: 379–384 SRef-ID: 1432-0576/ag/2005-23-379 © European Geosciences Union 2005 Annales Geophysicae The climatology of ionospheric plasma bubbles and irregularities over Brazil F. D. Chu 1,2 , J. Y. Liu 1, 3 , H. Takahashi 4 , J. H. A. Sobral 4 , M. J. Taylor 5 , and A. F. Medeiros 6 1 Institute of Space Science, National Central University, Taiwan 2 National Standard Time and Frequency Laboratory, Telecommunication Laboratories, Chunghwa Telecom Co. Ltd., Taiwan 3 Center for Space and Remote Sensing Research, National Central University, Taiwan 4 Instituto Nacional de Pesquisas Espaciais-NIPE, S˜ ao Jos´ e dos Campos, SP, Brazil 5 Space Dynamics Laboratory and Physics Department, Utah State University, USA 6 Departamento de F´ ısica, Universidade Federal de Campina Grande, Campina Grande, Brazil Received: 6 October 2003 – Revised: 27 October 2004 – Accepted: 2 November 2004 – Published: 28 February 2005 Abstract. In this paper, we examine ionospheric plasma depletions (or bubbles) and irregularities observed by pho- tometers and a ground-based receiver of the global position- ing system (GPS) both located in Brazil, South America. A simultaneous observation reveals that when the ionospheric plasma becomes depleted, the GPS total electron content de- creases and the associated phase fluctuations grow. Statis- tical results show that the plasma bubbles and the signifi- cant GPS phase fluctuations generally occur during October- March. The solar activity variation is not obvious in either observation except during the equinoctial months. The GPS phase fluctuations suggest that the most pronounced iono- spheric irregularities appear between 20:00 and 01:00 LT, which generally agree with previous ionospheric bubble ob- servations. Key words. Ionosphere (equatorial ionosphere; ionospheric disturbances; ionospheric irregularities) 1 Introduction Ionospheric plasma depletions (or bubbles) often coexist with ionospheric irregularities in the equatorial regions (Kel- ley, 1989). The plasma bubbles can be detected by means of optical techniques (Weber et al., 1978), as well as by scintil- lation techniques (Aarons, 1993). The first set of plasma bub- ble detections through the nocturnal OI6300 ˚ A airglow ob- servations was carried out by VanZandt and Peterson (1968) in Hawaii (geographical: 20.7 ◦ N, 156.3 ◦ W; geomagnetic: 22 ◦ N). They reported “enhancements in the form of north- south ridges” of the OI6300 ˚ A airglow but did not asso- ciate this with the bubble phenomenon. The nocturnal phe- nomenon of the large-scale ionospheric plasma bubbles has Correspondence to: J. Y. Liu ([email protected]) been extensively surveyed over Brazil for more than two decades through optical techniques (see the papers listed in Taylor et al., 1997; Sobral et al., 1980a, 1980b, 1999; Taka- hashi et al., 2001). Since the optical techniques only can be carried out during clear nights, a long-term observation is necessary. Based on data from 934 days of experimental observations of the atomic oxygen 630 nm (6300 ˚ A) noc- turnal airglow, obtained by means of scanning photometers and imagers located at Cachoeira Paulista (45.0 ◦ W, 22.7 ◦ S; -16.7 ◦ N geomagnetic), Sobral et al. (2002) reported the oc- currence characteristics of the large-scale ionospheric plasma depletions, during the period of 1977–1998, with solar activ- ity, season and geomagnetic activity. Over the past two decades, observations of the satel- lite signals have been used to derive phase and amplitude scintillation at various latitudes (see the papers listed in Aarons, 1993). A spaced-antenna scintillation system has been demonstrated that is able to establish climatology of zonal drift (Valladares et al., 1996). Furthermore, the es- tablishment of a Global Positioning System (GPS) provides an alternative way to investigate the ionospheric irregulari- ties. Some applications of GPS observations to equatorial aeronomy in South America have been reported (Aarons et al., 1997; Mendillo et al., 2000; Shan et al., 2002). Aarons et al. (1997) used GPS phase fluctuation, which is practi- cally the time variation of the total electron content (TEC), as an indicator of the occurrence of ionospheric irregulari- ties to study the occurrence of irregularities during the storm periods of 1993–1995. Mendillo et al. (2000) further devel- oped two indices to quantitatively examine the GPS phase fluctuations in various months during 1995–1998. A survey of the existing photometer/imager measurements (Sobral et al., 2002) and databases of the International GPS services (IGS) shows that there is some overlap be- tween the coverage of the scanning photometers at Cachoeira Paulista and that of the ground-based GPS receiver at Brasilia
Transcript of Geophysicae over Brazil Annales - core.ac.uk · and imagers located at Cachoeira Paulista (45.0 ......
Annales Geophysicae (2005) 23: 379–384SRef-ID: 1432-0576/ag/2005-23-379© European Geosciences Union 2005
AnnalesGeophysicae
The climatology of ionospheric plasma bubbles and irregularitiesover Brazil
F. D. Chu1,2, J. Y. Liu 1, 3, H. Takahashi4, J. H. A. Sobral4, M. J. Taylor 5, and A. F. Medeiros6
1Institute of Space Science, National Central University, Taiwan2National Standard Time and Frequency Laboratory, Telecommunication Laboratories, Chunghwa Telecom Co. Ltd., Taiwan3Center for Space and Remote Sensing Research, National Central University, Taiwan4Instituto Nacional de Pesquisas Espaciais-NIPE, Sao Jose dos Campos, SP, Brazil5Space Dynamics Laboratory and Physics Department, Utah State University, USA6Departamento de Fısica, Universidade Federal de Campina Grande, Campina Grande, Brazil
Received: 6 October 2003 – Revised: 27 October 2004 – Accepted: 2 November 2004 – Published: 28 February 2005
Abstract. In this paper, we examine ionospheric plasmadepletions (or bubbles) and irregularities observed by pho-tometers and a ground-based receiver of the global position-ing system (GPS) both located in Brazil, South America. Asimultaneous observation reveals that when the ionosphericplasma becomes depleted, the GPS total electron content de-creases and the associated phase fluctuations grow. Statis-tical results show that the plasma bubbles and the signifi-cant GPS phase fluctuations generally occur during October-March. The solar activity variation is not obvious in eitherobservation except during the equinoctial months. The GPSphase fluctuations suggest that the most pronounced iono-spheric irregularities appear between 20:00 and 01:00 LT,which generally agree with previous ionospheric bubble ob-servations.
Key words. Ionosphere (equatorial ionosphere; ionosphericdisturbances; ionospheric irregularities)
1 Introduction
Ionospheric plasma depletions (or bubbles) often coexistwith ionospheric irregularities in the equatorial regions (Kel-ley, 1989). The plasma bubbles can be detected by means ofoptical techniques (Weber et al., 1978), as well as by scintil-lation techniques (Aarons, 1993). The first set of plasma bub-ble detections through the nocturnal OI6300A airglow ob-servations was carried out by VanZandt and Peterson (1968)in Hawaii (geographical: 20.7◦ N, 156.3◦ W; geomagnetic:22◦ N). They reported “enhancements in the form of north-south ridges” of the OI6300A airglow but did not asso-ciate this with the bubble phenomenon. The nocturnal phe-nomenon of the large-scale ionospheric plasma bubbles has
Correspondence to:J. Y. Liu([email protected])
been extensively surveyed over Brazil for more than twodecades through optical techniques (see the papers listed inTaylor et al., 1997; Sobral et al., 1980a, 1980b, 1999; Taka-hashi et al., 2001). Since the optical techniques only canbe carried out during clear nights, a long-term observationis necessary. Based on data from 934 days of experimentalobservations of the atomic oxygen 630 nm (6300A) noc-turnal airglow, obtained by means of scanning photometersand imagers located at Cachoeira Paulista (45.0
◦
W, 22.7◦
S;−16.7
◦
N geomagnetic), Sobral et al. (2002) reported the oc-currence characteristics of the large-scale ionospheric plasmadepletions, during the period of 1977–1998, with solar activ-ity, season and geomagnetic activity.
Over the past two decades, observations of the satel-lite signals have been used to derive phase and amplitudescintillation at various latitudes (see the papers listed inAarons, 1993). A spaced-antenna scintillation system hasbeen demonstrated that is able to establish climatology ofzonal drift (Valladares et al., 1996). Furthermore, the es-tablishment of a Global Positioning System (GPS) providesan alternative way to investigate the ionospheric irregulari-ties. Some applications of GPS observations to equatorialaeronomy in South America have been reported (Aarons etal., 1997; Mendillo et al., 2000; Shan et al., 2002). Aaronset al. (1997) used GPS phase fluctuation, which is practi-cally the time variation of the total electron content (TEC),as an indicator of the occurrence of ionospheric irregulari-ties to study the occurrence of irregularities during the stormperiods of 1993–1995. Mendillo et al. (2000) further devel-oped two indices to quantitatively examine the GPS phasefluctuations in various months during 1995–1998.
A survey of the existing photometer/imager measurements(Sobral et al., 2002) and databases of the InternationalGPS services (IGS) shows that there is some overlap be-tween the coverage of the scanning photometers at CachoeiraPaulista and that of the ground-based GPS receiver at Brasilia

380 F. D. Chu et al.: The ionospheric plasma bubbles climatology over Brazil
Fig. 1. The view area and encompassed coverage of the photome-ter at Cachoeira Paulista (dashed circle) and the GPS receiver atBrasilia (solid circle) superposed on the map of South America. Theimager covers a zenith angle range of about 80◦, while the receivercollects signals for the elevation angle greater than 15◦.
(47.9◦
W, 16◦
S;−9.4◦
N geomagnetic). The overlapped cov-erage provides scientists with a good opportunity to under-stand the relationship between ionospheric plasma bubblesand irregularities over Brazil (see Fig. 1). In this paper, a si-multaneous observation of the two instruments is examined.The two long-term databases are then employed to investi-gate the occurrence of ionospheric plasma bubbles and irreg-ularities in various solar activities, seasons, and local times.
2 Observation and interpretation
Several photometers and imagers were operated at CachoeiraPaulista during 1977–1998 while a ground-based GPS re-ceiver has been set up at Brasilia since 1995. Figure 1 illus-trates the locations of the imagers, and the receiver, as wellas the associated view area and encompassed coverage su-perposed on the map of South America. The imager covers azenith angle range of about 80◦, while the GPS receiver col-lects signals for the elevation angle greater than 15◦. Becausethe OI6300A emission layer is assumed to be at the heightof the 270 km (Sobral et al., 2002) and the ionospheric-pointheight of GPS satellite-receiver path is given to be 400 km(cf. Tsai and Liu, 1999), the scanning photometers at Ca-choeira Paulista observe bubbles in a range of about 13
◦
Sto 32
◦
S latitudes (−7◦
N to −25◦
N, geomagnetic) and theground-based GPS receiver at Brasilia monitors bubbles ina range about 7
◦
S to 24◦
S latitudes (−2◦
N to −17◦
N, ge-omagnetic). The corresponding horizontal-coverage diame-ters of the two observations are both about 2000 km, and theiroverlapped coverage is in a range of about 13
◦
S to 24◦
S lat-itudes (−7
◦
N to −17◦
N, geomagnetic).
Fig. 2. The nocturnal ionospheric phenomena recorded with a pho-tometer and a GPS receiver on 18 March 1999.(a) Intensity vari-ations of OI6300 F-region component observed by a zenith pho-tometer over Cachoeira Paulista. After Takahashi et al. (2001).(b)Relative vertical TEC derived from GPS at Brasilia,(c) 15-min fpindex, and(d) hourlyFp index.
A simultaneous observation using the two instrumentswas carried out from the evening of 18 March 1999 to thepredawn of 19 March 1999. Figure 2a, adopted from Taka-hashi et al. (2001), illustrates absolute values of the emissionrate of 630 nm, in Rayleighs, over Cachoeira Paulista, ob-served with a zenith looking airglow imager during the oc-currence of the plasma bubble event. It can be seen that largeand small intensity depletions occur from 22:10 to 23:10 LTand from 00:20 to 01:05 LT, respectively. To quantitativelycharacterize phase fluctuations, we derive the relative verti-cal total electron content (VTEC), as well as calculate theindices fp and Fp from the high-pass-filtering GPS slant-TECs (for details, see Mendillo et al., 2000). The indexfp ofa certain GPS satelliten is defined as the median value over a15-min period of phase fluctuation data from a GPS satellite,
fp(n, h, i) = Median
∣∣∣∣1TEC
min
∣∣∣∣ ,where1TEC is defined by subtracting each TEC from itsprevious value, andi denotes each quarter of the hour,h.Thesefp values are then averaged over a period of 1 h forall satellites available to a station, and multiplied by 1000, to
F. D. Chu et al.: The ionospheric plasma bubbles climatology over Brazil 381
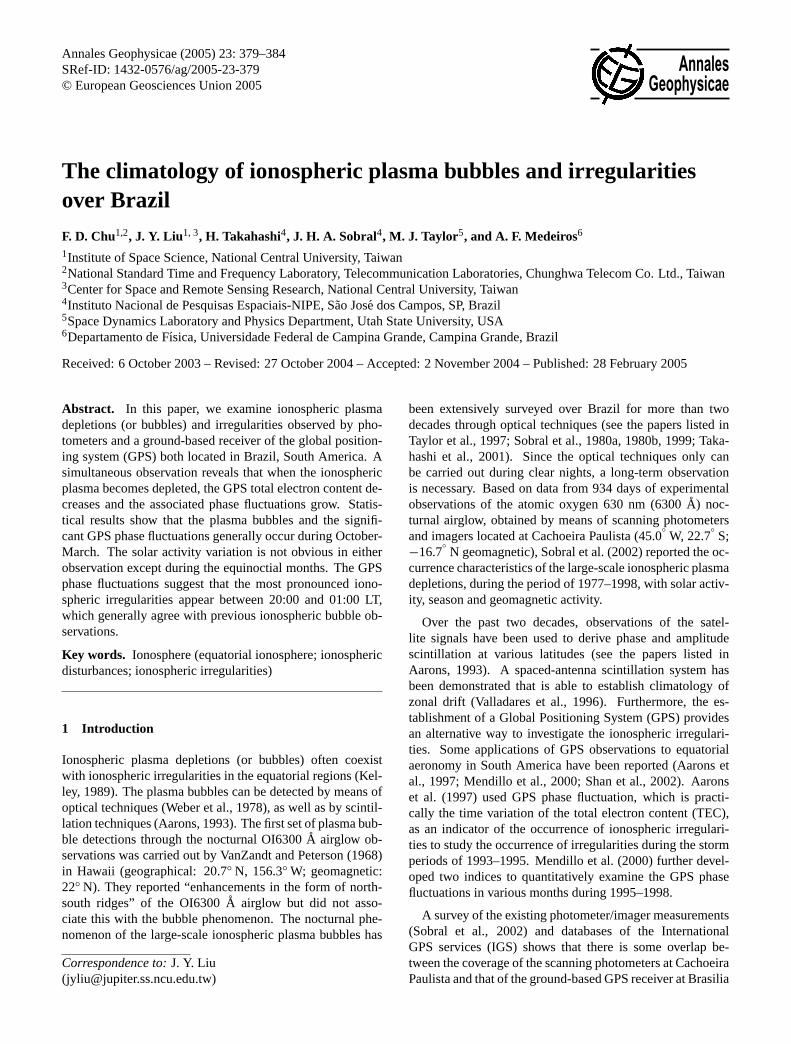
Fig. 3. Frequency of occurrence of the plasma bubbles over Ca-choeira Paulista. After Sobral et al. (2002).(a) complete solar cycle(1977–1998, 934 days),(b) high solar activity (1978–1982, 1988–1992, 442 days), and(c) low solar activity (1977, 1983–1987 and1993–1998, 492 days).
give the integer indexFp, which represents the average levelof irregularities in the hour above that specific station,
Fp(h) =
∑nsatn
(∑ki fp(n, h, i)/k
)nsat(h)
×1000.
Figures 2b, 2c, and 2d illustrate the corresponding VTEC,fp and Fp indices, respectively. It can be seen that whenthe large depletions in the emission rate occur from 22:10to 23:10 LT (Fig. 2a), the decreases in VTEC (Fig. 2b) andthe significant enhancements of the two indices (Figs. 2c and2d) also appear during 22:00–23:30 LT. The heavy curvein Fig. 2b illustrates that the VTEC measured using theGPS satellite PRN#4 decreases, which agrees well with theOI6300A depletions in Fig. 2a. However, there are no ob-vious GPS VTEC decreases and phase fluctuations observedduring the small intensity depletions appearing from 00:20 to01:05 LT.
To further investigate ionospheric plasma bubbles and ir-regularities occurring in various solar activities, the long-term database of the photometer obtained at CachoeiraPaulista is compared with the GPS phase fluctuationsrecorded at Brasilia. Figure 3, adopted from Sobral etal. (2002), illustrates the frequency of bubble occurrencein data from 934 days of experimental observations of theatomic oxygen 630-nm nocturnal airglow by means of scan-ning photometers and imagers during the period of 1977–1998. The frequency of occurrence yields greater valuesin October–March but smaller values in April–Septemberduring the 22 years (Fig. 3a). For the high solar activityperiod the frequency of occurrence produces greater val-ues in September–April but smaller values in May–August(Fig. 3b). Similarly, for the low solar activity period thefrequency of occurrence produces greater values in October-March but smaller values in April–September (Fig. 3c). Note
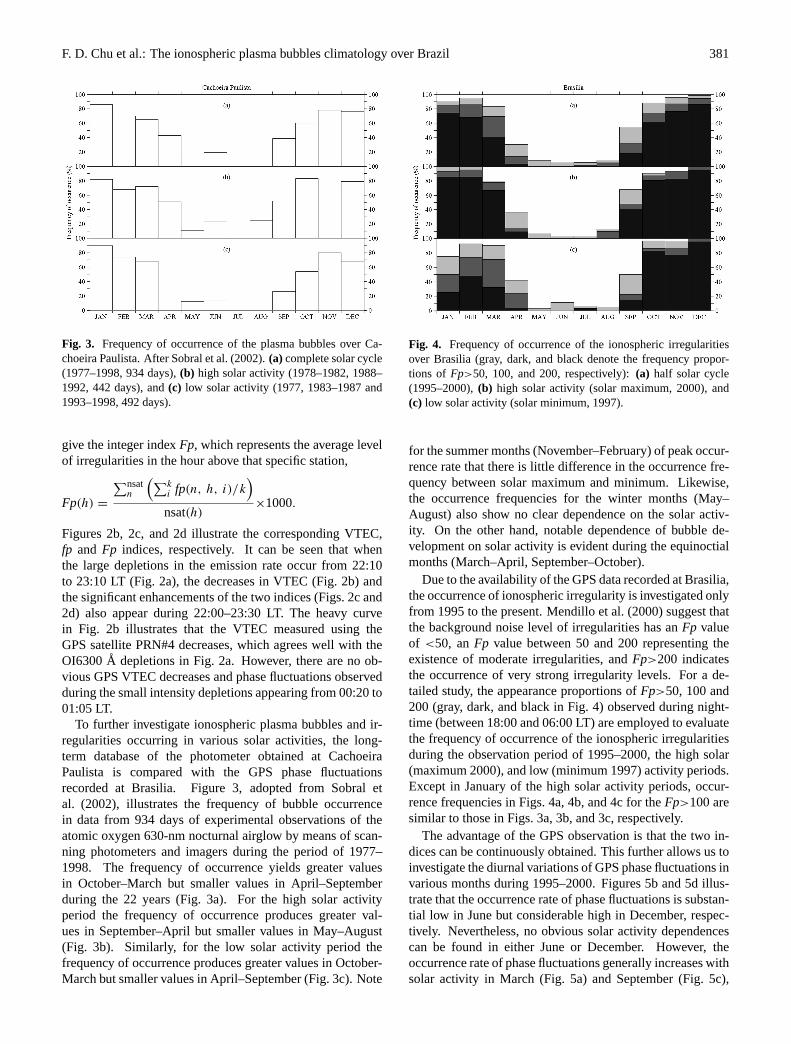
Fig. 4. Frequency of occurrence of the ionospheric irregularitiesover Brasilia (gray, dark, and black denote the frequency propor-tions of Fp>50, 100, and 200, respectively):(a) half solar cycle(1995–2000),(b) high solar activity (solar maximum, 2000), and(c) low solar activity (solar minimum, 1997).
for the summer months (November–February) of peak occur-rence rate that there is little difference in the occurrence fre-quency between solar maximum and minimum. Likewise,the occurrence frequencies for the winter months (May–August) also show no clear dependence on the solar activ-ity. On the other hand, notable dependence of bubble de-velopment on solar activity is evident during the equinoctialmonths (March–April, September–October).
Due to the availability of the GPS data recorded at Brasilia,the occurrence of ionospheric irregularity is investigated onlyfrom 1995 to the present. Mendillo et al. (2000) suggest thatthe background noise level of irregularities has anFp valueof <50, anFp value between 50 and 200 representing theexistence of moderate irregularities, andFp>200 indicatesthe occurrence of very strong irregularity levels. For a de-tailed study, the appearance proportions ofFp>50, 100 and200 (gray, dark, and black in Fig. 4) observed during night-time (between 18:00 and 06:00 LT) are employed to evaluatethe frequency of occurrence of the ionospheric irregularitiesduring the observation period of 1995–2000, the high solar(maximum 2000), and low (minimum 1997) activity periods.Except in January of the high solar activity periods, occur-rence frequencies in Figs. 4a, 4b, and 4c for theFp>100 aresimilar to those in Figs. 3a, 3b, and 3c, respectively.
The advantage of the GPS observation is that the two in-dices can be continuously obtained. This further allows us toinvestigate the diurnal variations of GPS phase fluctuations invarious months during 1995–2000. Figures 5b and 5d illus-trate that the occurrence rate of phase fluctuations is substan-tial low in June but considerable high in December, respec-tively. Nevertheless, no obvious solar activity dependencescan be found in either June or December. However, theoccurrence rate of phase fluctuations generally increases withsolar activity in March (Fig. 5a) and September (Fig. 5c),

382 F. D. Chu et al.: The ionospheric plasma bubbles climatology over Brazil
Fig. 5. The solar activity variations of GPS phase fluctuations in dif-ferent months during 1995–2000 over Brazil (gray, dark, and blackdenote the frequency of occurrence ofFp>50, 100, and 200, re-spectively):(a) March,(b) June,(c) September, and(d) December.The cross symbols denote missing data.
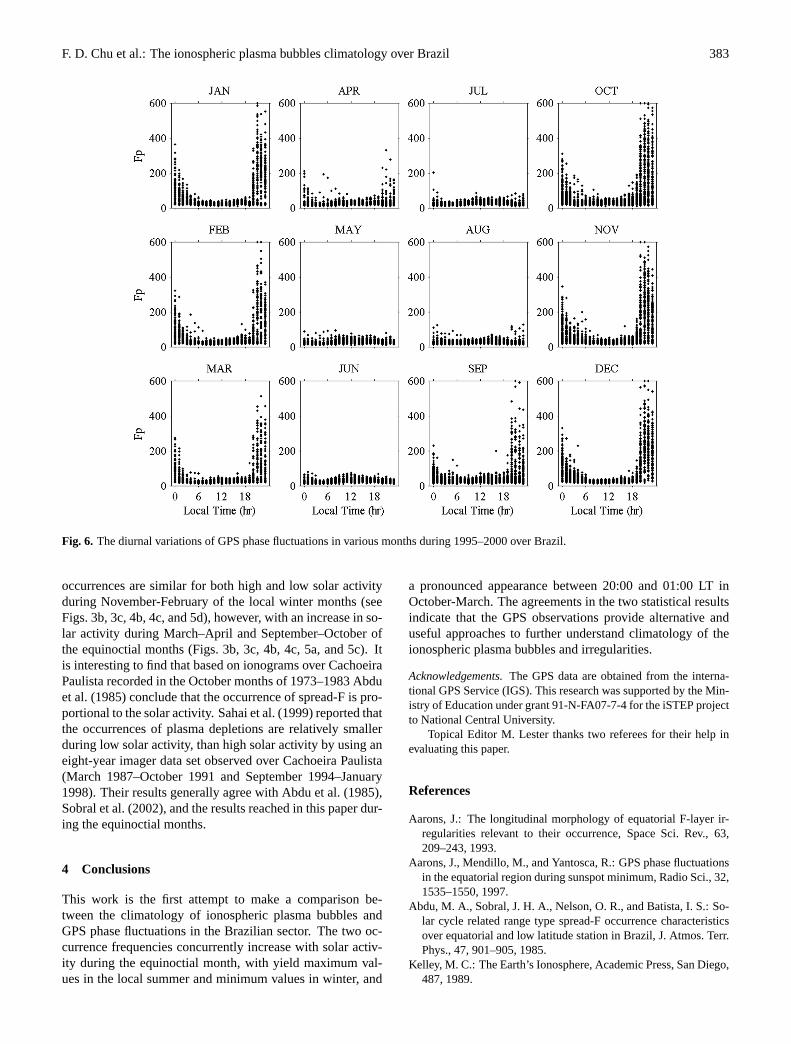
especially for stronger irregularities (for example,Fp>100).Figure 6 displays that the irregularity levels are generally be-low the noise levelFp<50 between May and August (lowirregularity months), and are very strongFp>200 betweenSeptember and April (high irregularity months). Meanwhile,it can be seen that theFp yield maximum values duringdaytime (about 12:00 or 14:00 LT) of the low irregularitymonths, and during nighttime (20:00–01:00 LT) of the highirregularity months.
3 Discussion
It is known that the photometers, imagers, and GPS mea-surements observe the large-scale phenomena of airglows,plasma depletion, and TEC phase fluctuations (Mendillo etal., 2000; Sobral et al., 2002; Takahashi et al., 2001; Aaronset al., 1997). The long-term studies of airglows and GPSphase fluctuations have been separately shown in the earlypapers (e.g. Sobral et al., 2002; Mendillo et al., 2000; Shan
et al., 2002). In this work, we examined simultaneous ob-servation of the two instruments and presented the statisticalcharacteristics of airglows and GPS phase fluctuations duringsolar minimum and maximum.
The simultaneous observations of the imager and GPSground-based receiver during 18-19 March 1999 show thatthe large intensity depletions and phase fluctuations appearbetween 22:10 and 23:10 LT. However, no obvious phasefluctuations could be observed during the occurrence of thesmall depletions between 00:20 and 01:05 LT. Note in thissimultaneous study that the observations of the imager wereobtained around the zenith while the phase fluctuations werederived from all the GPS satellites, moving in various di-rections at various locations, within the field-of-view of thereceiver. In general, bubbles appear in the western sky asan elongated north-south strip of reduced airglow bright-ness which moves eastward, passing through the local zenith.When a strip concurrently moves into the zenith of the im-ager and some line-of-sights between the GPS satellites andthe receiver, the two observations agree with each other. Theheavy curve in Fig. 2b illustrates the VTEC variations whenthe GPS satellite PRN#4 moved approximately along the lon-gitude 45
◦
W, which has the same magnetic flux tube of thezenith of the imager. It might be that either bubbles or irreg-ularities in the moving strip were too small and insignificantto be detected by the GPS observation and/or the strip wasnot simultaneously observed by the two instruments, whichresult in the discrepancy that occurred between 00:20 and01:05 LT. To answer this, instead of single receiver, the GPSphase fluctuation study might need a network with severalscattered receivers to have better coverage. Nevertheless, thelarge intensity depletions and phase fluctuations concurrentlydetected between 22:10 and 23:10 LT suggest that obser-vations of the collocated photometer and GPS receiver canbe employed to statistically study the climatology of iono-spheric plasma bubbles and irregularities.
The comparison of the two climatology results shows thatexcept in January of the low solar activity periods, occur-rence frequencies of the bubbles observed by the imagers andphotometers, and those of the indexFp>50 derived from theGPS receiver, are similar. A detailed study reveals that usingthe imager results as references, the frequencies of occur-rence ofFp>50 are slightly larger during May-August butsomewhat smaller during October-March. The discrepanciesbetween the two climatology studies might result from thetwo different database periods (imagers/photometers: 1977–1998; GPS: 1995–2000) and/or limited data being used tocalculate the occurrence frequencies. Take the discrepancyin January of the solar minimum shown in Figs. 3c and 4c asan example. The frequencies of occurrence of variousFp aresimply derived from 11-day GPS data in January 1997. Thus,the number of data points could significantly affect the cor-rectness of the occurrence frequencies. Nevertheless, eitherpossibility shall eventually be answered when two commonlong-term databases become available.
Meanwhile, it can be found from the imager and GPS re-sults that the seasonal patterns of the bubble and irregularity
F. D. Chu et al.: The ionospheric plasma bubbles climatology over Brazil 383
Fig. 6. The diurnal variations of GPS phase fluctuations in various months during 1995–2000 over Brazil.
occurrences are similar for both high and low solar activityduring November-February of the local winter months (seeFigs. 3b, 3c, 4b, 4c, and 5d), however, with an increase in so-lar activity during March–April and September–October ofthe equinoctial months (Figs. 3b, 3c, 4b, 4c, 5a, and 5c). Itis interesting to find that based on ionograms over CachoeiraPaulista recorded in the October months of 1973–1983 Abduet al. (1985) conclude that the occurrence of spread-F is pro-portional to the solar activity. Sahai et al. (1999) reported thatthe occurrences of plasma depletions are relatively smallerduring low solar activity, than high solar activity by using aneight-year imager data set observed over Cachoeira Paulista(March 1987–October 1991 and September 1994–January1998). Their results generally agree with Abdu et al. (1985),Sobral et al. (2002), and the results reached in this paper dur-ing the equinoctial months.
4 Conclusions
This work is the first attempt to make a comparison be-tween the climatology of ionospheric plasma bubbles andGPS phase fluctuations in the Brazilian sector. The two oc-currence frequencies concurrently increase with solar activ-ity during the equinoctial month, with yield maximum val-ues in the local summer and minimum values in winter, and
a pronounced appearance between 20:00 and 01:00 LT inOctober-March. The agreements in the two statistical resultsindicate that the GPS observations provide alternative anduseful approaches to further understand climatology of theionospheric plasma bubbles and irregularities.
Acknowledgements.The GPS data are obtained from the interna-tional GPS Service (IGS). This research was supported by the Min-istry of Education under grant 91-N-FA07-7-4 for the iSTEP projectto National Central University.
Topical Editor M. Lester thanks two referees for their help inevaluating this paper.
References
Aarons, J.: The longitudinal morphology of equatorial F-layer ir-regularities relevant to their occurrence, Space Sci. Rev., 63,209–243, 1993.
Aarons, J., Mendillo, M., and Yantosca, R.: GPS phase fluctuationsin the equatorial region during sunspot minimum, Radio Sci., 32,1535–1550, 1997.
Abdu, M. A., Sobral, J. H. A., Nelson, O. R., and Batista, I. S.: So-lar cycle related range type spread-F occurrence characteristicsover equatorial and low latitude station in Brazil, J. Atmos. Terr.Phys., 47, 901–905, 1985.
Kelley, M. C.: The Earth’s Ionosphere, Academic Press, San Diego,487, 1989.

384 F. D. Chu et al.: The ionospheric plasma bubbles climatology over Brazil
Mendillo, M., Lin, B., and Aarons, J.: The application of GPSobservations to equatorial aeronomy, Radio Sci., 35, 885–904,2000.
Sahai, Y., Fagundes, P. R., and Bittencourt, J. A.: Solar Cycle Ef-fects on Large Scale Equatorial F-Region Plasma Depletions,Adv. Space Res., 24, 1477–1480, 1999.
Shan, S. J., Liu, J. Y., Kuo, F. S., Liu, C. C., and Tsai, H. F.: GPSTEC phase fluctuations observed along the America Sector dur-ing low irregularity activity months of 1997–2000, Earth, Plan-ets, and Space, 54, 141–152, 2002.
Sobral, J. H. A., Abdu, M. A., and Batista, I. S.: Airglow studies onthe ionosphere dynamics over low latitude in Brazil, Ann. Geo-physicae, 36, 2, 199–204, 1980a.
Sobral, J. H. A., Abdu, M. A., Batista I. S., and Zamlutti, C. J.: As-sociation between plasma bubble and airglow disturbances overBrazilian low latitudes, Geophys. Res. Lett., 11, 980–982, 1980b.
Sobral, J. H. A., Abdu, M. A., Takahashi, H., Sawant, H. S., Zam-lutti, C. J., and Borba, G. L.: Solar and geomagnetic activityeffects on nocturnal zonal velocities of ionospheric plasma de-pletions, Adv. Space Res., 24, 11, 1507–1509, 1999.
Sobral, J. H. A., Abdu, M. A., Takahashi, H., Taylor, M. J., dePaula, E. R., Zamlutti, C. J., de Aquion M. G., and Borba, G.L.:Ionospheric plasma bubble climatology over Brazil based on 22years (1977–1998) of 630 nm airglow observations, J. Atmo. So-lar Terr. Phys., 64, 1517–1524, 2002.
Taylor, M. J., Eccles, J. V., Labelle, J., and Sobral, J. H. A.: High-resolution OI (630 nm) image measurements of F region deple-tion drifts during the Guara campaign, Geophys. Res. Lett., 24,1699–1702, 1997.
Takahashi, H., Taylor, M. J., Sobral, J. H. A., Medeiros, A. F.,Gobbi, D., and Santana, D. C.: Fine structure of the ionosphericplasma bubbles observed by the OI 6300 and 5577 airglow im-ages, Adv. Space Res., 27, 1189–1194, 2001.
Tsai, H. F. and Liu, J. Y.: Ionospheric total electron content re-sponse to solar eclipses, J. Geophys. Res., 104, 12 657–12 668,1999.
Valladares, C. E., Sheehan, R., Basu, S., Kuenzler, H., and Es-pinoza, J.: The multi-instrumented studies of equatorial ther-mosphere aeronomy scintillation system: Climatology of zonaldrifts, J. Geophys. Res., 101, 26 839–26 850, 1996.
VanZandt, T. E. and Peterson, V. L.: Detailed maps of tropi-cal nightglow enhancements and their implications on the iono-spheric F2 Layer, Ann. de Geophys., 24, 747–749, 1968.
Weber, E. J., Buchau, J., Eather, R. H., and Mende, S. B.: North-south aligned equatorial airglow depletions, J. Geophys. Res., 83,712–716, 1978.