GeoMx® Whole Transcriptome Atlas
4
FOR RESEARCH USE ONLY. Not for use in diagnostic procedures. PRODUCT BULLETIN GeoMx® Whole Transcriptome Atlas GeoMx® Whole Transcriptome Atlas The GeoMx Digital Spatial Profiler with the GeoMx Whole Transcriptome Atlas (WTA) empowers researchers to explore biology across a tissue. WTA is compatible with common sample types such as formalin-fixed paraffin embedded (FFPE) or fresh frozen (FF) and across all human tissues. The human whole transcriptome is measured in each region of interest (ROI) to uncover biological changes at specific locations in the tissue. Discover a new way to look at biology The GeoMx Whole Transcriptome Atlas delivers the maximum amount of sensitivity and confidence in each transcript through its unique probe architecture. WTA contains over 18,000 protein- coding genes based on the human gene nomenclature committee (HUGO1) database cross-referenced with available mRNA sequences in the National Center for Biotechnology’s Information (NCBI) RefSeq database2 (Figure 1). Along with a high specificity for their target molecules, DSP RNA probes are screened for a myriad of factors including melting temperature, GC content, off target hits, and repetitive sequences. Each probe is assigned a unique DSP barcode for downstream molecular counting on an Illumina sequencer. The targeted nature of WTA avoids the many pitfalls of poly(A) pulldown by delivering increased sensitivity even in heavily degraded tissues such as FFPE. With GeoMx WTA, researchers can explore pathways across the whole transcriptome in user defined regions of interest. 1 2 3 4 5 6 7 8 9 10 11 12 13 14 15 16 17 18 19 20 21 22 X Y Low Gene Density High Figure 1: Karyogram illustrating the density of genes in the human genome. The transcripts from these genes make up the human transcriptome and are measured by GeoMx WTA. Product Highlights • Whole transcriptome coverage with probes specific to protein coding mRNA sequences • Superior sensitivity to detect 1000s unique genes in <50 μm regions • Robust performance across sample types including FFPE with high concordance with RNA-seq and RNAscope™ • Map single cell RNA-seq populations to their tissue location • Integrated Illumina library prep protocols and streamlined NGS analysis pipelines • Flexibility to customize with up to 60 additional targets to assay non-coding RNA, synthetic DNA or exogenous genes • Visualization and statistical analysis using GeoMx Data Suite and bioinformatics toolset
Transcript of GeoMx® Whole Transcriptome Atlas
FOR RESEARCH USE ONLY. Not for use in diagnostic procedures.
PRODUCT BULLETIN
GeoMx® Whole Transcriptome Atlas
GeoMx® Whole Transcriptome AtlasThe GeoMx Digital Spatial Profiler with the GeoMx Whole Transcriptome Atlas (WTA) empowers researchers to explore biology across a tissue. WTA is compatible with common sample types such as formalin-fixed paraffin embedded (FFPE) or fresh frozen (FF) and across all human tissues. The human whole transcriptome is measured in each region of interest (ROI) to uncover biological changes at specific locations in the tissue.
Discover a new way to look at biology
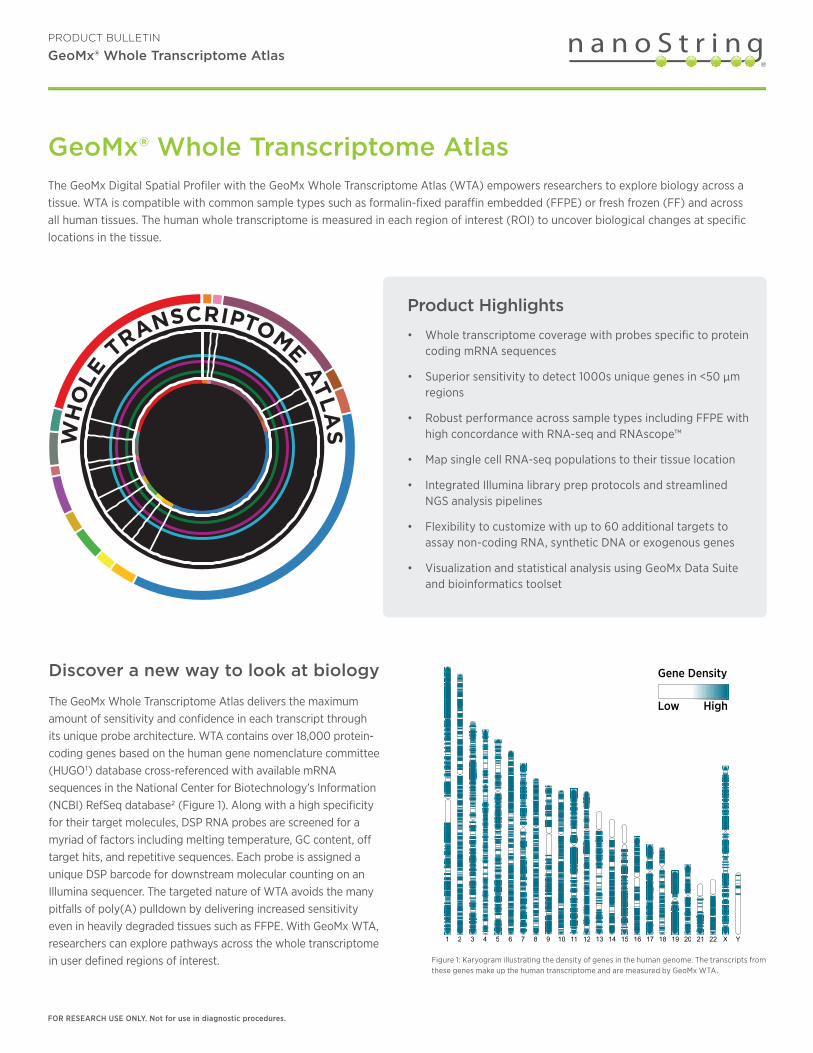
The GeoMx Whole Transcriptome Atlas delivers the maximum amount of sensitivity and confidence in each transcript through its unique probe architecture. WTA contains over 18,000 protein-coding genes based on the human gene nomenclature committee (HUGO1) database cross-referenced with available mRNA sequences in the National Center for Biotechnology’s Information (NCBI) RefSeq database2 (Figure 1). Along with a high specificity for their target molecules, DSP RNA probes are screened for a myriad of factors including melting temperature, GC content, off target hits, and repetitive sequences. Each probe is assigned a unique DSP barcode for downstream molecular counting on an Illumina sequencer. The targeted nature of WTA avoids the many pitfalls of poly(A) pulldown by delivering increased sensitivity even in heavily degraded tissues such as FFPE. With GeoMx WTA, researchers can explore pathways across the whole transcriptome in user defined regions of interest.
1 2 3 4 5 6 7 8 9 10 11 12 13 14 15 16 17 18 19 20 21 22 X Y
Low
Gene Density
High
Figure 1: Karyogram illustrating the density of genes in the human genome. The transcripts from these genes make up the human transcriptome and are measured by GeoMx WTA.
Product Highlights
• Whole transcriptome coverage with probes specific to protein coding mRNA sequences
• Superior sensitivity to detect 1000s unique genes in <50 μm regions
• Robust performance across sample types including FFPE with high concordance with RNA-seq and RNAscope™
• Map single cell RNA-seq populations to their tissue location
• Integrated Illumina library prep protocols and streamlined NGS analysis pipelines
• Flexibility to customize with up to 60 additional targets to assay non-coding RNA, synthetic DNA or exogenous genes
• Visualization and statistical analysis using GeoMx Data Suite and bioinformatics toolset

PRODUCT BULLETIN GeoMx® Whole Transcriptome Atlas
2FOR RESEARCH USE ONLY. Not for use in diagnostic procedures.
Figure 4: A) Segmenting ROIs in PanCK+ and PanCK- regions enables the comparison of tumor and tumor microenvironment segments. B) Using the GeoMx Spatial Decon algorithm, researchers can estimate the abundance of mixed cell types within each ROI and segment. Legend to right indicates cell type.
Map the location of your cell populations
Spatial analysis of a non-small cell carcinoma’s sample using the GeoMx SpatialDecon algorithm3 reveals cell type abundance in each region of interest (ROI) (Figure 4). Researchers can use the pre-defined cell definitions or their single cell RNAseq data to assess cell type abundance throughout the tissue.
A B
Figure 3: A) GeoMx Human WTA performance compared to RNA-seq with 3 ROI sizes run on formalin-fixed paraffin embedded (FFPE) cell pellet arrays. B) Comparing RNAscope and WTA counts illustrates the high sensitivity of WTA even with small ROI sizes.
WTA vs RNAseq WTA vs RNAscope
�
� �
�
� �
�
� �
�
� �
�
� �
�
� �
0.00
0.25
0.50
0.75
1.00
50 250 360ROI size (μm)
corr
elat
ion
to R
NA
seq
�
�
�
�
�
�
DAUDI
HUH7
HUT78
JURKAT
SUDHL1
SUDHL40.00
0.25
0.50
0.75
1.00
1−2 2−5 5−10 10−20 >20
number of transcripts per cell
sens
itivi
ty 50 (13.4)80 (31.0)110 (54.3)250 (258.5)360 (525.8)
ROI size (μm) (# of nuclei)
Spatial RNA profiling aligns with RNASeq and RNAscope
Traditional gene expression technologies are unable to capture heterogeneity of the transcriptome with spatial context. Bulk RNA sequencing and single cell RNAseq have delivered interesting clinical and cell type signatures but localizing these signatures has proven challenges with protein based IHC. Other, more precise, technologies like fluorescently-labeled in situ hybridization lack the plex to truly make new discoveries. WTA delivers both spatial precision and high plex. Furthermore, WTA compares favorably RNA sequencing and RNAscope (Figure 3) and is able to confidently detect transcripts in small regions.
Explore the biology that matters
The GeoMx WTA offers high sensitivity and specificity with thousands of genes detectable across region of interest (ROI) of various sizes. In a sensitivity analysis in FFPE with cell pellet arrays, colorectal carcinoma CRC and non-small cell lung cancer NSCLC, over 5000 genes were detected above the limit of quantification.
Figure 2: A) Using RNA-seq transcripts per million as the ground truth for the expression of each gene, the ROC curve shows high sensitivity and specificity. B) GeoMx WTA detects a large number of genes across many regions of various sizes.
0.00
0.25
0.50
0.75
1.00
0.00 0.25 0.50 0.75 1.001 − specificity
sens
itivi
ty
ROI size (μm)
50200400
0
2000
4000
6000
8000
10000
12000
14000
16000
18000
0 100 200 300 400 500 600 700
Gen
es D
etec
ted
Region of Interest Diameter (μm)
Genes Detected above the Limit ofQuatification
B
B
A
A

PRODUCT BULLETIN GeoMx® Whole Transcriptome Atlas
3FOR RESEARCH USE ONLY. Not for use in diagnostic procedures.
GeoMx WTA Workflow
GeoMx RNA assays contain in situ hybridization (ISH) probes conjugated to unique DNA indexing-oligonucleotides (DSP barcodes) via a UV-photocleavable linker. After selecting regions of interest (ROIs) on the GeoMx DSP, the DSP barcodes are UV cleaved and collected (Figure 5). During library preparation, the DSP barcodes are tagged with their ROI location then sequenced on an Illumina sequencer. DNA oligonucleotide sequences contain ROI indices mapping them back to their tissue location, an RNA target identification sequence matching them to their ISH probes, and a unique molecular identifier (UMI) to deduplicate reads. Sequenced oligonucleotides are processed then imported back into the GeoMx DSP platform for integration with the slide images and ROI selections for spatially-resolved RNA expression.
DSPBarcoded
probes
Digital Spatial ProfilerGeoMxGeoMx®
DSP Barcoded RNA Probes
Fluorescentantibodies
1 Stain slides with RNAscope™ probesand GeoMx® DSP oligo-conjugated RNA detection probes
3 UV-cleave and collect DSP barcodes o� RNA probes in ROI
2 Select Regions of Interest (ROI)
5
6 Construct Library,Sequence & Count
4 Dispense oligos into 96-well plate
Repeat for each ROI
DSP BarcodedRNA probes
RNAscope™
Probes
Figure 5 : GeoMx DSP workflow enables the analysis of whole transcriptome data from user-defined regions.
GeoMx® Data Analysis
GeoMx software uniquely combines whole tissue visualization at single cell resolution with advanced ROI selection to enable comprehensive spatial profiling of tissue sections. The fully integrated workflow tracks image data to corresponding profiling data, allowing users to easily go from data collection to data analysis and to interact with either data type in real time. The data analysis suite provides multiple options to assess the quality of the raw data and various methods to normalize data sets. Moreover, multiple analysis methods are available, including statistical methods, and cluster and pathway analysis. Multiple data visualizations are available to enable data exploration and are then exportable as publication-quality figures. Visualization plots include: heatmap, dendograms, bar graph, box plot, scatter plot, line/trend plot, volcano plot, forest plots, and 3-D PCA. Analysis and visualization can be extended through the integration of R-scripts into the Data Analysis Suite which are available on GeoScript Hub, or through export of the raw or normalized data to external tools including our GeoMxTools R package available in Bioconductor™.
2 mm 100 µm
C
BA BGlomerulus
ProximalTubules
DistalTubules
E
Cel
l Abu
ndan
ce E
stim
ate
(%)
Glomeruli Proximal Distal
D
Figure 6: A-B) ROI selection strategy in kidney to study normal and diseased (DKD) kidney C) tSNE representation of glomerulus (magenta), proximal (green) and distal (gray) tubules D) Differential expression showing genes from scRNA Seq expressed in podocytes (blue), proximal (green) or distal (red) tubules. E) Cell type abundance estimates based on scRNA Seq from kidney samples.

4
FOR RESEARCH USE ONLY. Not for use in diagnostic procedures. ©2021 NanoString Technologies, Inc. All rights reserved. NanoString, NanoString Technologies, nCounter, GeoMx, and the NanoString logo are trademarks or registered trademarks of NanoString Technologies, Inc., in the United States and/or other countries.
FEB 2021 MK3199
Sales ContactsUnited States [email protected]: [email protected]
NanoString Technologies, Inc. 530 Fairview Avenue NorthSeattle, Washington 98109
Asia Pacific & Japan [email protected] Regions [email protected]
T (888) 358-6266F (206) 378-6288
nanostring.com [email protected]
PRODUCT BULLETIN
GeoMx® Whole Transcriptome Atlas
For more information, visit nanostring.com/GeoMx-WTA
Selected Panel References 1. HUGO Gene Nomenclature Committee. https://www.genenames.org/2. RefSeq: NCBI Reference Sequence Database. https://www.ncbi.nlm.nih.gov/refseq/3. Danaher, et al. Advances in mixed cell deconvolution enable quantification of cell types in spatially-resolved gene expression data. bioRxiv pre-print.
Ordering Information
GeoMx Whole Transcriptome Atlas
Product Product Description Quantity Catalog Number
GeoMx Human Whole Transcriptome AtlasHuman RNA for Illumina Systems
RNA Probe set that targets 18,000+ transcripts for human protein coding genes plus ERCC negative controls to profile the whole transcriptome. Excludes uninformative high expressing targets such as ribosomal subunits. Includes RNA probes designed for Illumina NGS readout with the Seq Code library prep.
4 Slides GMX-RNA-NGS-HuWTA-4
GeoMx Mouse Whole Transcriptome AtlasMouse RNA for Illumina Systems(Available for Pre-order)
RNA Probe set that targets 21,000+ transcripts for mouse protein coding genes plus ERCC negative controls to profile the whole transcriptome. Excludes uninformative high expressing targets such as ribosomal subunits. Includes RNA probes designed for Illumina NGS readout with the Seq Code library prep.
4 Slides GMX-RNA-NGS-MsWTA-4
GeoMx Morphology Kits
Product Product Description Quantity Catalog Number
GeoMx Solid Tumor TME Morphology Kit Human RNA Compatible
Morphology kit for visualization of human solid tumors and the tumor microenvironment. For use with RNA assays. Includes fluorescent antibodies against Pan-CK, CD45, and a nuclear stain.
12 slides GMX-RNA-MORPH-HST-12
GeoMx Melanoma TME Morphology Kit Human RNA Compatible
Morphology kit for visualization of human melanoma and the tumor microenvironment. For use with RNA assays. Includes fluorescent antibodies against S100B/Pmel17, CD45, and a nuclear stain.
12 slides GMX-RNA-MORPH-HMEL-12
Additional Assay Reagents
Product Product Description Quantity Catalog Number
GeoMx Seq Code PackCompatible with Illumina Systems
NGS readout reagents for GeoMx DSP RNA and protein analysis. Includes two Seq Code primer plates (choice of A&B, C&D, E&F, or G&H) and two universal enzyme master mixes.
192 AOI GMX-NGS-SEQ-[XX]
GeoMx RNA Slide Prep Kit for FFPE Sample prep reagents for GeoMx DSP RNA analysis. Includes Buffer W, Buffer S, and Buffer R. 12 slides GMX-PREP-RNA-
FFPE-12
GeoMx DSP Collection PlateBarcoded collection plates for use on the GeoMx DSP. Required for AOI tracking. Kit includes 12 platescovering 1,152 AOI.
1 Pack GMX-DSP-COLL-PLT
GeoMx DSP Instrument Buffer KitBuffer kit for the GeoMx DSP. Includes Buffer S and Buffer H. Sufficient for ~48 samples with ~18 AOI each. Volume requirements may vary based on experimental design.
1 Kit GMX-DSP-BUFF-KIT