A pathology atlas of the human cancer transcriptome · RESEARCH ARTICLE SUMMARY CANCER A...
13
RESEARCH ARTICLE SUMMARY ◥ CANCER A pathology atlas of the human cancer transcriptome Mathias Uhlen,* Cheng Zhang, Sunjae Lee, Evelina Sjöstedt, Linn Fagerberg, Gholamreza Bidkhori, Rui Benfeitas, Muhammad Arif, Zhengtao Liu, Fredrik Edfors, Kemal Sanli, Kalle von Feilitzen, Per Oksvold, Emma Lundberg, Sophia Hober, Peter Nilsson, Johanna Mattsson, Jochen M. Schwenk, Hans Brunnström, Bengt Glimelius, Tobias Sjöblom, Per-Henrik Edqvist, Dijana Djureinovic, Patrick Micke, Cecilia Lindskog, Adil Mardinoglu,† Fredrik Ponten† INTRODUCTION: Cancer is a leading cause of death worldwide, and there is great need to de- fine the molecular mechanisms driving the de- velopment and progression of individual tumors. The Hallmarks of Cancer has provided a frame- work for a deeper molecular understanding of cancer, and the focus so far has been on the ge- netic alterations in individual cancers, including genome rearrangements, gene amplifications, and specific cancer-driving mutations. Using systems-level approaches, it is now also possi- ble to define downstream effects of individual genetic alterations in a genome-wide manner. RATIONALE: In our study, we used a systems- level approach to analyze the transcriptome of 17 major cancer types with respect to clinical outcome, based on a genome-wide transcrip- tomics analysis of ~8000 individual patients with clinical metadata. The study was made possible through the availability of large open- access knowledge-based efforts such as the Cancer Genome Atlas and the Human Protein Atlas. Here, we used the data to perform a systems-level analysis of 17 major human can- cer types, describing both interindividual and intertumor variation patterns. RESULTS: The analysis identified candidate prognostic genes associated with clinical outcome for each tumor type; the results show that a large fraction of cancer protein-coding genes are differ- entially expressed and, in many cases, have an im- pact on overall patient survival. Systems biology analyses revealed that gene expression of individ- ual tumors within a particular cancer varied con- siderably and could exceed the variation observed be- tween distinct cancer types. No general prognostic gene necessary for clinical out- come was applicable to all cancers. Shorter patient sur- vival was generally associated with up-regulation of genes involved in mitosis and cell growth and down-regulation of genes involved in cellular differentiation. The data allowed us to generate personalized genome-scale metabolic models for cancer patients to identify key genes involved in tumor growth. In addition, we explored tissue- specific genes associated with the dedifferentia- tion of tumor cells and the role of specific cancer testis antigens on a genome-wide scale. For lung and colorectal cancer, a selection of prognostic genes identified by the systems biology effort were analyzed in independent, prospective cancer cohorts using immunohistochemistry to validate the gene expression patterns at the protein level. CONCLUSION: A Human Pathology Atlas has been created as part of the Human Protein Atlas program to explore the prognostic role of each protein-coding gene in 17 different cancers. Our atlas uses transcriptomics and antibody-based profiling to provide a standalone resource for cancer precision medicine. The results demon- strate the power of large systems biology efforts that make use of publicly available resources. Using genome-scale metabolic models, cancer patients are shown to have widespread metabolic heterogeneity, highlighting the need for precise and personalized medicine for cancer treatment. With more than 900,000 Kaplan-Meier plots, this resource allows exploration of the specific genes influencing clinical outcome for major cancers, paving the way for further in-depth studies incorporating systems-level analyses of cancer. All data presented are available in an interac- tive open-access database (www.proteinatlas.org/ pathology) to allow for genome-wide exploration of the impact of individual proteins on clinical outcome in major human cancers. ▪ RESEARCH Uhlen et al., Science 357, 660 (2017) 18 August 2017 1 of 1 The list of author affiliations is available in the full article online. *Corresponding author. Email: [email protected] †These authors contributed equally to this work. Cite this article as M. Uhlen et al., Science 357, eaan2507 (2017). DOI: 10.1126/science.aan2507 Schematic overview of the Human Pathology Atlas. A systems-level approach enables analysis of the protein-coding genes of 17 different cancer types from ~8000 patients. Results are available in an interactive open-access database. ON OUR WEBSITE ◥ Read the full article at http://dx.doi. org/10.1126/ science.aan2507 .................................................. on December 28, 2019 http://science.sciencemag.org/ Downloaded from
Transcript of A pathology atlas of the human cancer transcriptome · RESEARCH ARTICLE SUMMARY CANCER A...

RESEARCH ARTICLE SUMMARY◥
CANCER
A pathology atlas of the humancancer transcriptomeMathias Uhlen,* Cheng Zhang, Sunjae Lee, Evelina Sjöstedt, Linn Fagerberg,Gholamreza Bidkhori, Rui Benfeitas, Muhammad Arif, Zhengtao Liu, Fredrik Edfors,Kemal Sanli, Kalle von Feilitzen, Per Oksvold, Emma Lundberg, Sophia Hober,Peter Nilsson, Johanna Mattsson, Jochen M. Schwenk, Hans Brunnström,Bengt Glimelius, Tobias Sjöblom, Per-Henrik Edqvist, Dijana Djureinovic,Patrick Micke, Cecilia Lindskog, Adil Mardinoglu,† Fredrik Ponten†
INTRODUCTION: Cancer is a leading cause ofdeath worldwide, and there is great need to de-fine themolecular mechanisms driving the de-velopment and progression of individual tumors.The Hallmarks of Cancer has provided a frame-work for a deeper molecular understanding ofcancer, and the focus so far has been on the ge-netic alterations in individual cancers, includinggenome rearrangements, gene amplifications,and specific cancer-driving mutations. Usingsystems-level approaches, it is now also possi-
ble to define downstream effects of individualgenetic alterations in a genome-wide manner.
RATIONALE: In our study, we used a systems-level approach to analyze the transcriptome of17 major cancer types with respect to clinicaloutcome, based on a genome-wide transcrip-tomics analysis of ~8000 individual patientswith clinical metadata. The study was madepossible through the availability of large open-access knowledge-based efforts such as the
Cancer Genome Atlas and the Human ProteinAtlas. Here, we used the data to perform asystems-level analysis of 17 major human can-cer types, describing both interindividual andintertumor variation patterns.
RESULTS: The analysis identified candidateprognosticgenesassociatedwithclinicaloutcomefor each tumor type; the results show that a largefraction of cancer protein-coding genes are differ-entially expressed and, inmany cases, have an im-pact on overall patient survival. Systems biologyanalyses revealed that gene expressionof individ-ual tumorswithin a particular cancer varied con-
siderably and could exceedthe variation observed be-tweendistinct cancer types.Nogeneralprognostic genenecessary for clinical out-comewas applicable to allcancers.Shorterpatientsur-
vivalwasgenerally associatedwithup-regulationof genes involved inmitosis and cell growth anddown-regulation of genes involved in cellulardifferentiation. The data allowedus to generatepersonalized genome-scalemetabolicmodels forcancer patients to identify key genes involved intumor growth. In addition, we explored tissue-specific genes associatedwith the dedifferentia-tion of tumor cells and the role of specific cancertestis antigens on a genome-wide scale. For lungand colorectal cancer, a selection of prognosticgenes identified by the systems biology effortwereanalyzed in independent,prospectivecancercohortsusing immunohistochemistry to validatethe gene expression patterns at the protein level.
CONCLUSION: A Human Pathology Atlas hasbeen created as part of theHumanProteinAtlasprogram to explore the prognostic role of eachprotein-coding gene in 17 different cancers. Ouratlas uses transcriptomics and antibody-basedprofiling to provide a standalone resource forcancer precision medicine. The results demon-strate the power of large systems biology effortsthat make use of publicly available resources.Using genome-scale metabolic models, cancerpatients are shown tohavewidespreadmetabolicheterogeneity, highlighting the need for preciseandpersonalizedmedicine for cancer treatment.Withmore than900,000Kaplan-Meier plots, thisresource allows exploration of the specific genesinfluencing clinical outcome for major cancers,paving the way for further in-depth studiesincorporating systems-level analyses of cancer.All data presented are available in an interac-tive open-access database (www.proteinatlas.org/pathology) to allow for genome-wide explorationof the impact of individual proteins on clinicaloutcome in major human cancers.▪
RESEARCH
Uhlen et al., Science 357, 660 (2017) 18 August 2017 1 of 1
The list of author affiliations is available in the full article online.*Corresponding author. Email: [email protected]†These authors contributed equally to this work.Cite this article as M. Uhlen et al., Science 357, eaan2507(2017). DOI: 10.1126/science.aan2507
Schematic overview of the Human Pathology Atlas. A systems-level approach enablesanalysis of the protein-coding genes of 17 different cancer types from ~8000 patients. Resultsare available in an interactive open-access database.
ON OUR WEBSITE◥
Read the full articleat http://dx.doi.org/10.1126/science.aan2507..................................................
on Decem
ber 28, 2019
http://science.sciencemag.org/
Dow
nloaded from

RESEARCH ARTICLE◥
CANCER
A pathology atlas of the humancancer transcriptomeMathias Uhlen,1,2,3* Cheng Zhang,1 Sunjae Lee,1 Evelina Sjöstedt,1,4 Linn Fagerberg,1
Gholamreza Bidkhori,1 Rui Benfeitas,1 Muhammad Arif,1 Zhengtao Liu,1
Fredrik Edfors,1 Kemal Sanli,1 Kalle von Feilitzen,1 Per Oksvold,1 Emma Lundberg,1
Sophia Hober,3 Peter Nilsson,1 Johanna Mattsson,4 Jochen M. Schwenk,1
Hans Brunnström,5 Bengt Glimelius,4 Tobias Sjöblom,4 Per-Henrik Edqvist,4
Dijana Djureinovic,4 Patrick Micke,4 Cecilia Lindskog,4
Adil Mardinoglu,1,3,6† Fredrik Ponten4†
Cancer is one of the leading causes of death, and there is great interest in understandingthe underlying molecular mechanisms involved in the pathogenesis and progression ofindividual tumors. We used systems-level approaches to analyze the genome-widetranscriptome of the protein-coding genes of 17 major cancer types with respect to clinicaloutcome. A general pattern emerged: Shorter patient survival was associated withup-regulation of genes involved in cell growth and with down-regulation of genes involvedin cellular differentiation. Using genome-scale metabolic models, we show that cancerpatients have widespread metabolic heterogeneity, highlighting the need for precise andpersonalized medicine for cancer treatment. All data are presented in an interactiveopen-access database (www.proteinatlas.org/pathology) to allow genome-wideexploration of the impact of individual proteins on clinical outcomes.
Cancer is one of the leading causes of deathworldwide, and both the incidence andprevalence of cancer continue to increase.Most current cancer drugs are effective onlyin a subgroup of patients owing to inter-
individual tumor heterogeneity, and large gapsremain in our current understanding of the besttreatment approaches and the underlying molec-ular mechanisms driving cancer pathogenesis (1).There is therefore an urgent need for the develop-ment of personalized diagnostic and therapeu-tic strategies usingmethods such as systems-levelanalysis (2–4). Such approaches can be used tostudy the genome-wide effect of gene rearrange-ments, amplifications, and specific cancer-drivingmutations on protein-coding regions.Thanks to large open-access knowledge-based
efforts, such as The Cancer Genome Atlas (TCGA)(5), the Human Protein Atlas (HPA) (6), the GTExconsortium (7), and recount2 (8), it is now pos-sible to explore the genome-wide expression ofindividual genes in different tissues and cancers(9). The database resource from TCGA representsa comprehensive and coordinated effort to accel-
erate our understanding of cancer (5), and theHPA and GTEx represent international effortsto map the expression of protein-coding genes innormal human tissues. Many of the patients in-cluded in the TCGA database are also accompa-nied by clinical survival metadata, allowing clinicaloutcomes to be associated with genome-wide ex-pression patterns of protein-coding genes andmetabolic modeling of individual cancer patients.Such analysis is facilitated by the recent sugges-tion that there is a gene-specific correlation be-tween RNA and protein levels in human tissuesand cells, allowing quantitative analyses of mRNAlevels to be used as proxies for the correspondingprotein levels (10).Here, we used data from TCGA and the HPA
efforts to perform a systems-level analysis of17 major human cancer types corresponding to7932 tumor samples, and describe both inter-individual and intertumor variation patterns.The analysis identified candidate prognosticgenes associated with clinical outcome for eachtumor type and generated metabolic models forindividual patients. A Human Pathology Atlashas been created as part of the Human ProteinAtlas program to explore the prognostic role ofeach protein-coding gene in each cancer type bymeans of transcriptomics and antibody-basedprofiling (Fig. 1A). More than 100 million Kaplan-Meier survival plots were generated as part ofthe genome-wide analysis of potential prognos-tic genes in these cancers. More than 900,000survival plots—each accompanied with statisticalsignificance—can be visualized at the new pa-thology resource.
To investigate the key prognostic genes affect-ing patient survival, we generated cancer-specificcoexpression networks for each of the studiedcancer types and examined the functional rela-tionship between the prognostic genes and thegenes associated with Hallmarks of Cancer (11).Personalized genome-scale metabolic models(GSMMs) for the tumors in each cancer patientwere generated to study the individualmetabolicdifferences among tumors. This analysis also al-lowed us to study the role of tissue-specific genesin the “dedifferentiation” of cancer and the role ofspecific cancer testis antigens (CTAs) on a genome-wide scale. For two of the cancer types, lung andcolorectal cancer, a selection of prognostic genesidentified by the systems biology effort wereanalyzed in independent prospective cancer co-horts, using immunohistochemistry (IHC) to val-idate the gene expression patterns at the proteinlevel.All primary Human Pathology Atlas data are
freelyavailablewithout restrictions in thepublicopenaccess database (www.proteinatlas.org/pathology)that is part of the Human Protein Atlas program.Significant prognostic genes in each cancer typeare highlighted together with Kaplan-Meier plotsbased on overall survival and accompanied withdata for individual gene expression heterogene-ity of prognostic genes at the time of diagnosis.
Transcriptome analysis ofhuman cancers
We retrieved RNA sequencing (RNA-seq) datatogether with clinical metadata correspondingto the 33 different human cancers that are avail-able in TCGA (table S1). As a result, data werecollected from 9666 individuals out of the 11,000cancer patients included in the TCGA project fromthe Genomic Data Commons (GDC) Data Portal(https://gdc-portal.nci.nih.gov/). First, using hier-archical clustering, we investigated the relation-ship between the global gene expression patternsof all protein-coding genes in the 33 cancer types(n = 19,571) and the gene expression patterns in37 normal human tissues obtained from 162 healthysubjects in the HPA project (6) (fig. S1). RNA-seqdata from all cancer tissues and all normal tissueswere processed in the same bioinformatics pipe-line and normalized as fragments per kilobaseof exon per million fragments mapped (FPKM).We found that a majority of all cancers (26 of33) clustered in the same group, while the ma-jority of the normal tissues (33 of 37) clusteredin a different group, indicating that most cancertypes share expression features that render themsignificantly different from normal tissues. Nota-bly, we found that liver tissue and the primaryform of liver cancer, hepatocellular carcinoma, aswell as bone marrow and acute myeloid leukemiaclustered together, suggesting that these pheno-types are more closely related independent of abenign or malignant status.Wepreviously classified all protein-coding genes
into six different categories according to their ex-pression across normal tissues and organs (6).The classification, based on a FPKM cut-off >1,ranged fromgenes expressed in all tissues to those
RESEARCH
Uhlen et al., Science 357, eaan2507 (2017) 18 August 2017 1 of 11
1Science for Life Laboratory, KTH–Royal Institute of Technology,Stockholm, Sweden. 2Center for Biosustainability, DanishTechnical University, Copenhagen, Denmark. 3School ofBiotechnology, AlbaNova University Center, KTH–RoyalInstitute of Technology, Stockholm, Sweden. 4Department ofImmunology Genetics and Pathology, Uppsala University,Uppsala, Sweden. 5Division of Pathology, Lund University,Skåne University Hospital, Lund, Sweden. 6Department ofBiology and Biological Engineering, Chalmers University ofTechnology, SE-412 96 Gothenburg, Sweden.*Corresponding author. Email: [email protected]†These authors contributed equally to this work.
on Decem
ber 28, 2019
http://science.sciencemag.org/
Dow
nloaded from

with tissue-restricted expression and those notdetected in any of the analyzed tissues. The tran-scriptomics data for the 33 different cancers al-lowed us to classify the protein-coding genes intosix different categories based on the expressionlevel. Our analysis revealed that a large fraction(41%) of the protein-coding geneswere expressedin all analyzed cancers, while approximately 46%(n = 9057) displayed more tumor type-restrictedexpression. Among the protein-coding genes, 13%were not detected in any tumor types investigated(fig. S2 and table S2). The majority of the genes(n = 5772) detected in all samples were sharedbetween cancers and normal tissues, whereas2401 additional genes were expressed in all can-cers analyzed, but with more restricted expres-sion in the normal tissues. These “housekeeping”genes in tumors are enriched in biological func-
tions related toDNAreplication and the regulationof apoptosis and mitosis (table S3 and fig. S3).Subsequently, we focused our analysis on 17
tumor types with large numbers of patients avail-able in the TCGA data set accompanied by clinicalmetadata (Fig. 1A and table S4). The connectivityamong these 17 cancers was determined usingprincipal components analysis (PCA) based onthe expression pattern of all protein-coding genes(Fig. 1B and fig. S4). We observed a relationshipamong cancer types that shared a similar tissuetype of origin or similar morphological featuresand phenotypic expression patterns. For example,cancers with a dominating squamous cell carci-noma phenotype, such as cervical or head andneck cancer, clustered together close to the re-lated urothelial cell carcinoma and non–small celllung cancer (NSCLC), which also contains a large
fraction of squamous cell carcinoma. Adeno-carcinomas that originate from the gastrointestinaltract, including pancreatic cancer, also clusteredseparately from the cluster containing the threeadenocarcinomas representing female cancer (i.e.,breast, endometrial, and ovarian cancer). Inter-estingly, testicular germ cell tumors were locatedclose to melanoma and were well separated fromthe more classical epithelial tumor types, whereasglioma (brain) and hepatocellular (liver) carci-noma clearly represented the most divergenttumor types in this global expression analysis.
Individual variation among cancers
To determine the individual gene expression pat-terns within and among certain cancer types, weused PCA to visualize the global expression pat-terns for all 9666 individual tumors that were
Uhlen et al., Science 357, eaan2507 (2017) 18 August 2017 2 of 11
Fig. 1. Analysis of the global expression patterns of protein-codinggenes in human cancers. (A) Schematic drawing of the HumanPathology Atlas effort described herein. (B) Principal components analysis(PCA) showing the similarities in expression of 19,571 protein-coding genes
among 17 cancer types. See fig. S4 for additional PCA analysis with morestratified patient cohorts. (C) PCA plot showing the individual differencesin the genome-wide global expression profiles among the 17 cancer typesin 9666 individual patients.
RESEARCH | RESEARCH ARTICLEon D
ecember 28, 2019
http://science.sciencem
ag.org/D
ownloaded from

included in the patient cohorts, representing the17 major cancer types (Fig. 1C). The results showedthat the interindividual variation within each typeof cancer was considerable, and that there was alarge overlap in expression among individualswith different cancer types. One exception wasliver cancer (Fig. 1C, upper left), in which the in-dividual tumors showed relatively unique globalexpression patterns with little overlap with theother cancer types. Thus, gene expression variesconsiderably in individual tumors within a parti-cular cancer subtype. For some patient tumors, theglobal expression pattern resembles other cancertypes more than it does the given type of diagnosedcancer, which reinforces previous discoveries (12).
Clinical outcome based on geneexpression analysis
First, we analyzed the survival data from theTCGA metadata (fig. S5 and table S4). Prostatecancer and testis cancer (germ cell tumors) havethe most favorable 3-year survival rates (98% and97%, respectively), while high-grade glioma andpancreatic cancer have the lowest 3-year survivalrates (8% and 35%, respectively). The patient sur-vival data and matched transcriptomic data en-abled us to perform gene-centric and genome-widesurvival analyses to identify prognostic genesacross the 17 cancer types. For each cancer, allpatients with survival data were included in theKaplan-Meier survival analysis spanning 10 yearsas extracted from the metadata. The RNA levelsat the time of diagnosis were plotted against thesurvival data as extracted from the follow-upclinical data (see examples in Fig. 2A). For eachgene and cancer type, the patient cohort wasstratified into two groups with the highest andlowest expression (FPKM) based on individualexpression levels. To choose the best FPKM cut-offs for grouping the patients most significantly,we used all FPKM values from the 20th to 80thpercentiles to group the patients, examined sig-nificant differences in the survival outcomes ofthe groups, and selected the value yielding thelowest log-rank P value. In total, more than 100million Kaplan-Meier plots were generated thatcorresponded to all 19,571 protein-coding genesacross the 17 cancer types. As a comparison, wealso tested the method described by Hothorn andLausen (13) and the results were highly similar(fig. S6). Two examples of genes in the liver cancercohort are shown in Fig. 2B, including the sur-vival data for the individual patients in the livercancer cohort.We identified two types of prognostic marker
genes in terms of clinical outcome: (i) unfavorableprognostic genes, for which higher expression ofa given gene was correlated with a poor patientsurvival outcome, and (ii) favorable prognosticgenes, for which higher expression of a givengene was correlated with a longer patient survivaloutcome. A prognostic gene for a given cancerwas defined as a gene for which the expressionlevel above or below the experimentally deter-mined cutoff in an individual patient yields asignificant (P < 0.001) difference in overall survi-val. The ratios of favorable and unfavorable prog-
nostic genes varied among the different types ofcancer. In Fig. 2C, the numbers of prognostic genesfor each of the 17 cancer types are shown, withmore detailed information provided in table S5.It is noteworthy that 2375 genes showed oppositeeffects on prognosis depending upon cancer typeand location, highlighting the need to performfunctional studies of prognostic genes. See tableS6 for a complete list of the prognostic associa-tion of all genes in all cancers.In Fig. 2A, examples of favorable and un-
favorable prognostic genes are shown for five ofthe cancer types, based on the optimal stratifica-tion P value calculated for each gene and cancer.In each case, a significant separation (P < 0.001)of the survival rate could be observed on the basisof differences in the expression levels of the re-spective gene. For some genes, the prognosticvalue has previously been reported in the litera-ture; one example is RBM3 (RNA binding motifprotein 3) (Fig. 2A), which has been implicatedin survival of colorectal cancer (14). However, mostof the identified prognostic genes lacked prior re-ports of a survival link to a given cancer, makingthem potential candidates for follow-up studies.We extended the survival analysis by construct-
ing panels of the five most significant favorableand unfavorable prognostic genes (table S7) foreach tumor type and used them to predict theclinical outcome (Fig. 2A). Each of the five panelsgenerated a prognostic panel of high significance(P < 10−5). Similarly, all of the other 12 cancertypes yielded prognostic panels in the same man-ner with very high significance (table S7). It isnoteworthy that for cancers with more favorablesurvival rates (e.g., testicular or prostate cancer),a limited number of prognostic genes have beenidentified, perhaps because the 3-year survivalprobability for these cancers exceeds 95% andthus larger patient cohorts are needed to obtainprognostic genes with high significance. For twoof the tumors (i.e., renal and liver cancer), thenumbers of prognostic genes were much largerthan for the other cancers (6070 and 2892, re-spectively) (Fig. 2C). This observation is interest-ing because both are cancers with distinct featuresand morphology, and liver cancer especially ap-pears to be distantly related to other cancer types(Fig. 1B). For renal cancer, the number of fa-vorable (n = 2782) and unfavorable genes (n =3288) was balanced, whereas there were a largenumber of unfavorable prognostic genes (n =2629) for liver cancer. An earlier study of renalcancer based on TCGA data showed distinctlydifferent groups of patients that are not reflectedby morphological subtypes (e.g., clear cell, papil-lary, and chromophobe phenotypes) (15). Thus,the large number of prognostic genes may simplyreflect large global expression differences betweenthese two subtypes, resulting in a large number of“passenger” genes and amuch smaller set of drivergenes affecting the clinical course of the patient.
Overlap of prognostic genes acrosscancer types
We examined the extent of overlap of prognosticgenes among different cancer types. The correla-
tion among the 17 cancer types for favorable andunfavorable prognostic genes was investigatedin a pairwise manner (Fig. 3A). For most cancers,little correlation was observed, suggesting a rela-tively limited number of common prognostic genes.In contrast, a significant overlap of favorable prog-nostic genes was observed for other cancers (e.g.,renal, breast, lung, and pancreatic cancers). Simi-larly, unfavorable prognostic genes for some can-cers, including renal, liver, lung, and pancreaticcancer, clustered together. However, a detailedanalysis revealed that no prognostic genes wereshared among more than 7 of the cancer types(table S8).
Functional analysis of prognostic genes
A functional gene ontology (GO) analysis wasperformed for the most significant prognosticgenes shared among the 17 major cancers, in-cluding both favorable and unfavorable genes(table S9). The results (Fig. 3B) suggest thatmany of the common unfavorable genes arerelated to cell proliferation, including mitosis, cellcycle regulation, and nucleic acid metabolism.In contrast, few GO functions were significantlyoverrepresented by the common favorable genes;the most enriched GO functions were positiveregulation of cell activation, regulation of immunecell activation, and cell-cell adhesion.Because genes associated with proliferation
were identified by the functional analysis, weinvestigated the prognostic effect of all 314 cellcycle genes defined by the Molecular Signaturedatabase (16) in various cancer types. Interest-ingly, more than 60% (n = 194) of these geneswere associated with an unfavorable clinical out-come, with increased expression in at least oneof the analyzed cancer types (table S10). How-ever, these prognostic cell cycle genes were gen-erally only shared among a few cancers (Fig. 3C),which suggests that although cell cycle genes arecommonly unfavorable genes, the use of a par-ticular set of cell cycle genes and their effect onclinical outcome may differ among individualcancer types.
Tissue-enriched genes anddedifferentiation in cancer
We further analyzed genes with high relativeexpression that correlated with prolonged over-all survival, for which a high expression level ofa particular gene was associated with a good clin-ical outcome. Many of these favorable genes havepreviously (6) been classified as elevated in cer-tain normal tissues (table S11), as exemplified inliver cancer (Fig. 3D), for which more than half(n = 150) of the 263 favorable prognostic geneswere defined as tissue-elevated. To further inves-tigate the molecular signatures related to differ-entiation, we analyzed alterations in liver-enrichedgenes (n = 154) defined by tissue-wide expressionstudies of normal hepatocytes. Samples from nor-mal liver tissue were analyzed and comparedwith the transcriptomics patterns of the primaryliver cancer biopsies and the liver cancer–derivedHepG2 cell line. To further compare the expressionlevels of the tissue-enriched proteins, we plotted
Uhlen et al., Science 357, eaan2507 (2017) 18 August 2017 3 of 11
RESEARCH | RESEARCH ARTICLEon D
ecember 28, 2019
http://science.sciencem
ag.org/D
ownloaded from
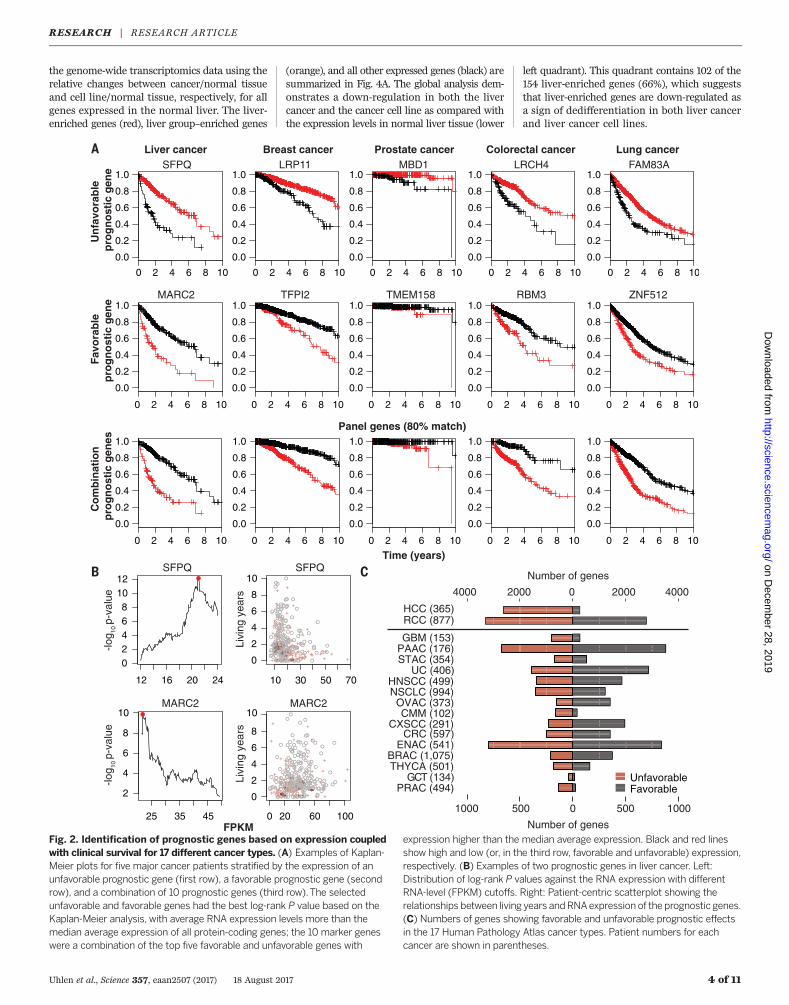
the genome-wide transcriptomics data using therelative changes between cancer/normal tissueand cell line/normal tissue, respectively, for allgenes expressed in the normal liver. The liver-enriched genes (red), liver group–enriched genes
(orange), and all other expressed genes (black) aresummarized in Fig. 4A. The global analysis dem-onstrates a down-regulation in both the livercancer and the cancer cell line as compared withthe expression levels in normal liver tissue (lower
left quadrant). This quadrant contains 102 of the154 liver-enriched genes (66%), which suggeststhat liver-enriched genes are down-regulated asa sign of dedifferentiation in both liver cancerand liver cancer cell lines.
Uhlen et al., Science 357, eaan2507 (2017) 18 August 2017 4 of 11
Fig. 2. Identification of prognostic genes based on expression coupledwith clinical survival for 17 different cancer types. (A) Examples of Kaplan-Meier plots for five major cancer patients stratified by the expression of anunfavorable prognostic gene (first row), a favorable prognostic gene (secondrow), and a combination of 10 prognostic genes (third row).The selectedunfavorable and favorable genes had the best log-rank P value based on theKaplan-Meier analysis, with average RNA expression levels more than themedian average expression of all protein-coding genes; the 10 marker geneswere a combination of the top five favorable and unfavorable genes with
expression higher than the median average expression. Black and red linesshow high and low (or, in the third row, favorable and unfavorable) expression,respectively. (B) Examples of two prognostic genes in liver cancer. Left:Distribution of log-rank P values against the RNA expression with differentRNA-level (FPKM) cutoffs. Right: Patient-centric scatterplot showing therelationships between living years andRNAexpression of the prognostic genes.(C) Numbers of genes showing favorable and unfavorable prognostic effectsin the 17 Human Pathology Atlas cancer types. Patient numbers for eachcancer are shown in parentheses.
RESEARCH | RESEARCH ARTICLEon D
ecember 28, 2019
http://science.sciencem
ag.org/D
ownloaded from

Metadata for the grade of malignancy (i.e.,the degree of differentiation) are available in theTCGA database, and this allowed us to analyzethe relative expression level of liver-enrichedgenes in liver cancer and to compare differentgrades of malignancy. The tumor grade was scoredusing the modified nuclear grading scheme out-lined by Edmondson and Steiner (17), with thetumor grade categorized as low, intermediate,
or high. The malignancy grade (G1 to G3) (18)was available for 341 cases. The analysis revealeda significant correlation between the malignancygrade and the expression pattern of liver-enrichedgenes that were significantly down-regulatedin liver cancer. In Fig. 4B, examples of IHC-basedprotein expression levels of a liver-enriched gene(CYP2C9) are displayed for normal liver ver-sus liver cancer with differing tumor grade. The
gene expression levels of CYP2C9 across all pa-tients are also shown as box plots for differenttumor grades (Fig. 4C). In addition, we analyzedthe distribution of correlation coefficients for allanalyzed liver-enriched genes compared withthat of a randomly selected set of genes (Fig. 4D).Randomly selected genes showed no correlation(median rho = 0.07), whereas the tissue-enrichedgenes showed a negative correlation, with reduced
Uhlen et al., Science 357, eaan2507 (2017) 18 August 2017 5 of 11
Fig. 3. Network analysis of prognostic genes. (A) Heat map showingthe hypergeometric P value for the pairwise overlap of prognostic genesbetween the cancer types. (B) Bubble plot showing the common enrichedGene Ontology (GO) functions among the 17 Human Pathology Atlascancer types. Bubble sizes represent numbers of genes in GO function; thex and y axes indicate the directionalities and generalities of the GO terms.Generality is defined by the number of cancers with their prognostic genesoverrepresenting the GO function; directionality is defined by the numberof cancers with their favorable genes overrepresenting the GO functionminus the number of cancers with unfavorable genes overrepresenting the
GO function. Note that only functions with more than five generalities arelabeled. All GO terms for each cancer are provided in table S9. Resultsbased on optional P value or hazard ratio cutoff–defined prognostic genesare provided in fig. S7 and table S9. (C) Network plot showing the numberof cancer-specific and shared unfavorable cell cycle genes in all cancertypes. Note that all groups with only one gene were removed from the plot.(D) Network plot showing the number of liver cancer–specific favorable genesand the favorable genes shared among liver and other cancers in theHuman Pathology Atlas. Inset: Pie chart showing the fraction of elevatednormal liver genes among the liver cancer–specific favorable genes.
RESEARCH | RESEARCH ARTICLEon D
ecember 28, 2019
http://science.sciencem
ag.org/D
ownloaded from

expression of tissue-enriched genes in high-gradetumors (grade G3). The results demonstrated amolecular correlation between the expressionlevels of tissue-enriched genes and tumor grade,supporting the concept that dedifferentiated can-cers are associated with decreased patient survival.
Cancer testis antigens in liver cancer
Cancer testis antigens are expressed in a widerange of cancer types, whereas their expres-sion in normal tissues is restricted to immune-privileged sites such as the testis and placenta.To explore this observation further, we investi-gated the differential expression patterns of testis-enriched genes in normal liver, primary liverbiopsies, and a liver cancer–derived cell line(HepG2). A global analysis, shown in Fig. 4E
(upper right quadrant), showed that many ofthe testis-enriched genes had higher expressionin the patient biopsy and cell line than in normalliver tissue. The results support many previousstudies (19) that testis-enriched genes have higherexpression in cancer than in the correspondingnormal tissues.
Coexpression networks ofhuman cancers
The Hallmarks of Cancer (11) has laid an impor-tant foundation for understanding cancer patho-genesis, and from the corresponding cellularprocesses, 2172 genes have recently been definedas hallmark-related genes (16, 20). We thus de-cided to investigate their relationship with theprognostic genes reported here. Approximately
two-thirds (65%) of the “hallmark genes” werepredictive for clinical outcome in at least one ofthe cancers analyzed, but a network analysisrevealed that none of the genes were sharedamong the majority of cancers, with most genesconsequently affecting only a few of the cancertypes (Fig. 5A and figs. S8 and S9). Subsequently,a cancer-specific coexpression network analysisfor all 17 major cancers (table S12; available athttp://inetmodels.com) was performed to iden-tify genes that are expressed concurrently duringtumorigenesis. Figure 5B shows a coexpressioncluster in the lung cancer cohort, with enrich-ment for both prognostic and hallmark genes.Within this cluster, the hub genes (located in thecenter) are generally more prognostic than thosewith less coexpression. It is tempting to speculate
Uhlen et al., Science 357, eaan2507 (2017) 18 August 2017 6 of 11
Fig. 4. Correlation between tumor differentiation and expression ofliver-enriched genes. (A) Scatterplots showing the relative (fold) changebetween the transcript expression level in liver cancer and normal livertissue (x axis) and the HepG2 cell line and normal tissue (y axis) for allprotein-coding genes. Individual genes are colored according to theirexpression-based category in liver. All FPKM values less than 1 were set to1 for the fold change calculation. (B) IHC staining of CYP2C9 proteins infour normal tissues and different hepatocellular carcinoma samples. Forfull IHC protein profiles, view the gene at www.proteinatlas.org/pathology.
(C) Box plots showing the expression levels of liver tumor samples of differentneoplasm grades for three representative liver-enriched genes for CYP2C9.(D) Box plot showing the distribution of correlation coefficients(Spearman’s rho) between the neoplasm grade and expression for arandom set of genes and all liver-enriched genes in liver tumors.(E) Scatterplots for all protein-coding genes showing the fold change intestis-specific antigen in liver cancer and normal liver tissue (x axis) and inthe HepG2 cell line and normal liver tissue (y axis). Individual genes arecolored according to their expression-based category in the testis.
RESEARCH | RESEARCH ARTICLEon D
ecember 28, 2019
http://science.sciencem
ag.org/D
ownloaded from
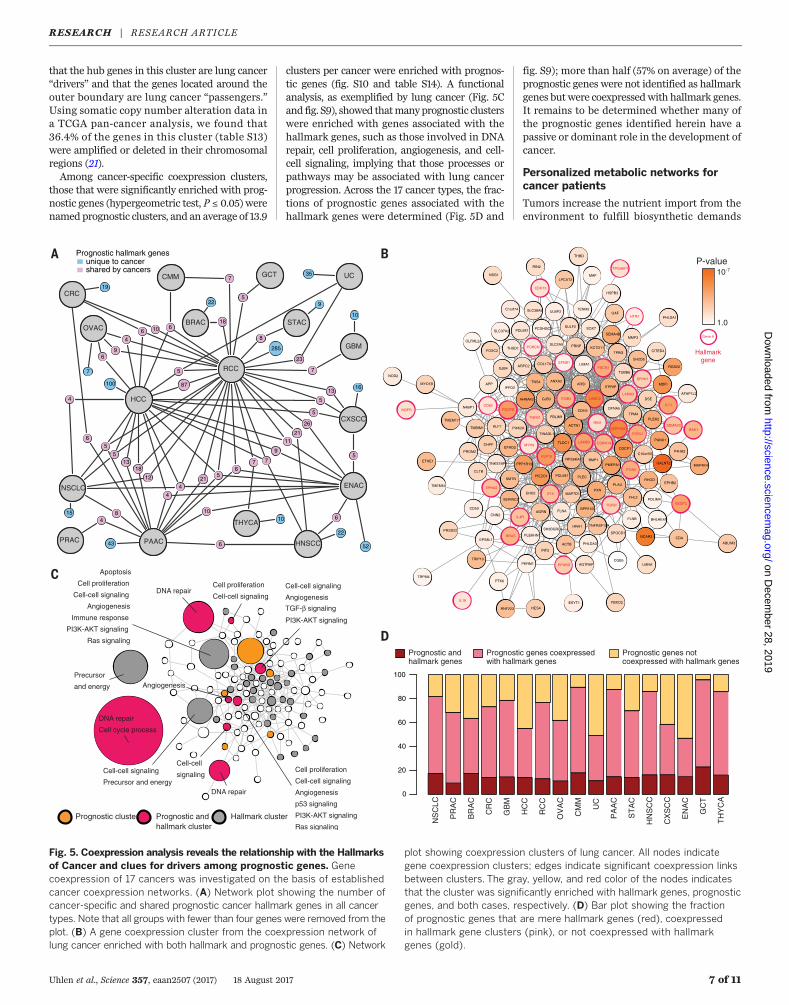
that the hub genes in this cluster are lung cancer“drivers” and that the genes located around theouter boundary are lung cancer “passengers.”Using somatic copy number alteration data ina TCGA pan-cancer analysis, we found that36.4% of the genes in this cluster (table S13)were amplified or deleted in their chromosomalregions (21).Among cancer-specific coexpression clusters,
those that were significantly enriched with prog-nostic genes (hypergeometric test, P ≤ 0.05) werenamed prognostic clusters, and an average of 13.9
clusters per cancer were enriched with prognos-tic genes (fig. S10 and table S14). A functionalanalysis, as exemplified by lung cancer (Fig. 5Cand fig. S9), showed thatmanyprognostic clusterswere enriched with genes associated with thehallmark genes, such as those involved in DNArepair, cell proliferation, angiogenesis, and cell-cell signaling, implying that those processes orpathways may be associated with lung cancerprogression. Across the 17 cancer types, the frac-tions of prognostic genes associated with thehallmark genes were determined (Fig. 5D and
fig. S9); more than half (57% on average) of theprognostic genes were not identified as hallmarkgenes butwere coexpressedwith hallmark genes.It remains to be determined whether many ofthe prognostic genes identified herein have apassive or dominant role in the development ofcancer.
Personalized metabolic networks forcancer patients
Tumors increase the nutrient import from theenvironment to fulfill biosynthetic demands
Uhlen et al., Science 357, eaan2507 (2017) 18 August 2017 7 of 11
Fig. 5. Coexpression analysis reveals the relationship with the Hallmarksof Cancer and clues for drivers among prognostic genes. Genecoexpression of 17 cancers was investigated on the basis of establishedcancer coexpression networks. (A) Network plot showing the number ofcancer-specific and shared prognostic cancer hallmark genes in all cancertypes. Note that all groups with fewer than four genes were removed from theplot. (B) A gene coexpression cluster from the coexpression network oflung cancer enriched with both hallmark and prognostic genes. (C) Network
plot showing coexpression clusters of lung cancer. All nodes indicategene coexpression clusters; edges indicate significant coexpression linksbetween clusters. The gray, yellow, and red color of the nodes indicatesthat the cluster was significantly enriched with hallmark genes, prognosticgenes, and both cases, respectively. (D) Bar plot showing the fractionof prognostic genes that are mere hallmark genes (red), coexpressedin hallmark gene clusters (pink), or not coexpressed with hallmarkgenes (gold).
RESEARCH | RESEARCH ARTICLEon D
ecember 28, 2019
http://science.sciencem
ag.org/D
ownloaded from

associated with proliferation, making use of thesenutrients to both maintain viability and buildnew biomass (22–24). To investigate the metabolicreprogramming of each tumor, we generated per-sonalized GSMMs for tumors from more than7000 of the 17 major cancer patients based ontranscriptomics data and generic human GSMMHMR2 (25) as previously described (26) (Fig. 6A).The resulting personalized GSMMs ranged in sizefrom 2070 to 4058 metabolites, 2093 to 5261 re-actions, and 978 to 2102 associated genes (fig. S11and table S15). A total of 4889 metabolites, 6977reactions, and 2760 genes were shared across themodels; 1419 metabolites, 1020 of the reactions,and 334 of the genes were present in all person-alized GSMMs. The personalized GSMMs are
available in the BioModels Database (www.ebi.ac.uk/biomodels) with accession numbersMODEL1707110000 to MODEL1707116752.PersonalizedGSMMsmay allow for the investi-
gation of common and unique biological func-tions for each patient (27). Using personalizedGSMMand constraint-basedmodeling,we inves-tigated heterogeneities of individual cancers byidentifying genes within a tumor that are impor-tant for its growth (3). Thismethod is suitable forstudying cancer metabolism because it assumesan increase in tumor growth rate under optimalconditions and hence searches for metabolic fluxdistributions to produce essential biomass pre-cursors at high rates (2, 28, 29). We found signif-icant differences in the essential genes catalyzing
tricarboxylic acid (TCA) cycle metabolism inliver cancer (Fig. 6B). As shown, the enzyme FH(fumarate hydratase) is identified as a conservedgene for tumor growth in all liver cancer patientsanalyzed,whereas SDHA (succinate dehydrogenasecomplex, subunit A) is important for tumor growthin ~60% of liver cancer patients, and ACLY (ATPcitrate lyase) is key for tumor growth in fewer than5% of liver cancer patients. In total, we identified2553 essential genes that can inhibit or kill tumorgrowth in any of the analyzed samples and foundthat 55 (2%) of the key genes are common in allcancer patients analyzed, regardless of the cancertype (table S14).Notably,we found that only 10% to25% of the essential genes were conserved inmorethan 80% of patients of each cancer type (Fig. 6C).
Uhlen et al., Science 357, eaan2507 (2017) 18 August 2017 8 of 11
Fig. 6. Genome-scale metabolic models (GSMMs) of cancers.(A) Concept of personalized GSMMs, which are comprehensive compila-tions of all the metabolic reactions within a particular cell, tissue, organ, ororganism. By mapping the transcriptomic data from cancer patients,personalized GSMMs could be reconstructed for investigation of thespecific metabolic viabilities for each individual. (B) Heat map showing theessential enzymes in the TCA cycle for all glioma patients to exemplify
the heterogeneity within the same cancer patient group. Only enzymesthat were key in at least one patient are shown. (C) Bar plot showingthe fraction of genes that were common in key genes in differentproportions of patients for 17 Human Pathology Atlas cancers. (D) Circosplot showing the top 10 common metabolic pathways that were over-represented by key genes in 17 Human Pathology Atlas cancers.Abbreviated names are provided in Fig. 1A and table S17.
RESEARCH | RESEARCH ARTICLEon D
ecember 28, 2019
http://science.sciencem
ag.org/D
ownloaded from

When we investigated the associated biolog-ical functions, a vastmajority of these geneswereassociated with central metabolic functions thatare essential for normal tissues (Fig. 6D and tableS16), and the corresponding proteins are thus notsuitable as targets for drug development. There-fore, we performed toxicity tests using themodelsgenerated for healthy tissues and observed that,in many cases, the potential inhibition of 76 to81% of these targets could be predicted to havesevere side effects, because the target is essential
in at least somenormal tissues.Moreover, we alsopredicted that 32 gene targets that are mainlyinvolved in nucleotide metabolism were pre-dicted to be nontoxic in healthy tissues (fig. S12)but key in more than 80% of the tumor of thepatient, regardless of the cancer type. These genesmay therefore hold promise as potential targetsfor cancer treatment. In general, gene targetswith less toxicity in normal tissue were key fortumor growth in fewer than 20% of cancer pa-tients. Our analysis thus demonstrates the large
heterogeneities in different cancer patients fromametabolic perspective and shows a path to indi-vidualized treatment of patientsbasedonmetabolicmodeling, thereby highlighting the importanceof systems-level analysis for precision cancertreatment.
Examination of genes in lung cancer
Further validation of prognostic genes identifiedthrough analyses of TCGA data was performedusing an independent cohort of lung cancer
Uhlen et al., Science 357, eaan2507 (2017) 18 August 2017 9 of 11
Fig. 7. Validation ofselected genes with aprognostic effect in lungcancer. Kaplan-Meier plotsfor RNA level separationfrom the TCGA cohort, RNAlevel separation from theHPA cohort, and protein-level separation are shown inthe first, second, and thirdcolumns, respectively. Thelog-rank P values are shownin the lower left corner ofeachKaplan-Meier plot. IHCstained tissues representinghigh and low protein expres-sion are shown in the fourthand fifth columns, respec-tively.The protein expressionlevels across 17 cancertypes analyzed by IHC inthe Human Pathology Atlasare shown at the right.
RESEARCH | RESEARCH ARTICLEon D
ecember 28, 2019
http://science.sciencem
ag.org/D
ownloaded from

(NSCLC) patients (n = 357). We used availableRNA-seq data from 199 individual tumors (30)and paraffin-embedded tumor tissue materialin a tissue microarray (TMA) format from 357patients (31). On the basis of transcriptomic data,the 100 most significant lung cancer prognosticgenes identified in the TCGA analysis showed ahigh degree of overlap with prognostic genes inthe independent NSCLC cohort (74% with P <0.1, 45%with P < 0.01). In addition, the panel forlung cancer shown in Fig. 2A was also validatedin this independent cohort (fig. S13).To further investigatewhether prognostic genes
identified through genome-wide transcriptomicsanalyses could be verified at the protein level, weperformed antibody-based IHC analyses of TMAswith tumor tissue (n = 357) for eight selectedtargets (Fig. 7). The IHC-based analysis confirmedthat the corresponding protein expression patternwas also significantly associated with prognosis,and this was also supported by the RNA-seq datain the independent NSCLC cohort. Examples(Fig. 7) include the endoplasmic reticulum oxido-reductase a protein ERO1A (32) and two mem-bers of the S100 family (S100A10 and S100A16).The latter two proteins have been suggested asprognosticmarkers at the protein level in NSCLCadenocarcinoma (33, 34). We could confirm theprognostic association of both S100A10 andS100A16 in the NSCLC cohort containing bothadenocarcinomas and squamous cell carcinomas.The proliferationmarkerMKI67 has been studiedin a number of cancer types; however, its clinicalapplication has been debated (35), andMKI67 hasnot been included in routine NSCLC diagnostics(36). In the present investigation, MKI67 was as-sociated with an unfavorable prognosis in theTCGA data set, which was also confirmed at boththe RNA and protein level in the independentNSCLC cohort. SLC2A1 (solute carrier family2 member 1), also known as GLUT1, is a down-stream gene of the hypoxic marker HIF1A andplays a role in glucose transport. TACC3 (trans-forming acidic coiled coil–containing protein 3)is involved in controlling normal cell growthand differentiation. Overexpression of SLC2A1and TACC3 was previously associated with apoor prognosis in lung cancer (37, 38), and herewe found that expression level associates withclinical outcome in lung cancer. Anillin (ANLN),an actin-binding protein required for cytokinesis,plays an important role in cell division and hasbeen suggested as a prognostic marker in breastcancer (39) and lung cancer (40). Here, our TCGAanalysis show prognostic value in lung, renal,pancreatic, and liver cancers, and the analysisof the independent lung cohort implies thatthismay be a favorable prognostic gene for clinicaloutcome.
Examination of genes in colon cancer
We investigated a large, independent, prospec-tively collected population-based cohort of colo-rectal cancer patients available in TMA format toassess possible prognostic protein signatures. Inthis cohort, mRNA expression data (RNA-seq)were also available for a smaller subset of the
patients (n = 60). Six targets with prognosticsignificance in colorectal cancer based on TCGAdatawere selected for IHC staining on the TMAs.All six genes were verified as related to prognosisat both the RNA level (n = 60) and protein level(n = 745) (fig. S14).
The Human Pathology Atlas
As part of this publication, we launch a newopen-access resource named the Human Pathol-ogy Atlas as part of the Human Protein Atlas(www.proteinatlas.org/pathology), presenting theKaplan-Meier survival plots for all protein-codinggenes in 17 different tumor types. A survival plotof the patient cohort, with the respective cancerand gene divided into two equal groups (median),is presented on the basis of RNA levels.More than900,000 survival plots (as exemplified by Fig. 2C)are presented in the new pathology resource toallow investigators to explore the clinical signifi-cance of patient survival related to specific genesin specific cancers, together with the associatedtranscriptomic, proteomic, and clinical informa-tion.A total of 13,088Kaplan-Meier plotswithhighsignificance (P < 0.001) are highlighted, and thedata are presented in a gene-centricmanner for allhuman protein-coding genes across the analyzedcancer types. Each prognostic gene for a givencancer type is shown, including theKaplan-Meierplots (Fig. 2A), together with the underlying datafor the selection of suitable FPKM cutoffs forpatient stratification (Fig. 2B) and the individualsurvival data for all patients (Fig. 2B). In addition,IHC analysis using a TMA-based analysis of thecorresponding proteins in patients with the re-spective cancer types is presented for a majorityof the protein-coding genes. More than 5 millionIHC-based cancer tissue images are included inthe atlas, showing protein expression patternsfor individual tumors of each cancer type. AllIHC images have been manually annotated bycertified pathologists. Thus, the resource allowsresearchers to explore the possible prognosticvalue of all human protein-coding genes relatedto expression levels in different forms of humancancer.
Discussion
Our results demonstrate the power of large sys-tematic “big data” efforts that make use of pub-licly available resources, such as the TCGAdatabaseused herein. The compiled data show that a largefraction of human protein-coding genes are dif-ferentially expressed in cancer and that this dif-ferential expression in many cases has an impacton patient survival. Prognostic genes appear tobe restricted to only a few cancer types, and nogeneswere informative across a large set of cancerpatients. A general pattern emerged, with unfavor-able genes showing an up-regulation associatedwith mitosis and cell growth, whereas the down-regulation of genes associated with cellular dif-ferentiation was associated with shorter patientsurvival. However, it is important to point outthat for a given prognostic gene, we observe ahuge variation in terms of clinical outcome forthe corresponding patient, implying the need
for further sophisticated studies to better com-prehend the concept of prognostic genes.The prognostic genes we identified should be
validated in independent patient cohorts, as ex-emplified by the validation using antibody-basedTMAs of a selection of the genes identified inlung cancer. The clinical metadata in the TCGAresource did not include therapeutic regimensfor the patients, nor whether death was relatedto the diagnosed cancer. In addition, the differ-ent sample and effect sizes for different cancerswould affect the number of prognostic genesobtained by survival analysis and log-rank test.Moreover, the purity of the tumor samples shouldalso affect the survival analysis, as previouslyreported (41). Hence, there is a need for follow-upvalidation studies in more controlled indepen-dent cancer cohorts before a potential prognosticgene can be confirmed. An important quest forthe near future is to identify which prognosticgenes are functionally important (“drivers”) withfunctional consequences that are required forcarcinogenesis and tumor progression, andwhichof the apparent prognostic genes are merely co-expressed with these “driver” genes.We generated cancer-specific coexpression
networks to study the functional relationshipbetween the prognostic genes and genes asso-ciated with Hallmarks of Cancer. This network-dependent analysis enabled the identification ofgenes with a key role in the survival of patients.The personalized genome-scale GSMMs allowedus to identify genes that were critical for tumorgrowth by demonstrating a huge heterogeneityamong patients from a metabolic perspective,highlighting the need for precise and person-alized medicine for cancer treatment. In thiscontext, the new Human Pathology Atlas is auseful standalone resource for cancer precisionmedicine. With its more than 900,000 Kaplan-Meier plots, this resource enables insights con-cerning the specific involvement of genes inclinical outcome for all themajor cancers, pavingthe way for further in-depth studies incorporatingsystems-level analyses of cancer. All data pre-sented herein are available in an interactive open-access database (www.proteinatlas.org/pathology)to allow for genome-wide exploration of the im-pact of individual proteins on clinical outcomein major human cancer types.
REFERENCES AND NOTES
1. D. J. Brennan, D. P. O’Connor, E. Rexhepaj, F. Ponten,W. M. Gallagher, Antibody-based proteomics: Fast-trackingmolecular diagnostics in oncology. Nat. Rev. Cancer 10,605–617 (2010). doi: 10.1038/nrc2902; pmid: 20720569
2. E. Björnson et al., Stratification of hepatocellular carcinomapatients based on acetate utilization. Cell Rep. 13,2014–2026 (2015). doi: 10.1016/j.celrep.2015.10.045;pmid: 26655911
3. A. Mardinoglu, J. Nielsen, New paradigms for metabolicmodeling of human cells. Curr. Opin. Biotechnol. 34, 91–97(2015). doi: 10.1016/j.copbio.2014.12.013; pmid: 25559199
4. S. Lee, A. Mardinoglu, C. Zhang, D. Lee, J. Nielsen,Dysregulated signaling hubs of liver lipid metabolism revealhepatocellular carcinoma pathogenesis. Nucleic Acids Res. 44,5529–5539 (2016). doi: 10.1093/nar/gkw462; pmid: 27216817
5. J. N. Weinstein et al., The Cancer Genome Atlas Pan-Canceranalysis project. Nat. Genet. 45, 1113–1120 (2013).doi: 10.1038/ng.2764; pmid: 24071849
Uhlen et al., Science 357, eaan2507 (2017) 18 August 2017 10 of 11
RESEARCH | RESEARCH ARTICLEon D
ecember 28, 2019
http://science.sciencem
ag.org/D
ownloaded from

6. M. Uhlén et al., Tissue-based map of the human proteome.Science 347, 1260419 (2015). doi: 10.1126/science.1260419;pmid: 25613900
7. J. Lonsdale et al., The Genotype-Tissue Expression (GTEx)project. Nat. Genet. 45, 580–585 (2013). doi: 10.1038/ng.2653; pmid: 23715323
8. L. Collado-Torres et al., Reproducible RNA-seq analysis usingrecount2. Nat. Biotechnol. 35, 319–321 (2017). doi: 10.1038/nbt.3838; pmid: 28398307
9. L. Peng et al., Large-scale RNA-Seq transcriptome analysis of4043 cancers and 548 normal tissue controls across 12 TCGAcancer types. Sci. Rep. 5, 13413 (2015). doi: 10.1038/srep13413; pmid: 26292924
10. F. Edfors et al., Gene-specific correlation of RNA and proteinlevels in human cells and tissues. Mol. Syst. Biol. 12, 883(2016). doi: 10.15252/msb.20167144; pmid: 27951527
11. D. Hanahan, R. A. Weinberg, Hallmarks of cancer: The nextgeneration. Cell 144, 646–674 (2011). doi: 10.1016/j.cell.2011.02.013; pmid: 21376230
12. C. Kandoth et al., Mutational landscape and significance across12 major cancer types. Nature 502, 333–339 (2013).doi: 10.1038/nature12634; pmid: 24132290
13. T. Hothorn, B. Lausen, On the exact distribution of maximallyselected rank statistics. Comput. Stat. Data Anal. 43, 121–137(2003). doi: 10.1016/S0167-9473(02)00225-6
14. B. Hjelm et al., High nuclear RBM3 expression is associatedwith an improved prognosis in colorectal cancer. ProteomicsClin. Appl. 5, 624–635 (2011). doi: 10.1002/prca.201100020;pmid: 21956899
15. C. J. Creighton et al., Comprehensive molecularcharacterization of clear cell renal cell carcinoma.Nature 499, 43–49 (2013). doi: 10.1038/nature12222;pmid: 23792563
16. A. Subramanian et al., Gene set enrichment analysis: Aknowledge-based approach for interpreting genome-wideexpression profiles. Proc. Natl. Acad. Sci. U.S.A. 102,15545–15550 (2005). doi: 10.1073/pnas.0506580102;pmid: 16199517
17. H. A. Edmondson, P. E. Steiner, Primary carcinoma of the liver:A study of 100 cases among 48,900 necropsies. Cancer 7,462–503 (1954). doi: 10.1002/1097-0142(195405)7:3<462::AID-CNCR2820070308>3.0.CO;2-E; pmid: 13160935
18. T. M. Pawlik et al., Preoperative assessment ofhepatocellular carcinoma tumor grade using needle biopsy:Implications for transplant eligibility. Ann. Surg. 245,435–442 (2007). doi: 10.1097/01.sla.0000250420.73854.ad;pmid: 17435551
19. A. J. Simpson, O. L. Caballero, A. Jungbluth, Y. T. Chen,L. J. Old, Cancer/testis antigens, gametogenesis and cancer.Nat. Rev. Cancer 5, 615–625 (2005). doi: 10.1038/nrc1669;pmid: 16034368
20. M. Kanehisa, M. Furumichi, M. Tanabe, Y. Sato, K. Morishima,KEGG: New perspectives on genomes, pathways, diseases anddrugs. Nucleic Acids Res. 45, D353–D361 (2017). doi: 10.1093/nar/gkw1092; pmid: 27899662
21. T. I. Zack et al., Pan-cancer patterns of somatic copy numberalteration. Nat. Genet. 45, 1134–1140 (2013). doi: 10.1038/ng.2760; pmid: 24071852
22. N. N. Pavlova, C. B. Thompson, The emerging hallmarks ofcancer metabolism. Cell Metab. 23, 27–47 (2016).doi: 10.1016/j.cmet.2015.12.006; pmid: 26771115
23. M. G. Vander Heiden, R. J. DeBerardinis, Understanding theintersections between metabolism and cancer biology. Cell 168,657–669 (2017). doi: 10.1016/j.cell.2016.12.039; pmid: 28187287
24. P. Ghaffari, A. Mardinoglu, J. Nielsen, Cancer metabolism: Amodeling perspective. Front. Physiol. 6, 382 (2015).doi: 10.3389/fphys.2015.00382; pmid: 26733270
25. A. Mardinoglu et al., Genome-scale metabolic modelling ofhepatocytes reveals serine deficiency in patients withnon-alcoholic fatty liver disease. Nat. Commun. 5, 3083 (2014).doi: 10.1038/ncomms4083; pmid: 24419221
26. R. Agren et al., Identification of anticancer drugs forhepatocellular carcinoma through personalized genome-scalemetabolic modeling. Mol. Syst. Biol. 10, 721 (2014).doi: 10.1002/msb.145122; pmid: 24646661
27. A. Mardinoglu et al., Personal model-assisted identification ofNAD(+) and glutathione metabolism as intervention target inNAFLD. Mol. Syst. Biol. 13, 916 (2017). doi: 10.15252/msb.20167422; pmid: 28254760
28. L. Jerby-Arnon et al., Predicting cancer-specific vulnerabilityvia data-driven detection of synthetic lethality. Cell 158,1199–1209 (2014). doi: 10.1016/j.cell.2014.07.027; pmid: 25171417
29. C. Zhang, Q. Hua, Applications of genome-scale metabolic modelsin biotechnology and systems medicine. Front. Physiol. 6, 413(2016). doi: 10.3389/fphys.2015.00413; pmid: 26779040
30. D. Djureinovic et al., Profiling cancer testis antigens in non-small-cell lung cancer. Jci Insight 1, e86837 (2016).doi: 10.1172/jci.insight.86837; pmid: 27699219
31. P. Micke et al., The impact of the Fourth Edition of the WHOClassification of Lung Tumours on histological classification ofresected pulmonary NSCCs. J. Thorac. Oncol. 11, 862–872(2016). doi: 10.1016/j.jtho.2016.01.020; pmid: 26872818
32. T. Tanaka et al., Cancer-associated oxidoreductase ERO1-adrives the production of VEGF via oxidative protein folding andregulating the mRNA level. Br. J. Cancer 114, 1227–1234(2016). doi: 10.1038/bjc.2016.105; pmid: 27100727
33. K. Katono et al., Clinicopathological significance of S100A10 expressionin lung adenocarcinomas. Asian Pac. J. Cancer Prev. 17, 289–294(2016). doi: 10.7314/APJCP.2016.17.1.289; pmid: 26838226
34. K. Saito et al., S100A16 is a prognostic marker for lungadenocarcinomas. Asian Pac. J. Cancer Prev. 16, 7039–7044(2015). doi: 10.7314/APJCP.2015.16.16.7039; pmid: 26514487
35. F. Penault-Llorca, N. Radosevic-Robin, Ki67 assessment inbreast cancer: An update. Pathology 49, 166–171 (2017).doi: 10.1016/j.pathol.2016.11.006; pmid: 28065411
36. J. N. Jakobsen, J. B. Sørensen, Clinical impact of Ki-67 labelingindex in non-small cell lung cancer. Lung Cancer 79, 1–7(2013). doi: 10.1016/j.lungcan.2012.10.008; pmid: 23137549
37. M. Younes, R. W. Brown, M. Stephenson, M. Gondo, P. T. Cagle,Overexpression of Glut1 and Glut3 in stage I nonsmall cell
lung carcinoma is associated with poor survival. Cancer 80,1046–1051 (1997). doi: 10.1002/(SICI)1097-0142(19970915)80:6<1046::AID-CNCR6>3.0.CO;2-7; pmid: 9305704
38. C. K. Jung et al., Expression of transforming acidic coiled-coilcontaining protein 3 is a novel independent prognostic markerin non-small cell lung cancer. Pathol. Int. 56, 503–509 (2006).doi: 10.1111/j.1440-1827.2006.01998.x; pmid: 16930330
39. K. Magnusson et al., ANLN is a prognostic biomarkerindependent of Ki-67 and essential for cell cycle progression inprimary breast cancer. BMC Cancer 16, 904 (2016).doi: 10.1186/s12885-016-2923-8; pmid: 27863473
40. C. Suzuki et al., ANLN plays a critical role in human lungcarcinogenesis through the activation of RHOA and byinvolvement in the phosphoinositide 3-kinase/AKT pathway.Cancer Res. 65, 11314–11325 (2005). doi: 10.1158/0008-5472.CAN-05-1507; pmid: 16357138
41. D. Aran, M. Sirota, A. J. Butte, Systematic pan-cancer analysisof tumour purity. Nat. Commun. 6, 8971 (2015). doi: 10.1038/ncomms9971; pmid: 26634437
ACKNOWLEDGMENTS
The data reported in this manuscript are tabulated in the mainpaper and the supplementary materials. We thank the entire staffof the Human Protein Atlas program and the Science for LifeLaboratory, the National Genomics Infrastructure, and SwedishNational Infrastructure for Computing at UPPMAX and C3SE forproviding assistance in massive parallel sequencing andcomputational infrastructure. Supported by the Swedish CancerFoundation (F.P.), Science for Life Laboratory infrastructurefunding (C.L., E.L. and P.N.), the Erling Persson Foundation (M.U.),Elixir (EU infrastructure funding) (K.F. and M.U.), the SwedishCancer Foundation and the Uppsala Lions Cancer Foundation (P.M.),the Knut and Alice Wallenberg Foundation, and the strategicresearch area “U-CAN” through Swedish Research Council grantCancerUU. We thank the Uppsala Biobank and Clinical Department ofPathology at the Uppsala University Hospital for providing specimens.We also thank The Cancer Genome Atlas for providing access todata. M.U. and F.P. are inventors on patents held by Atlas Antibodiesthat cover the analysis of RBM3 (U.S. patent 8728739) and PODXL(U.S. patent 8999656) as a prognostic marker in several cancers. Theauthors declare that they have no other conflict of interest. Aninteractive pathology atlas with gene-specific data for all human genes(including more than 900,000 Kaplan-Meier plots) is availableat www.proteinatlas.org/pathology.
SUPPLEMENTARY MATERIALS
www.sciencemag.org/content/357/6352/eaan2507/suppl/DC1Materials and MethodsFigs. S1 to S14Tables S1 to S21References (42–51)
22 March 2017; resubmitted 2 June 2017Accepted 14 July 201710.1126/science.aan2507
Uhlen et al., Science 357, eaan2507 (2017) 18 August 2017 11 of 11
RESEARCH | RESEARCH ARTICLEon D
ecember 28, 2019
http://science.sciencem
ag.org/D
ownloaded from
A pathology atlas of the human cancer transcriptome
Dijana Djureinovic, Patrick Micke, Cecilia Lindskog, Adil Mardinoglu and Fredrik PontenNilsson, Johanna Mattsson, Jochen M. Schwenk, Hans Brunnström, Bengt Glimelius, Tobias Sjöblom, Per-Henrik Edqvist,Arif, Zhengtao Liu, Fredrik Edfors, Kemal Sanli, Kalle von Feilitzen, Per Oksvold, Emma Lundberg, Sophia Hober, Peter Mathias Uhlen, Cheng Zhang, Sunjae Lee, Evelina Sjöstedt, Linn Fagerberg, Gholamreza Bidkhori, Rui Benfeitas, Muhammad
DOI: 10.1126/science.aan2507 (6352), eaan2507.357Science
, this issue p. eaan2507Sciencegenerate personalized patient models to predict how metabolic changes can influence tumor growth.available, including for tumors of colon, prostate, lung, and breast origin. This interactive data set can also be used tospecific genes influences patient survival in 17 different types of cancer. More than 900,000 patient survival profiles are
ofdifferent cancer types in nearly 8000 patients. They provide an open-access resource for exploring how the expression developed a computer-based modeling approach to examineet al.improving patient diagnostics and treatment. Uhlen
tumor growth. By unraveling genomic alterations in tumors, molecular subtypes of cancers have been identified, which is Recent initiatives such as The Cancer Genome Atlas have mapped the genome-wide effect of individual genes on
Modeling the cancer transcriptome
ARTICLE TOOLS http://science.sciencemag.org/content/357/6352/eaan2507
MATERIALSSUPPLEMENTARY http://science.sciencemag.org/content/suppl/2017/08/16/357.6352.eaan2507.DC1
CONTENTRELATED
http://stke.sciencemag.org/content/sigtrans/12/609/eaaz0274.fullhttp://stm.sciencemag.org/content/scitransmed/3/90/90ra59.fullhttp://stm.sciencemag.org/content/scitransmed/3/96/96ra77.fullhttp://stm.sciencemag.org/content/scitransmed/5/209/209ra153.fullhttp://stm.sciencemag.org/content/scitransmed/5/186/186ra66.fullhttp://stm.sciencemag.org/content/scitransmed/3/75/75ra25.full
REFERENCES
http://science.sciencemag.org/content/357/6352/eaan2507#BIBLThis article cites 49 articles, 6 of which you can access for free
PERMISSIONS http://www.sciencemag.org/help/reprints-and-permissions
Terms of ServiceUse of this article is subject to the
is a registered trademark of AAAS.ScienceScience, 1200 New York Avenue NW, Washington, DC 20005. The title (print ISSN 0036-8075; online ISSN 1095-9203) is published by the American Association for the Advancement ofScience
Science. No claim to original U.S. Government WorksCopyright © 2017 The Authors, some rights reserved; exclusive licensee American Association for the Advancement of
on Decem
ber 28, 2019
http://science.sciencemag.org/
Dow
nloaded from