Geometric Design Standards: Crest Vertical Curves 2014 | 2-4 September, South Africa Geometric...
49
SARF/IRF 2014 | 2-4 September, South Africa Geometric Design Standards: Crest Vertical Curves Prepared by: Rudi von Fintel
Transcript of Geometric Design Standards: Crest Vertical Curves 2014 | 2-4 September, South Africa Geometric...
SARF/IRF 2014 | 2-4 September, South Africa
Geometric Design Standards: Crest Vertical Curves
Prepared by:
Rudi von Fintel
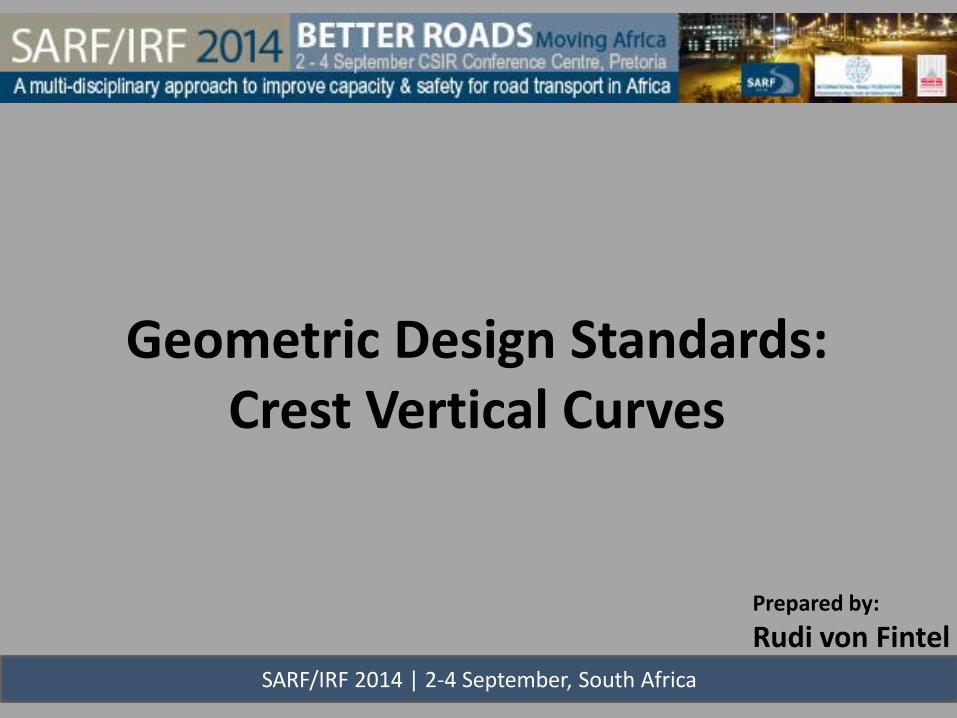
Contents: • Background • Introduction • Stopping sight distance on a vertical curve • The shadow area & the effect of: gradient
deceleration rate eye height speed current AASHTO standards
• Findings • Conclusion

Background: • South African standards based on AASHTO • Developed in the 1950’s and 1960’s
with periodic revisions; big changes in vehicle capabilities;
big changes in traffic composition!
• Designs produced in less time environmental, OHS, procurement processes;
tendering for work, reduced margins; designers with less experience; more use of minimum standards; increased reliance on software!
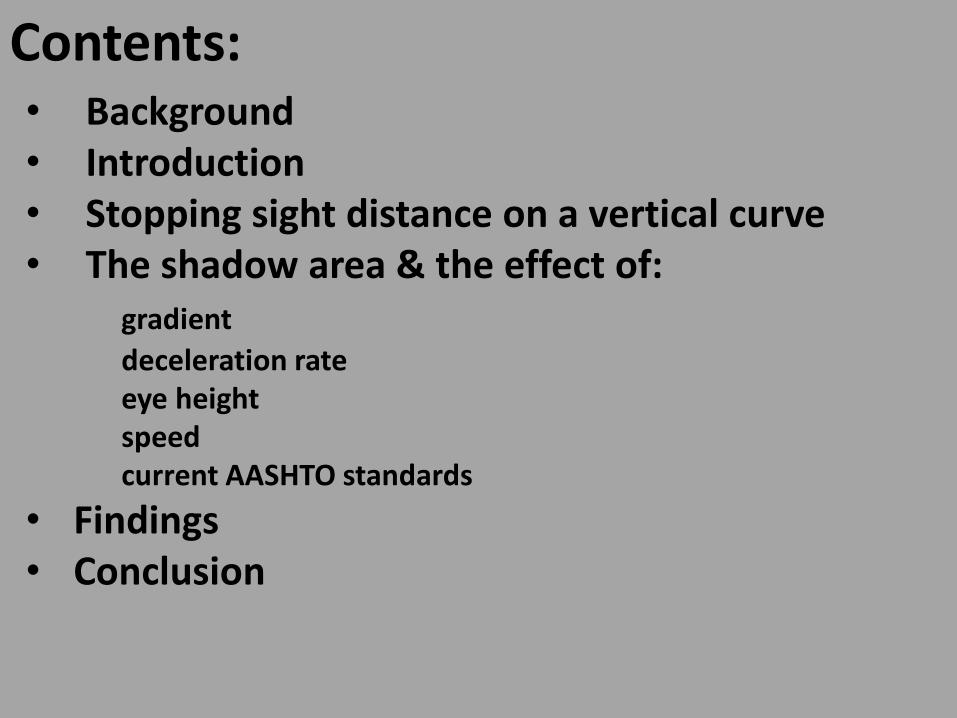
Introduction: • Parabolic curves
y = ax² + bx + c where: a = A/200L but: K = L/A therefore a = 1/200K
• Rate of curvature (K)
LVC > SSD: LVC < SSD:
Where: K = rate of curvature S = stopping sight distance h1 = eye height h2 = object height A = algebraic difference in gradient
For 100km/h: S = 200m; h1 = 1,05m; h2 = 0,6m;
K = 60
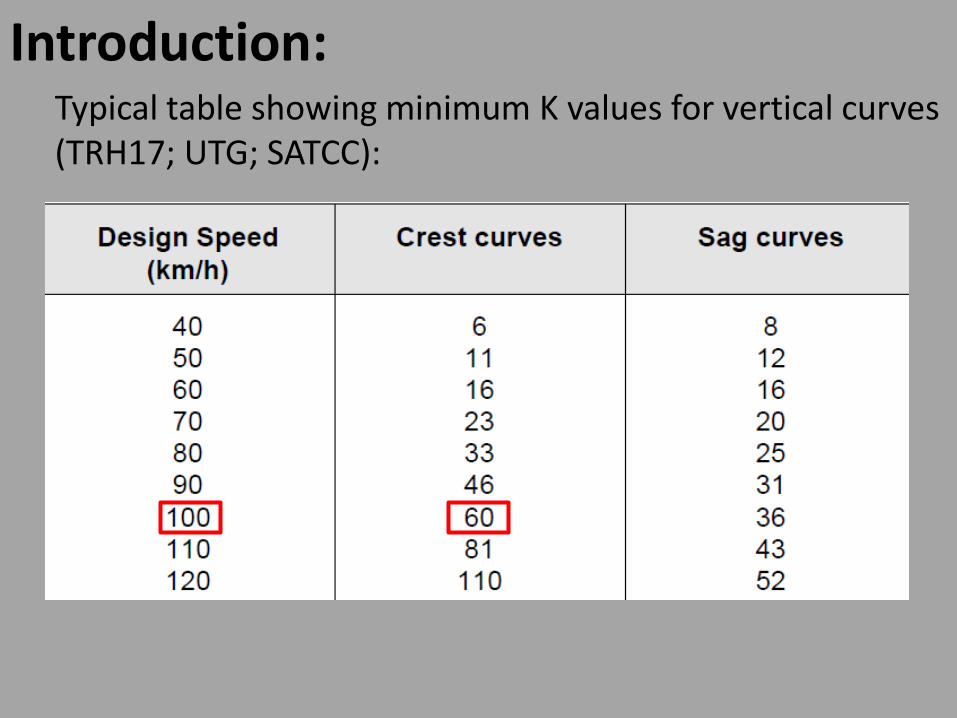
Introduction: Typical table showing minimum K values for vertical curves (TRH17; UTG; SATCC):
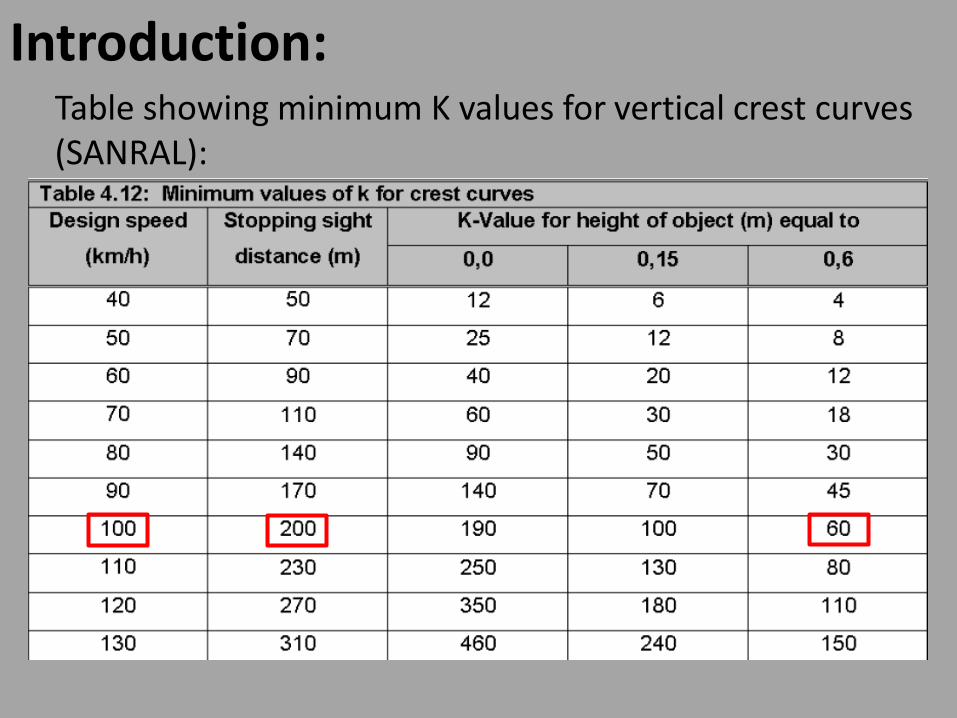
Introduction: Table showing minimum K values for vertical crest curves (SANRAL):
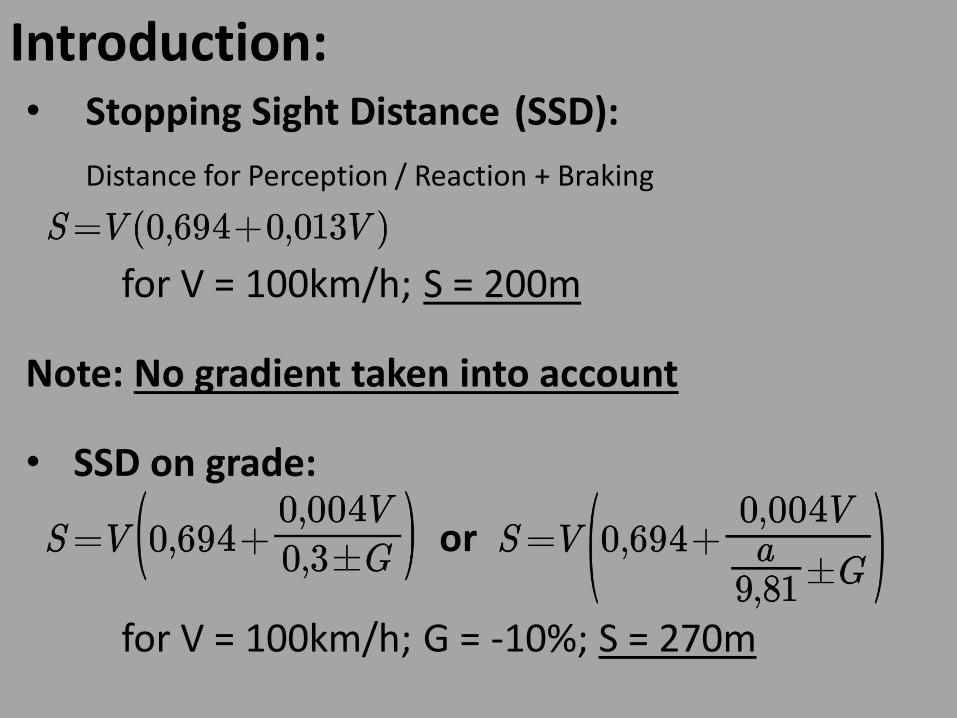
Introduction: • Stopping Sight Distance (SSD):
Distance for Perception / Reaction + Braking for V = 100km/h; S = 200m
Note: No gradient taken into account
• SSD on grade:
for V = 100km/h; G = -10%; S = 270m
or
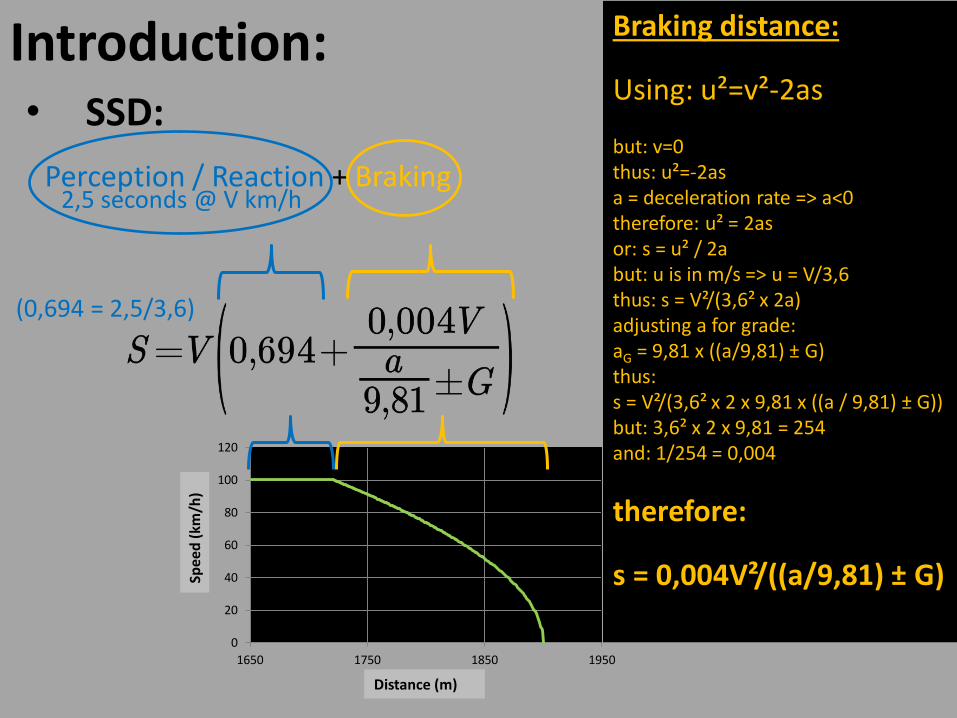
• SSD:
Perception / Reaction + Braking
Introduction:
0
20
40
60
80
100
120
1650 1750 1850 1950
Distance (m)
Spe
ed
(km
/h)
2,5 seconds @ V km/h
(0,694 = 2,5/3,6)
Braking distance:
Using: u²=v²-2as but: v=0 thus: u²=-2as a = deceleration rate => a<0 therefore: u² = 2as or: s = u² / 2a but: u is in m/s => u = V/3,6 thus: s = V²/(3,6² x 2a) adjusting a for grade: aG = 9,81 x ((a/9,81) ± G) thus: s = V²/(3,6² x 2 x 9,81 x ((a / 9,81) ± G)) but: 3,6² x 2 x 9,81 = 254 and: 1/254 = 0,004
therefore:
s = 0,004V²/((a/9,81) ± G)
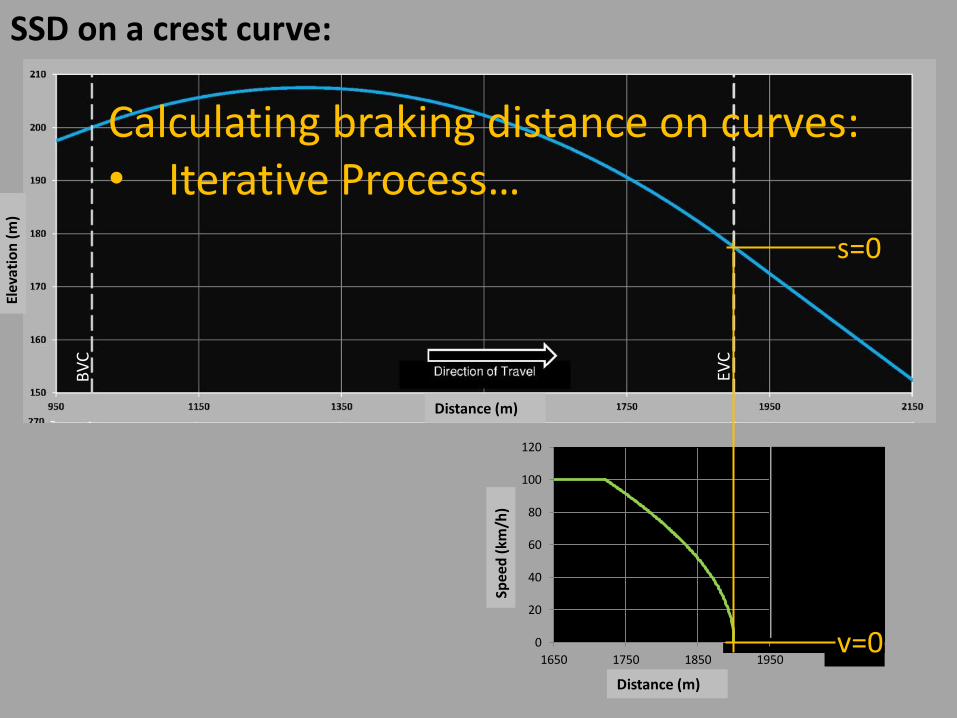
SSD on a crest curve: El
evat
ion
(m
)
Distance (m)
BV
C
EVC
0
20
40
60
80
100
120
1650 1750 1850 1950
Distance (m)
Spee
d (
km/h
)
s=0
v=0
Calculating braking distance on curves: • Iterative Process…
SSD on a crest curve: El
evat
ion
(m
)
Distance (m)
BV
C
EVC
0
20
40
60
80
100
120
1650 1750 1850 1950
Distance (m)
Spee
d (
km/h
)
s=0
v=0
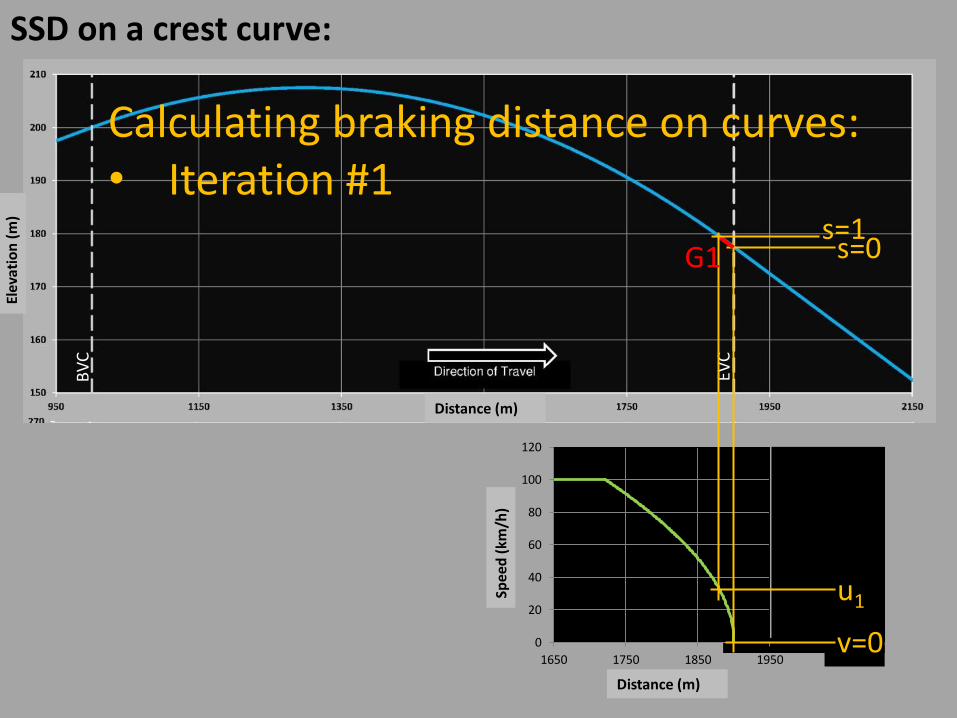
s=1
u1
G1
Calculating braking distance on curves: • Iteration #1
SSD on a crest curve: El
evat
ion
(m
)
Distance (m)
BV
C
EVC
0
20
40
60
80
100
120
1650 1750 1850 1950
Distance (m)
Spee
d (
km/h
)
s=0
v=0
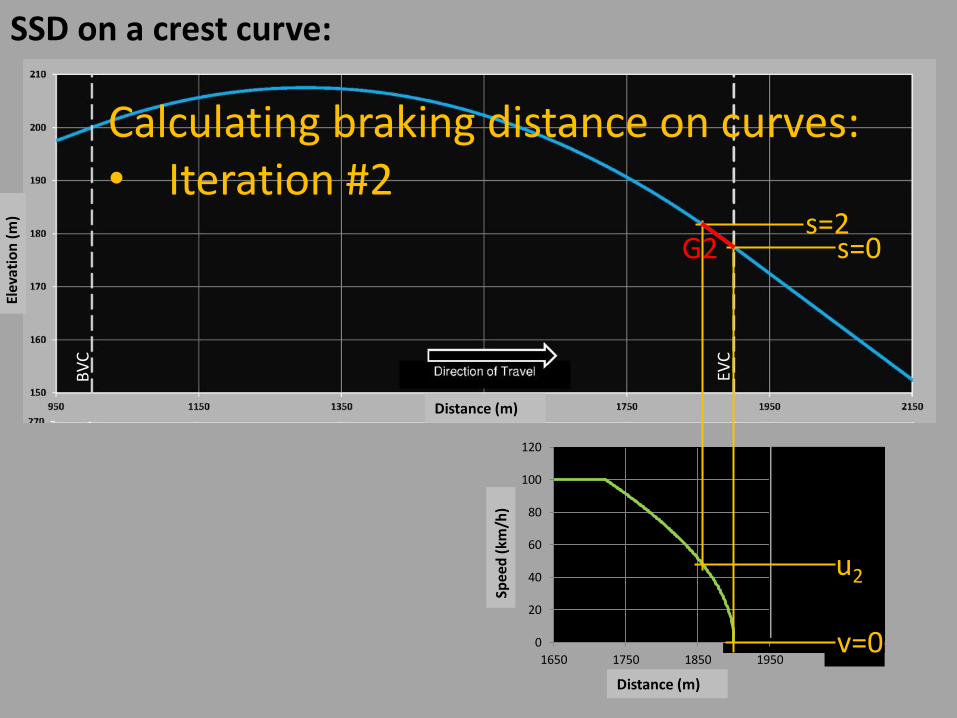
G2 s=2
u2
Calculating braking distance on curves: • Iteration #2

SSD on a crest curve: El
evat
ion
(m
)
Distance (m)
BV
C
EVC
0
20
40
60
80
100
120
1650 1750 1850 1950
Distance (m)
Spee
d (
km/h
)
s=0
v=0
G3 s=3
u3
Calculating braking distance on curves: • Iteration #3
SSD on a crest curve: El
evat
ion
(m
)
Distance (m)
BV
C
EVC
0
20
40
60
80
100
120
1650 1750 1850 1950
Distance (m)
Spee
d (
km/h
)
v=0
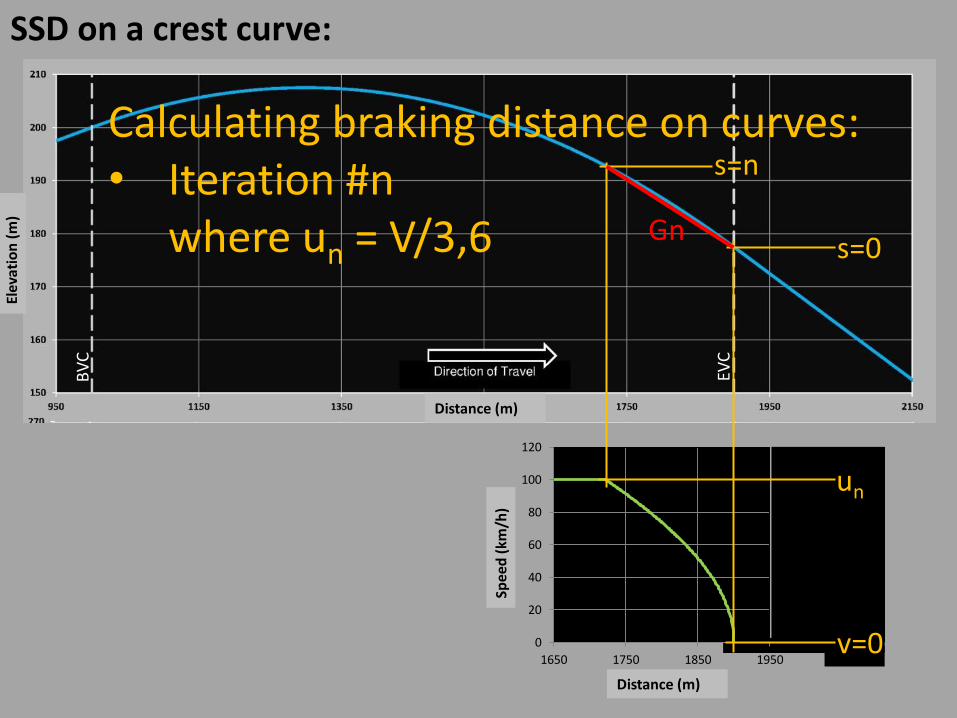
s=n
un
Gn s=0
Calculating braking distance on curves: • Iteration #n
where un = V/3,6
SSD on a crest curve: El
evat
ion
(m
)
Distance (m)
BV
C
EVC
0
20
40
60
80
100
120
1650 1750 1850 1950
Distance (m)
Spee
d (
km/h
)
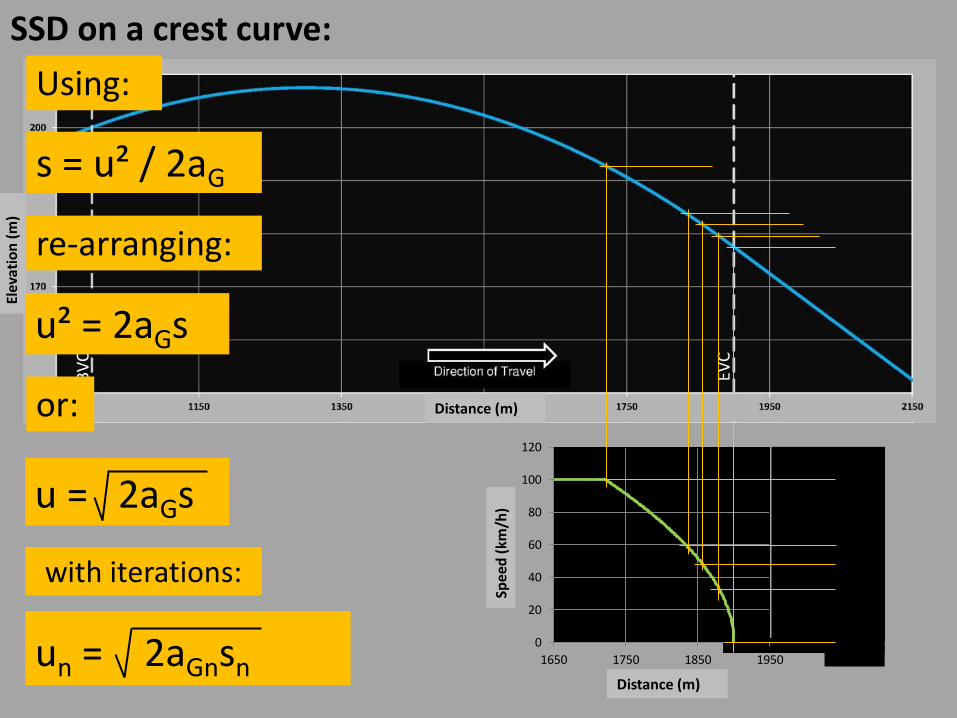
Using:
u² = 2aGs
u = 2aGs
un = 2aGnsn
with iterations:
s = u² / 2aG
re-arranging:
or:
SSD on a crest curve: El
evat
ion
(m
)
Distance (m)
BV
C
EVC
0
20
40
60
80
100
120
1650 1750 1850 1950
Spee
d (
km/h
)
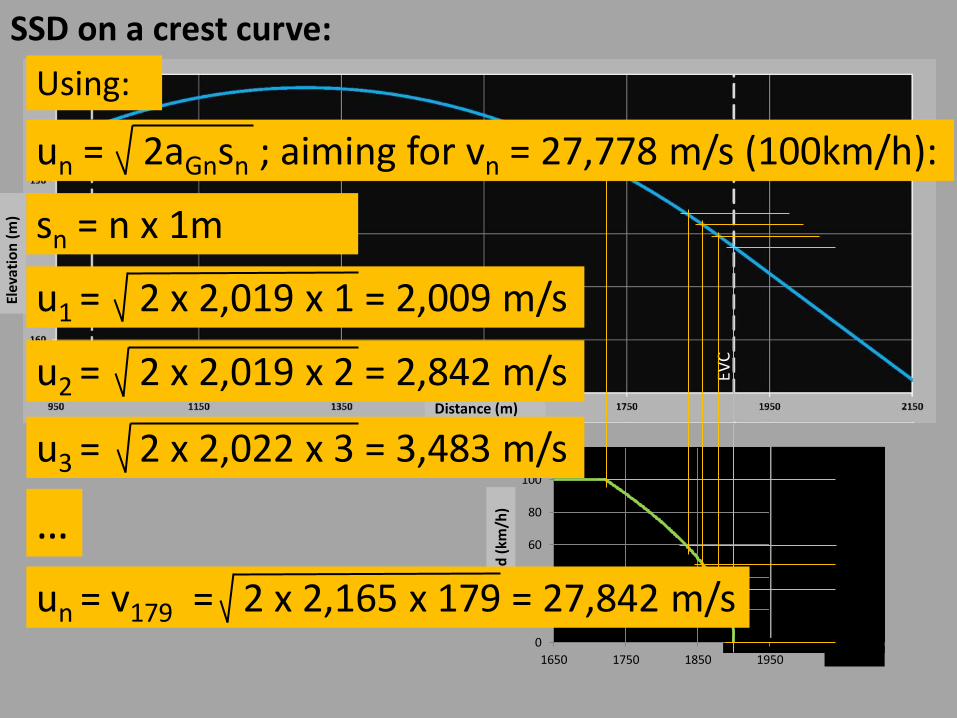
sn = n x 1m
u2 = 2 x 2,019 x 2 = 2,842 m/s
u3 = 2 x 2,022 x 3 = 3,483 m/s
u1 = 2 x 2,019 x 1 = 2,009 m/s
…
Distance (m) un = v179 = 2 x 2,165 x 179 = 27,842 m/s
Using:
un = 2aGnsn ; aiming for vn = 27,778 m/s (100km/h):
SSD on a crest curve: El
evat
ion
(m
)
0
20
40
60
80
100
120
1650 1750 1850 1950
Distance (m)
Spee
d (
km/h
)
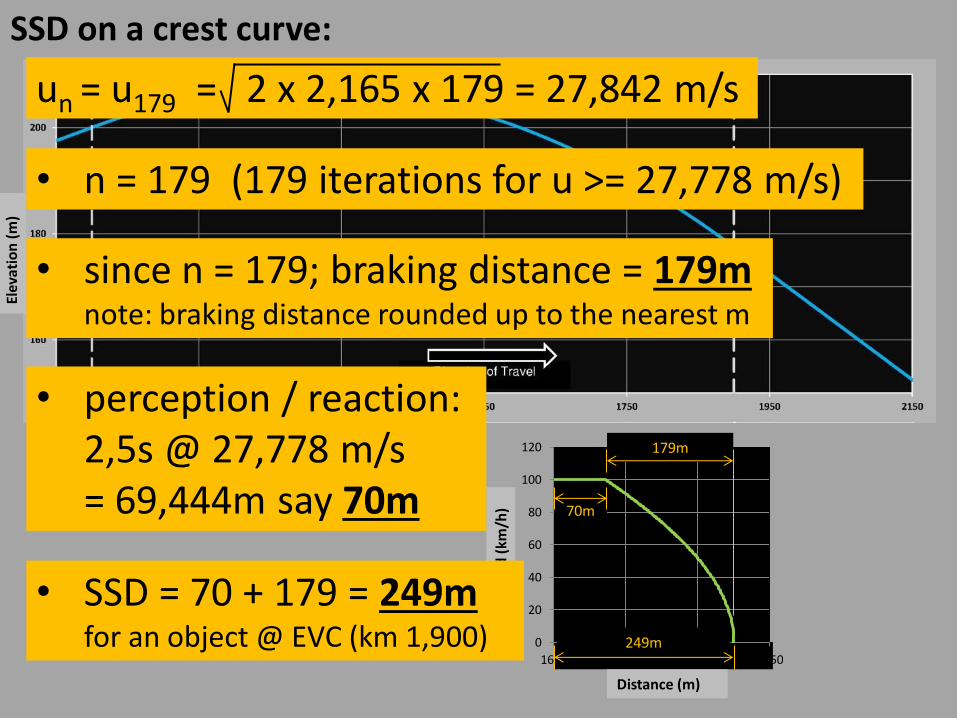
• n = 179 (179 iterations for u >= 27,778 m/s)
un = u179 = 2 x 2,165 x 179 = 27,842 m/s
179m
• since n = 179; braking distance = 179m note: braking distance rounded up to the nearest m
• perception / reaction: 2,5s @ 27,778 m/s = 69,444m say 70m 70m
• SSD = 70 + 179 = 249m for an object @ EVC (km 1,900) 249m
SSD on a crest curve: El
evat
ion
(m
) SS
D (
m)
Distance (m)
BV
C
EVC
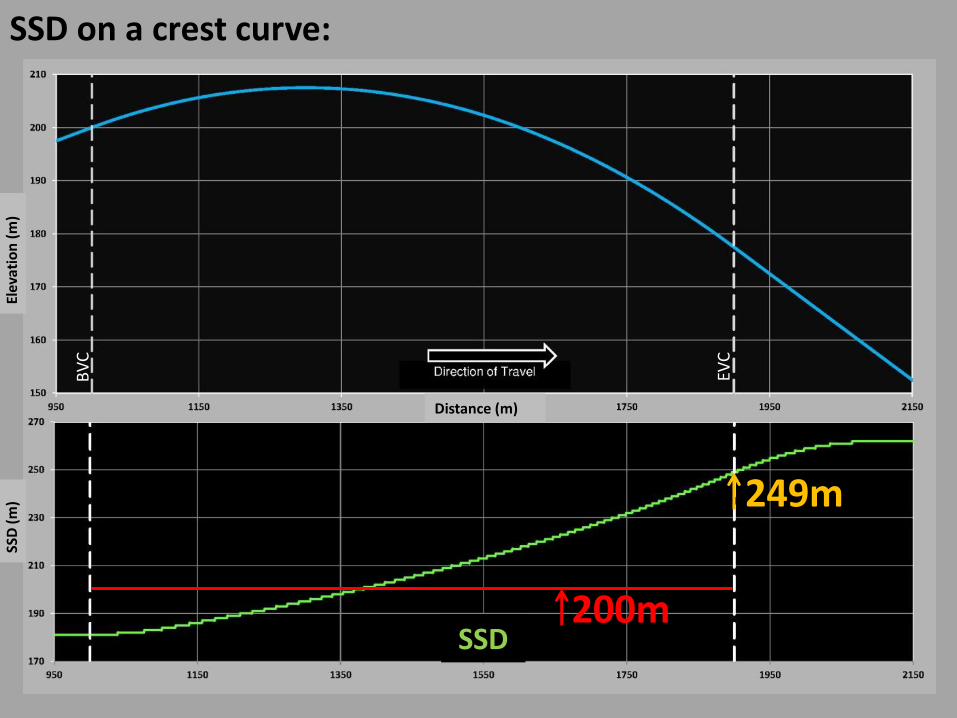
SSD
249m
200m
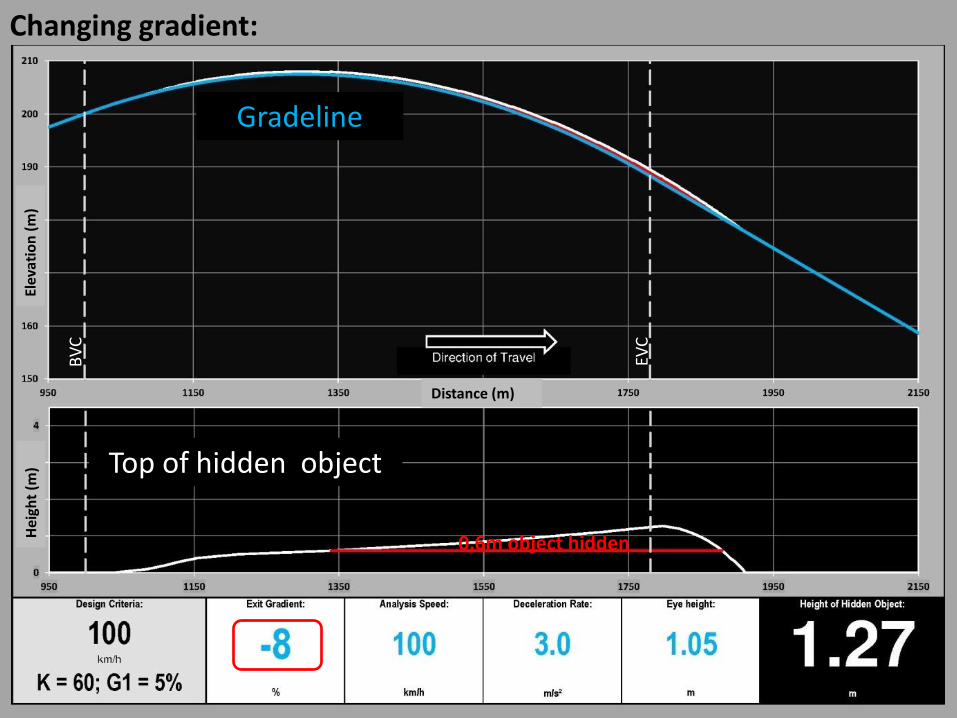
The shadow area: • A plot tracing the top of the hidden object at the end of
the stopping sight distance along the length of influence of a crest vertical curve.
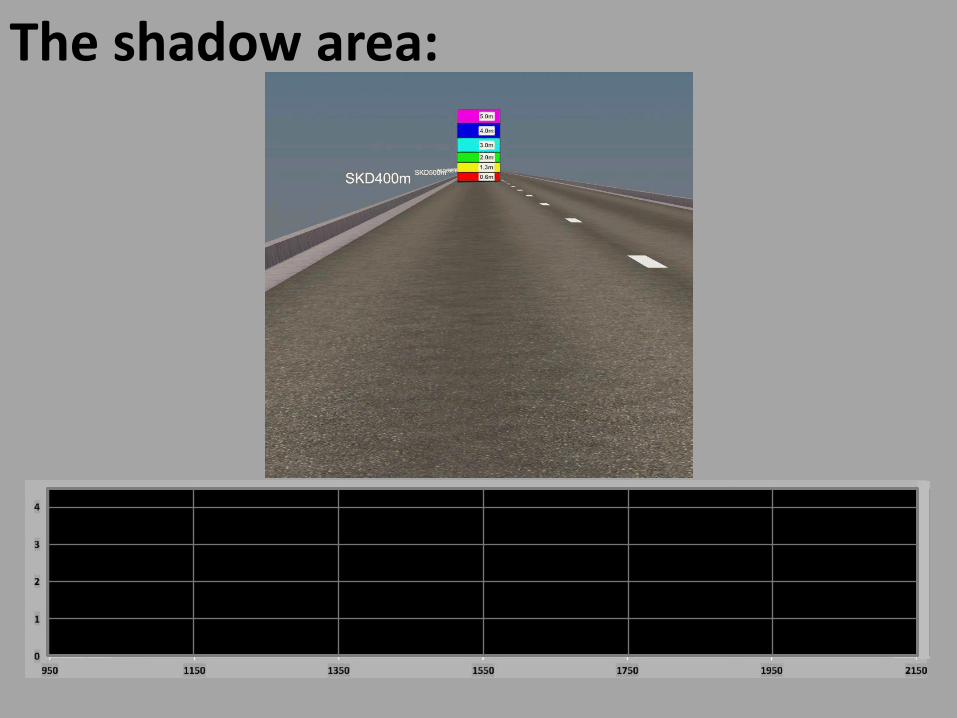
The shadow area:
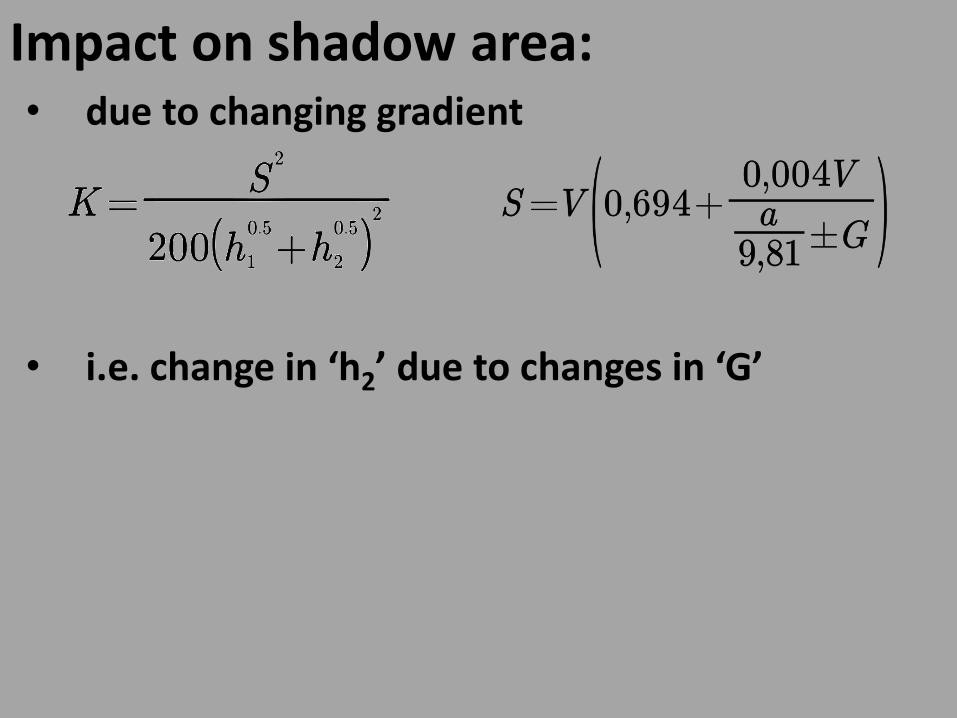
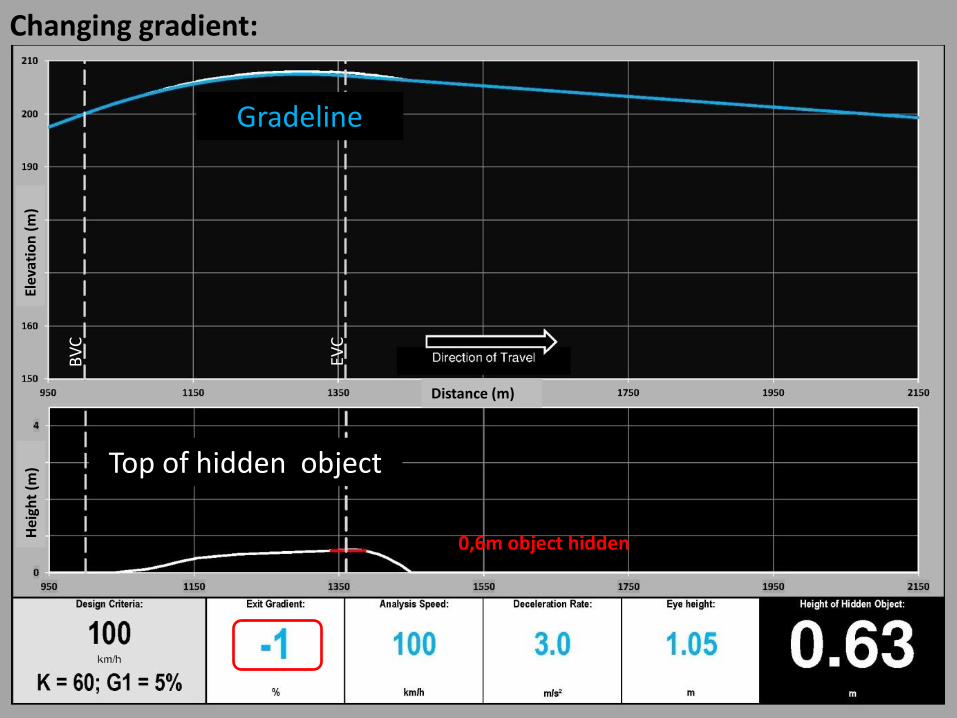
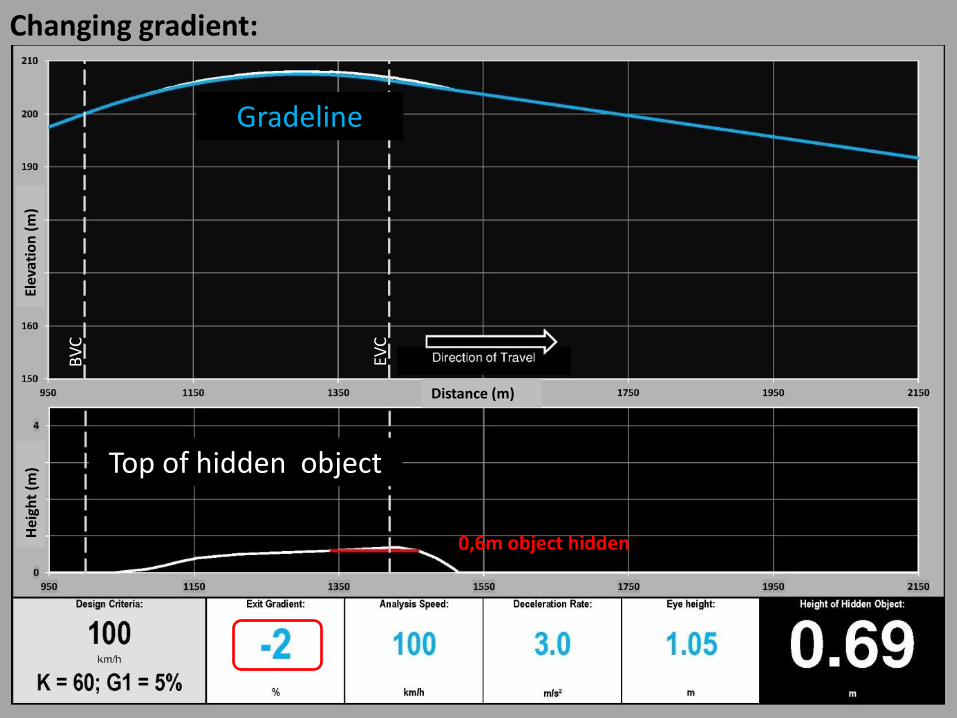
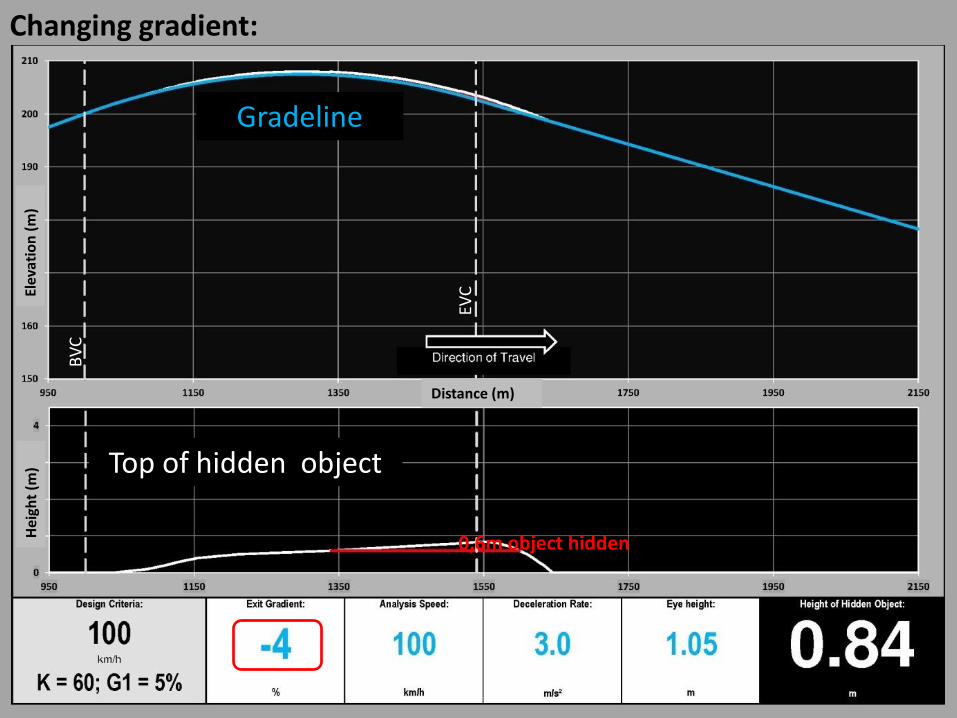
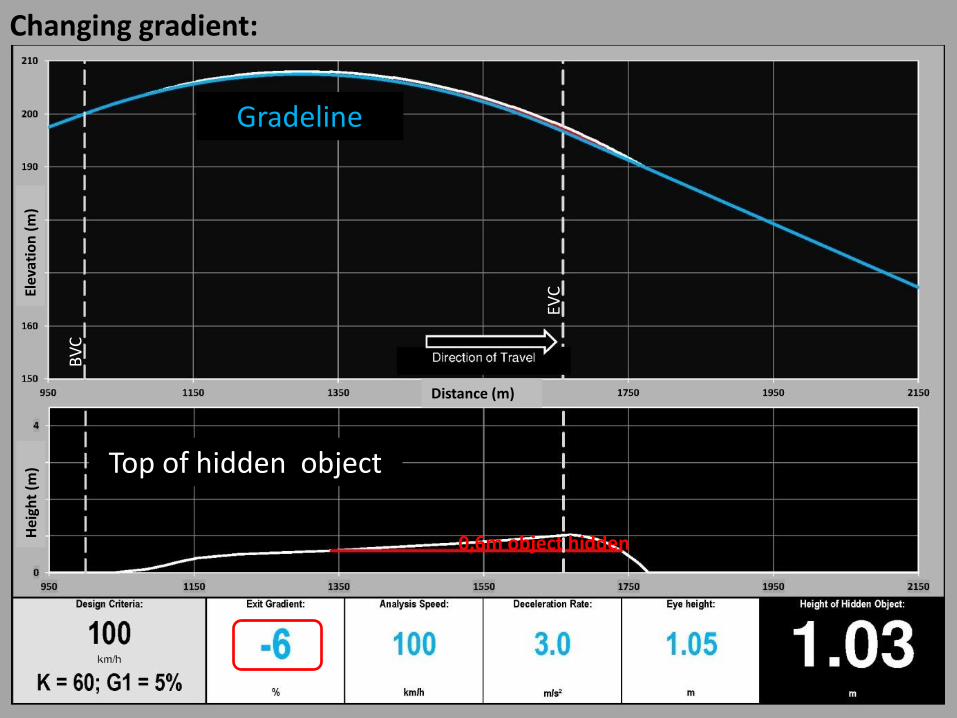
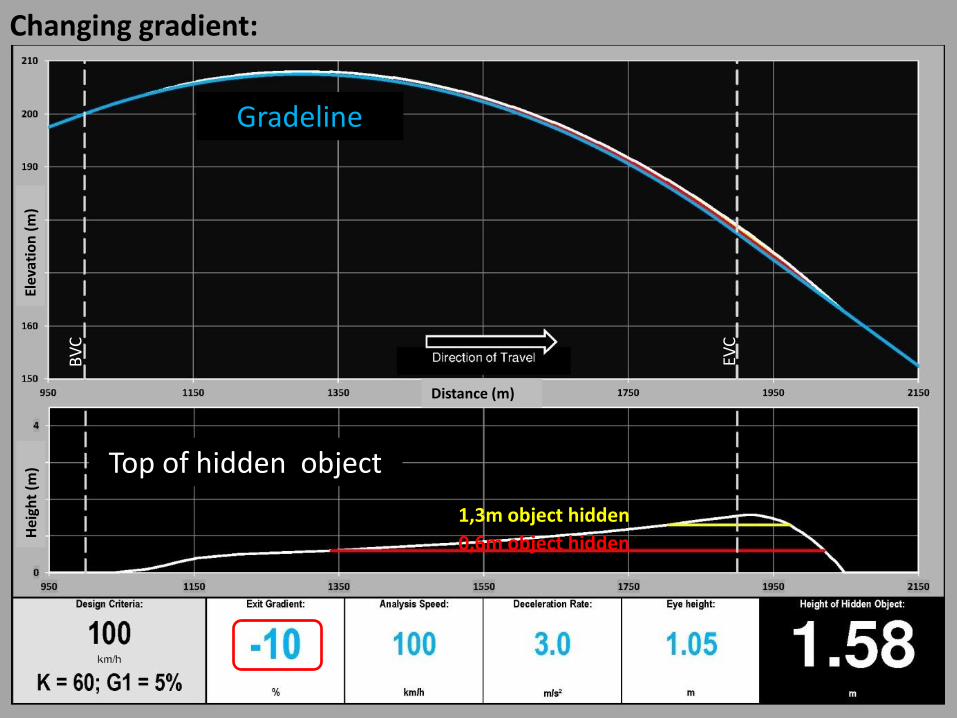
Impact on shadow area: • due to changing gradient
• i.e. change in ‘h2’ due to changes in ‘G’
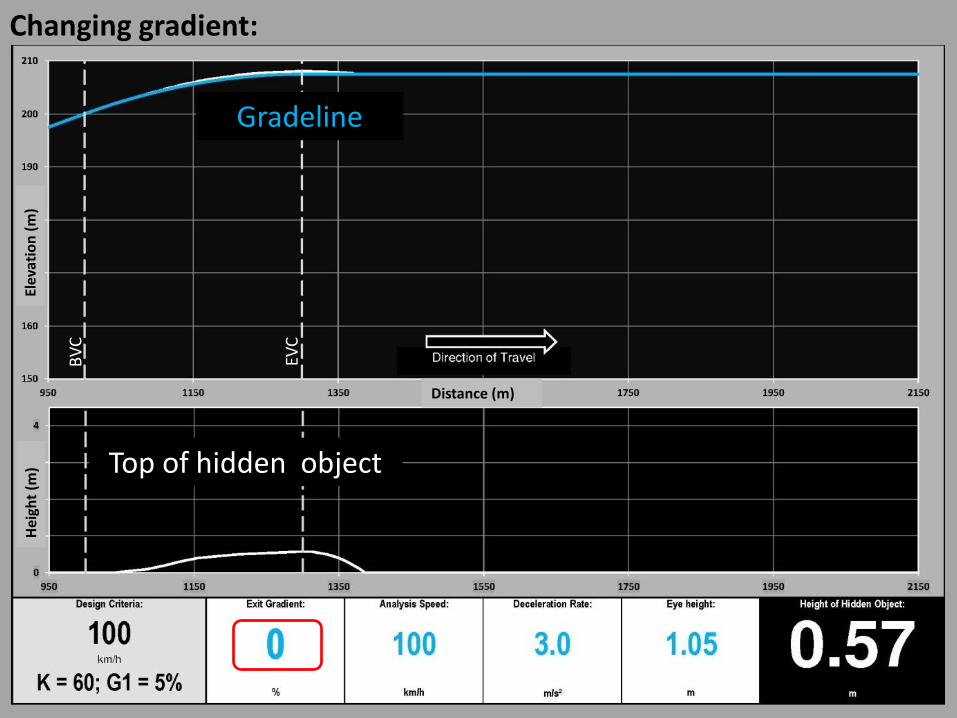
Changing gradient: El
evat
ion
(m
) H
eigh
t (m
)
Distance (m)
Top of hidden object
BV
C
EVC
Gradeline
Changing gradient: El
evat
ion
(m
) H
eigh
t (m
)
Distance (m)
BV
C
EVC
Gradeline
Top of hidden object
0,6m object hidden
Changing gradient: El
evat
ion
(m
) H
eigh
t (m
)
Distance (m)
BV
C
EVC
Gradeline
Top of hidden object
0,6m object hidden
Changing gradient: El
evat
ion
(m
) H
eigh
t (m
)
Distance (m)
BV
C
EVC
Gradeline
Top of hidden object
0,6m object hidden
Changing gradient: El
evat
ion
(m
) H
eigh
t (m
)
Distance (m)
BV
C
EVC
Gradeline
Top of hidden object
0,6m object hidden
Changing gradient: El
evat
ion
(m
) H
eigh
t (m
)
Distance (m)
BV
C
EVC
Gradeline
Top of hidden object
0,6m object hidden
Changing gradient: El
evat
ion
(m
) H
eigh
t (m
)
Distance (m)
BV
C
EVC
Gradeline
Top of hidden object
0,6m object hidden
1,3m object hidden
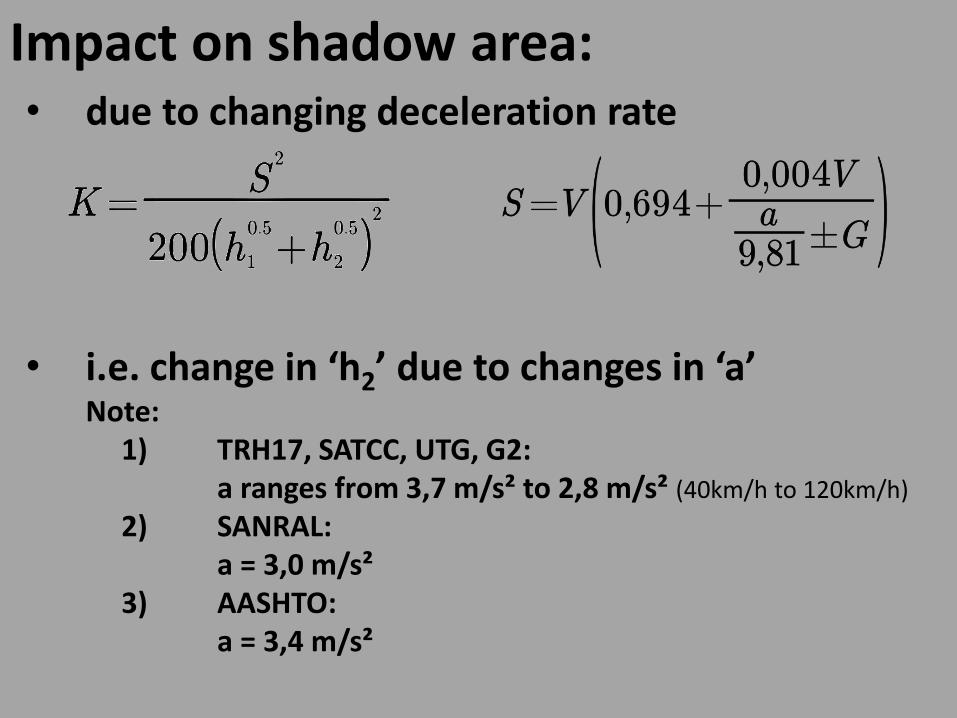
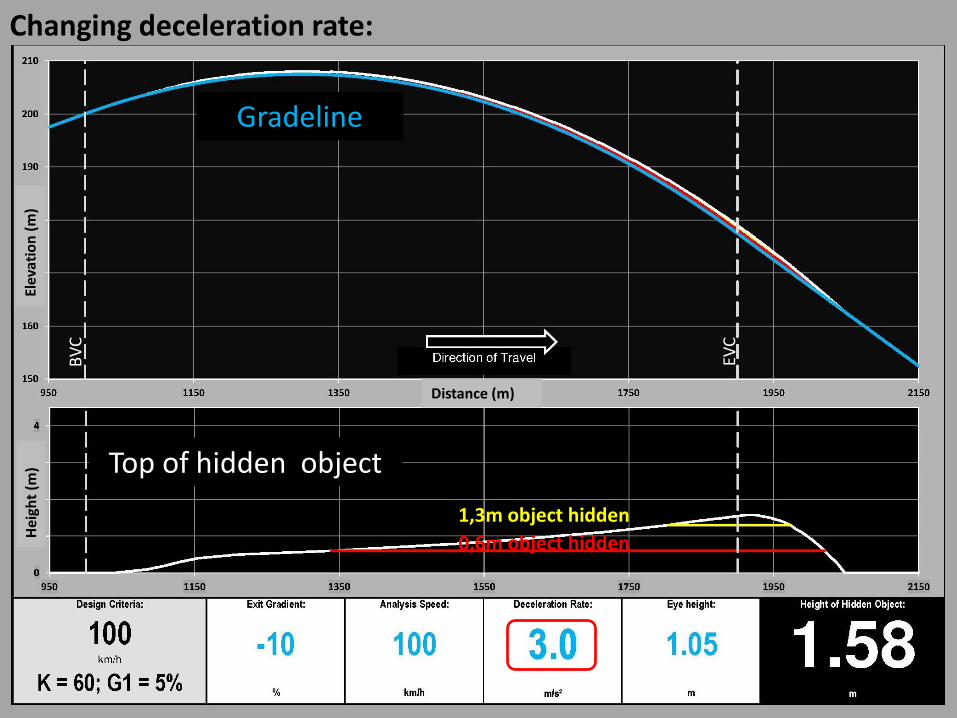
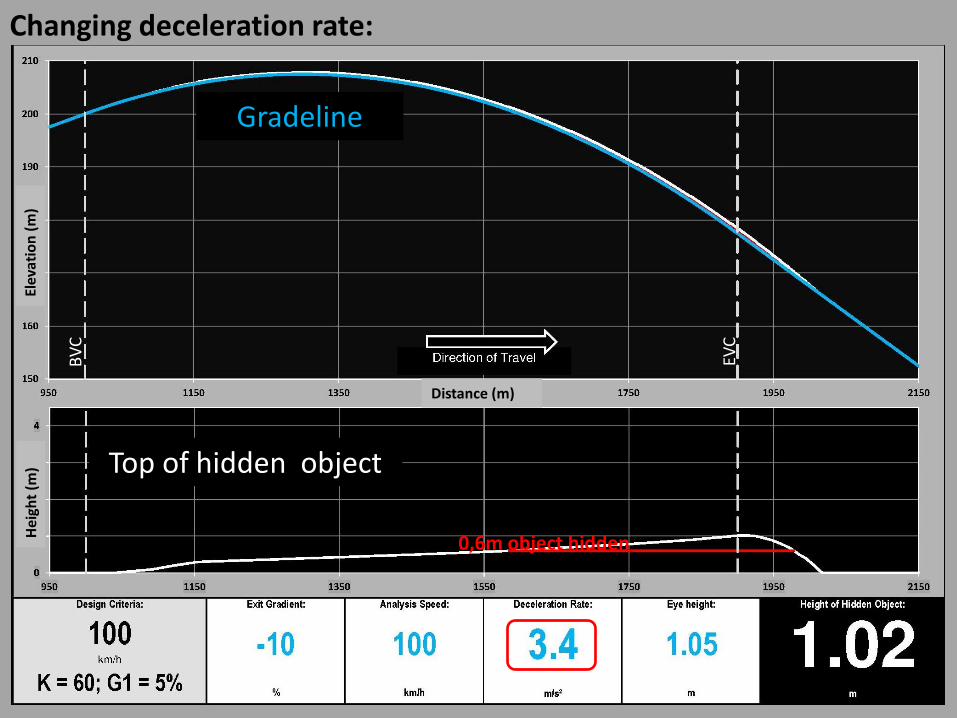
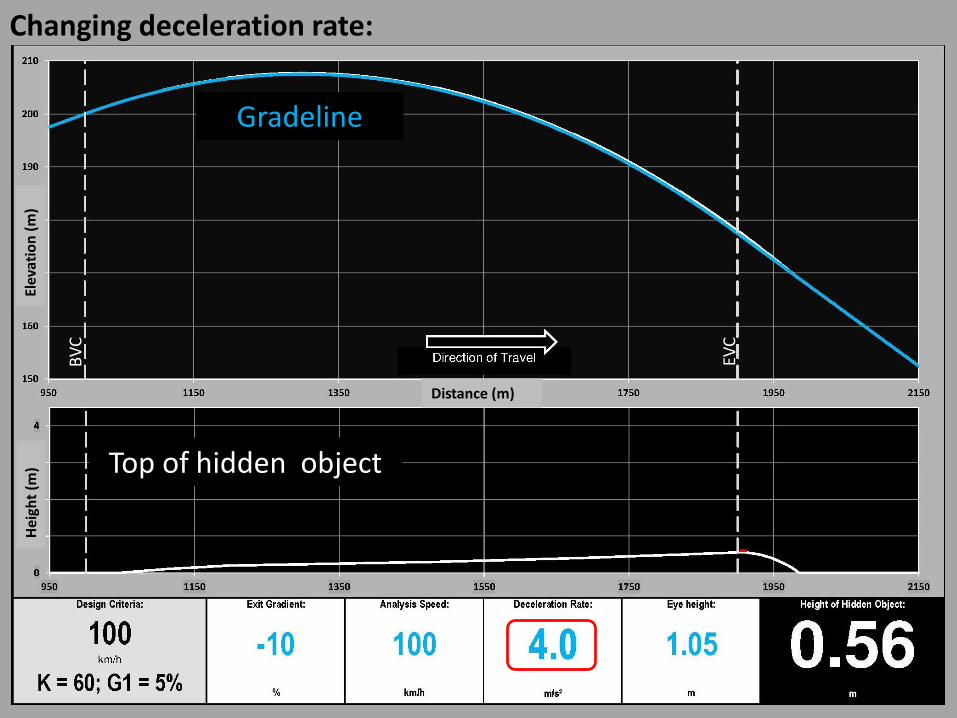
Impact on shadow area: • due to changing deceleration rate
• i.e. change in ‘h2’ due to changes in ‘a’ Note: 1) TRH17, SATCC, UTG, G2: a ranges from 3,7 m/s² to 2,8 m/s² (40km/h to 120km/h)
2) SANRAL: a = 3,0 m/s² 3) AASHTO:
a = 3,4 m/s²
Changing deceleration rate: El
evat
ion
(m
) H
eigh
t (m
)
Distance (m)
BV
C
EVC
Gradeline
Top of hidden object
1,3m object hidden
0,6m object hidden
Changing deceleration rate: El
evat
ion
(m
) H
eigh
t (m
)
Distance (m)
BV
C
EVC
Gradeline
Top of hidden object
0,6m object hidden
Changing deceleration rate: El
evat
ion
(m
) H
eigh
t (m
)
Distance (m)
BV
C
EVC
Gradeline
Top of hidden object
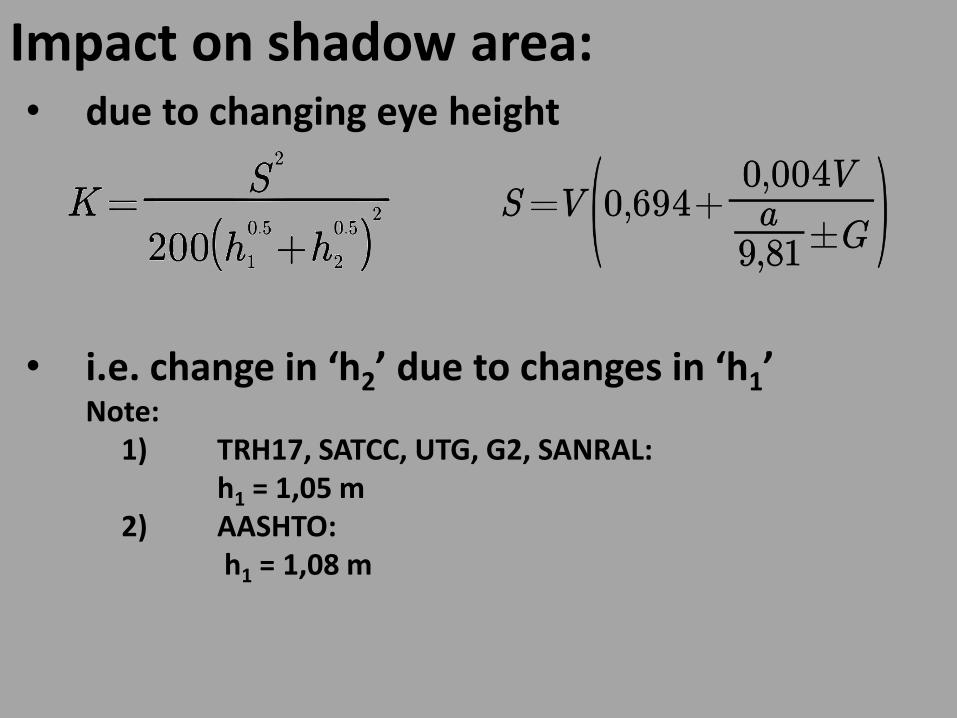
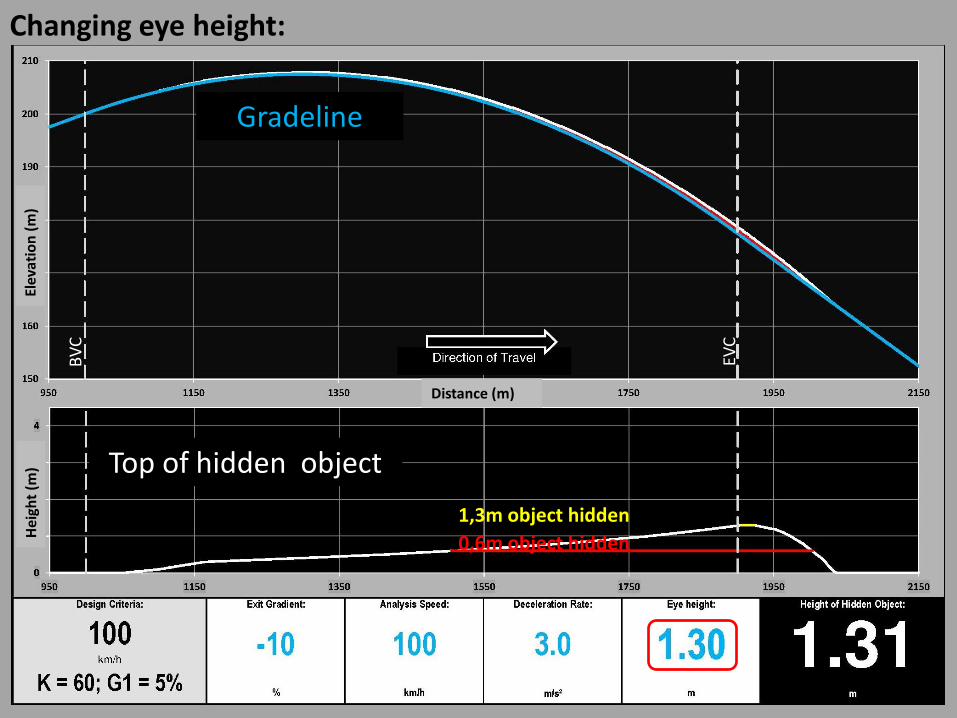
Impact on shadow area: • due to changing eye height
• i.e. change in ‘h2’ due to changes in ‘h1’ Note: 1) TRH17, SATCC, UTG, G2, SANRAL: h1 = 1,05 m 2) AASHTO:
h1 = 1,08 m
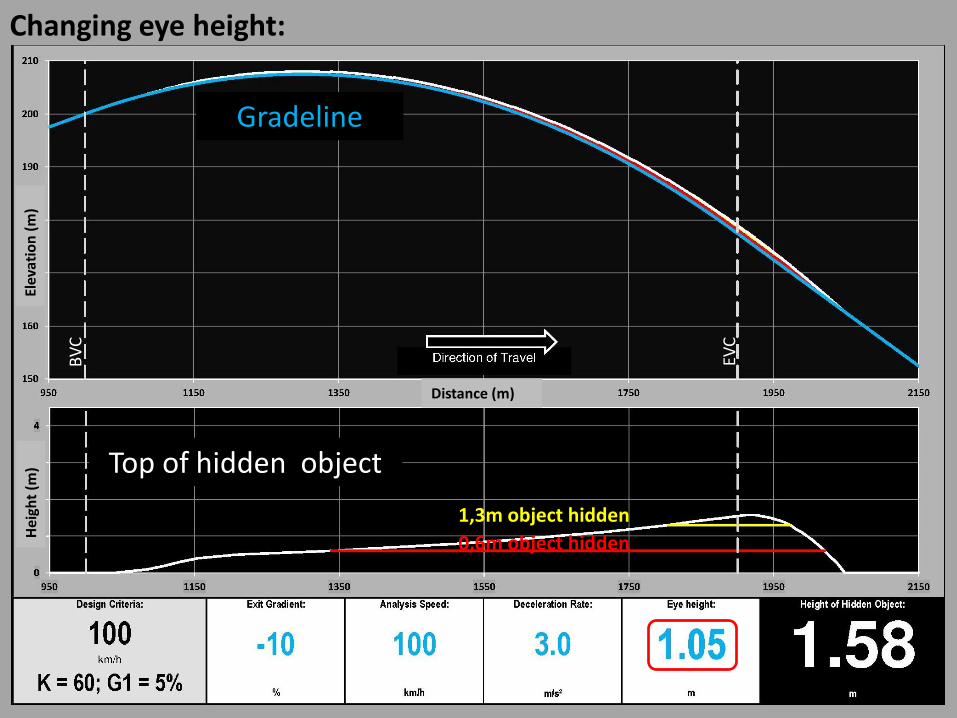
Changing eye height: El
evat
ion
(m
) H
eigh
t (m
)
Distance (m)
BV
C
EVC
Gradeline
Top of hidden object
1,3m object hidden
0,6m object hidden
Changing eye height: El
evat
ion
(m
) H
eigh
t (m
)
Distance (m)
BV
C
EVC
Gradeline
Top of hidden object
1,3m object hidden
0,6m object hidden
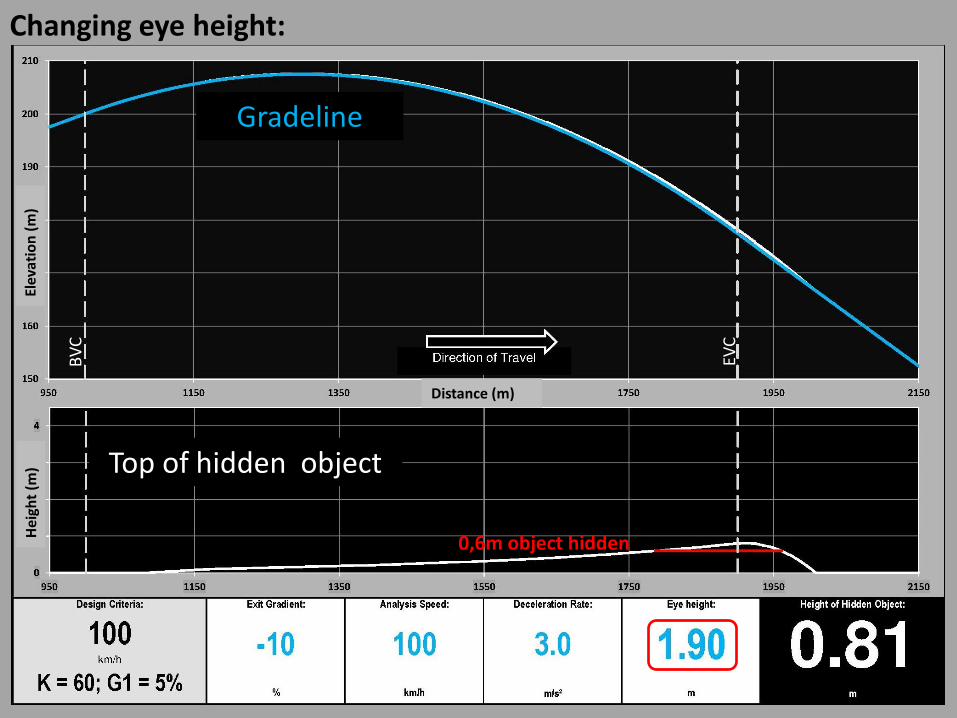
Changing eye height: El
evat
ion
(m
) H
eigh
t (m
)
Distance (m)
BV
C
EVC
Gradeline
Top of hidden object
0,6m object hidden
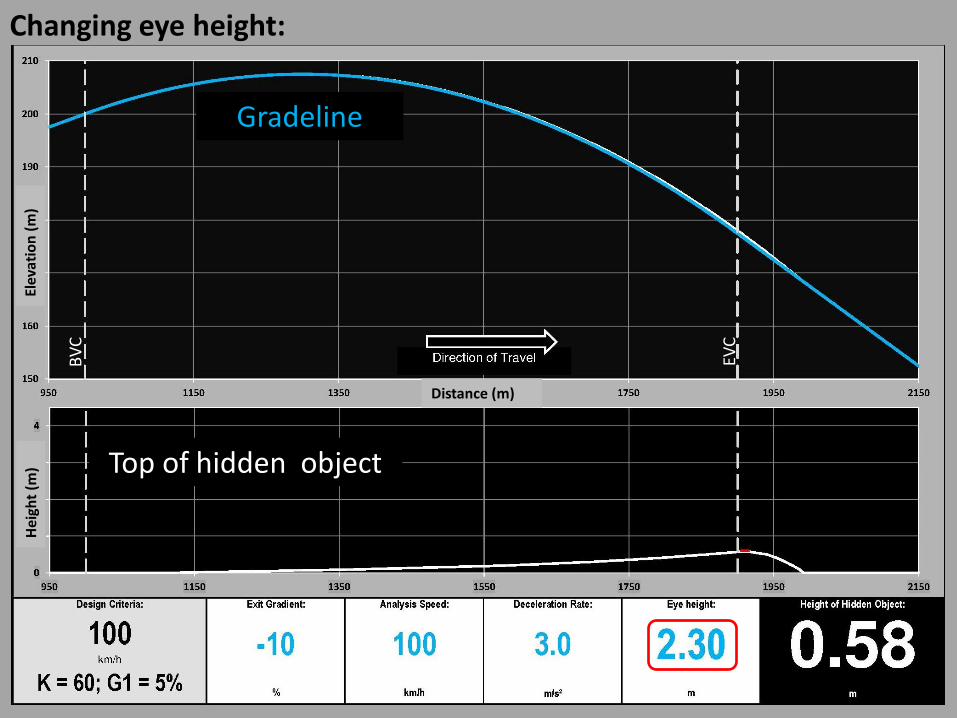
Changing eye height: El
evat
ion
(m
) H
eigh
t (m
)
Distance (m)
BV
C
EVC
Gradeline
Top of hidden object
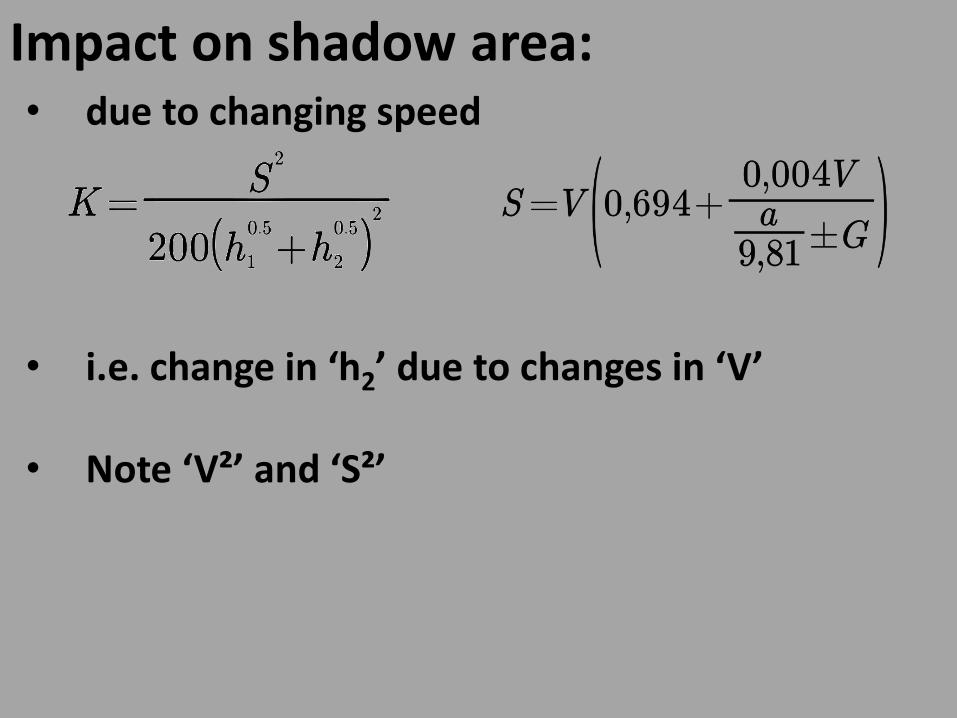
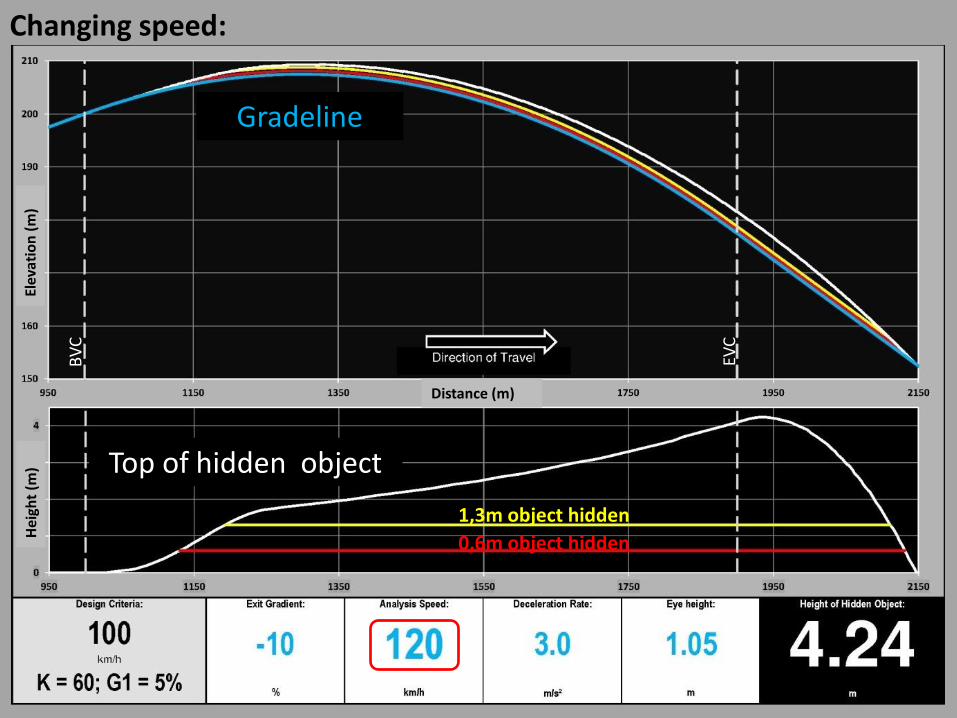
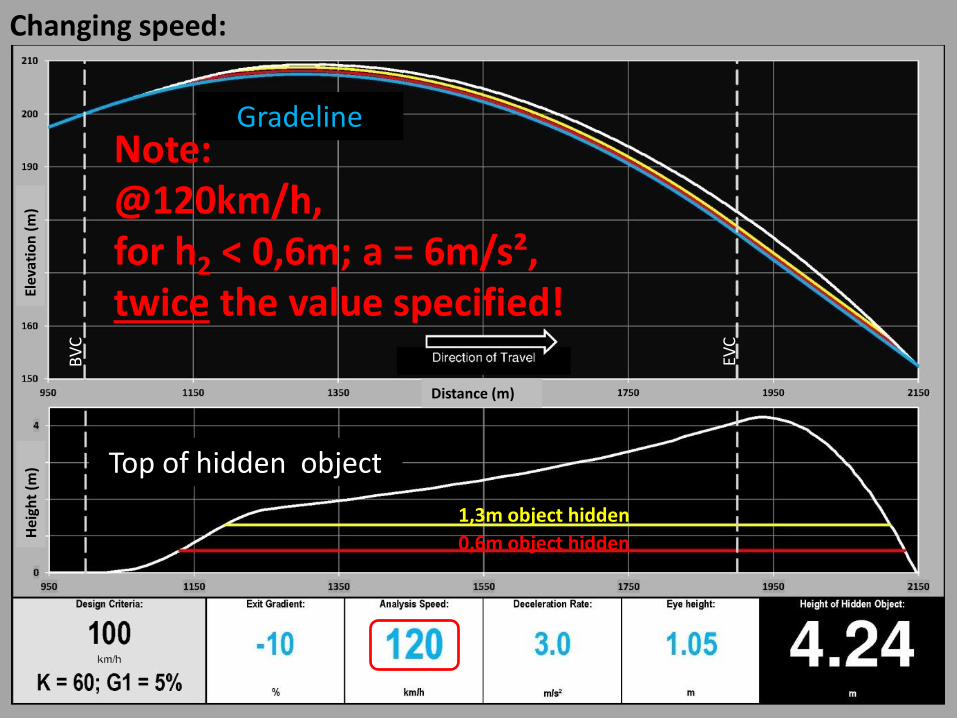
Impact on shadow area: • due to changing speed
• i.e. change in ‘h2’ due to changes in ‘V’
• Note ‘V²’ and ‘S²’
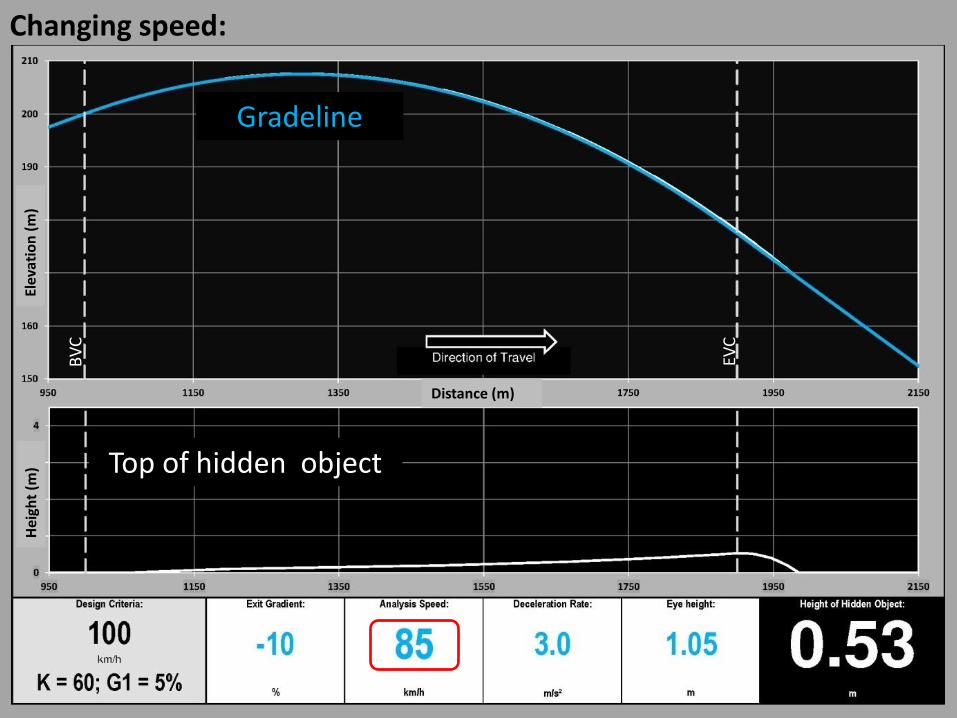
Changing speed: El
evat
ion
(m
) H
eigh
t (m
)
Distance (m)
BV
C
EVC
Gradeline
Top of hidden object
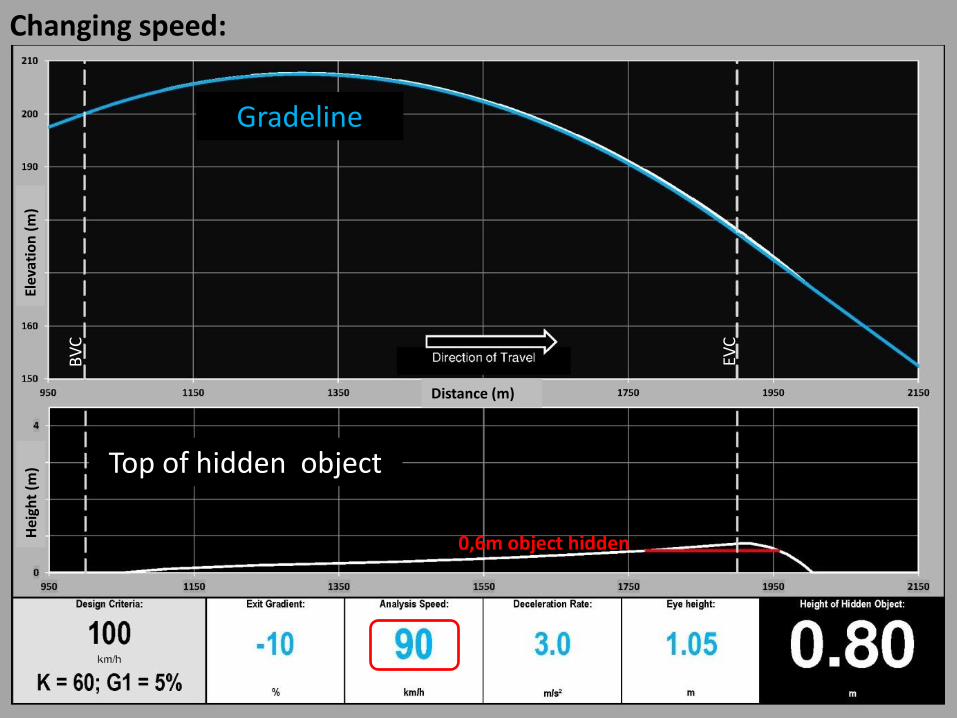
Changing speed: El
evat
ion
(m
) H
eigh
t (m
)
Distance (m)
BV
C
EVC
Gradeline
Top of hidden object
0,6m object hidden
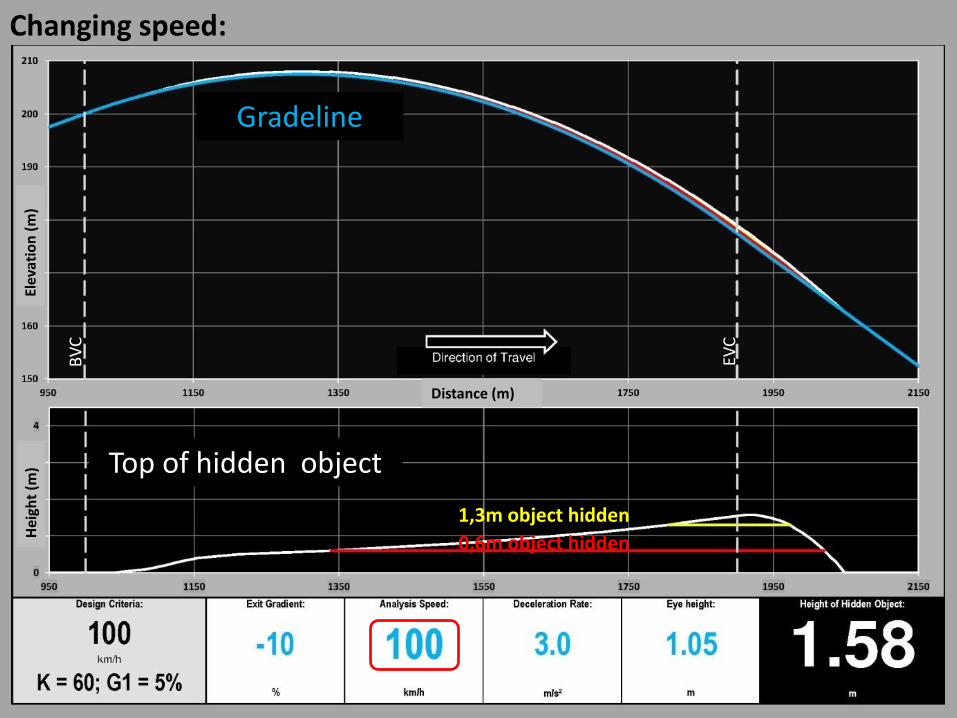
Changing speed: El
evat
ion
(m
) H
eigh
t (m
)
Distance (m)
BV
C
EVC
Gradeline
Top of hidden object
1,3m object hidden
0,6m object hidden
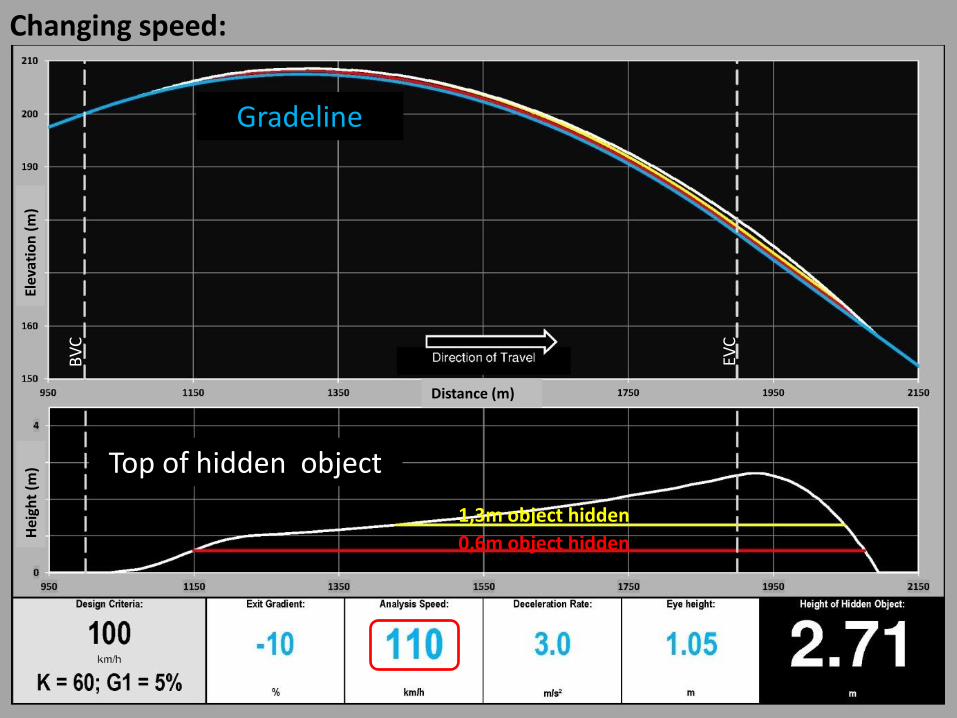
Changing speed: El
evat
ion
(m
) H
eigh
t (m
)
Distance (m)
BV
C
EVC
Gradeline
Top of hidden object
1,3m object hidden
0,6m object hidden
Changing speed: El
evat
ion
(m
) H
eigh
t (m
)
Distance (m)
Gradeline
BV
C
EVC
Top of hidden object
1,3m object hidden
0,6m object hidden
Changing speed: El
evat
ion
(m
) H
eigh
t (m
)
Distance (m)
Gradeline
BV
C
EVC
Top of hidden object
1,3m object hidden
0,6m object hidden
Note: @120km/h, for h2 < 0,6m; a = 6m/s², twice the value specified!
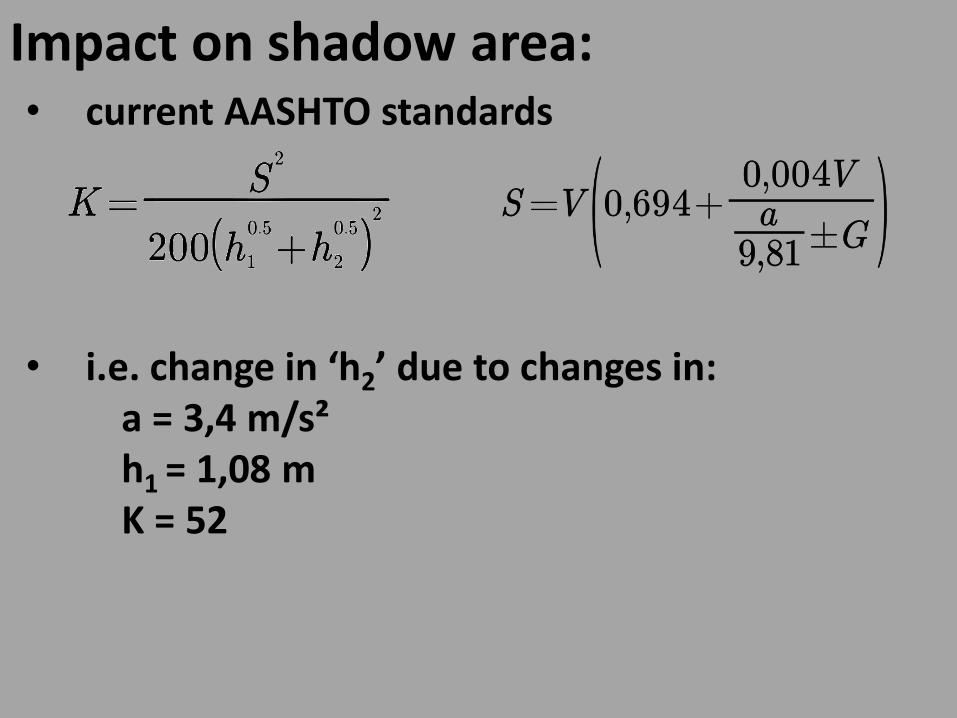
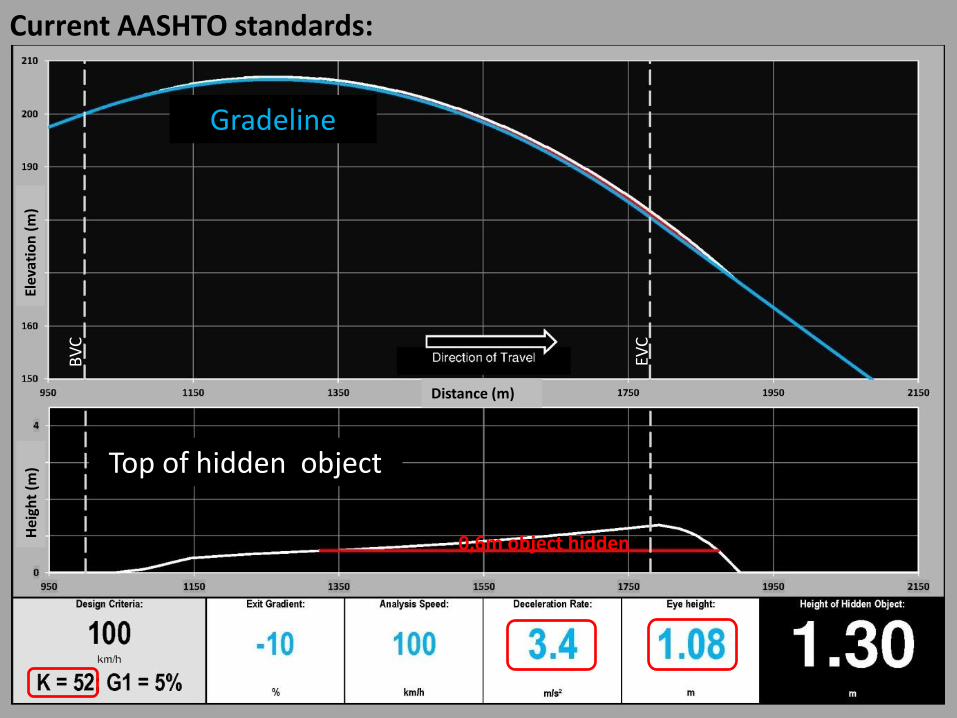
Impact on shadow area: • current AASHTO standards
• i.e. change in ‘h2’ due to changes in: a = 3,4 m/s² h1 = 1,08 m K = 52
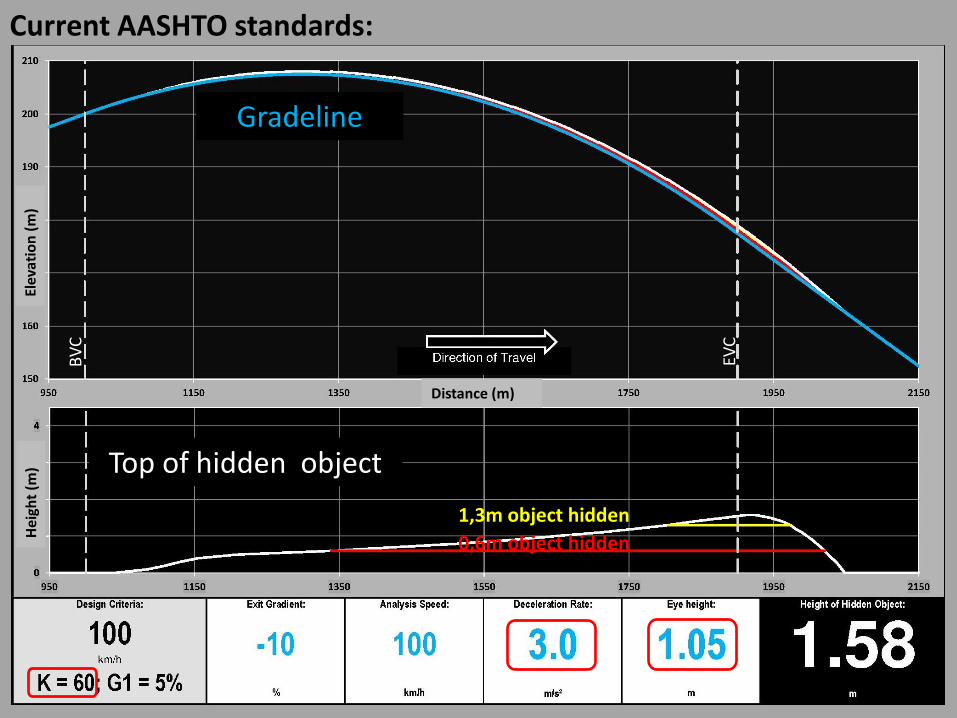
Current AASHTO standards: El
evat
ion
(m
) H
eigh
t (m
)
Distance (m)
BV
C
EVC
Gradeline
Top of hidden object
1,3m object hidden
0,6m object hidden
Current AASHTO standards: El
evat
ion
(m
) H
eigh
t (m
)
Distance (m)
BV
C
EVC
Gradeline
Top of hidden object
0,6m object hidden
Findings: • Minimum K values from the manuals apply to
exit gradients of 0%
• Heights and deceleration rates of vehicles have a significant impact on the visibility of object within the SSD
• Speed has a profound impact on the visibility of object within the SSD

References: • Committee of State Road Authorities. TRH17: Geometric Design
of Rural Roads. Department of Transport, Pretoria 1988.
• CSIR. Geometric Design Guidelines. South African National Roads Agency SOC Limited, Pretoria.
• American Association of State Highway and Transportation Officials. A policy on Geometric Design of Highways and Streets, 6th edition. Washington, 2011

Discussion