Geometallurgical characterisation of Merensky Reef and UG2 ...
160
Geometallurgical characterisation of Merensky Reef and UG2 at the Lonmin Marikana mine, Bushveld Complex, South Africa By Thomas Dzvinamurungu Dissertation Submitted in fulfillment of the requirements for the degree of Magister Scientiae in Geology in the Faculty of Science at the University of Johannesburg, South Africa Supervisor: Prof KS Viljoen Co-supervisor: M Knoper December 2012
Transcript of Geometallurgical characterisation of Merensky Reef and UG2 ...

Geometallurgical characterisation of Merensky Reef and UG2 at the Lonmin Marikana mine, Bushveld Complex, South Africa
By
Thomas Dzvinamurungu
Dissertation
Submitted in fulfillment of the requirements for the degree
of
Magister Scientiae
in
Geology
in the
Faculty of Science
at the
University of Johannesburg, South Africa
Supervisor: Prof KS Viljoen
Co-supervisor: M Knoper
December 2012
i
AFFIDAVIT: MASTER’S AND DOCTORAL STUDENTS
TO WHOM IT MAY CONCERN
This serves to confirm that I______________________________________________________ Full Name(s) and Surname
ID Number____________________________________________________________________
Student number__________________________________________________ enrolled for the
Qualification___________________________________________________________________
Faculty of Science______________________________________________________________
Herewith declare that my academic work is in line with the Plagiarism Policy of the University of Johannesburg which I am familiar.
I further declare that the work presented in the ___________________________________(minor dissertation/dissertation/thesis) is authentic and original unless clearly indicated otherwise and in such instances full reference to the source is acknowledged and I do not pretend to receive any credit for such acknowledged quotations, and that there is no copyright infringement in my work. I declare that no unethical research practices were used or material gained through dishonesty. I understand that plagiarism is a serious offence and that should I contravene the Plagiarism Policy notwithstanding signing this affidavit, I may be found guilty of a serious criminal offence (perjury) that would amongst other consequences compel the UJ to inform all other tertiary institutions of the offence and to issue a corresponding certificate of reprehensible academic conduct to whomever request such a certificate from the institution.
Signed at Johannesburg_____________on this _______ of ___________2013
Signature__________________________________ Print name_________________________
STAMP COMMISSIONER OF OATHS
Affidavit certified by a Commissioner of Oaths
THIS AFFIDAVIT CONFORMS WITH THE REQUIREMENTS OF THE JUSTICES OF THE PEACE AND COMMISSIONERS OF OATHS
ACT 16 OF 1963 AND THE APPLICABLE REGULATIONS PUBLISHED IN THE GG GNR 1258 OF 21 JULY 1972; GN 903 OF 10 JULY
1998; GN 109 OF 2 FEBRUARY 2001 AS AMENDED.
Thomas Dzvinamurungu
47-088130Z-47/ Passport Number: BN649386
201132994
Magister Scientiae
at the University of Johannesburg
MSc Geology
April 11th Day (UJ APK )
Thomas Dzvinamurungu
ii
TABLE OF CONTENTS TABLE OF CONTENTS .............................................................................................................. i
LIST OF FIGURES ...................................................................................................................... v
LIST OF TABLES ..................................................................................................................... viii
TERMINOLOGY ......................................................................................................................... x
ACKNOWLEDGEMENTS ....................................................................................................... xii
ABSTRACT ................................................................................................................................ xiii
Chapter 1: INTRODUCTION ..................................................................................................... 1
1.0 Introduction .................................................................................................................... 1
1.1 geographical setting, local geology and history ........................................................... 1
1.1.1 Regional Geological setting: introduction ....................................................................................... 4
1.1.2 Regional geological setting .............................................................................................................................. 4
1.1.3 The Merensky Reef ............................................................................................................................................ 7
1.1.4 The UG2 Reef ....................................................................................................................................................... 8
1.1.5 The Platreef ........................................................................................................................................................... 9
CHAPTER 2: AIMS OF THE PRESENT STUDY ................................................................. 11
2.0 Present study ...................................................................................................................... 11
2.1 Previous work and studies ................................................................................................ 11
2.2 Motivation for current study ............................................................................................ 15
2.3 Geometallurgy and geometallurgical assessments ......................................................... 17
CHAPTER 3: SAMPLES COLLECTED, AND SAMPLE MINERALOGY AND GEOCHEMISTRY ..................................................................................................................... 19
3.0 Introduction .................................................................................................................. 19
3.1 samples collected and samples descriptions .................................................................... 19
3.2 Samples mineralogy and mineral modal abundances .................................................... 22
3.2 Mineralogical variation with depth ................................................................................. 23
3.3 Samples geochemistry ....................................................................................................... 29

iii
CHAPTER 4: SAMPLE MILLING, AND ELEMENT DEPORTMENT ............................ 34
4.0 Introduction ....................................................................................................................... 34
4.1 Milling tests ........................................................................................................................ 34
4.2 Grading analysis ................................................................................................................ 38
4.3 Element deportment .......................................................................................................... 39
CHAPTER 5: FLOTATION TESTS ........................................................................................ 44
5.0 Introduction ....................................................................................................................... 44
5.1 Flotation performances ..................................................................................................... 44
5.2 Modal mineralogy of feeds and timed concentrates ....................................................... 46
5.3 Particle and sulphides grain size distribution ................................................................. 49
5.4 Sulphides liberation analyses in feeds ............................................................................. 52
5.5 Comparison of sulphides liberation in ore feeds and concentrates .............................. 54
5.6 Mineral association and locking....................................................................................... 58
5.7 Flotation Recovery Efficiency Analyses .......................................................................... 62
5.8 Flotation Performance analyses ....................................................................................... 66
5.9 Grade and recovery analyses ........................................................................................... 70
CHAPTER 6: DISCUSSIONS ................................................................................................... 72
6.1 Introduction ....................................................................................................................... 72
6.2.1 Mineralogy .......................................................................................................................................................... 72
6.2.2 Geochemistry ..................................................................................................................................................... 72
6.2.3 Milling .................................................................................................................................................................. 73
6.2.4 Grading analysis .............................................................................................................................................. 75
6.2.5 Elemental deportment ................................................................................................................................... 75
6.2.6 Mass pulls and mineralogy .......................................................................................................................... 76
6.2.7 Mineralogy of feeds and concentrates..................................................................................................... 76

iv
6.2.8 Particle size and sulphide grain size distributions ............................................................................. 77
6.2.9 Sulphide liberation in feeds ......................................................................................................................... 77
6.2.10 Comparison of sulphides liberation in feed and concentrates ................................................... 77
6.2.11 Mineral association and locking ............................................................................................................. 78
6.2.12 Flotation recovery efficiency .................................................................................................................... 78
6.2.13 Grade and recovery analyses ................................................................................................................... 79
CHAPTER 7: CONCLUSIONS AND RECOMMENDATIONS .......................................... 80
REFERENCES ............................................................................................................................ 82
APPENDIX 1: METHODS ........................................................................................................ 94
A1.0 Introduction .................................................................................................................... 94
A1.1 Channel Sampling .......................................................................................................... 94
A1.2 Crushing .......................................................................................................................... 95
A1.3 Representative sample splitting .................................................................................... 95
A1.4 Grain mounts preparation ............................................................................................. 95
A1.5 CARBON COATING..................................................................................................... 96
A1.6 Milling.............................................................................................................................. 96
A1.7 Mineral liberation analysis ............................................................................................ 98
A1.8 Flotation procedure ........................................................................................................ 98
A1.9 Chemical analysis ......................................................................................................... 100
APPENDIX 2: MINERALOGICAL DATA ........................................................................... 103
APPENDIX 3: GEOCHEMICAL ANALYSES ..................................................................... 107
APPENDIX 4: MILLING TESTS, ELEMENT DEPORTMENT AND FLOTATION DATA ......................................................................................................................................... 111
APPENDIX 5: DETAILS OF CALCULATIONS PERFORMED FOR DATA REDUCTION ............................................................................................................................ 128
CORRECTIONS BASED ON REVIEWERS COMMENTS. .............................................. 134

v
LIST OF FIGURES
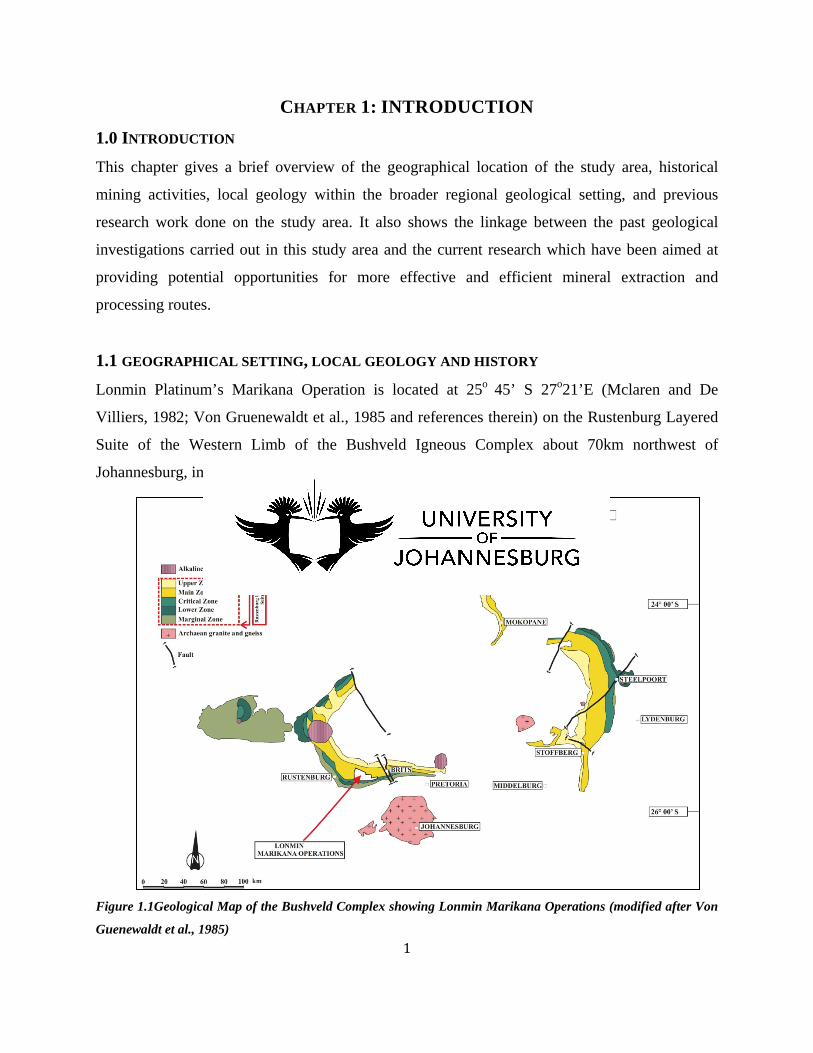
Figure 1.1Geological Map of the Bushveld Complex showing Lonmin Marikana Operations (modified after Von Guenewaldt et al., 1985) ...................................................................................................................................... 1
Figure 1.2 Property Boundaries of Lonmin Platinum Marikana Operations (Adapted from Cawthorn, 1999b; Davey, 1992) ................................................................................................................................................................ 2
Figure 1.3 Regional Geological Map of the Bushveld Complex - Different Lithological Units and Limbs of theBushveld Complex .......................................................................................................................................................... 6
Figure 2.1 Facies Types and PGE Distribution for different Merensky Reef facies. The red bars indicate the abundance and distribution of PGE across the facies (Adapted from Lonmin Group, 2006) ................. 13
Figure 2.2 Vertical distribution of Cu, Ni and PGE in the UG2 Layer (Adapted from Lonmin Group, 2006) ............................................................................................................................................................................................ 16
Figure 3.1 Geological Logs Showing Lithological Variations across the BK (BK), RPM (RPM), WP(WP) facies and UG2 Chromitite reef .......................................................................................................................................... 21
Figure 3.2 Modal abundances (wt.%) distribution of sulphide minerals with depth for 10cm intervals of channel sample of the BK facies of Merensky Reef. Abundant sulphides correlate positively with the position of chromitite stringers. Refer to Figure 3.1 for legend of lithologies shown in this figure ............. 25
Figure 3.3 Modal abundances (wt.%) distribution of sulphide minerals with depth for 10cm intervals of channel sample of the RPM facies of Merensky Reef. Abundant sulphides correlate positively with the position of chromitite stringers. Refer to Figure 3.1 for legend of lithologies shown in this figure ............. 26
Figure 3.4 Modal abundances (wt.%) distribution of sulphide minerals with depth for 10cm intervals of channel sample of the WPfacies of Merensky Reef. Abundant sulphides correlate positively with the position of chromitite stringers. Refer to Figure 3.1 for legend of lithologies shown in this figure ............. 27
Figure 3.5 Modal abundances (wt.%) distribution of sulphide minerals with depth for 10cm intervals of channel sample of the UG2 chromitite facies reef. Refer to Figure 3.1 for legend of lithologies shown in this figure ................................................................................................................................................................................... 28
Figure 3.6 Distribution of Cr, S (wt.%), Pd, Pt and 6PGE (ppm) with depth for individual 10cm intervals of a channel sample of the BK facies of Merensky Reef. Abundant Cr, S, and PGE correlate with the position of chromitite stringers. Refer to Figure 3.1 for legend of lithologies shown in this figure ............. 30
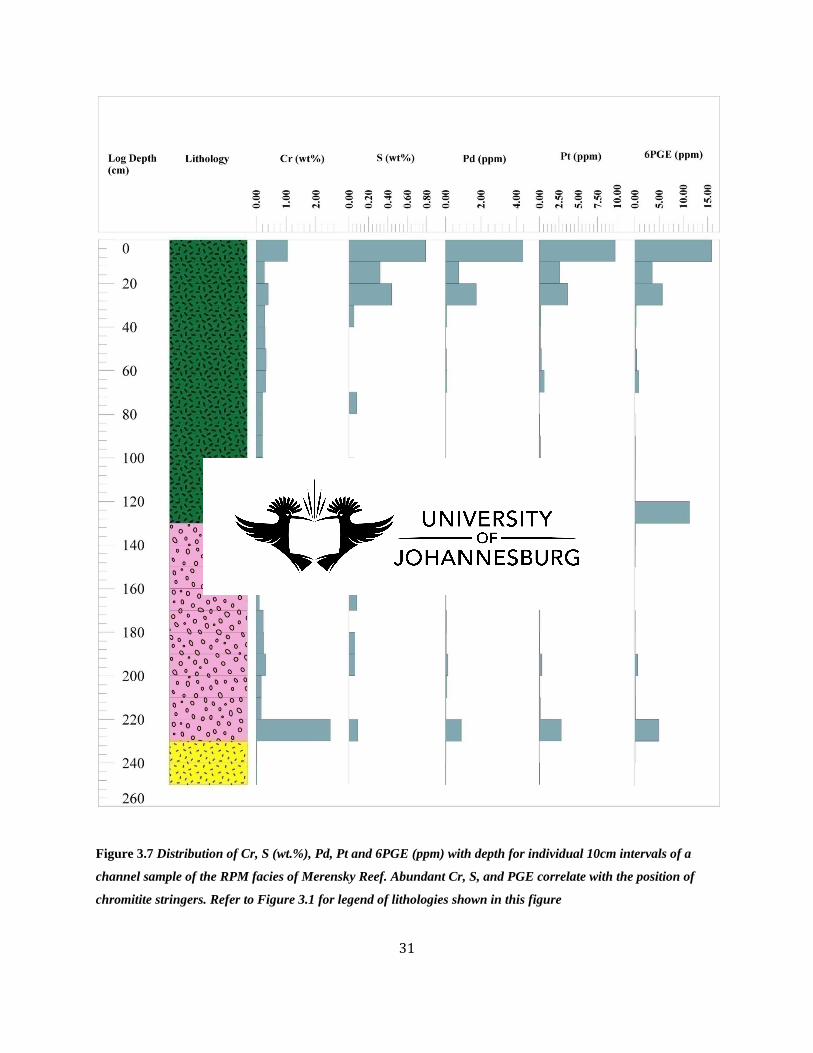
Figure 3.7 Distribution of Cr, S (wt.%), Pd, Pt and 6PGE (ppm) with depth for individual 10cm intervals of a channel sample of the RPM facies of Merensky Reef. Abundant Cr, S, and PGE correlate with the position of chromitite stringers. Refer to Figure 3.1 for legend of lithologies shown in this figure ............. 31

vi
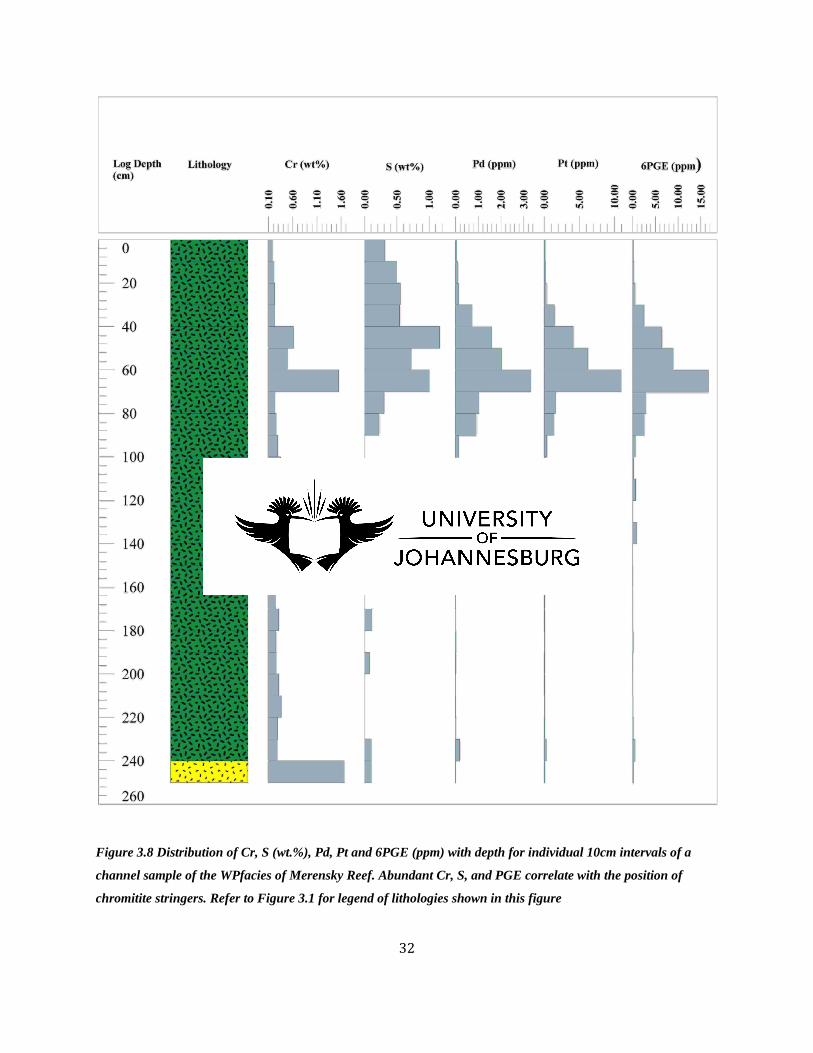
Figure 3.8 Distribution of Cr, S (wt.%), Pd, Pt and 6PGE (ppm) with depth for individual 10cm intervals of a channel sample of the WPfacies of Merensky Reef. Abundant Cr, S, and PGE correlate with the position of chromitite stringers. Refer to Figure 3.1 for legend of lithologies shown in this figure ............. 32
Figure 3.9 Distribution of Cr, S (wt.%), Pd, Pt and 6PGE (ppm) with depth for individual 10cm intervals of a channel sample of the UG2 Chromitite facies Reef. Refer to Figure 3.1 for legend of lithologies shown in this figure ................................................................................................................................................................. 33
Figure 4.1 Milling time against mass % passing 75µm sieve for BK sample ...................................................... 34
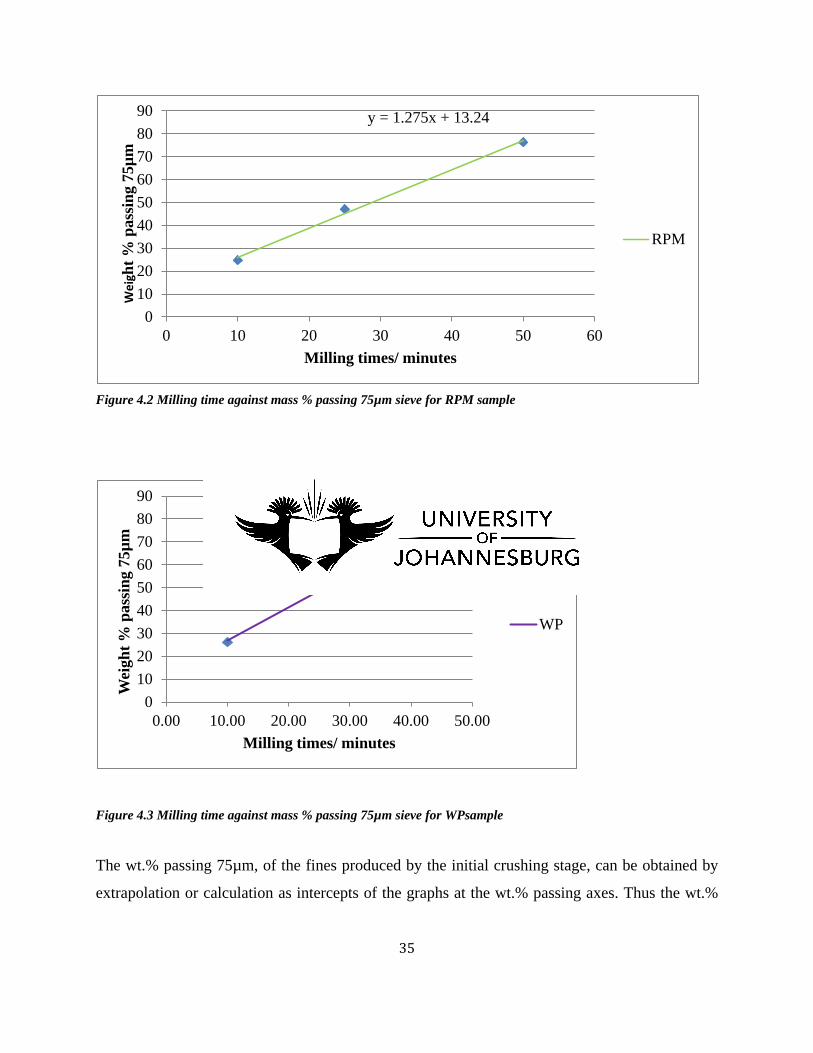
Figure 4.2 Milling time against mass % passing 75µm sieve for RPM sample .................................................. 35
Figure 4.3 Milling time against mass % passing 75µm sieve for WPsample ...................................................... 35
Figure 4.4 Milling time against mass % passing 75µm sieve for UG2 sample ................................................... 36
Figure 4.5 Comparison of milling times for the BK, RPM, WPand UG2 facies ................................................. 37
Figure 4.6 Cumulative particle size distributions after crushing and milling for BK, RPM, WPand UG2 38
Figure 4.7 Copper upgrade-downgrade curves for milled ore ................................................................................. 39
Figure 4.8 Nickel upgrade-downgrade curves for milled ore ................................................................................... 40
Figure 4.9 Sulfur upgrade-downgrade curves for milled ore .................................................................................... 41
Figure 4.10 Palladium upgrade-downgrade curves for milled ore. In UG2, -25µm was not analysed due to insufficient sample sizes ................................................................................................................................................... 42
Figure 4.11 Platinum upgrade-downgrade curves for milled ores ......................................................................... 43
Figure 5.1 Summary of time-cumulative mass pull ...................................................................................................... 45
Figure 5.2 Mineral modal abundances (weight%) in BK, RPM, WPand UG2 feed and concentrates ........ 47
Figure 5.3 Comparative mineral modal abundances (weight%) in BK, RPM, WPand UG2 concentrates 48
Figure 5.4 Cumulative particle size distribution for the BK, RPM, WPand UG2 facies milled feeds, -75+38µm fraction (as equivalent circle diameters) in microns ............................................................................... 50
Figure 5.5 Cumulative sulphides grain sizes distribution for the BK, RPM, WPand UG2 facies milled feeds, (as equivalent circle diameters) in microns ........................................................................................................ 51
Figure 5.6 Cumulative liberation yields for sulphides in the milled samples prior to flotation .................... 53
vii
Figure 5.7 Cumulative liberation yields for sulphides in BKFeed, BKConc1, BKConc2, BKConc3 and BKConc4 .................................................................................................................................................................................... 54
Figure 5.8 Cumulative liberation yield for sulphides in RPMFeed, RPMConc1, RPMConc2, RPMConc3 and RPMConc4 ........................................................................................................................................................................ 55
Figure 5.9 Cumulative liberation yield for sulphides in WPFeed, WPConc1, WPConc2, WPConc3 and WPConc4 ................................................................................................................................................................................... 56
Figure 5.10 Cumulative liberation yields for sulphides in UG2Feed, UG2Conc1, UG2Conc2, UG2Conc3 and UG2Conc4......................................................................................................................................................................... 57
Figure 5.11 Comparative mineral recoveries as liberated, binary and ternary composite mineral particles for BKFeed, RPMFeed, WPFeed and UG2Feed ........................................................................................................... 60
Figure 5.12a-d: MLA based SPLGXMAP Chalcopyrite+Pentlandite+Pyrrhotite wt.% locked in binary particles in feed ........................................................................................................................................................................ 61
Figure 5.13a-d: MLA based SPLGXMAP Chalcopyrite+Pentlandite+Pyrrhotite wt.% locked in ternary particles in feed ........................................................................................................................................................................ 62
Figure 5.14a-c: Cumulative flotation recovery of copper, nickel and sulfur as function of flotation time for BK, RPM, WPand UG2 facies ...................................................................................................................................... 67
Figure 5.15a-c: Cumulative grade of Cu, Ni and S in the flotation concentrate as a function of cumulative mass pull percent ..................................................................................................................................................................... 69
Figure 5.16a-c: Cu, Ni, and S grades as function of recovery curves for BK, RPM, WPand UG2 facies . 71

viii
LIST OF TABLES
Table 3.1 Modal mineralogy (area %) of samples ........................................................................................................ 22
Table 4.1 Summary of milling times (minutes) required to attain a grind of 60% mass passing 75µm sieve for BK, RPM, WPand UG2 facies ...................................................................................................................................... 37
Table 5.1 Cumulative mass pull rate tests results (g) .................................................................................................. 44
Table 5.2 Average water recovery (g) per facies type ................................................................................................. 45
Table 5.3 Flotation efficiency percentages (wt.%) of PGE for BK, RPM, WPand UG2 facies based on feed and tails weights and assays ....................................................................................................................................... 64
Table 5.4 Flotation efficiency percentages (wt.%) of base metals and sulfur for BK, RPM, WPand UG2 facies based on feed and concentrate weights and assays ......................................................................................... 65
Table 6. 1 Milling times variation with mineralogy in BK, RPM, WP facies and UG2………….74
Table A1.1 Reagent suite addition and conditioning used in the flotation rate tests ......................................... 99
Table A1.2 Analytical detection limits used for assays in this study .................................................................... 102
Table A2.1 Mineral modal abundance (wt.%) variations of samples of the BK facies of the Merensky reef (-2mm crushed ore sample) (from top to bottom) ...................................................................................................... 103
Table A2.2 Mineral modal abundances (wt.%) variations of samples of the RPM facies of the Merensky reef (-2mm crushed ore sample) (from top to bottom) .............................................................................................. 104
Table A2.3 Mineral modal abundances (wt-%) variations of samples of the WPfacies of the Merensky reef (-2mm crushed ore sample) (from top to bottom) ...................................................................................................... 105
Table A2.4 Mineral modal abundances (wt-%) variations of samples of the UG2 Chromitite facies (-2mm crushed ore sample) (from top to bottom) .................................................................................................................... 106
Table A3.1 Distribution of Cr, (ppm), S (wt.%), and 6PGE (ppb) in the BK facies of Merensky Reef; abundant Cr, S, and PGE correlate with the position of chromitite stringers (-2mm crushed ore sample) (from top to bottom) ............................................................................................................................................................. 107
ix
Table A3.2 Distribution of Cr, (ppm), S (wt.%), and 6PGE (ppb) in the RPM facies of the Merensky Reef (-2mm crushed ore sample) (from top to bottom) ...................................................................................................... 108
Table A3.3 Distribution of Cr (ppm), S (wt.%), and 6PGE (ppb) in the WP facies of Merensky Reef; abundant Cr, S, PGE correlate with the position of chromitite (from top to bottom) .................................... 109
Table A3.4 Distribution of Cr, S (wt.%), Pd, Pt and 6PGE (ppm) in the UG2 Chromitite Reef (from top to bottom) ..................................................................................................................................................................................... 110
Table A4.1 Mass % passing 75µm for BK, RPM, WP, and UG2 facies ore samples ..................................... 111
Table A4.2 Grading Analysis results for BK, RPM, WPand UG2 ore facies .................................................... 112
Table A4.3 Assay results of ore feeds sized fractions ............................................................................................... 113
Table A4.4 Assay of Cu, Ni, S, Pd and Pt in BK, RPM, WPand UG2 ore feed sized fractions ................... 114
Table A4.5 Copper deportment results in BK, RPM, WPand UG2 ore milled feeds ...................................... 115
Table A4.6 Nickel deportment results in BK, RPM, WPand UG2 ore milled feeds ........................................ 116
Table A4.7 Sulfur deportment results in BK, RPM, WPand UG2 ore milled feeds ......................................... 117
Table A4.8 Palladium deportment results in BK, RPM, WPand UG2 ore milled feeds ................................ 118
Table A4.9 Platinum deportment results in BK, RPM, WPand UG2 ore milled feeds ................................... 119
Table A4.10 Mass pull (g) and water recovery (g) variation with time for BK, RPM, WPand UG2 samples (in duplicate) .......................................................................................................................................................................... 120
Table A4.11 Mineral modal abundances of feed and concentrates ...................................................................... 123
Table A4.12 SPLGXMAP Chalc+Pent+Pyrr Wt.% locking in BK, RPM, WPand UG2 feeds .................... 125
Table A4.13 Assay results of ore feeds, concentrates and tailings for BK, RPM, WPand UG2 facies ..... 126
Table A4.14 Flotation performance analyses of BK, RPM, WPand UG2 ore facies ...................................... 127
Table A5.1 Grading analysis of sample of the BK facies type of Merensky Reef ............................................. 128
Table A5.2 Deportment analysis for Pd in sieved mass fractions of samples of the BK facies type of Merensky Reef ....................................................................................................................................................................... 129
Table A5.3 Flotation recovery efficiency values from calculation examples .................................................... 131
Table A5.4 Mass pulls, grades, and recoveries in a sample of the BK facies type of Merensky Reef ....... 132

x
TERMINOLOGY
Reef facies: An ore type or group of ore types having a unique set of textural and compositional
properties from which their metallurgical performance can be predicted.
Platinum group minerals: Naturally occurring chemical compounds of the platinum group
elements, namely platinum, palladium, rhodium, ruthenium, iridium and osmium.
Modal abundance: Percentages of the mineral components of an ore or rock sample.
Grade: Elemental content of an ore, expressed in grams per tonne (g/t), percentage (%), parts per
million (ppm) or parts per billion (ppb) of ore.
Comminution: Reduction of particle sizes of ore to separate the valuable mineral constituents
from the gangue. Comminution involves crushing and milling.
Deportment: Preferential reporting of minerals or elements into a specific grind size fraction of
a milled ore.
Upgrade: Preferential reporting of a mineral or element into a specific grind size fraction of a
milled ore, thereby raising its grade/content in that grind size fraction.
Downgrade: Non-preferential reporting of a mineral or element into a specific grind size
fraction of a milled ore, thereby resulting in low grade of that particular mineral or element in
that grind size fraction.
Mineral liberation: Separation or unlocking of a valuable mineral from gangue, for example by
comminution.
xi
Liberation by free surface: The degree to which a mineral in a particle is exposed at the surface
of that particle.
Froth flotation: Process of separating valuable mineral constituents from gangue and
transferring them into a froth. Flotation is achieved by treating ore slurry with chemical reagents
to make them hydrophobic, followed by bubbling air at a controlled rate.
Mass pull: Amount of each concentrate collected during flotation.
Cumulative mass pull: Concentrate collected over specific time intervals.
Assay: Content of marketable end product in the ore.
Recovery: Percentage of the total element or mineral contained in the ore that is recovered in the
concentrate.
Liberated mineral: Mineral of interest that is considered to be completely unattached (100%
ore mineral) or containing a minor proportion of gangue.
Middlings: Particles composed of at least 50% of mineral interest and the rest gangue.
Locked mineral: Mineral of interest completely or almost completely enclosed in gangue
minerals.
Tailings: Residual material left after recoverying valuable minerals from the milled ore slurry by
flotation or other processes.
Mineral locking: Interpenetration of mineral surfaces into one another, such that comminution is
needed to separate them.
Brakspruit (BK), Rustenburg Platinum Mine (RPM) and Western Platinum Mine (WP) are
facies type names of the Merensky reef at Lonmin Marikana mine.
xii
ACKNOWLEDGEMENTS
I would like to express my sincere gratitude to the following parties for their valuable
contributions to this thesis:
• My supervisor Prof KS Viljoen and co-supervisor, MW Knoper, for motivating,
moulding and guiding me throughout the course of the research by positively criticizing
my work. Thank you for your patience and the freedom you afforded me to explore my
potential. I would also like to thank the Science Faculty of the University of
Johannesburg for allowing me to undertake this study and the Geology Department staff,
the Palaeo-Proterozoic Mineralisation Research Group (PPM) and colleagues for their
important advice and positive criticisms.
• This project could not have been possible without a research grant from the National
Research Foundation and Department of Science and Technology, Geometallurgy Chair
grant to Prof KS Viljoen.
• Many thanks go to Derek Rose from whom I benefited from many critical discussions on
this research and for his assistance during milling and flotation exercises at Dornfontein
Campus, Extractive Metallurgy Department.
• My thanks also go to Dr Reinke at Spectrau for his constant assistance regarding
instrumental analysis work and calibration, and to Lisborn Mangwane and Baldwin
Tshivhiahuvhi for preparing samples for analysis.
• I would also like to express my gratitude to Mrs Elsa Maritz, Mr Hennie and Ms Diana
Khoza for handling all administrative and finance related queries.
• Many thanks also go to Lonmin Marikana Platinum Mine for providing sample material
and data related to this study.
• I would also like to thank many friends and colleagues that I made during my study at the
University of Johannesburg.
• Finally, I would like to thank my family for their support and encouragement. I dedicate
this dissertation to my daughters, Rutendo and Ruvimbo.

xiii
ABSTRACT
The study aims to provide a geometallurgical assessment, including an evaluation of the response of different facies types of the Merensky Reef to mineral processing, and the identification of critical characteristics that determine processing behaviour. This is accomplished by obtaining quantitative mineralogical information, combined with chemical assay, laboratory scale milling and flotation testing. Lonmin Platinum’s Marikana Mine is located on the Western Limb of the Bushveld Complex to the east of Rustenburg. Platinum group elements (PGE) occur in, and are mined from, a variety of facies types of the Merensky Reef, and the UG2. For the purpose of the present study, three facies types of Merensky Reef samples and one sample of UG2 were used. The Merensky facies samples comprise of the BK, RPM, and Western Platinum variants. The mineral assemblages of the various Merensky Reef facies types at this locality comprise varying amounts of orthopyroxene, clinopyroxene, plagioclase, olivine, talc, serpentine, chlorite, chromite, magnetite and sulphides (mainly pyrrhotite, pentlandite and chalcopyrite). Approximately 20 individual 10 cm channel samples were collected from each of the facies variants of the Merensky Reef, and the UG2. These are coarsely crushed, mineral modal abundances determined using the MLA, and then analysed for Co, Cr, Cu, Ni, S and 6 PGE. The samples were then combined per facies type, and each of these composites subjected to laboratory scale milling and flotation testing. Abundant sulphide typically occurs with (is associated with) thin chromitite stringers, as is commonly observed in the Merensky Reef throughout the whole of the Bushveld Complex. Chromitite stringers are characterized by high PGE concentrations. The milling behaviour of the various facies samples, as well as flotation behaviour, was observed to be a function of mineralogy. The influence of ore mineralogy on the various stages of flotation, the mineralogical makeup of the various flotation concentrates, and the level of recovery of the PGE’s during flotation, were also investigated. Ore facies having the most abundant anorthite required the longest milling time to achieve the target grind of 60wt.% passing 75µm; and the ore with the most abundant enstatite produced the largest mass pull on floating. The facies with higher PGE grade, modal abundance of base metal sulphides, higher degree of liberation of base metal sulphides and least enstatite abundance produced the most favourable set of characteristics for efficient PGE recovery.
1
CHAPTER 1: INTRODUCTION 1.0 INTRODUCTION This chapter gives a brief overview of the geographical location of the study area, historical
mining activities, local geology within the broader regional geological setting, and previous
research work done on the study area. It also shows the linkage between the past geological
investigations carried out in this study area and the current research which have been aimed at
providing potential opportunities for more effective and efficient mineral extraction and
processing routes.
1.1 GEOGRAPHICAL SETTING, LOCAL GEOLOGY AND HISTORY Lonmin Platinum’s Marikana Operation is located at 25o 45’ S 27o21’E (Mclaren and De
Villiers, 1982; Von Gruenewaldt et al., 1985 and references therein) on the Rustenburg Layered
Suite of the Western Limb of the Bushveld Igneous Complex about 70km northwest of
Johannesburg, in the North West Province of South Africa, near Marikana town.
Figure 1.1Geological Map of the Bushveld Complex showing Lonmin Marikana Operations (modified after Von
Guenewaldt et al., 1985)

2
Lonmin Platinum Marikana Operation comprises Western Platinum Limited, including Karee
Mine, and Eastern Platinum Limited (Cawthorn, 1999b), all situated in the southern part of the
Western Limb of the Bushveld Complex (Figure 1.1).
The mine’s current lease area (Figure 1.2) covers the farms Zwartkoppies 296JQ , Rooikoppies
297JQ, northern part of Elands drift 467 JQ, Middelkraal 466JQ,Wonderkop 400JQ, Schaapkraal
292 JQ, part of LeeuWPort 402JQ , and Turfontein 462JQ farms (Lonmin Group, 2006; Davey,
1992).
Figure 1.2 Property Boundaries of Lonmin Platinum Marikana Operations (Adapted from Cawthorn, 1999b;
Davey, 1992)
Underground development to exploit the Merensky Reef began in 1970 and milling of the
Merensky Reef ore began in 1971. This was mainly to extract the platinum group minerals,

3
namely: platinum, palladium, rhodium, ruthenium, iridium and osmium. Gold, copper and nickel
are also extracted as by-products (Lonmin Group, 2006).
Metallurgical investigations into the PGM recovery from UG2 ore at Western Platinum Limited
were done jointly with the National Institute for Metallurgy (now Mintek) during 1980, and
Western Platinum Limited became the first company to exploit the UG2 Chromitite Layer for its
PGM content on a large scale (Cawthorn, 1999b). Mining of the UG2 at Western Platinum
Limited started in 1982. Currently, both the Merensky Reef and the UG2 are being mined
(Cawthorn, 1999b; Lonmin Group, 2006).
In 1987 the mine began sinking inclined shafts to exploit the UG2 at the Eastern Platinum
Limited, and the milling of ore from Eastern Platinum Limited began in 1989. It is noteworthy
that Eastern Platinum Limited currently produces only UG2 ore (Lonmin Group, 2006).
During 1988, Impala Platinum Limited (Implats) began to sink shafts to exploit the Merensky
Reef and UG2 at Karee before merging with Western Platinum Limited. In January 1990,
Lonmin Platinum Marikana Operation and Implats merged Karee Mine with Western Platinum
Limited. Lonmin Platinum Marikana Operation was given the responsibility of managing the
newly established entity (Lonmin Group, 2006).
The UG2 ore at Lonmin Platinum Marikana Operation is milled separately from the Merensky
Reef, with the chromite from the UG2 being produced as a by-product during the milling
process. Lonmin Marikana’s annual production (2005) was 13.5 million tonnes, consisting of 10
million tonnes of UG2 and 3.5 tonnes of Merensky Reef ores. Mining operations are currently
carried out at various localities along strike of the reefs, using mainly up-dip mining methods.
Mining depths range from 30 metres to 700 metres below the surface (Lonmin Group, 2006).
4
1.1.1 REGIONAL GEOLOGICAL SETTING: INTRODUCTION
This section briefly outlines the regional geological setting of the Bushveld Complex and links it
to the geological setting of Lonmin Platinum Marikana Operation mine lease area to provide a
contextual basis for the study.
1.1.2 REGIONAL GEOLOGICAL SETTING
The Bushveld Complex is the world’s foremost layered intrusion and hosts the largest deposits of
platinum group minerals and economically recoverable amounts of copper, nickel, chromium
and vanadium (Cawthorn, 1999b; Scoon and Mitchell, 2009 and references therein). It is divided
into the Eastern, Western, Far Western and Northern or Potgietersrus Limbs (Figure 1.3)
(Kinloch, 1982; Schouwstra et al., 2000).
The Bushveld Complex consists of ferromagnesian and calcium-aluminium-sodium silicate
rocks. Rock types found in the Merensky Reef range from feldspathic to pegmatoidal
pyroxenites, norites and anorthosites; UG2 has chromitites, pyroxenites and anorthosite; and
Platreef has pyroxenites, serpentinites and cal-silicate rocks. These rocks are repetitively
compositionally fractionated and layered in a cyclic fashion, resulting in a stratigraphic sequence
of tens of kilometres thick of rock layer (Cawthorn, 1999b; Schouwstra et al., 2000; Scoon and
Mitchell, 2009; and references therein). Mineralisation and ore deposit distribution are thought to
be controlled by this layering mechanism.
Chromite, ilmenite, and platinum group minerals are associated with the ferromagnesian (mafic)
component of the cyclic units, and magnetite, cassiterite, zircon and other oxides are associated
with the silicic part. Magmatic and hydrothermal mechanisms are postulated to account for the
variation in stratification and mineralization within the Bushveld Complex reefs (Cawthorn et al.,
1999a; Cawthorn et al., 2002). Common economic minerals found in the Bushveld Complex are
sulphides of iron, nickel, copper and sulphides, arsenides, tellurides and alloys of the platinum
group elements (PGE) forming the platinum group minerals (PGM). The rock layers are

5
generally laterally continuous except in places where they are transgressed by dunite pipes,
young intrusions and potholes (Kinloch, 1982; Naldrett et al., 1986).
The Western Limb of the Bushveld Complex consists of the following stratigraphic units from
bottom to top: the Lower Zone, the Lower Group, the Middle Group, Upper Group, the Critical
Zone, the Main Zone, and the Upper Zone. The Critical Zone encompasses the UG2, the
Merensky Reef pyroxenite and the Bastard pyroxenite/norite (Gruenewalt et al., 1986; Davey,
1992).
The emphasis of this study is on the Merensky Reef and the UG2 Chromitite (Upper Group
Chromitite Number 2) of the Critical Zone. On the Northern Limb is the Platreef, which rests
directly on the Transvaal metasedimentary sequence and Archaean granites, whereas the
Merensky Reef rests on the Bushveld rocks of the Critical Zone, the Middle Group, the Lower
Group and the Lower Zone before the sedimentary rocks of the Transvaal Supergroup
(Cawthorn, 1999b and references therein).

6
Figure 1.3 Regional Geological Map of the Bushveld Complex - Different Lithological Units and Limbs of theBushveld Complex
(Von Gruenewaldt et al., 1985)

7
1.1.3 THE MERENSKY REEF
The Merensky Reef is commonly considered a laterally uniform reef type, but large variations in
reef thickness, reef composition and position of mineralization occur. In its most general sense
the reef consists of a feldspathic pyroxenite underlain and overlain by thin (5mm to 10mm)
chromitite stringers (Brynard et al., 1976; Schouwstra and Kinlock, 2000; and references
therein). The Merensky Reef extends for about 300 kilometres around the whole outcrop of the
Eastern and Western Limbs of the Bushveld Complex, and to depths of 5 kilometres.
Its silicate mineralogy consists predominantly of orthopyroxene (~60wt.%), plagioclase
(~20wt.%), clinopyroxene (~15wt.%), phlogopite (~5wt.%) and minor olivine. Secondary
minerals include talc, serpentine, chlorite and magnetite (Brynard et al., 1976; Schouwstra and
Kinlock, 2000; and references therein)
The major base metal sulphide assemblage includes, of all the sulphides, pyrrhotite (~40wt.%),
pentlandite (~30wt.%) and chalcopyrite (~15wt.%). Millerite (NiS), troilite (FeS), pyrite (FeS2)
and cubanite (Cu5FeS4) also occur as trace minerals (Vermaak and Hendriks, 1976; Schouwstra
et al., 2000). Cooperite (PtS), braggite ((Pt,Pd)NiS)), sperrylite (PtAs2), and platinum group
element alloys are the major platinum group mineral species occurring in the Bushveld Complex.
Laurite (RuS2) can also be abundant, especially in the UG2 Chromitite layer (Kinloch, 1982;
Von Gruenewaldt et al., 1986 and references therein).
PGM distribution, especially Pt-Fe alloys, has been correlated with hot spots, reef disturbances
(potholes) and volatile activity in the Merensky Reef, Platreef and the UG2 chromitite layer
(Farquhar, 1986; Kinloch, 1982; Gain et al., 1982 and references therein). For example, Pt-Fe is
highly associated with dunite pipes and UG2 in close proximity to dunite pipes (Cawthorn,
1999b). Pt-Fe is a significant component of the western Bushveld Complex northeast and
southeast of the Pilanesburg Alkaline Complex and in the dunite pipes of the eastern Bushveld
Complex (Kinloch, 1982; Scoon et al., 2004), and in the UG2 layer in their immediate vicinity.
Sperrylite (PtAs2) is closely associated with potholes, faulting and reef alterations (Kinloch,
1982).

8
In the Merensky Reef the proportions of platinum and palladium average about 55vol.% and
32vol.% respectively, and the other metals constitute about 13vol.% (Cawthorn, 1999b).
The Merensky Reef contains 89vol.% Pt-Pd sulphides types, the pothole reef contains 92vol.%
Pt-Fe alloy, and the contact reef (where the Merensky Reef thins down to only a narrow
chromitite stringer) contains 87vol.% laurite (RuS2) and 11vol.% of the other Pt-Pd sulphide
types. Thus Pt-Fe PGM dominate the pothole reefs (Cawthorn et al., 2002 and references
therein).
The base metal sulphide mineralogy also shows a regional correlation with potholes. In the
Merensky Reef, the sulphide assemblage consists of pentlandite, pyrrhotite and chalcopyrite, but
the pothole reef contains mackinawite and cubanite in addition to the pentlandite, pyrrhotite and
chalcopyrite as the dominant sulphides. The contact reef contains essentially chalcopyrite. The
PGM grain sizes increase towards the potholes (Kinloch, 1982).
1.1.4 THE UG2 REEF
The UG2 reef is a platinum group element bearing chromitite layer, variably situated between
20m to 400m below the Merensky Reef. The UG2 thickness is usually 1m, but it can vary from
0.4m to 2.5m depending on the locality (McLaren and De Villiers, 1982 and references therein)
The major mineral phases of the UG2 are chromite (~60% to 90wt.%), orthopyroxene (~5% to
30%wt.) and plagioclase (~1wt.% to 10wt.%) (Vermaak, 1995). Minor mineral phases are
phlogopite, biotite, clinopyroxene, ilmenite, rutile, magnetite and base metal sulphides. Quartz,
talc and serpentine are present as secondary minerals. Chalcopyrite, pyrrhotite, pyrite,
pentlandite and to a lesser extent millerite constitute the major base metal sulphide assemblage
and occur interstitially within silicates and rarely enclosed in chromite (McLaren and De Villiers,
1982; Penberty et al., 2000; Schouwstra, 2000 and references therein).
The platinum group mineral assemblage of the UG2 chromitite layer ranges from sulphide to
non-sulphide minerals. The sulphides minerals include laurite (RuS2), cooperite (PtS), malanite

9
((Pt,Rh,Ir)2CuSO4)), braggite ((Pt,Pd)NiS)), and vysotskite (PdS) in some cases. Pt-Fe alloys (Pt-
Fe), and (Pt3Fe), tellurides, bismuthinides, bismuthotellurides of Pt and Pd, PGE arsenides and
sulphoarsenides constitute the non-sulphide platinum group minerals. Rustenburgite (Pt3Sn),
isomertierite (Pd11Sb2As2), arsenopalladinite (Pd8(As,Sb)3), plumbopalladinite (Pd3Pb2), potarite
(PdHg) and geversite (PtSb2) also occur. Generally the platinum group minerals in UG2 occur as
fine grains (averaging 12 microns), either associated with base metal sulphides, silicate gangue
and /or chromite grains, especially laurite (Kinloch, 1982; McLaren and De Villiers, 1982;
Gruenewaldt et al., 1986; Penberty et al., 2000; and references therein).
PGE values range from 4g per tonne to 7g per tonne (equivalent to 4-7ppm), depending on the
locality. The chromite content varies from 30wt.% to 35wt.% in the UG2 reef (McLaren and De
Villiers, 1982; Schouwstra et al., 2000). PGE concentrations are distributed throughout the UG2
reef, with larger peak values at the bottom of the seam and a relatively shorter peak at the top of
the seam (McLaren and De Villiers, 1982; Schouwstra et al., 2000).
1.1.5 THE PLATREEF
The Platreef is a mineralization situated in the Northern Limb of the Bushveld Complex, also
known as the Potgietersrus Limb. In the Platreef, the Bushveld Complex rocks rest directly in
contact with the floor rocks of the Archaean granites and the Transvaal metasedimentary
sequence. The Platreef consists of a complex assemblage of pyroxenites, serpentinites, dolomite
xenoliths and calc-silicates, resulting from the reaction caused by heat and material exchange
between the hot Bushveld Complex magma and the lime-rich floor rocks (Gain et al., 1982;
Schouwstra et al., 2000).
The base metal sulphide assemblage consists of pyrrhotite, pentlandite, chalcopyrite, pyrite and
occasional cubanite. The concentrations and distribution of nickel, copper and the PGEs vary
considerably, but the highest values are associated with serpentinites (Gain et al., 1982).
The major platinum group minerals are PGE tellurides, platinum arsenides, platinum sulphides
and platinum group element alloys. Serpentinites are enriched in sperrylite and the upper
10
pyroxenites are enriched with PGE sulphides and PGE alloys. Areas with high potholes, faulting
and reef alteration occurrences are also markedly enriched in sperrylite (Kinloch, 1982).
The PGE alloys in the mineralization are dominant closer to the floor rocks (Schouwstra et al.,
2000). Platinum group minerals often occur enclosed in or on grain boundaries of the base metal
sulphides and in silicate minerals in certain localities (Schouwstra et al., 2000).
11
CHAPTER 2: AIMS OF THE PRESENT STUDY
2.0 PRESENT STUDY
This section briefly describes some work that was already carried out in this study area and
highlights the specific part this current work will cover to add more information to the previous
research findings.
2.1 PREVIOUS WORK AND STUDIES
Exploration drilling, surface mapping, trenching and underground development at Lonmin
Platinum Marikana Operation have revealed remarkable lateral variations within certain
lithological units in the Upper Critical Zone of the Western Bushveld Complex within the mine
lease area (Davey, 1992).
Laterally, the Merensky Reef thickness varies from 2m in the west to 12m in the east of the study
area, with PGE concentrations being higher in the upper chromitite stringer, but higher PGE
concentrations are sometimes found in the lower chromitite stringer (Brynard et al., 1976;
Farquhar, 1986).
The Merensky Reef is that part of the Merensky cyclic unit, which is economically exploitable
for its platinum group elements minerals. In the Marikana mine lease area the Merensky Reef
extends laterally from west to east exhibiting recognizable reef variations in terms of lithology,
reef thickness and platinum group minerals grade distribution.
The Merensky Reef is generally considered a 1m feldspathic pyroxenite sequence which is
underlain by an anorthosite and bounded by upper and lower chromitite stringers or bands
(Brynard et al., 1976; Davey, 1992).

12
Some parts of the Merensky pyroxenite sequence are pegmatoidal in nature. At the top of the
pyroxenite sequence is a 1m orthopyroxenite overlain by an anorthosite (Cawthorn and Boerst,
2006).
There are varying concentrations of platinum group elements within the Merensky Reef, with the
highest concentrations found within the upper and lower chromitite stringers (Brynard et al.,
1976; Davey, 1992; Cawthorn et al., 2002).
Six facies types of the Merensky Reef exist in this area, namely the Brakspruit facies (BK), the
Rustenburg Platinum Mine (RPM) facies, the Thin facies, the Transitional thin facies, the
Marikana facies, the Western Platinum (West Plats or WP) facies and the Eastern Platinum (or
East Plats) facies (Figure 1.4) (Davey, 1992; Lonmin Group, 2006). However, this study focuses
only on the BK, the RPM, the West Plats and the UG2 chromitite layer facies.
The RPM facies has 0.3m to 1m thick Merensky pyroxenite, and the platinum group elements
are concentrated adjacent to the chromitite stringer at the base of the pyroxenite (Figure 2.1).
The West Plats facies consists of pyroxenite and pegmatoidal pyroxenite with thicknesses
varying from 2m to 5m, and PGEs concentrated mainly at the upper chromitite stringer.
Marikana facies together with the Thin and the Transitional Thin facies are transitional facies
between the RPM and the West Plats facies. The Merensky pyroxenite in the Marikana facies
varies from 1m to 2m, with the PGEs almost continuously distributed from the lower chromitite
to the upper chromitite stringers.
The Thin facies consists of a pyroxenite, which varies from 0.5m to 1m, and the PGEs are
concentrated within the basal chromitite at the base of the pyroxenite in the Thin facies-
Transitional thin facies (Davey, 1992).
13
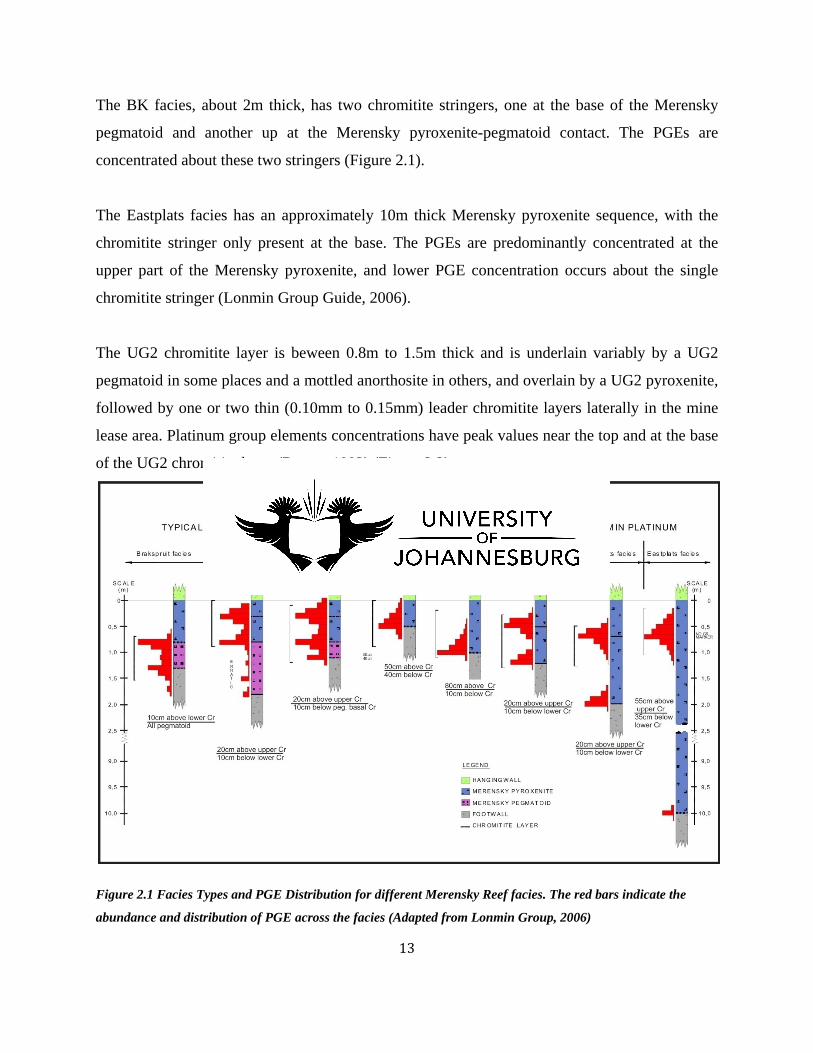
The BK facies, about 2m thick, has two chromitite stringers, one at the base of the Merensky
pegmatoid and another up at the Merensky pyroxenite-pegmatoid contact. The PGEs are
concentrated about these two stringers (Figure 2.1).
The Eastplats facies has an approximately 10m thick Merensky pyroxenite sequence, with the
chromitite stringer only present at the base. The PGEs are predominantly concentrated at the
upper part of the Merensky pyroxenite, and lower PGE concentration occurs about the single
chromitite stringer (Lonmin Group Guide, 2006).
The UG2 chromitite layer is beween 0.8m to 1.5m thick and is underlain variably by a UG2
pegmatoid in some places and a mottled anorthosite in others, and overlain by a UG2 pyroxenite,
followed by one or two thin (0.10mm to 0.15mm) leader chromitite layers laterally in the mine
lease area. Platinum group elements concentrations have peak values near the top and at the base
of the UG2 chromitite layer (Davey, 1992) (Figure 2.2).
Figure 2.1 Facies Types and PGE Distribution for different Merensky Reef facies. The red bars indicate the
abundance and distribution of PGE across the facies (Adapted from Lonmin Group, 2006)

14
The gangue mineralogy of the Merensky Reef at Marikana (Western Platinum Ltd) typically
consists of orthopyroxene (~70wt.%), plagioclase (~20wt.%), clinopyroxene (~4wt.%), biotite
(~2wt.%) and 3wt.% quartz, sulphides and chromite. Secondary talc is common, mainly at the
grain boundaries of sulphides and pyroxene. Hornblende is also present in minor amounts. Major
base metal sulphide mineralogy consists of pentlandite, pyrrhotite, chalcopyrite and pyrite. Trace
base metal sulphides include millerite (NiS), troilite (FeS) and cubanite (Cu5FeS5) (Brynard et
al., 1976; Schouwstra et al., 2000).
Oxides, mainly chromite and rutile are also present in small amounts.
Precious metals, namely platinum, palladium, ruthenium, rhodium, iridium and gold are present
in varying proportions in the Merensky Reef in the Marikana mine lease area (WP, including
Karee Mine). The PGE grade in the Merensky Reef in this area varies between 5g per tonne and
7g per tonne (equivalent to 5-7ppm), consistent with the regional trend in the western limb of the
Bushveld Complex (Schouwstra et al., 2000; Cawthorn et al ., 2002).
These PGEs occur in sulphides, arsenides, tellurides, bismuthotellurides, and alloys as platinum
group minerals. These platinum group minerals consist of mainly PGE sulphides: cooperite
(PtS), braggite (PtPdNiS), and laurite (RuS); telluride: moncheite (PtTe2); bismuthotellurides:
michenerite (PdBiFeTe), kotulskite (Pd(Te,Bi)) and maslovite (PtTeBi); arsenide, sperrylite
(PtAs2); antimonides, stibiopalladinite (PdSb) and geversite (PtSb) and an alloy (PtFe). Gold
exists as an alloy, electrum and as a rare compound, AuBiPdTe (Brynard et al., 1976; Viljoen et
al., 2012). Sperrylite is the most abundant PGM over all the other PGM in this area (Brynard et
al., 1976).
The UG2 chromitite layer in this study area consists of chromite (60wt.% to 90wt.%),
orthopyroxene (5wt.% to 25wt.%), and plagioclase (5wt.% to 15wt.%). Clinopyroxene, base
metal sulphides and other sulphides, platinum group minerals, ilmenite and magnetite occur as
accessory minerals (McLaren and De Villiers., 1982; Penberty et al., 2000). Pentlandite,
pyrrhotite, pyrite and chalcopyrite are the dominant base metal sulphides. Millerite is present in
lesser quantities. The PGM identified in this layer are cooperite, laurite, braggite, Pt-Fe alloy and
15
sperrylite. The relative proportions of precious metals in the UG2 in this study area are
49.5vol.% Pt, 22.5vol.% Pd, 15vol.% Ru, 8.7vol.% Rh, 3.7vol.% Ir and 0.6vol.% Au (Lonmin
Group Guide, 2006).
UG2 thickness varies between 0.7m to 1.3m laterally and becomes generally thicker towards the
eastern part of the lease area. The entire layer is extracted during mining. The UG2 in the
northwestern part of Marikana branches into two and is separated by an internal feldspathic
pyroxenite layer. This variation of the UG2 is referred to as the RPM or NW facies (Davey,
1992). Typically the PGE concentration is highest in the middle and at the base of the UG2
chromitite layer (McLaren and Devilliers, 1982) (Figure 2.2). Nickel and copper also have peak
values at the centre (Figure 2.2), although nickel has a larger proportion than copper (Lonmin
Group Guide, 2006).
2.2 MOTIVATION FOR CURRENT STUDY
Mineralogical investigations have established mineralogical variability of the platinum group
mineral distribution in the Merensky Reef at Lonmin’s Marikana Operation. These investigations
based on drill cores as well as plant feed and concentrate were used to determine the
mineralogical variations of various facies at Lonmin Platinum Marikana Operation and regional
correlations (Brynard et al., 1976; Davey, 1992). More recently an investigation was conducted
on drill core in the Merensky Reef at Marikana Platinum mine to establish the mineralogy of the
PGM within the high grade chromitite stringers using an FEI 600 Mineral Liberation Analyser
(Viljoen et al., 2012).
Data for detailed geometallurgical assessments of the individual reef facies has not been
published in the international scientific literature. The variability of ore and gangue mineralogy
and variations in PGM abundances within the various facies of the Merensky Reef could pose
inherent challenges to PGM liberation behaviour and metallurgical responses in beneficication
processes (Brynard et al., 1976; Becker et al., 2008).

16
Figure 2.2 Vertical distribution of Cu, Ni and PGE in the UG2 Layer (Adapted from Lonmin Group, 2006)
This project seeks to characterize the Merensky Reef facies and UG2 at Lonmin’s Marikana
Operations to establish the influence, if any, of the reef facies variability on comminution and
flotation performance, such as platinum deportment, PGM liberation, and the abundances of
naturally floatable gangue (Xiao and Laplante, 2004; Becker et al., 2008; Becker et al., 2009;
Runge, 2010).
This study also aims to provide a geometallurgical assessment consisting of: (1) an evaluation of
responses of the different facies to mineral processing and (2) the identification of critical
characteristics that determine processing behaviour, by obtaining quantitative mineralogical and
textural information (Coetzee et al., 2011). This study might help refine mineral exploitation
17
(selective reef facies extraction) and processing strategies at Lonmin Platinum Marikana
Operation, and also serves as a basis for further research such as flotation conditions
optimization and grade optimization of the concentrates.
2.3 GEOMETALLURGY AND GEOMETALLURGICAL ASSESSMENTS
Geometallurgy is a multi-disciplinary, applied science which integrates mining, geology and
metallurgy to correctly help assess the processing needs of an orebody (Beniscelli, 2011; Lotter,
2011; Philander and Rozendaal, 2011).
Chemical analysis gives metal grade values in an ore, but does not give the distribution of the
metals in the various minerals within the ore, for example Ni in olivine, pentlandite and
pyrrhotite. Different minerals hosting the same metal type may respond differently to various
processing techniques. Therefore geometallurgy seeks to provide mineralogical information of
an ore to determine causes of different responses of minerals to various metallurgical processes
so that an appropriate metallurgical technique can be employed for effective mineral
beneficiation.
Geometallurgical assessments are carried out using the techniques: geometallurgical unit, ore
domain or ore facies classification, representative sampling, mineralogical measurements,
chemical assays, mill testing, deportment study and mineral separation testing.
Geometallurgical unit definition, ore domain or facies classification divides an orebody into ore
types based on host rock characteristics, alteration, grain sizes, structural geology, grade,
mineralogical variation, and metal ratios with focus on properties which are known to influence
metallurgical performance (Lotter, 2011). Representative sampling is then done for each facies
or geometallurgical unit.
Mineralogical measurements involve quantitative mineralogical characterisation of the coarsely
crushed and milled ore to determine mineral textures, mineral association, mineral modal

18
abundances, mineral grain sizes, grain size distribution, mineral liberation and elemental
deportment by mineral (Fandrich et al., 2007).
Bench top flotation testing is used to determine how different valuable minerals in the milled
feeds respond to mineral separation by froth flotation process. The concentrates and tailings are
all subjected to chemical analysis to determine grade; and to mineralogical analysis, to determine
the mineralogical characteristics causing poor metallurgical performance such as recovery losses
(Lotter et al., 2002, 2003 and 2011; Lastra, 2007; Kormos et al., 2010; Evans et al., 2011).

19
CHAPTER 3: SAMPLES COLLECTED, AND SAMPLE MINERALOGY
AND GEOCHEMISTRY
3.0 INTRODUCTION
Samples for this study were collected from underground workings at Lonmin Marikana Platinum
Mine at the sites, and sampled using the method given in Appendix A1.1.
Visual examination and mineralogical analyses conducted on the three mineralized Merensky
Reef facies channel samples, namely the BK, the Rustengurg Platinum Mine, the Western
Platinum facies, and the UG2 chromitite channel samples are briefly discussed in this chapter.
All the channel samples were visually examined and logged to establish their mineralogical
identities and characteristics (Figure 3.1).
3.1 SAMPLES COLLECTED AND SAMPLES DESCRIPTIONS
The BK facies is characterized, at the top, by medium to coarse grained spotted anorthosite, with
70vol.% plagioclase and 30vol.% pyroxene. This is followed by medium to coarse grained
pyroxenite with up to 90vol.% pyroxene and interstitial plagioclase (10vol.%), disseminated base
metal sulphides and a 5mm to 6mm fine to medium grained chromitite stringer.
Below the chromitite stringer is a coarse grained pegmatoidal pyroxenite, with up to 40vol.%
plagioclase phenocrysts and disseminated base metal sulphides. This is followed by another
chromitite stringer, and a mottled anorthosite with up to 70vol.% plagioclase and 30vol.% large
pyroxene phenocrysts at the bottom.
The RPM facies is characterized by medium to coarse grained pyroxenite, with up to 90vol.%
pyroxene and elongate clinopyroxene phenocrysts (20-30mm) and a chromitite stringer near the
top.

20
A second chromitite stringer (3mm to 5mm) is situated at the base of the pyroxenite, followed by
a coarse grained pegmatoidal pyroxenite, with up to 70vol.% pyroxene phenocrysts and
disseminated trace sulphides, oxides and chromite grains.
A third chromitite stringer (10mm) is located at the contact of the pegmatoidal pyroxenite on top
and a coarse grained mottled anorthosite (70vol.% plagioclase) below.
The WP facies sample consists of a coarse grained pyroxenite, with more than 80vol.%
pyroxene, isolated clinopyroxene phenocrysts (10mm to 20mm), disseminated base metal
sulphide blebs (~0.5vol.%) and a chromitite stringer near the top. A second chromitite stringer
(3mm to 20mm) is situated at the contact of the pyroxenite and a coarse grained mottled
anorthosite (~40vol.% plagioclase) below.
UG2 chromitite reef sample consists of medium to coarse grained pyroxenite at the top, with
disseminated chromite grains throughout, and three thin fine grained chromitite stringers
(≤1mm,3mm and ≤2mm) separated from the main chromitite below by thin pyroxenite bands
(15mm, 1mm and 1mm). The main chromitite consists of very fine grained chromite grains (≥95
vol.%) and very fine grained plagioclase (≤5vol.%). A fine grained anorthosite (≥95vol.%
plagioclase), with little amount of fine grained biotite and pyroxene (≤5vol.%), is situated at the
base.
Detailed quantitative mineralogical studies of each 10cm channel subsample was conducted
using a Scanning Electrom Microscope based Mineral Liberation Analyser (600F MLA) , to
establish accurate mineral assemblages, modal abundances and distribution in each channel
subsample; and across each facies.

21
Figure 3.1 Geological Logs Showing Lithological Variations across the BK (BK), RPM (RPM), WP(WP) facies
and UG2 Chromitite reef
22
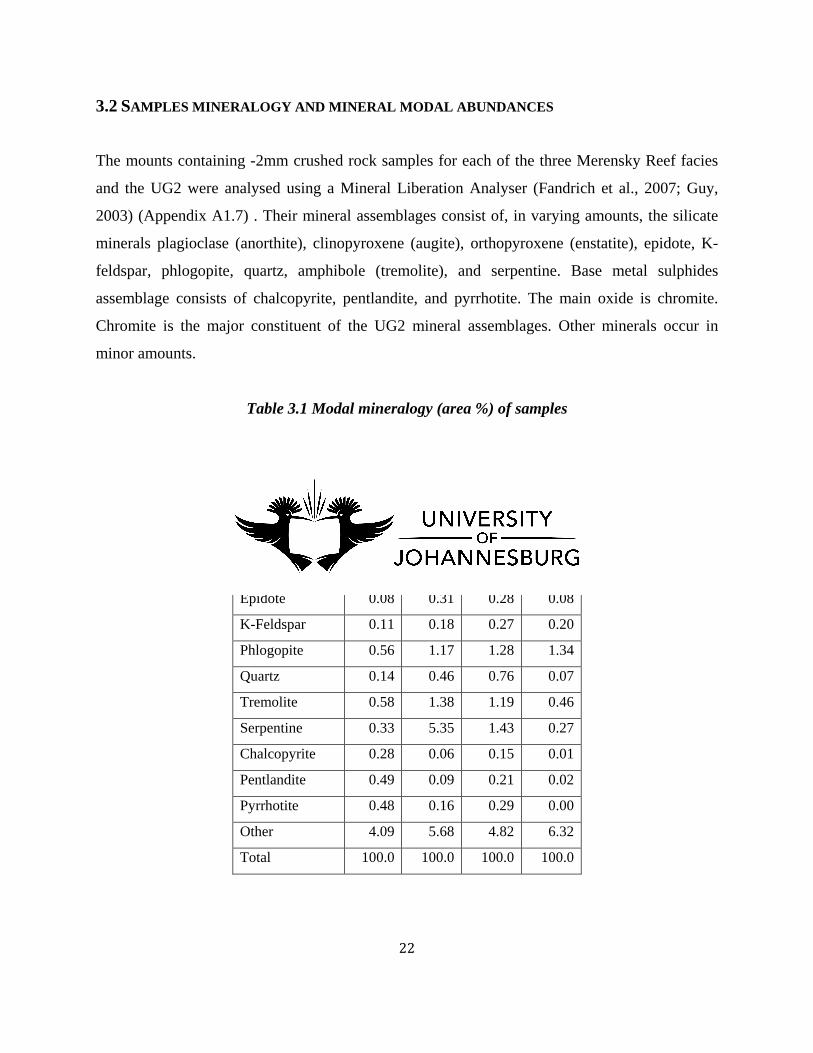
3.2 SAMPLES MINERALOGY AND MINERAL MODAL ABUNDANCES
The mounts containing -2mm crushed rock samples for each of the three Merensky Reef facies
and the UG2 were analysed using a Mineral Liberation Analyser (Fandrich et al., 2007; Guy,
2003) (Appendix A1.7) . Their mineral assemblages consist of, in varying amounts, the silicate
minerals plagioclase (anorthite), clinopyroxene (augite), orthopyroxene (enstatite), epidote, K-
feldspar, phlogopite, quartz, amphibole (tremolite), and serpentine. Base metal sulphides
assemblage consists of chalcopyrite, pentlandite, and pyrrhotite. The main oxide is chromite.
Chromite is the major constituent of the UG2 mineral assemblages. Other minerals occur in
minor amounts.
Table 3.1 Modal mineralogy (area %) of samples
Mineral BK RPM WP UG2
Anorthite 31.14 20.59 15.66 25.15
Augite 7.93 5.77 5.84 1.15
Chromite 0.45 1.11 0.75 49.14
Enstatite 53.33 57.68 67.08 15.79
Epidote 0.08 0.31 0.28 0.08
K-Feldspar 0.11 0.18 0.27 0.20
Phlogopite 0.56 1.17 1.28 1.34
Quartz 0.14 0.46 0.76 0.07
Tremolite 0.58 1.38 1.19 0.46
Serpentine 0.33 5.35 1.43 0.27
Chalcopyrite 0.28 0.06 0.15 0.01
Pentlandite 0.49 0.09 0.21 0.02
Pyrrhotite 0.48 0.16 0.29 0.00
Other 4.09 5.68 4.82 6.32
Total 100.0 100.0 100.0 100.0

23
Modal abundances for individual facies channel samples and the UG2 are shown in Appendix 2,
Table A2.1-A2.4 for the BK, RPM, WP facies and UG2 chromitite respectively. Comparative
modal mineralogy of the three facies and the UG2 is presented in Table 3.1.
3.2 MINERALOGICAL VARIATION WITH DEPTH
In the BK (BK) facies sample, chromite is concentrated mostly at the stringers (7.30wt.% and
3.22wt.% at the upper and lower stringers respectively), and also between the two stringers
(1.33wt.%). Sulphides concentrations are generally lower at the chromitite stringers (Figure 3.2),
especially at the upper stringer, but increases away from the stringers (also shown in Appendix 2,
Table A2.1,).
Augite (clinopyroxene) is generally concentrated in the middle of the facies, the highest being at
the upper stringer (21.60wt.%) and the lowest (2.23wt.%) at the lower chromitite stringer.
Enstatite (orthopyroxene) concentrations at the stringers are lower, with 57.72%wt and
48.78%wt enstatite at the upper and lower stringers respectively, compared to about 80%wt on
moving away from the stringers.
In RPM facies chromite concentration increases downwards with depth. The lowermost
chromitite stringer has the highest chromite content (17.94wt.%), followed by the middle stringer
(5.52wt.%), and the uppermost stringer has the least chromite (4.5wt.%) (Appendix 2, Table
A2.2).
The sulphides content is highest at the upper chromitite (3.65wt.%), lowest at the middle stringer
(0.30wt.%), and higher near the bottom stringer (0.86wt.%) and 0.62wt.% at the stringer itself
(Figure 3.3 and Appendix 2, Table A2.2). Serpentine and plagioclase have lower concentrations
at the stringers, and orthopyroxene (enstatite) is distributed evenly across the reef except in the
anorthosite portion.

24
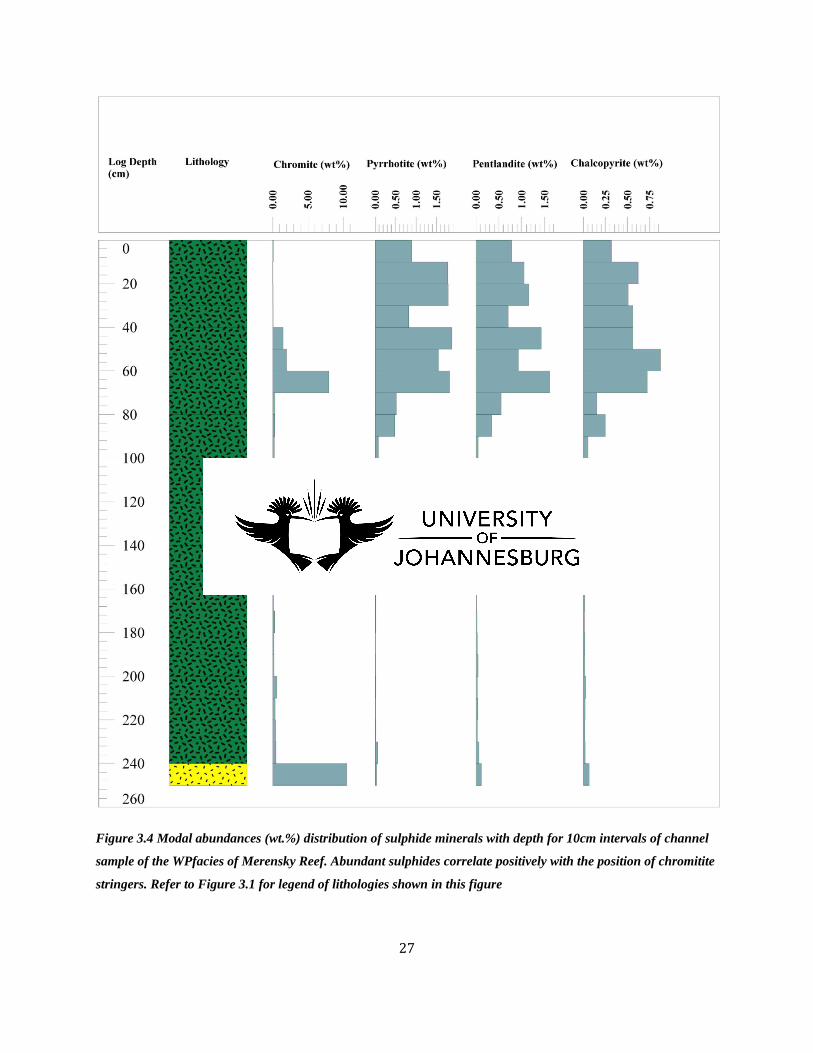
In WP, however, the sulphides are concentrated more around the chromitite stringers (Figure 3.4
and Appendix 2, Table A2.3). Augite and orthopyroxene (enstatite) have lower concentrations at
the chromitite stringers.
The chromite content is higher in the middle of the UG2 chromitite reef and decreases outwards
towards the reef edges (Appendix 2, Table A2.4). Sulphides (Figure 3.5), augite, orthopyroxene
(enstatite), plagioclase, phlogopite, serpentine, tremolite and quartz concentration are generally
higher towards the the edges of the reef (Table A2.4). Exceptions are the lower serpentine and
enstatite values in the anorthosite portion at the bottom of the reef. The highest plagioclase value
occurs in the anorthosite portion at the bottom of the reef, as expected.

25
Figure 3.2 Modal abundances (wt.%) distribution of sulphide minerals with depth for 10cm intervals of channel
sample of the BK facies of Merensky Reef. Abundant sulphides correlate positively with the position of chromitite
stringers. Refer to Figure 3.1 for legend of lithologies shown in this figure

26
Figure 3.3 Modal abundances (wt.%) distribution of sulphide minerals with depth for 10cm intervals of channel
sample of the RPM facies of Merensky Reef. Abundant sulphides correlate positively with the position of
chromitite stringers. Refer to Figure 3.1 for legend of lithologies shown in this figure
27
Figure 3.4 Modal abundances (wt.%) distribution of sulphide minerals with depth for 10cm intervals of channel
sample of the WPfacies of Merensky Reef. Abundant sulphides correlate positively with the position of chromitite
stringers. Refer to Figure 3.1 for legend of lithologies shown in this figure

28
Figure 3.5 Modal abundances (wt.%) distribution of sulphide minerals with depth for 10cm intervals of channel
sample of the UG2 chromitite facies reef. Refer to Figure 3.1 for legend of lithologies shown in this figure

29
3.3 SAMPLES GEOCHEMISTRY
Crushed channel samples were analysed according to Appendix 1, Section A1.9.
The assay values obtained for the PGE, the base metals Cr, Cu, Ni and sulphur are shown in
Appendix 3, Table A3.1-A3.4 for the BK, RPM, WP facies and the UG2 reef respectively. The
assays distribution across the BK, RPM, WP facies and the UG2 reef, from top to bottom, are
also shown in Figure 3.6-3.9 for the BK, RPM, WP and UG2 respectively.
From the assays data it can be observed that the PGE, Cr, Cu, Ni and S are all concentrated at the
chromitite stringers positions in all the Merensky Reef facies (Figure 5.6-3.8).
For BK, the PGE have also another concentration peak between the two chromitite stringers
(Figure 3.6, and Appendix 3, Table A3.1). PGE, Cr, Cu, Ni and S concentration peaks therefore
correlate positively with the chromitite stringer positions in all the Merensky Reef facies.
In the UG2 channel sample, Cr, Cu and Ni are concentrated in the middle of the chromitite reef.
S only is more concentrated at the top, in the UG2 pyroxenite portion (Figure 3.9, and Appendix
3, Table A3.4).
PGE have concentrations peak at the base of the chromitite reef. Ruthenium is the most abundant
of all the other PGE, with the exception of Pd and Pt.

30
Figure 3.6 Distribution of Cr, S (wt.%), Pd, Pt and 6PGE (ppm) with depth for individual 10cm intervals of a
channel sample of the BK facies of Merensky Reef. Abundant Cr, S, and PGE correlate with the position of
chromitite stringers. Refer to Figure 3.1 for legend of lithologies shown in this figure
31
Figure 3.7 Distribution of Cr, S (wt.%), Pd, Pt and 6PGE (ppm) with depth for individual 10cm intervals of a
channel sample of the RPM facies of Merensky Reef. Abundant Cr, S, and PGE correlate with the position of
chromitite stringers. Refer to Figure 3.1 for legend of lithologies shown in this figure
32
Figure 3.8 Distribution of Cr, S (wt.%), Pd, Pt and 6PGE (ppm) with depth for individual 10cm intervals of a
channel sample of the WPfacies of Merensky Reef. Abundant Cr, S, and PGE correlate with the position of
chromitite stringers. Refer to Figure 3.1 for legend of lithologies shown in this figure

33
Figure 3.9 Distribution of Cr, S (wt.%), Pd, Pt and 6PGE (ppm) with depth for individual 10cm intervals of a
channel sample of the UG2 Chromitite facies Reef. Refer to Figure 3.1 for legend of lithologies shown in this
figure

34
CHAPTER 4: SAMPLE MILLING, AND ELEMENT DEPORTMENT
4.0 INTRODUCTION
Milling tests on BK, RPM, WP and UG2 samples were carried out to determine the effect of
mineralogy on milling times required to achieve grinds of 60wt% passing 75µm and liberation
characteristics of the the ore samples. Grading analysis and deportment studies of PGE, Cu, Ni
and S in various size fractions of the Merensky Reef facies and UG2 were done. The milling
tests were carried out using the method outlined in Appendix 1, Section A1.6.
4.1 MILLING TESTS
The milling results for the BK, RPM, WP and UG2 samples are shown in Figures 4.1-4.4, and
also in Appendix 4, Table A4.1.
Figure 4.1 Milling time against mass % passing 75µm sieve for BK sample
y = 1.167x + 12.50
01020304050607080
0 10 20 30 40 50 60
Wei
ght %
pas
sing
75µ
m
Milling times/ minutes
BK
35
Figure 4.2 Milling time against mass % passing 75µm sieve for RPM sample
Figure 4.3 Milling time against mass % passing 75µm sieve for WPsample
The wt.% passing 75µm, of the fines produced by the initial crushing stage, can be obtained by
extrapolation or calculation as intercepts of the graphs at the wt.% passing axes. Thus the wt.%
y = 1.275x + 13.24
0102030405060708090
0 10 20 30 40 50 60
Wei
ght %
pas
sing
75µ
m
Milling times/ minutes
RPM
y = 1.455x + 12.16
0102030405060708090
0.00 10.00 20.00 30.00 40.00 50.00
Wei
ght %
pas
sing
75µ
m
Milling times/ minutes
WP

36
passing 75µm, prior to milling, are 12.50%, 13.24%, 12.16% and 6.66% for BK, RPM, WP and
UG2 facies respectively (Figures 4.1-4.4).
Figure 4.4 Milling time against mass % passing 75µm sieve for UG2 sample
Figure 4.5 shows a comparison of the milling results for the BK, RPM, WP and UG2.
The milling results for the three Merensky facies and the UG2 samples are also summarized in
Table 4.1.
The milling times required to achieve a grind of 60% mass passing 75µm sieve are 40.67, 36.66,
32.86 and 31.37 minutes for the BK, RPM, WPand UG2 respectively (Figures 4.1-4.5).
y = 1.700x + 6.660
0102030405060708090
100
0 10 20 30 40 50 60
Wei
ght %
pas
sing
75µ
Milling times/ minutes
UG2
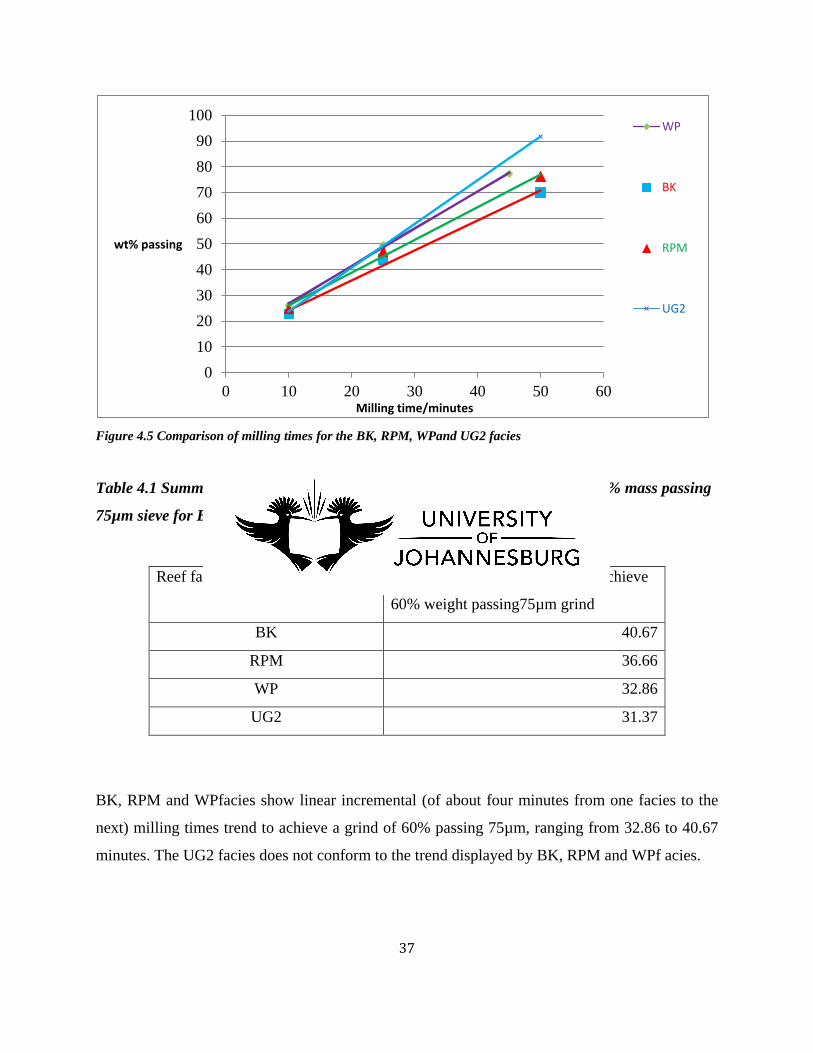
37
Figure 4.5 Comparison of milling times for the BK, RPM, WPand UG2 facies
Table 4.1 Summary of milling times (minutes) required to attain a grind of 60% mass passing
75µm sieve for BK, RPM, WPand UG2 facies
Reef facies type Mill times (minutes) required to achieve
60% weight passing75µm grind
BK 40.67
RPM 36.66
WP 32.86
UG2 31.37
BK, RPM and WPfacies show linear incremental (of about four minutes from one facies to the
next) milling times trend to achieve a grind of 60% passing 75µm, ranging from 32.86 to 40.67
minutes. The UG2 facies does not conform to the trend displayed by BK, RPM and WPf acies.
0102030405060708090
100
0 10 20 30 40 50 60
wt% passing
Milling time/minutes
WP
BK
RPM
UG2
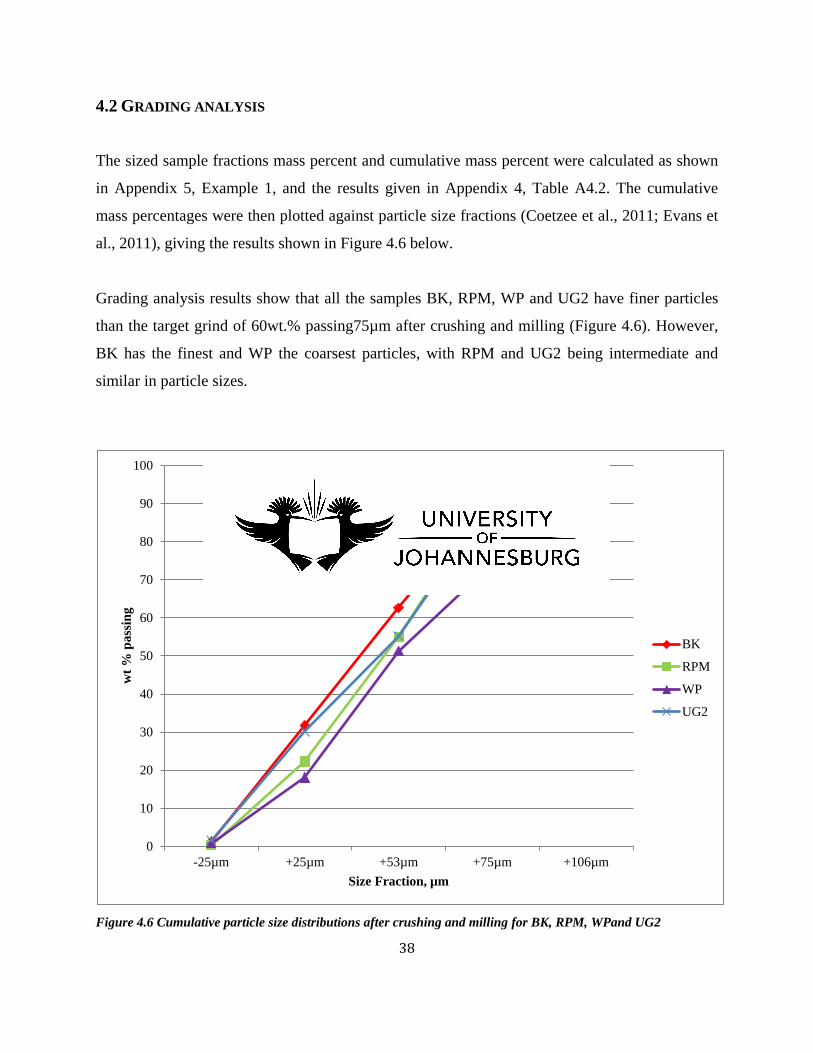
38
4.2 GRADING ANALYSIS
The sized sample fractions mass percent and cumulative mass percent were calculated as shown
in Appendix 5, Example 1, and the results given in Appendix 4, Table A4.2. The cumulative
mass percentages were then plotted against particle size fractions (Coetzee et al., 2011; Evans et
al., 2011), giving the results shown in Figure 4.6 below.
Grading analysis results show that all the samples BK, RPM, WP and UG2 have finer particles
than the target grind of 60wt.% passing75µm after crushing and milling (Figure 4.6). However,
BK has the finest and WP the coarsest particles, with RPM and UG2 being intermediate and
similar in particle sizes.
Figure 4.6 Cumulative particle size distributions after crushing and milling for BK, RPM, WPand UG2
0
10
20
30
40
50
60
70
80
90
100
-25µm +25µm +53µm +75µm +106µm
wt %
pas
sing
Size Fraction, µm
BK
RPM
WP
UG2

39
4.3 ELEMENT DEPORTMENT
Sample size fraction mass percentages and elemental distribution percentages for each size
fraction were calculated from sized fraction sample assays and sized fraction sample masses
shown in Appendix 4, Table A4.2-A4.4. These results were calculated as shown in Appendix 5,
Example 2.
The deportment results for Cu, Ni, S, Pd and Pt in the BK, RPM, WP and UG2 milled ore
fractions are shown in Figures 4.7-4.11 and also in Appendix 4, Tables A4.5-A4.9.
Figure 4.7 Copper upgrade-downgrade curves for milled ore
-60.00
-40.00
-20.00
0.00
20.00
40.00
60.00
80.00
+106µm +75µm +53µm +25µm -25µm
Cu,
Dow
ngra
de-U
pgra
de
Size fraction
BK
RPM
WP
UG2
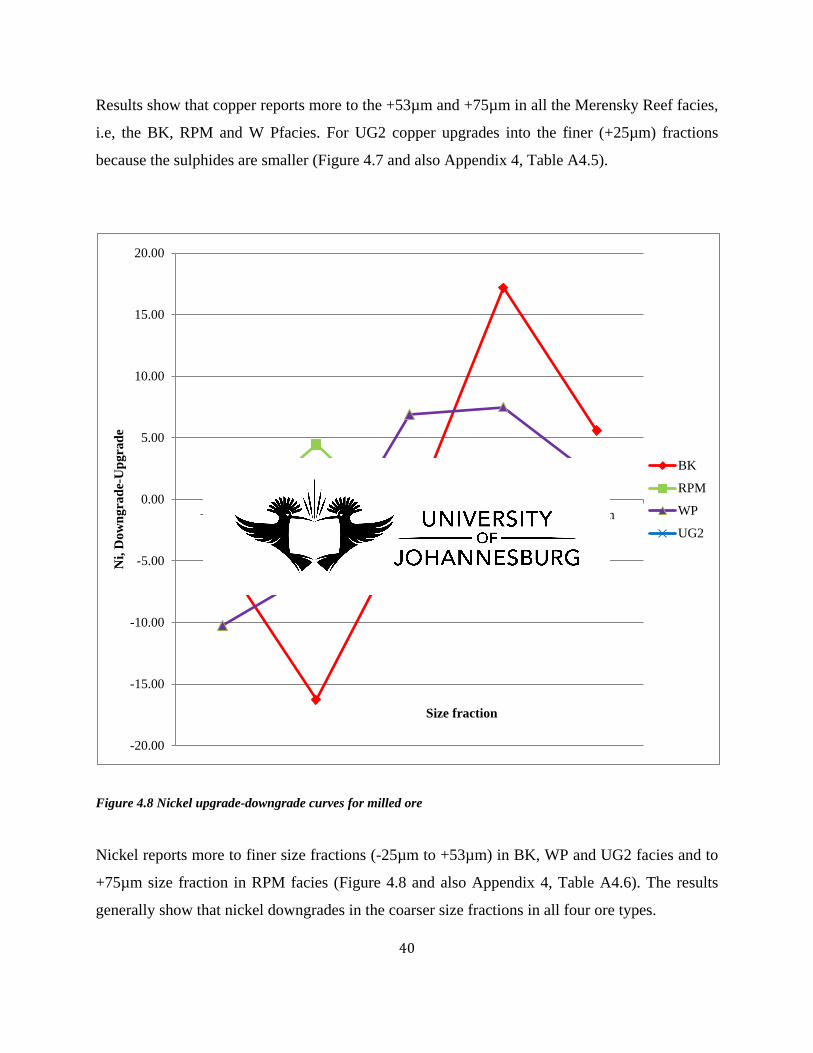
40
Results show that copper reports more to the +53µm and +75µm in all the Merensky Reef facies,
i.e, the BK, RPM and W Pfacies. For UG2 copper upgrades into the finer (+25µm) fractions
because the sulphides are smaller (Figure 4.7 and also Appendix 4, Table A4.5).
Figure 4.8 Nickel upgrade-downgrade curves for milled ore
Nickel reports more to finer size fractions (-25µm to +53µm) in BK, WP and UG2 facies and to
+75µm size fraction in RPM facies (Figure 4.8 and also Appendix 4, Table A4.6). The results
generally show that nickel downgrades in the coarser size fractions in all four ore types.
-20.00
-15.00
-10.00
-5.00
0.00
5.00
10.00
15.00
20.00
+106µm +75µm +53µm +25µm -25µm
Ni,
Dow
ngra
de-U
pgra
de
Size fraction
BK
RPM
WP
UG2

41
Figure 4.9 Sulfur upgrade-downgrade curves for milled ore
Sulphur reports preferentially to the +25µm and +53µm size fractions in BK, RPM and WP
facies. In the UG2 facies, copper upgrades preferentially into the -25µm fraction (Figure 4.9 and
also Appendix 4, Table A4.7). Thus UG2 has finer sulfur grain sizes than the Merensky facies.
Sulfur also slightly downgrades into the coarser size fractions, just like copper and nickel, in all
the Merensky Reef facies and the UG2.
-60.00
-40.00
-20.00
0.00
20.00
40.00
60.00
80.00
100.00
+106µm +75µm +53µm +25µm -25µmS, D
owng
rade
-Upg
rade
Size fraction
BK
RPM
WP
UG2
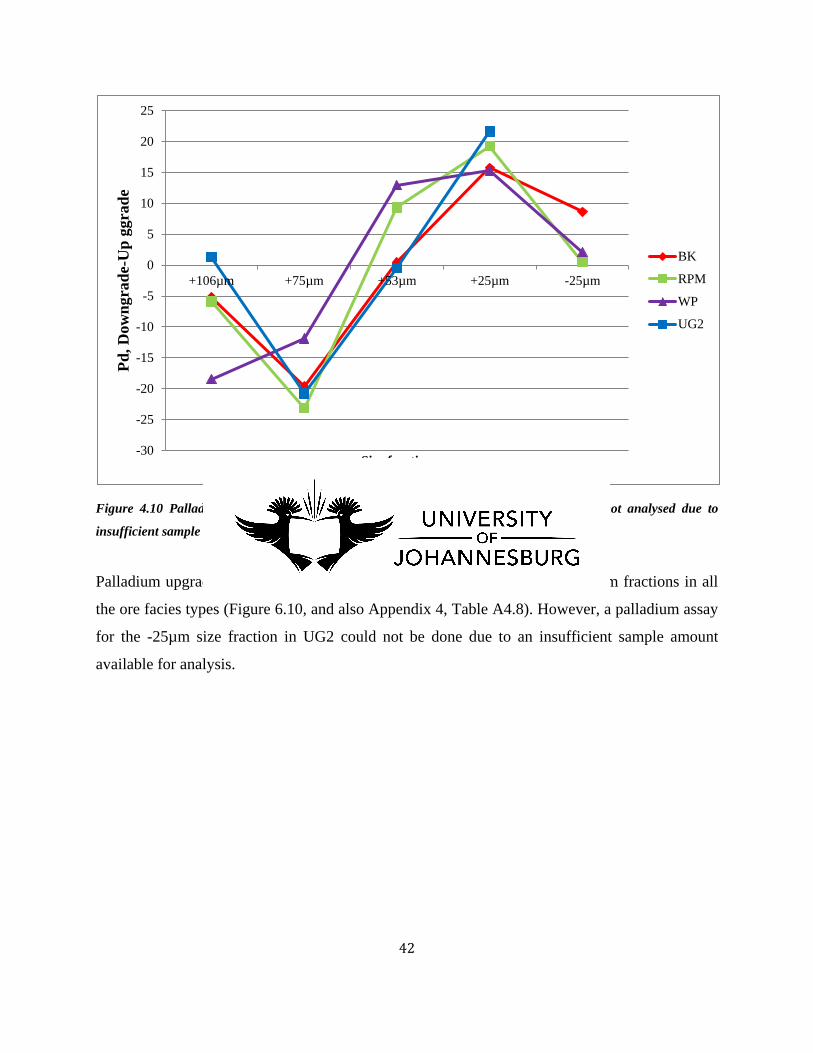
42
Figure 4.10 Palladium upgrade-downgrade curves for milled ore. In UG2, -25µm was not analysed due to
insufficient sample sizes
Palladium upgrades into the +25µm and +53µm, and downgrades in the +75µm fractions in all
the ore facies types (Figure 6.10, and also Appendix 4, Table A4.8). However, a palladium assay
for the -25µm size fraction in UG2 could not be done due to an insufficient sample amount
available for analysis.
-30
-25
-20
-15
-10
-5
0
5
10
15
20
25
+106µm +75µm +53µm +25µm -25µm
Pd, D
owng
rade
-Up
ggra
de
Size fraction
BK
RPM
WP
UG2
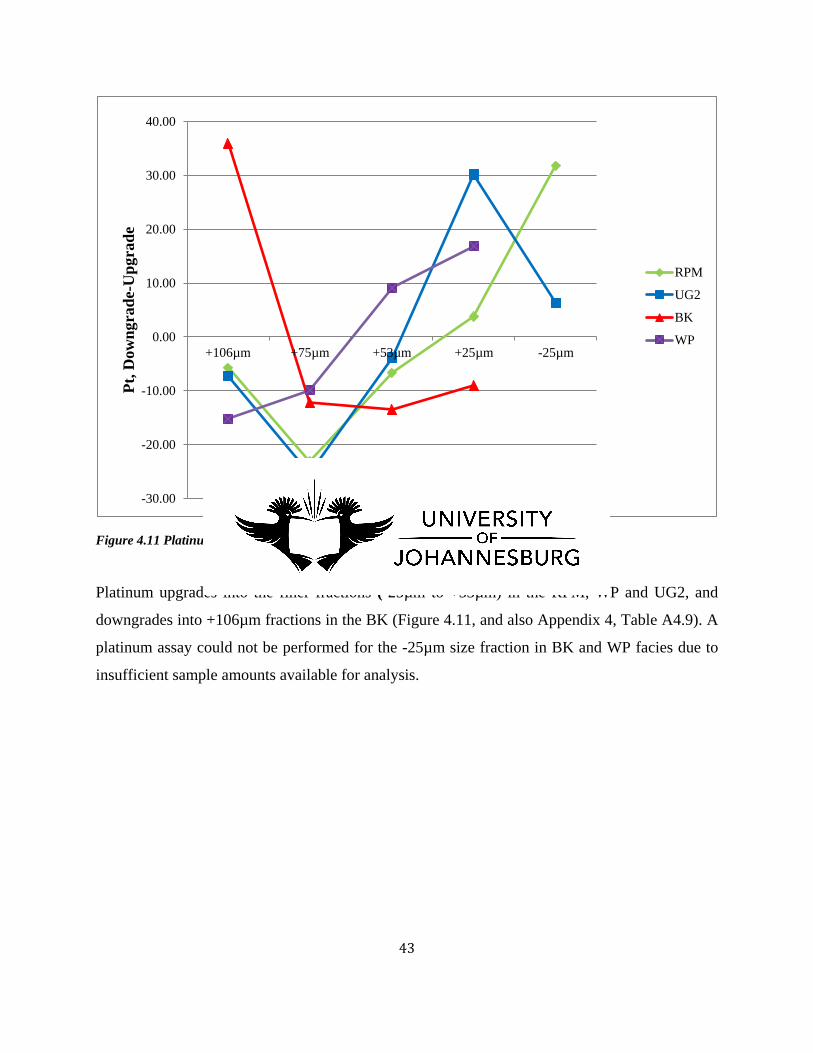
43
Figure 4.11 Platinum upgrade-downgrade curves for milled ores
Platinum upgrades into the finer fractions (-25µm to +53µm) in the RPM, WP and UG2, and
downgrades into +106µm fractions in the BK (Figure 4.11, and also Appendix 4, Table A4.9). A
platinum assay could not be performed for the -25µm size fraction in BK and WP facies due to
insufficient sample amounts available for analysis.
-30.00
-20.00
-10.00
0.00
10.00
20.00
30.00
40.00
+106µm +75µm +53µm +25µm -25µm
Pt, D
owng
rade
-Upg
rade
Size fraction
RPM
UG2
BK
WP

44
CHAPTER 5: FLOTATION TESTS
5.0 INTRODUCTION
This chapter briefly describes flotation performances and recovery efficiencies of BK, RPM, WP
and UG2 facies ores. The modal mineralogy of ore feeds and concentrates, and the liberation and
locking characteristics of the flotation products are also discussed.
5.1 FLOTATION PERFORMANCES
Flotation tests were carried out as described in Appendix 1, Section A1.8, using the reagent suite
shown in Appendix 1, Table A1.1. The flotation test results are shown in Figure 5.1, Tables 5.1-
5.2 and Appendix 4, Table A4.10.
Cumulative mass pull data as function of flotation time is summarized below in Table 5.1.
Table 5.1 Cumulative mass pull rate tests results (g)
Time/minutes 2 4 6 8 20
SAMPLE # Conc-1 Conc-2 Conc-3 Conc-4 Totals/g
BK 29.65 18.7 10.5 10.8 69.65
RPM 25.25 13.25 12.85 12.2 63.55
WP 70.25 41.05 24.85 28.15 164.3
UG2 28.95 16.35 8.4 8.15 61.85
The concentrate amounts reported in this chapter are the averages of two corresponding flotation
test runs for each facies as shown in Appendix 4, Table A4.10.

45
Figure 5.1 Summary of time-cumulative mass pull
Total water recoveries to BK, RPM, WP and UG2 concentrates are shown in Table 5.2.
Table 5.2 Average water recovery (g) per facies type
Facies type Average-water recovery/g
BK 405.6
RPM 387.1
WP 430.2
UG2 411.9
WP ore has the fastest flotation rate and highest overall mass pull, followed by BK, RPM and
finally UG2 (Figure 5.1 and Table 5.1).
Mass pull correlates positively with water recovery for each of the Merensky Reef facies and
UG2 ores (Table 5.1-5.2).
0
20
40
60
80
100
120
140
160
180
0 5 10 15 20 25
Cumulative mass pull/g
Flotation time/minutes
BK
RPM
WP
UG2

46
5.2 MODAL MINERALOGY OF FEEDS AND TIMED CONCENTRATES
Mineral modal abundances in milled feeds and timed concentrates were determined using MLA
(Gu, 2003; Fandrich et al., 2007) as described in Appendix 1, Section A1.7.
The mineral modal abundances results for BK, RPM, WP and UG2 feed and concentrates are
shown in Figures 5.2-5.3 and Appendix 4, Table A4.11.
The results show that the most abundant silicate minerals are augite, enstatite and plagioclase;
and the rest are in minor amounts. Chromite and magnetite are the main oxide minerals present
(Figure 5.2, and Appendix 4, Table A4.11).
The amount of augite and enstatite recovered to concentrate generally increases with flotation
time in all the facies. Chromite recovery to concentrate decreases with increasing flotation time
in the UG2 ore (Figure 5.2a-b).
WP has the highest enstatite recovery in all the timed concentrates of all the facies types. Talc
recovery decreases with flotation time in all four facies (Figure 5.3a-d).
Chalcopyrite, pentlandite and pyrrhotie are the major base metal sulphides recovered to
concentrate in all the facies. Minor amounts of galena are also recovered (Figure 5.2a-d).
Mineral modal abundances of chalcopyrite, pentlandite and pyrrhotie decrease with flotation
time in all four facies (Figure 5.3a-d). Most of the chalcopyrite is recovered to Conc1 in all the
facies, and BK has the highest recovery of chalcopyrite, pentlandite, and pyrrhotite to Conc1 in
all the facies (Figure 5.3a-d).
The PGM present in the feeds are RuS, PtFeSnS, PtTeBi, RhPtAsS, PdBi, PdBiTe and PtPdS
(Table A4.11). RuS is only recovered in BK Conc1, and PtTeBi is recovered in BK Conc3 and
UG2 Conc2 only. PtFeSnS and RhPtAsS are recovered to concentrates in all four facies, and
have decreasing mineral modal abundances with flotation time.
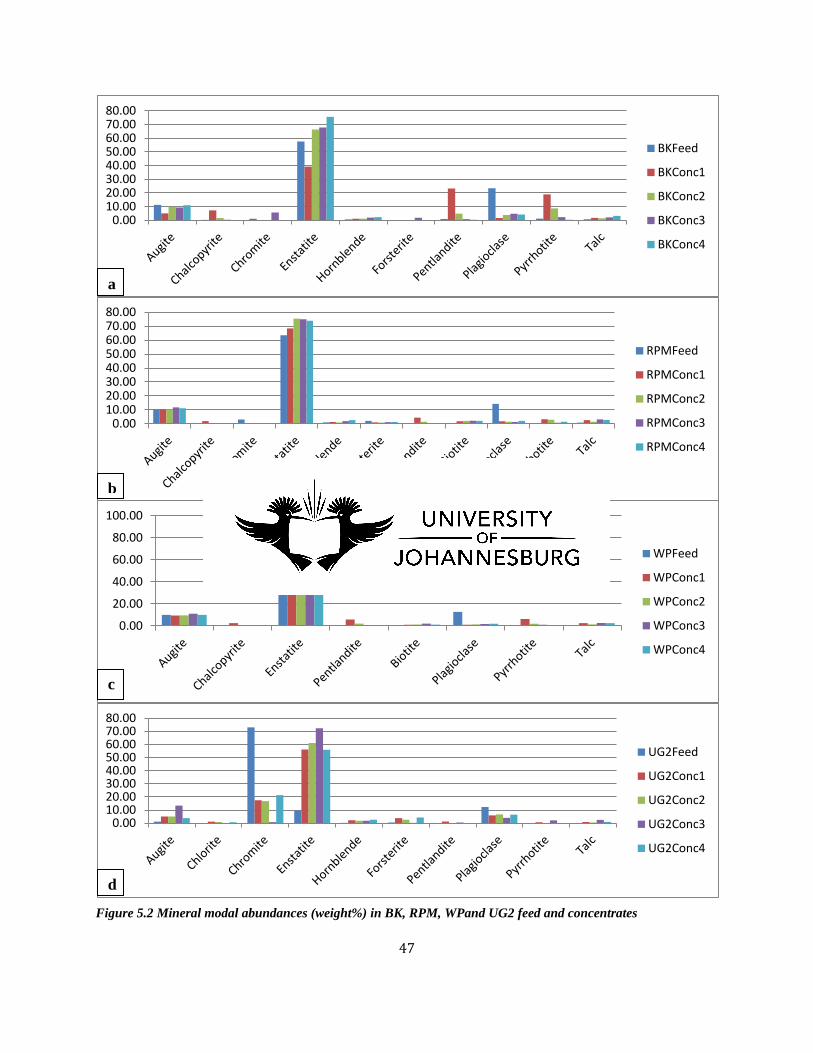
47
Figure 5.2 Mineral modal abundances (weight%) in BK, RPM, WPand UG2 feed and concentrates
0.0010.0020.0030.0040.0050.0060.0070.0080.00
BKFeed
BKConc1
BKConc2
BKConc3
BKConc4
0.0010.0020.0030.0040.0050.0060.0070.0080.00
RPMFeed
RPMConc1
RPMConc2
RPMConc3
RPMConc4
0.00
20.00
40.00
60.00
80.00
100.00
WPFeed
WPConc1
WPConc2
WPConc3
WPConc4
0.0010.0020.0030.0040.0050.0060.0070.0080.00
UG2Feed
UG2Conc1
UG2Conc2
UG2Conc3
UG2Conc4
a
b
c
d
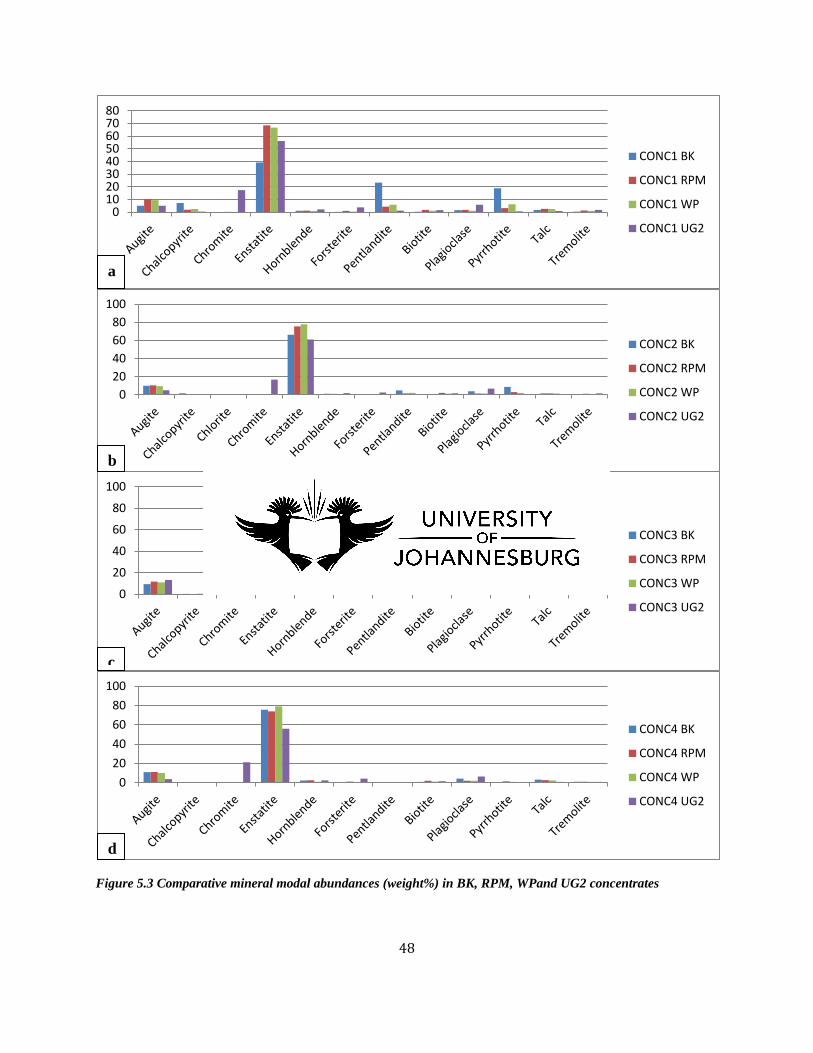
48
Figure 5.3 Comparative mineral modal abundances (weight%) in BK, RPM, WPand UG2 concentrates
01020304050607080
CONC1 BK
CONC1 RPM
CONC1 WP
CONC1 UG2
020406080
100
CONC2 BK
CONC2 RPM
CONC2 WP
CONC2 UG2
0
20
40
60
80
100
CONC3 BK
CONC3 RPM
CONC3 WP
CONC3 UG2
020406080
100
CONC4 BK
CONC4 RPM
CONC4 WP
CONC4 UG2
a
b
c
d

49
PdBi has similar modal abundances in all four ore facies feeds, but it is not recovered to
concentrates. PdBiTe is only present in UG2 ore feed but it is not recovered to concentrates.
PtPdS is recovered only in BK Conc3 (Table A4.11).
5.3 PARTICLE AND SULPHIDES GRAIN SIZE DISTRIBUTION
Sample feeds were prepared as described in Appendix 1, Section A1.6 and subjected to MLA
study as as described in Appendix 1, Section A1.7. The results obtained are shown in Figures
5.4-5.5.
The particle size distribution cumulative curves for the -75+38µm BK, RPM, WP and UG2
sieved feeds show that all four facies have almost the same particle sizes, shown by the
superimposition of the four curves on each (Figure 5.4).
The sulphide minerals grain size distributions in BK, RPM, and WP are similar and those in UG2
are finer (Figure 5.5).

50
Figure 5.4 Cumulative particle size distribution for the BK, RPM, WPand UG2 facies milled feeds, -75+38µm
fraction (as equivalent circle diameters) in microns
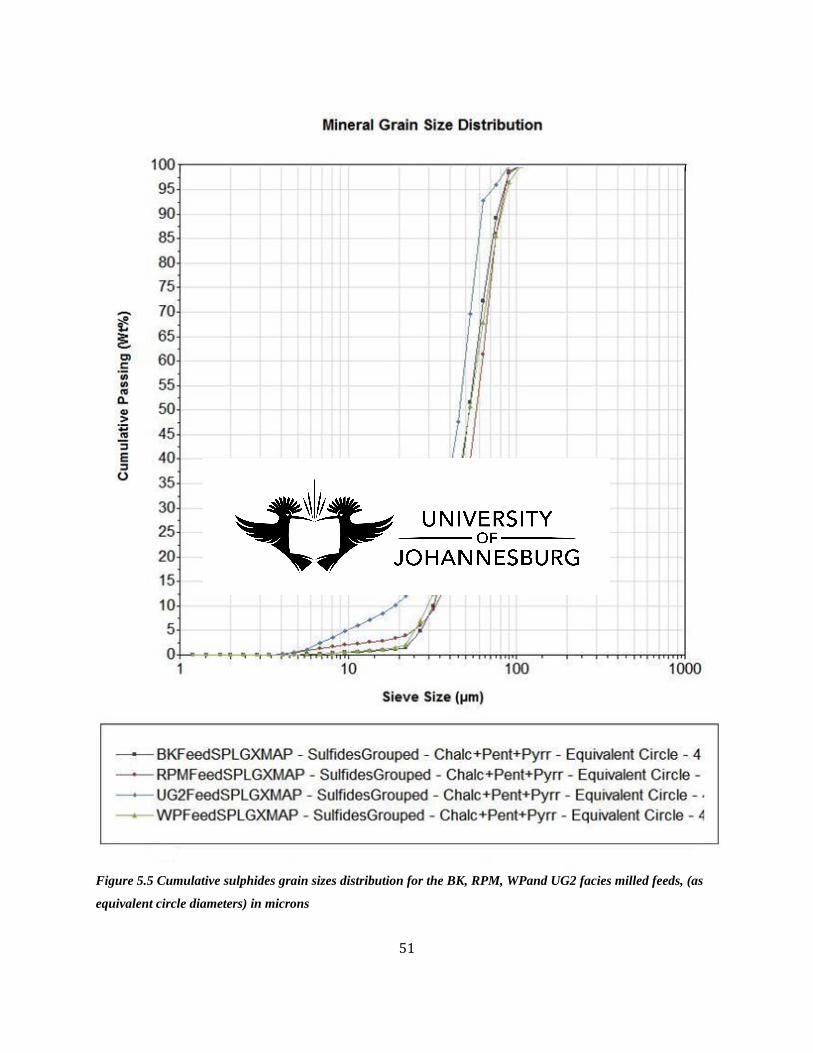
51
Figure 5.5 Cumulative sulphides grain sizes distribution for the BK, RPM, WPand UG2 facies milled feeds, (as
equivalent circle diameters) in microns

52
5.4 SULPHIDES LIBERATION ANALYSES IN FEEDS
Total sulphides (chalcopyrite+ pentlandite + pyrrhotite) mineral liberation analyses of the BK,
RPM, WP and UG2 ore facies feeds, on the basis of mineral liberation by free surface (i.e,
surface area exposure of sulphide minerals), were done as outlined in Appendix 1, Section A1.7.
The results obtained are shown in Figure 5.6.
The results show that the sulphides liberations in BK, RPM and WP are all similar, with BK
being the most liberated. UG2 is less liberated than the Merensky Reef facies.
The results also show that the degree of sulphides liberation correlates positively with
cumulative mass recovery of liberated sulphides.

53
Figure 5.6 Cumulative liberation yields for sulphides in the milled samples prior to flotation

54
5.5 COMPARISON OF SULPHIDES LIBERATION IN ORE FEEDS AND CONCENTRATES
Comparative sulphides liberation results for BK, RPM, WP and UG2 feed and concentrates are
shown in Figures 5.7-5.10.
Figure 5.7 Cumulative liberation yields for sulphides in BKFeed, BKConc1, BKConc2, BKConc3 and BKConc4

55
Figure 5.8 Cumulative liberation yield for sulphides in RPMFeed, RPMConc1, RPMConc2, RPMConc3 and
RPMConc4
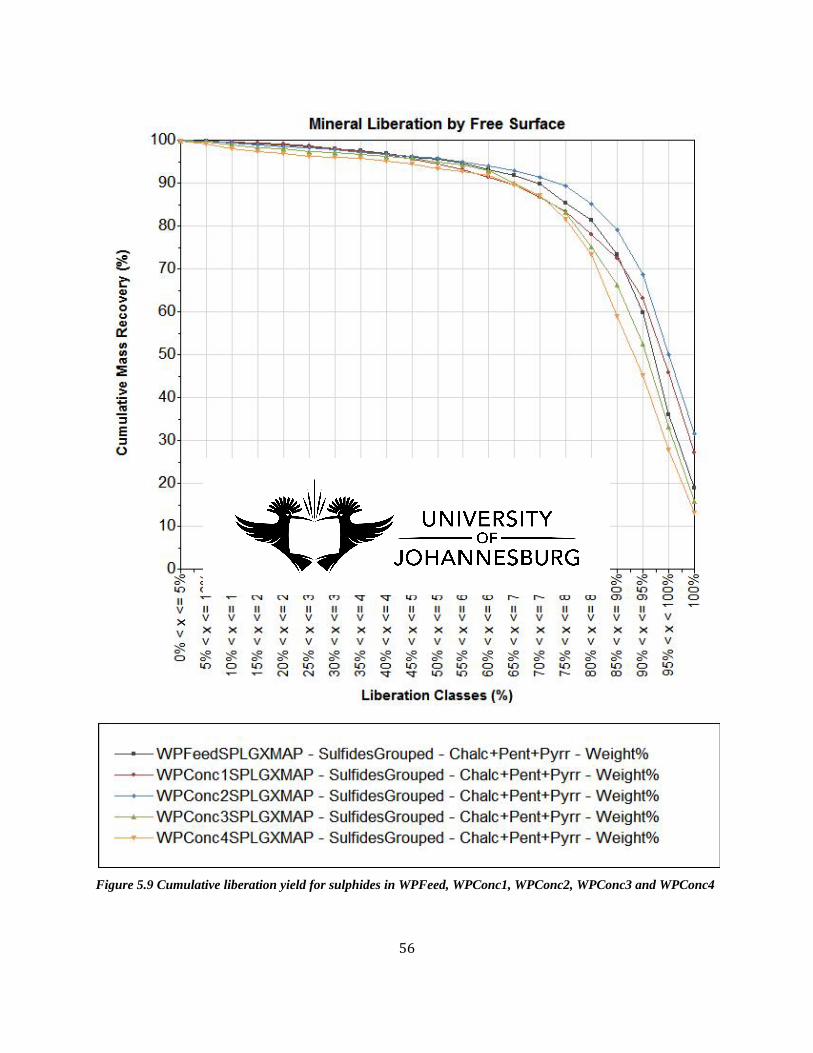
56
Figure 5.9 Cumulative liberation yield for sulphides in WPFeed, WPConc1, WPConc2, WPConc3 and WPConc4
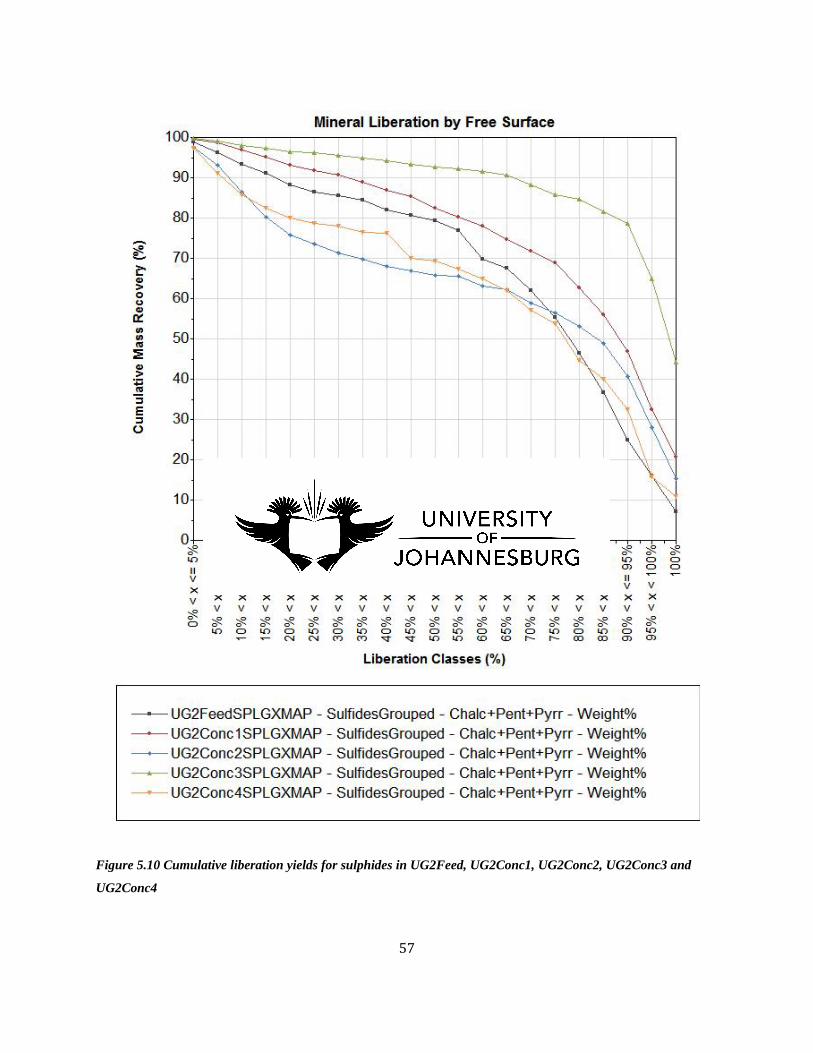
57
Figure 5.10 Cumulative liberation yields for sulphides in UG2Feed, UG2Conc1, UG2Conc2, UG2Conc3 and
UG2Conc4

58
Figures 5.7-5.10 and Table A4.11 show that the flotation speed and recovery of sulphides to
concentrates are a function of liberation, that is, the more liberated the sulphides the faster they
float.
BK, RPM and WP have the highest apparently liberated sulphides in Conc2 (i.e 100% liberated
sulphides), while Conc3 has the highest apparently liberated sulphides in UG2 (Figure 5.7-5.10).
Conc4 has the least apparently liberated sulphides among the concentrates in all the Merensky
Reef facies and the UG2. Merensky Reef facies’ Conc3 and Conc4 have lower apparently
liberated sulphides than their corresponding feeds (Figure 5.7-5.9). All concentrates in UG2 have
higher apparently liberated sulphides than the feed (Figure 5.10).
5.6 MINERAL ASSOCIATION AND LOCKING
Mineral locking refers to an association of a mineral of interest with other minerals in an
unliberated state, either enclosed within or attached to those other minerals. Binary particles are
made up of a mineral of interest and one other mineral, whereas ternary particles are made up of
the mineral of interest in association with two or more other minerals either enclosed or attached
to them (Petruk, 2000).
In this study, the mineral of interest are the grouped sulphides
(chalcopyrite+pentlandite+pyrrhotite). The mineral locking data obtained using
MLA_SPLGXMAP as described in Appendix 1, Section A1.7 are shown in Figure 5.11-5.13 and
Table A4.12.
Figure 5.11 shows that the total liberated sulphides in BK, RPM, WP and UG2 are about
87wt.%, 83wt.%, 82wt.% and 58wt.% respectively, and the balance occurs as locked in or in
association with binary and ternary particles.

59
In the Merensky Reef facies the grouped sulphides form binary particles mainly with enstatite,
plagioclase and RhPtAsS; and in UG2 they form binary particles with chromite, enstatite,
hornblende, plagioclase, PtFeSnS, RuS, PtPdS and RhPtAsS (Figure5.12a-d).
Ternary particles form in association with augite, enstatite, hornblende, plagioclase and
magnetite in the Merensky Reef facies, whereas in UG2 grouped sulphides form ternary particles
in association with augite, chromite, enstatite, hornblende, forsterite, orthoclase, biotite,
plagioclase, PtS, quartz, PtPdS and magnetite (Figure 5.13a-d).

60
Figure 5.11 Comparative mineral recoveries as liberated, binary and ternary composite mineral particles for
BKFeed, RPMFeed, WPFeed and UG2Feed

61
Figure 5.12a-d: MLA based SPLGXMAP Chalcopyrite+Pentlandite+Pyrrhotite wt.% locked in binary particles in
feed
Figures 5.11-5.12 indicate that a larger fraction of the locked sulphides is hosted in binary
particles than in ternary particles.
0.001.002.003.004.005.00
BK_Mineral Locking for Chalc+Pent+Pyrr - Binary Particle (%)
0.001.002.003.004.00
RPM_Mineral Locking for Chalc+Pent+Pyrr - Binary Particle (%)
0.002.004.006.008.00
Aug
iteC
alci
teC
hrom
iteE
nsta
tite
Hor
nble
nde
Bio
tite
Plag
iocl
ase
PtFe
SnS
Qua
rtz
Tal
cT
rem
olite
RhP
tAsS
Mag
netit
e
WP_Mineral Locking for Chalc+Pent+Pyrr - Binary Particle (%)
0.002.004.006.008.00
Aug
iteC
alci
teC
hlor
iteC
hrom
iteE
nsta
tite
Hor
nble
nde
Ort
hocl
ase
Bio
tite
Plag
iocl
ase
PtFe
SnS
RuS
PtPd
SR
hPtA
sSM
agne
tite
UG2_Mineral Locking for Chalc+Pent+Pyrr- Binary Particle (%)

62
Figure 5.13a-d: MLA based SPLGXMAP Chalcopyrite+Pentlandite+Pyrrhotite wt.% locked in ternary particles
in feed
5.7 FLOTATION RECOVERY EFFICIENCY ANALYSES
PGE flotation recovery efficiencies could not be determined directly from recovered
concentrates due to low concentrate sample recoveries, but were calculated based on weights of
feeds and tails and assay values (Table A4.13) obtained as described in Appendix 1, Section
A1.9 and Table A1.2.
The PGE and gold recovery efficiencies were calculated as shown in Appendix 5, Example 3.
Flotation recovery efficiency results for Au, PGE, base metals and sulfur are shown in Tables
5.3-5.4.
0.000.200.400.600.80
Aug
iteC
alci
teC
hlor
iteE
nsta
tite
Hor
nble
nde
Fors
teri
teO
rtho
clas
eB
iotit
ePl
agio
clas
eQ
uart
zT
alc
Tre
mol
iteR
hPtA
sSM
agne
tite
BK_Mineral Locking for Chalc+Pent+Pyrr - Ternary+ Particle (%)
0.00
0.50
1.00
1.50
Aug
iteC
alci
teC
hrom
iteE
nsta
tite
Hor
nble
nde
Fors
teri
teB
iotit
ePl
agio
clas
ePt
FeSn
SQ
uart
zT
alc
RhP
tAsS
Mag
netit
e
RPM_Mineral Locking for Chalc+Pent+Pyrr - Ternary+ Particle (%)
0.000.200.400.600.801.00
Aug
iteC
alci
teC
hrom
iteE
nsta
tite
Gal
ena
Hor
nble
nde
Fors
teri
teO
rtho
clas
ePl
agio
clas
ePt
FeSn
SQ
uart
zSe
rpen
tine
Tal
cT
rem
olite
PtPd
SR
hPtA
sSM
agne
tite
WP_Mineral Locking for Chalc+Pent+Pyrr - Ternary+ Particle (%)
0.000.501.001.502.002.503.003.50
UG2_Mineral Locking for Chalc+Pent+Pyrr - Ternary+ Particle (%)
a b
c d

63
Gold recovery in the Merensky Reef facies ranges from 78.5% to 84.4wt.%, while the gold
recovery in UG2 is ~ 62.8wt.%. BK facies has the highest PGE recovery, followed by WP, all
with recoveries of above 90%, except Ru in WP. RPM and UG2 have similar PGE recoveries
(Table 5.3).
The gold and PGE recovery in the Merensky Reef facies positively correlates with sulphide
modal abundances (Table 3.1) and sulphide liberation (Figure 5.6). This suggests that these PGE
are mostly hosted in sulphides as PGM since they were recovered by the bulk sulphide flotation
process (Wiese et al., 2005, 2006, and 2007). Lower recovery of iridium, osmium and ruthenium
in UG2 and RPM suggests that these PGE are not entirely hosted in base metal sulphides.
The Au recovery in both the Merensky Reef and UG2 could imply that most of the gold could
have been hosted in sulphides or in solid solution in sulphide hosted PGM or as part of the PGM
mineral chemistry association or alloys. Or it exists as free gold.
Flotation recovery efficiencies for the base metals and sulphur were calculated as shown in
Appendix 5, Example 4. Overall copper flotation recovery efficiencies range from 96% to
100wt.% in all the facies (Table 5.4). Co, Cu and Ni generally correlate positively with sulphide
modal abundances (Table 3.1). Ni flotation recovery efficiency is generally lowest and the most
variable.
The low nickel flotation recovery efficiencies could imply that some of the nickel not recovered
by bulk sulphide flotation is probably hosted in non-sulphide mineral phases such as pyroxenes,
olivine or serpentine (Wiese et al., 2005).

64
Table 5.3 Flotation efficiency percentages (wt.%) of PGE for BK, RPM, WPand UG2 facies
based on feed and tails weights and assays
Facies Type
Element type
Flotation efficiency (%)
Based on Feed and Tails
Facies Type Element type Flotation efficiency (%)
Based on Feed and Tails
BK Au 80.80 WP Au 84.37
Ir 92.26 Ir 91.10
Os 91.39 Os 90.92
Pt 96.03 Pt 93.58
Pd 96.95 Pd 94.27
Rh 97.29 Rh 91.69
Ru 90.17 Ru 87.62
RPM Au 78.46 UG2 Au 62.77
Ir 84.62 Ir 89.28
Os 82.77 Os 82.89
Pt 94.74 Pt 93.77
Pd 91.14 Pd 94.04
Rh 92.34 Rh 93.23
Ru 80.69 Ru 83.35
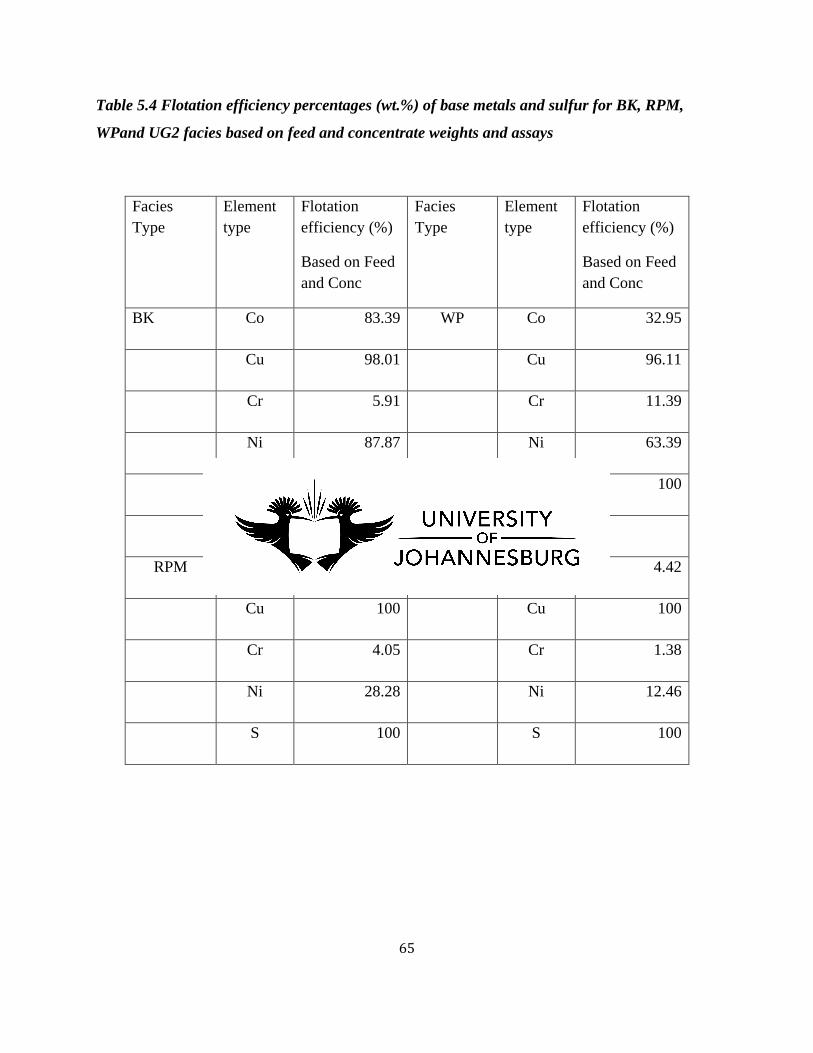
65
Table 5.4 Flotation efficiency percentages (wt.%) of base metals and sulfur for BK, RPM,
WPand UG2 facies based on feed and concentrate weights and assays
Facies Type
Element type
Flotation efficiency (%)
Based on Feed and Conc
Facies Type
Element type
Flotation efficiency (%)
Based on Feed and Conc
BK Co 83.39 WP Co 32.95
Cu 98.01 Cu 96.11
Cr 5.91 Cr 11.39
Ni 87.87 Ni 63.39
S 100 S 100
RPM Co 14.63 UG2 Co 4.42
Cu 100 Cu 100
Cr 4.05 Cr 1.38
Ni 28.28 Ni 12.46
S 100 S 100

66
5.8 FLOTATION PERFORMANCE ANALYSES
Flotation performances of the four reef types were evaluated in terms of mass pull, grade and
recovery, based only on copper, nickel and sulphur. The flotation performance results for the
Merensky Reef facies and UG2 ore are shown in Figures 5.14-5.15 and also Appendix 4, Table
A4.14. These results were calculated as shown in Appendix 5, Example 4.
Cumulative percentage recoveries of copper, nickel and sulphur as functions of flotation times
are presented in Figure 5.14a-c.
Th results in Figure 5.14a indicate that BK facies ore has the fastest initial copper recovery rate
in the first 10 minutes, and then slows down, and finally reaching an overall copper recovery of
about 98%. The RPM, WPand UG2 ores have similar initial recovery rates. RPM and UG2 have
overall copper recoveries of 100wt.%, while BK and WP have slightly lower than 100wt.%
recoveries.
Ni flotation recovery rates are variable, decreasing from BK, WP, RPM to UG2 (Figure 5.14b).
The BK ore had the fastest nickel flotation recovery rate, with about 80wt.% nickel recovery in
the first 10 minutes and an overall recovery of about 88wt.% (Figure 5.14b, and also Table 5.4).
The WP ore had the second fastest nickel flotation recovery rate, with about 60% recovery in the
first 10 minutes and an overall nickel recovery of 64wt.%.
The nickel recovery was slightly faster in the RPM ore than UG2 ore. The RPM and UG2 ores
had overall flotation recoveries of about 28.3% and 12.5wt.% respectively.
This trend correlates positively with sulphide modal abundances (Table 3.1) and sulphides
liberation extent (Figure 5.6).
Sulphur flotation recovery rates are identical for the BK, RPM, WPand UG facies; however the
initial recovery rates for BK and UG2 are slightly higher than those for RPM and WP. All four
facies have overall sulfur flotation recoveries of 100wt.% (Figure 5.14c).

67
Figure 5.14a-c: Cumulative flotation recovery of copper, nickel and sulphur as function of flotation time for BK,
RPM, WPand UG2 facies
0.0020.0040.0060.0080.00
100.00120.00
0 5 10 15 20 25
Cu
reco
very
,%
Flotation time/min
BKRPMWPUG2
0.00
20.00
40.00
60.00
80.00
100.00
0 5 10 15 20 25
Ni r
ecov
ery,
%
Flotation time/min
BKRPMWPUG2
0
20
40
60
80
100
120
0 5 10 15 20 25
Cum
ulat
ive
S re
cove
ry,%
Flotation time, min
BKRPMWPUG2
a
b
c

68
Results of cumulative grades as function of mass pull percentages for BK, RPM, WP and UG2
ores are shown in Figure 5.15a-c.
BK has the highest overall copper and Ni grades and UG2 has the lowest. RPM and WP have
similar overall grades, but slightly higher than the UG2 (Figure 5.15a-b). BK also has the highest
overall sulfur grade as function of cumulative mass pull percentage, followed by WP (Figure
5.15c). RPM and UG2 have the lowest overall sulfur grade. These results correlate positively
with sulphide modal abundances and liberation in BK facies, that is, BK has the highest sulphide
abundance and the most liberated sulphides (Table 3.1, Figure 5. 6).
The overall lower Cu, Ni and S grades in RPM, WP and UG2 correlate positively to the
abundant orthopyroxene in RPM and WP and the chromite in UG2 (Table 3.1, and also
Appendix 4, Table A4.11). BK has the highest Ni, Cu and S grades and the least orthopyroxene
modal abundance.

69
Figure 5.15a-c: Cumulative grade of Cu, Ni and S in the flotation concentrate as a function of cumulative mass
pull percent
0
0.5
1
1.5
2
2.5
3
0 5 10 15 20
Cum
ulat
ive
Cu
gra
de %
Cumulative mass pull %
BKRPMWPUG2
0
1
2
3
4
5
6
7
0 5 10 15 20
Cum
ulat
ive
Ni g
rade
%
Cumulative mass pull%
BKRPMWPUG2
0
2
4
6
8
10
12
0 5 10 15 20
Cum
ulat
ive
S gr
ade
%
Cumulative mass pull %
BKRPMWPUG2
a
b
c
70
5.9 GRADE AND RECOVERY ANALYSES
Results of Cu, Ni and S grades as function of cumulative recovery percentages for the Merensky
Reef facies and UG2 ores are shown in Figure 5.16a-c and also in Appendix 4, Table A4.14.
BK, RPM and UG2 have 100% Cu recovery. WP has slightly less than 100% Cu recovery. BK
has the highest and UG2 the lowest Cu grades. RPM and WP have similar Cu grades (Figure
5.16a).
BK also has the highest Ni grade and recovery and UG2 has the lowest grade and recovery
(Figure 5.16b). Sulfur recovery is 100% for all the facies (Figure 5.16c). However, BK has the
highest grade followed by WP. RPM and UG2 have the lowest grades. Consistently higher
grades and recoveries for BK correlate positively with sulphides modal abundances (Table 3.1)
and the degree of sulphides liberation (Figure 5.6).
The 100% S recovery in all the facies may imply that all base metals, gold and PGM associated
with or hosted in sulphides are recovered to concentrates. The low Ni recoveries could also
imply that Ni in the facies is not hosted in pentlandite and pyrrhotite only. It could be hosted in
other mineral phases which are not amenable to bulk sulphide flotation such as orthopyroxene,
serpentine and olivine (Appendix 4, Table A4.11).

71
Figure 5.16a-c: Cu, Ni, and S grades as function of recovery curves for BK, RPM, WPand UG2 facies
0
0.5
1
1.5
2
2.5
3
0 20 40 60 80 100 120
Cum
ulat
ive
Cu
grad
e, %
Cumulative Cu recovery,%
BKRPMWPUG2
0
1
2
3
4
5
6
7
0.00 20.00 40.00 60.00 80.00 100.00
Cum
ulat
ive
Ni g
rade
,%
Cumulative Ni recovery,%
BKRPMWPUG2
0
2
4
6
8
10
12
0 20 40 60 80 100 120
Cum
ulat
ive
S gr
ade,
%
Cumulative S recovery, %
BKRPMWPUG2
a
b
c
72
CHAPTER 6: DISCUSSIONS 6.1 INTRODUCTION
This chapter discusses the results from the preceding chapters and relates them to some of the
findings of other researchers in the field of geometallurgy.
6.2.1 MINERALOGY
This study has shown that BK, RPM, WP and UG2 reef facies at Lonmin’s Marikana Mine have
variable silicate and base metal sulphide modal mineralogy (Table 3.1), which is in agreement
with previous researchers (Kinloch, 1982; Gruenewaldt et al., 1986; Penberty et al., 2000 and
references therein). The base metal sulphides are concentrated at and /or around the chromitite
stringers within the Merensky Reef facies (Figure 3.2-3.4, Appendix 2, and Table A2.1-A2.3).
The UG2 reef facies has the least sulphide modal abundance (Table 3.1, and Table A2.4), and the
sulphides are distributed more in the pyroxenite portion, that is, towards the edge of the
chromitite reef (Figure 3.5, and Table A2.4).
6.2.2 GEOCHEMISTRY
PGE, Cr, Cu, Ni, and S are concentrated at and/ or about the chromitite stringers positions in the
BK, RPM, and WP facies (Figure 3.6-3.8), as observed by previous researchers (Davey., 1992;
Lonmin Guide., 2006; and Viljoen et al., 2012).
The assay values obtained for the PGE, the base metals and sulphur for the BK, RPM and WP
facies respectively, are shown in Appendix 3, Table A3.1-A3.3.
In the UG2 reef, Cr, Cu and Ni are concentrated in the middle of the reef. S only occurs more
abundantly in the pyroxenite portion of the reef, though in trace amounts (Figure 3.9 and Table
A3.4).

73
The PGE are highly concentrated at the base of the chromitite reef with values of 11.57ppm,
8.82ppm, 2.11ppm and 2.27ppm for Pd, Pt, Rh and Ru respectively, which is in agreement with
previous observations (McLaren and De Villiers, 1982; Davey, 1992; Schouwstra et al., 2000
and references therein). Ruthenium is the most abundant of all the other PGE, with the exception
of Pd and Pt, which is in agreement with some previous researchers (Kinloch, 1982; McLaren
and De Villiers, 1982; von Gruenewaldt et al., 1986; Schouwstra., 2000 and references therein),
who observed that laurite (RuS2) is more associated with chromite grains, whereas the other PGE
are more associated with the base metal sulphides.
6.2.3 MILLING
The milling times required to achieve a grind of 60wt.% passing 75µm sieve were 40.7, 36.7,
32.9 and 31.4 minutes for the BK, RPM, WP and UG2 respectively (Figures 4.1-4.5 and Table
4.1).
The milling times decrease from BK to WP facies. This trend correlates positively with the
decreases in modal abundances of anorthite (Table 3.1). This can be explained in terms of the
mineralogical hardness of anorthite as compared to enstatite, augite and chromite. Anorthite has
a hardness of 6-6.5 on Mohs scale, compared to enstatite with 5.5, augite 5-6 and chromite 5.5
respectively (Deer et al., 1992).
Therefore the BK facies (with 31.1wt.% anorthite) needs the longest milling time (40.7 minutes),
in contrast to RPM (with 20.6wt.% anorthite, 36.7 minutes) and WP (with 15.7wt.% anorthite,
32.9 minutes) (Table 3.1 and Table 6.1). Quartz, though occurring in minor amounts, probably
acts as a grinding medium due to its hardness (Craig and Vaughan, 1994). That is, as quartz
content increases the effective grinding media (steel rods plus quartz) also increase leading to
reduced times required to achieve the grind of 60% passing 75µm, and the less the quartz content
the longer the time required to achieve the required grind (0.14% quartz required 40.7 minutes,
compared to 0.46wt.% quartz requiring 36.7 minutes and 0.76wt.% quartz requiring 32.9 minutes
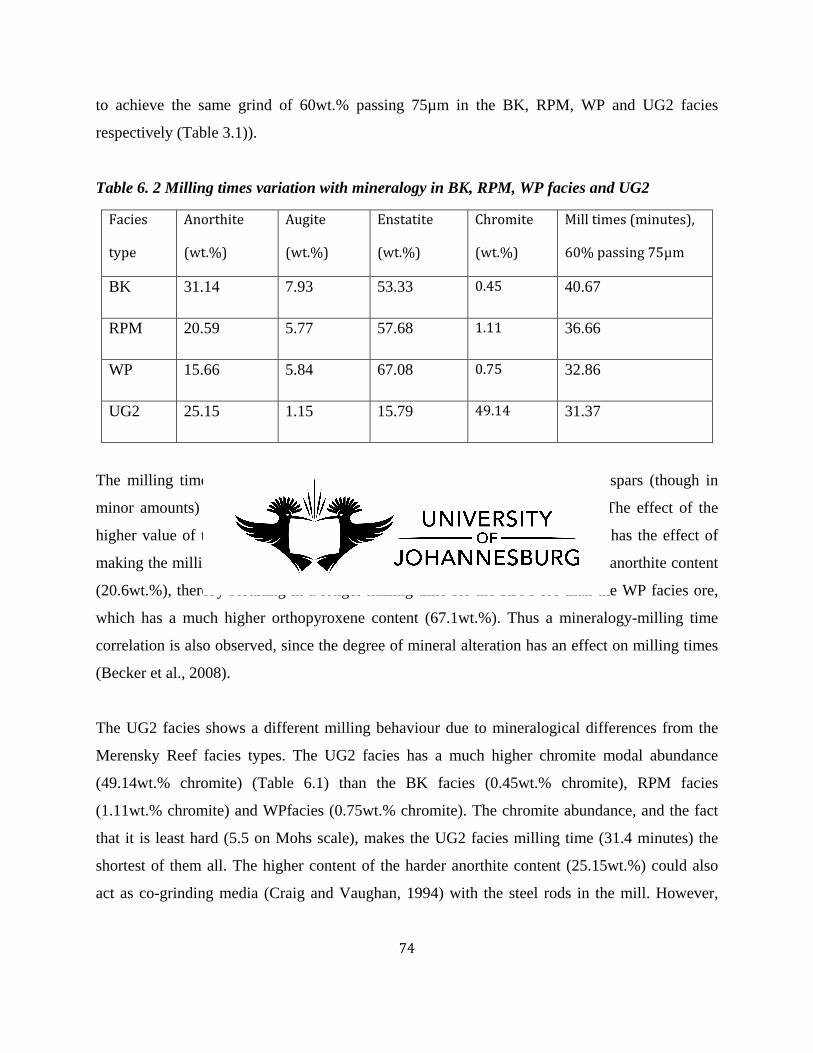
74
to achieve the same grind of 60wt.% passing 75µm in the BK, RPM, WP and UG2 facies
respectively (Table 3.1)).
Table 6. 2 Milling times variation with mineralogy in BK, RPM, WP facies and UG2
Facies
type
Anorthite
(wt.%)
Augite
(wt.%)
Enstatite
(wt.%)
Chromite
(wt.%)
Mill times (minutes),
60% passing 75µm
BK 31.14 7.93 53.33 0.45 40.67
RPM 20.59 5.77 57.68 1.11 36.66
WP 15.66 5.84 67.08 0.75 32.86
UG2 25.15 1.15 15.79 49.14 31.37
The milling times also decrease with increasing modal abundances of K-feldspars (though in
minor amounts) from BK, RPM, and WP (Table 3.1) (Becker et al., 2008). The effect of the
higher value of the combined alteration minerals for RPM (8.36wt.%), which has the effect of
making the milling time shorter than that of WP is reduced by the higher RPM anorthite content
(20.6wt.%), thereby resulting in a longer milling time for the RPM ore than the WP facies ore,
which has a much higher orthopyroxene content (67.1wt.%). Thus a mineralogy-milling time
correlation is also observed, since the degree of mineral alteration has an effect on milling times
(Becker et al., 2008).
The UG2 facies shows a different milling behaviour due to mineralogical differences from the
Merensky Reef facies types. The UG2 facies has a much higher chromite modal abundance
(49.14wt.% chromite) (Table 6.1) than the BK facies (0.45wt.% chromite), RPM facies
(1.11wt.% chromite) and WPfacies (0.75wt.% chromite). The chromite abundance, and the fact
that it is least hard (5.5 on Mohs scale), makes the UG2 facies milling time (31.4 minutes) the
shortest of them all. The higher content of the harder anorthite content (25.15wt.%) could also
act as co-grinding media (Craig and Vaughan, 1994) with the steel rods in the mill. However,

75
UG2 ore has a much lower combined modal abundance of alteration minerals (2.14wt.%) than
both the RPM and WPfacies ores (Table 3.1).
Mineralogical characteristics such as mineral type, texture, modal abundance, mineral alteration
and hardness of the Merenky Reef facies and the UG2 also account for the amount of initial fines
produced by the initial crushing stage, with BK facies having 12.5wt.% of particles passing
75µm, RPM (13.24wt.% passing 75µm), WP (12.2wt% passing 75µm) and UG2 (6.7wt.%
passing 75µm) (Figures 4.1-4.4 (intercepts)) respectively. The higher modal abundances of the
harder anorthite and alteration minerals tend to produce more fines than the softer minerals such
as chromite (in UG2) during the crushing stage to produce a -2mm sample (Becker et al., 2008).
However, the milling results obtained in this study contrast with the results of Brough et al
(2010), who found that the anorthite rich NP2 reef of the Merensky Reef at Northam Platinum
Mine (with ~63wt.% plagioclase) has the shortest milling time compared to the Normal and the
P2 reef (with <17wt.% plagioclase).
6.2.4 GRADING ANALYSIS
Grading analysis (Figure 4.6) indicates that BK, RPM, WP and UG2 milled ore feeds all have
particles finer than the target grind of 60wt.% passing 75µm. However, WP particles are the
coarsest and BK the finest. This result correlates positively with the observation made in Section
4.1, which shows that the ore with the most abundant anorthite generally produces the largest
amount of fine particles among the Merensky Reef facies.
6.2.5 ELEMENTAL DEPORTMENT
Deportment analyses (Section 4.3) show that copper, nickel, sulphur, platinum and palladium are
distributed in various fractions of the milled ore (Grammatikopoulos et al., 2004; Olubambi et
al., 2006; Dai et al., 2008; Goodall, 2008; Kapsios et al., 2010 and Coetzee et al., 2011),
but more preferentially reporting to finer size fractions (≤75µm fraction). This is more dominant
76
especially in the -25µm and +25µm size fractions, probably due to the small grain size nature of
sulphides (Figure 5.5) and PGM in the Merensky Reef and UG2 chromitite reef (Kinloch, 1982;
McLaren and De Villiers, 1982; Gruenewaldt et al., 1986; Penberty et al., 2000 and references
therein). This might also imply that the base metal sulphides and PGM are better liberated in the
finer fractions (Ford et al., 2011). The downgrading of copper, nickel, sulfur, palladium and
platinum in the coarser size fractions may imply incomplete liberation of the base metal
sulphides which host these elements.
6.2.6 MASS PULLS AND MINERALOGY
Cumulative mass pulls for the facies decrease in the order WP, BK, RPM and UG2 (Figure 5.1).
This correlates positively with the combined modal abundances of naturally floatable gangue
(pyroxenes) (Table 3.1) and talc-induced, copper ions and nickel ions activated floatable gangue
minerals (augite, enstatite, plagioclase, chromite, and talc) (Senior et al., 1995; Malysiak et al.,
2004; Jasieniak and Smart, 2009 and 2010) (Section 5.2).
6.2.7 MINERALOGY OF FEEDS AND CONCENTRATES
The increasing modal abundances of augite and enstatite in concentrates with flotation time
(Figure 5.2) show that these minerals are naturally floatable (Lotter et al., 2008; Becker et al.,
2009), and they are the main diluents of metal grades observed in Section 5.9.
Almost all the chalcopyrite is recovered in Conc1; and pentlandite is recovered in Conc1-Conc2
in decreasing amounts. Pyrrhotite is recovered in Conc1-Conc4 also in decreasing amounts in the
Merensky Reef facies, but in increasing amounts in the UG2 (Figure 5.2). This trend is in
agreement with observations that chalcopyrite is the fastest floating sulphide, followed by
pentlandite, and pyrrhotite being the slowest floating sulphide (Miller et al., 2005; Wiese et al.,
2006; Becker et al., 2008).

77
PtFeSnS, RhPtAsS and PtTeBi are recovered in Conc1-Conc4 in almost all the facies, but RuS is
recovered only in Conc1. These results are in agreement with Penberty et al (2000), who
observed that these PGM are slow floaters, and RuS is a fast floating mineral.
6.2.8 PARTICLE SIZE AND SULPHIDE GRAIN SIZE DISTRIBUTIONS
The particle size distributions in the -75+38µm sized fractions are all similar for the Merensky
Reef facies types and finer for the UG2 (Figure 5.4).
Sulphides grain size distribution variations in all three Merensky Reef ore types are also
generally similar, but finer in UG2 ore (Figure 5.5). Therefore a finer grind for UG2 ore is
usually required to completely liberate the base metal sulphides and PGM, such as 70-80wt.%
passing 75µm (Hay and Roy, 2010).
6.2.9 SULPHIDE LIBERATION IN FEEDS
Cumulative liberation yields for sulphides in the milled samples prior to flotation decrease in the
order BK, RPM, WP and UG2 (Figure 5.6). This shows a positive correlation between sulphides
liberation, flotation rate, sulphides recovery (Section 5.2), base metal and sulphur recovery
(Section 5.7 and Figure 5.14a-c) (Lastra, 2007; Ford et al., 2011; Bushell, 2012).
6.2.10 COMPARISON OF SULPHIDES LIBERATION IN FEED AND CONCENTRATES
Conc1 and Conc2 in BK and WP have more liberated sulphides than their corresponding feeds,
and Conc3 and Conc4 have less liberated sulphides since most of the liberated sulphides are
recovered in Conc1-Conc2 (Figure 5.7 and Figure 5.9). The remaining sulphides are present
mostly as composite particles in binary and ternary particles (Fig 5.11-5.13 and Appendix 4,
Table A4.11-A4.12).

78
In RPM Conc1 has more liberated sulphides than the feed and this means most of the liberated
sulphides report to Conc1 (Figure 5.8). Little liberated sulphides remain and report to Conc2-
Conc4 and the balance is locked also in binary and ternary composite particles (Fig 5.11-5.13
and Appendix 4, Table A4.11-A4.12).
In UG2, Conc1-Conc4 all have more liberated sulphides than the feed, and Conc3 has the highest
liberated sulphides. This means that most of the liberated sulphides in UG2 are slow floating and
therefore report to Conc3 (Penberthy et al., 2000 and references therein). The little liberated fast
floating sulphides report to Conc1 and Conc2. Only very few liberated slow floating sulphides
remain after recovery of Conc3 and report to Conc4 (Figure 5.10 and Appendix 4, Table A4.11-
A4.12).
6.2.11 MINERAL ASSOCIATION AND LOCKING
UG2 has highest amount of sulphides in binary and ternary particles compared to the Merensky
facies (Figure 5.11-5.13), as it has finer sulphides grain sizes (Figure 5.5) and thus the least
amount of liberated sulphides of the four ore types (Figure 5.6). This is in agreement with Hay
and Roy (2010; and references therein), who observed that finer grained minerals are less easily
liberated and need finer grinding than the coarser grained minerals.
6.2.12 FLOTATION RECOVERY EFFICIENCY
PGE recoveries are generally above 90wt.% in all four facies, except Ir, Os and Ru in RPM and
UG2 (Table 5.3). Au recovery is generally lower than 90wt.% in all the facies. The lower
recoveries of Ir, Os, Ru and Au may suggest that these elements are not only associated with
base metal sulphides, but could also be in other forms which cannot be recovered by bulk
sulphide flotation such as alloys and free gold, or enclosed in silicate minerals (Vermaark and
Hendriks, 1976).
79
Flotation efficiency results (Table 5.4) also indicate that copper flotation recovery efficiencies
range from 96% to 100wt.% for BK, RPM and WP ores probably due to the presence of liberated
and highly floatable chalcopyrite contents (Ekmekci et al., 2005) in these ore. Nickel flotation
recovery efficiency values decrease in the order BK, WP, RPM and UG2. This shows a positive
correlation with decreasing pentlandite modal abundances in BK, WP, RPM and UG2 ores
(Table 3.1).
However, nickel recoveries for BK, RPM, WP and UG2 ores do not correlate with the degree of
sulphides liberation (Figure 5.6), especially for the RPM ore. Thus the low nickel recoveries in
RPM and UG2 might imply that some of the nickel is not hosted in sulphides (such as
pentlandite and pyrrhotite) but in other mineral phases probably pyroxenes, olivines and
serpentine which are depressed by Sendep30D addition during flotation (Wiese et al., 2005,
2007), especially after achieving a 100wt.% sulfur recovery in all four facies.
6.2.13 GRADE AND RECOVERY ANALYSES
Grade and recovery data indicate that grades are generally low and recoveries are high,
especially for Cu and S, for all the facies type (Figure 5.16a-c). The low grades are likely due to
dilution (Neethling et al., 2008) from increasingly high recoveries to concentrates of augite,
enstatite, plagioclase and talc (Figure 5.2a-b; Figure 5.15a and Figure 5.15c; and Appendix 4,
Tables A4.11) probably due to copper ions and talc activation (Gasparrini, 1981; Malysiak et al.,
2002 and 2004; Wiese et al., 2006 and 2011; Lotter et al., 2008; Becker et al., 2009; Jasieniak et
al., 2009).

80
CHAPTER 7: CONCLUSIONS AND RECOMMENDATIONS
Geometallurgical evaluations of orebodies from exploration up to the end of the life of a mine or
that of part of a mine, have become an integral part of many of mining operations (Lotter et al.,
2003, 2011a, 2011b). This involves continually assessing the variability in the metallurgical
responses of the ore, and thus highlighting the need, if any, to adjust the ore processing flowsheet
in response to mineralogical variations. The following conclusions are drawn from this
geometallurgical study.
1) The present study shows that the amount of plagioclase and orthopyroxene in the ores of the
Merensky Reef has a direct influence on the amount of energy required to produce a grind of
60% passing 75 micron, with longer milling times required for plagioclase-rich and
orthopyroxene-poor ores. If ores are blended (Adams, 2007; Van Tonder et al., 2010) prior to
milling, a reduction in milling time (and energy consumption) could be achieved by limiting the
plagioclase content of the blend.
2) The amount of orthopyroxene in the ores of the Merensky Reef has a direct influence on mass
pull, as orthopyroxene is naturally floating in character (Becker et al., 2009). High
orthopyroxene content is therefore detrimental to the efficient recovery of the PGE, due to
concentrate dilution during flotation. If ores are blended prior to milling to reduce the amount of
plagioclase as suggested in (1), then care should be taken not to increase the orthopyroxene
content, or a high mass pull will result, and thus consequently a dilution of the PGE grade.
3) Of the three facies types of Merensky Reef examined, the overall characteristics of the BK
facies type, that is, a high PGE grade, low abundance of enstatite, a high modal abundance of
base metal sulphides, and a higher degree of liberation of the base metal sulphides on milling of
the ore, represent the most favourable set of characteristics for the efficient recovery of PGE
(Brough et al., 2010). It is therefore the best quality ore of the three samples of Merensky Reef
examined, as is confirmed by the flotation testing, with the highest recovery of Pt and Pd
observed.

81
4) The finer grain size of base metal sulphides in the UG2 relative to the Merensky Reef requires
a finer grind in order to achieve maximum sulphides liberation and recovery of the PGE (Hay
and Roy, 2010). This does not necessarily imply a longer milling time than in the case of the
Merensky Reef, as mill testing indicate that UG2 mills slightly faster than Merensky Reef.
However, even at a grind of 60% passing 75 micron in the present study, the recovery of PGE in
UG2 is acceptable, and only exceeded by the sample of the BK facies of Merensky Reef.
The following recommendations are worth considering:
1) Milling and flotation tests could be done on the composites of the Merensky Reef facies and
the UG2 ores (Lee et al., 2008), since practically no single facies ore would be enough to meet a
processing plant’s daily target throughput. Thus a study to determine the processing performance
behaviour of the composite samples of all the four ore types could be essential.
2) Further work on flotation conditions optimization studies could be carried out in order to
improve grades and recoveries in the ore facies (Shackleton et al., 2007a, 2007b), possibly
through flotation reagents optimizations or use of reagents combinations (Senior et al., 1995;
Pietrobon et al., 1997; Wiese et al., 2005, 2006 and 2007; Becker et al., 2009; Corin et al., 2010;
Lotter et al., 2011).
3) Grade optimization tests could also be carried out through cleaner and re-recleaner kinetics
studies on the rougher concentrates to reduce the amount of floatable gangue reporting to final
concentrates, and thus improve the final metal grades in concentrates (Hay, 2010).

82
REFERENCES
Adams, M.D., 2007. Towards a virtual metallurgical plant 2: Application of mineralogical data.
Minerals Engineering 20, 472-479.
Allison, S.A., and O’Connor, C.T., 2011. An investigation into the flotation behaviour of
pyrrhotite. International Journal of Mineral Processing 98, 202-207
Andersen, J.C.O., Rollison, G.K., Snook, B., Herrington, R., and Fairhurst, R., 2009. Use of
QEMSCAN for the characterization of Ni-rich and Ni-poor goethite in laterite ores. Minerals
Engineering 22, 1119-1129.
Becker, M., Brough, C., Reid, D., Smith, D., and Bradshaw, D., 2008. Geometallurgical
characterization of the Merensky Reef at Northam Platinum Mine–Comparison of Normal,
Pothole and Transitional Reef types. Proceedings Ninth International Congress of Applied
Mineralogy, Brisbane, 391-399.
Becker, M., Harris, P.J., Wiese, J.G., and Bradshaw, D.J., 2009. Mineralogical characterization
of naturally floatable gangue in Merensky Reef ore flotation. International Journal of Mineral
Processing 93, 246-255.
Becker, M., de Villiers, J., and Bradshaw, D., 2010. The flotation of magnetic and non-magnetic
pyrrhotite from selected nickel ore deposits. Minerals Engineering 23, 1045-1052.
Beniscelli, J., 2011. Geometallurgy-Fifteen Years of Developments in Codelco: Pedro Carrasco
Contributions. In: The First AusIMM International Geometallurgy Conference 2011, 5-7
September 2011, Brisbane, Australia, pp3-7.

83
Brough, C.P., Bradshaw, D.J., and Becker, M., 2010. A comparison of the flotation behaviour
and effect of copper activation on three reef type from the Merensky reef at Northam. Minerals
Engineering 23, 846-854
Brynard, H.J., De Villiers, J.P.R., and Villjoen, E.A., 1976. A mineralogical investigation of the
Merensky Reef at the WP, near Marikana, South Africa. Economic Geology 71, 1299-1307.
Cawthorn, R.G., 1999a. Seventy-fifth Anniversary of the Discovery of the Platiniferous
Merensky Reef. The largest platinum deposits in the world. Platinum Metals Reviews 43, (4),
146-148.
Cawthorn, R.G., 1999b. The platinum and palladium resources of the Bushveld Complex. South
African Journal of Science 95, 481-489.
Cawthorn, R.G., Lee, C.A., Schouwstra, R.P., and Mellowship, P., 2002. Relationship between
PGE and PGM in the Bushveld Complex. The Canadian Mineralogist 40, 311-328.
Chapman, N.A., Shackleton, N.J., Malysiak, V., and O’Connor, C.T., 2011. The effect of using
different comminution procedures on flotation of platinum-group minerals. Minerals Engineering
24, 731-736.
Chetty, D., Gryffenberb, L., Lekgetho, T.B., and Molebale, I.L., 2009. Automated SEM study of
PGM distribution across a UG2 flotation concentrate bank: implications for understanding PGM
floatability. The Journal of the South African Institute of Mining and Metallurgy 109, 587-593.
Chryssoulis, S.L., 2001.Using Mineralogy to Optimize Gold Recovery by Flotation. Journal of
mineralogy, 48-50.
Coetzee, L.L., Theron, S.L., Martin, G.J., Van der Merwe, J.D., and Stanek, T.A., 2011. Modern
gold deportments and its application to industry. Minerals Engineering 24, 565-575.
84
Corin, K.C., and Harris, P.J. 2010. Investigation into the flotation response of a sulphide ore to
depressant mixtures. Minerals Engineering 23, 915-920.
Craig, J.R., and Vaughan, D.J., 1994. Ore microscopy and Ore petrography. Wiley Interscience
publication, John Wiley & Sons, Inc, 2nd edition, 331-332.
Czamanske, G.K., Haffty, J., and Nabbs, S.W., 1981. Pt, Pd and Rh Analyses and Beneficiation
of Mineralized Mafic Rocks from the La Perouse layered Gabbro, Alaska. Economic Geology
76, 2001-2011.
Dai, Z., Bos, J., Lee, A., and Wells, P., 2008. Mass balance and mineralogical analysis of
flotation plant survey samples to improve plant metallurgy. Minerals Engineering 21, 826-831.
Davey, S.R., 1992. Lateral variations within the Upper Critical Zone of the Bushveld Complex
on the farm Rooikoppies 297 JQ, Marikana, South Africa. South African Journal of Geology 95,
141-149.
Ekmekci, Z., Can, M., Ergiin, S.L., Gulsoy, O.Y., Benzer, H., and Celik, I.B., 2005. Performance
Evaluation of CBI Flotation Plant Using Mineralogical Analysis. The 19th International Mining
Congress and Fair of Turkey, IMCET2005, Izmir, Turkey, June 09-12, 233-240.
Evans, C.L., Wightman, E.M., Manlapig, E.V., and Coulter, B.L., 2011. Application of process
mineralogy as a tool in sustainable processing. Minerals Engineering 24, 1242-1248.
Fandrich, R., Gu, Y., Burrows, D. and Moeller, K., 2007. Modern SEM-based mineral liberation
analysis. International Journal of Mineral Processing 84, 310-320.
Farquhar, J., 1986. The WP. In: Annhaeusser, C.R., and Maske, S (Ed.). Mineral deposits of
southern Africa. Geological Society of South Africa, Johannesburg, 1135-1142.

85
Ford, F.D., Wercholaz, C.R. and Lee, A., 2011. Predicting process outcomes for Sudbury
platinum group minerals using grade-recovery modelling from mineral liberation analyzer
(MLA) data. The Canadian Mineralogist 49, 1627-1642. DOI: 10.3749/canmin.49.6.1627.
Gain, S.B and Mostert, A.B., 1982. The geological setting of the platinoid and base metal
sulphide mineralization in the Platreef of the Bushveld Complex in Drenthe, North of
Portgietersrus. Economic Geology 77, 1395-1404.
Gasparrini, C., 1981. The significance of applied mineralogy to metal extraction. In: Hausen,
D.M and Park, W.C (editors), Process Mineralogy, Extractive Metallurgy, Mineral Exploration,
Energy Resources: Proceedings of Symposium, February 22-26, 33-49.
Goodall, W.R., Scales, P.J. and Butcher, A.R., 2005. The use of QEMSCAN and diagnostic
leaching in the characterisation of visible gold in complex ores. Minerals Engineering 18, 877-
886.
Goodall, W.R., and Scales, P.J., 2007. An overview of the advantages and disadvantages of the
determination of gold mineralogy by automated mineralogy. Minerals Engineering, 20, 506-517
Goodall, W.R., 2008. Characterisation of mineralogy and gold deportment for complex tailings
deposits using QEMSCAN. Minerals Engineering 21, 518-523.
Gottlieb, P., Willie, G., Sutherland, D., Ho-Tun, E., Suthers, S., Perera, K., Jenkins, B., Spencer,
S. and Butcher, A., 2000. Using Quantitative Electron Microscopy for Process Mineralogy
Applications. JOM, 24-25.
Grammatikopoulos, T.A., Porritt, L., Petersen, J.S. and Christensen, K., 2004. Mineralogical
characterisation and process mineralogy of gold-bearing rocks from the Nalunaq gold deposit,
Greenland. Applied Earth Science: (Transactions of the Institution of Mining and Metallurgy,
Section B), September 2004, 113, B197-B203.

86
Grammatikopoulos, T.A., Kapsios, A., Zaccarini, F. and Tsikouras, B., 2007. Investigation of
platinum group minerals (PGM) from Pindos chromitites (Greece) using hydroseparation
concentrates. Minerals Engineering 20, 1170-1178.
Gu, Y., 2003. Automated Scanning electron Microscope based Mineral liberation Analysis. An
introduction to JKMRC/FEI Mineral Liberation Analyser. Journal of Minerals & Materials
Characterization & Engineering 2, 1, 33-41.
Gulsoy, O.Y., 2005. A simple model for the calculation of Entrainment in Flotation. Korean
Journal of Chemical Engineering 22, 4, 628-634.
Hagni, A.M., 2008. Phase Identification, Phase Quantification, and Phase Association
Determinations Utilizing Automated Mineralogy Technology. Journal of Mineralogy, 33-37.
Hay, M.P., 2010. A case study of optimisng UG2 flotation performance part 2: Modelling
improved PGM recovery and C2O3 rejection at Northam’s UG2 concentrator. Minerals
Engineering 23, 868-876.
Hay, M.P and Roy, R., 2010. A case study of optimizing UG2 flotation performance. Part 1:
Bench, pilot and plant factors which influence Cr2O3 entrainment in UG2 flotation. Minerals
Engineering 23, 855-867.
Hunt, J., Berry, R. and Bradshaw, D., 2011. Characterising chalcopyrite liberation and flotation
potential: Examples from an IOCG deposit. Minerals Enginerring 24, 1271-1276.
Jasieniak, M., and Smart, R.S.C., 2009. Collectorless flotation of pyroxene in Merensky ores:
Residual layer identification using ToF-SIMS analysis. International Journal of Mineral
Processing 92, 169-176.

87
Jasieniak, M., and Smart, R.S.C., 2010. Surface chemical mechanisms of inadvertent recovery of
chromite in UG2 ore flotation: Residual layer identification using statistical ToF-SIMS analysis.
International Journal of Mineral Processing 94, 72-82.
Kapsiotis, A., Grammatikopoulos, T.A., Zaccarini, F., Tsikouras, B., Garuti, G. and
Hatzipanagiotou, K., 2006. Platinum-group mineral characterisation in concentrates from low-
grade chromitites from the Vourinos ophiolite Complex, northern Greece. Applied Earth
Science: Transactions of the Institution of Mining and Metallurgy, Section B, 115, 2, 49-57.
Kapsiotis, A., Grammatikopoulos, T.A., Tsikouras, B. and Hatzipangiotou, K., 2009. Platinum-
Group Mineral Characterization in Concentrates from High-Grade PGE Al-rich Chromitites of
Korydallos area in the Pindos ophiolite Complex (NW Greece). Resource Geology 60, 2, 178-
191 (doi:10.1111/j.1751-3928.2010.00124.x)
Kerrick, D.M., Eminhizer, L.B. and Villaume, J.F., 1973. The role of carbon thickness in
electron microprobe analysis. The American Mineralogist 58, 920-925.
Kinloch, E.D., 1982. Regional trends in the platinum-group mineralogy of the Critical Zone of
the Bushveld Complex, South Africa. Economic Geology 77, 1328-1347.
Kormos, L., Oliveira, J., Fragomeni, D., Whiteman, E. and Carrion De la Cruz, J., 2010. Process
Diagnosis using Quantitative Mineralogy. 42nd Annual CMP Conference January 19-21, 1-39
Lastra, R., 2007. Seven practical application cases of liberation analysis. International Journal of
Mineral Processing 84, 337-347.
Lee, K., Archibald, D., McLean, J. and Reuter, M.A., 2008. Flotation of mixed copper oxide and
sulphide minerals with xanthate and hydroxamate collectors. Minerals Engineering (2008),
doi:10.1016/j.mineng.2008.11.005.

88
Lenahan, W.C., and Re de Murray-Smith, 1986. Assay and Analytical Practice in the South
African Mining Industry. The South African Institute of Mining and metallurgy. Monograph
series M6, pp 41-594.
Lonmin Group, 2006. A guide to the geology at Lonmin Platinum, Marikana operations.
Unpublished Company Report, pp1-20 (Unpublished company report).
Lotter, N.O., Whittaker, L., Kormos, L., Stickling, J.S. and Wilkie, G.J., 2002. The development
of process mineralogy at Falconbridge Limited, and application to the Raglan Mill. CIM Bulletin
95, 1066, 85-92.
Lotter, N.O., Kowal, D.L., Tuzun, M.A., Whittaker, P.J. and Kormos, L., 2003. Sampling and
flotation of Sudbury Basin drill core for process mineralogy modelling. Minerals Engineering 16,
857-864.
Lotter, N.O., 2007. Distribution modelling of the nickel assay grades in the final tailings at
Raglan, Quebec. Minerals Engineering 20, 1067-1074.
Lotter, N.O., Bradshaw, D.J., Becker, M., Parolis, L.A.S. and Kormos, L.J., 2008. A discussion
of the occurrence and undesirable flotation behaviour of orthopyroxene and talc in the processing
of mafic deposits. Minerals Engineering 21, 905-912.
Lotter, N.O., Di Feo, A., Kormos, L., Fragomeni, D. and Comeau, G., 2010. Design and
measurement of small recovery gains: A case study at Raglan concentratror. Minerals
Engineering 23, 567-577.
Lotter, N.O., Kormos, L.J., Oliveira, J., Fragomeni, D. and Whiteman, E., 2011. Modern process
Mineralogy: Two case studies. Minerals Engineering 24, 638 – 650.

89
Lotter, N.O., 2011. Modern Process Mineralogy: An integrated multi-discipline approach to
flowsheeting. Minerals Engineering 24, 1229-1237.
Malysiak, V., Shackleton, N.J. and O’Connor, C.T., 2004. An investigation into the floatability
of a pentlandite-pyroxene system. International Journal of Mineral processing 74, 251-262.
McLaren, C.H., and De Villiers, J.P.R., 1982. The Platinum-Group Chemistry and Mineralogy of
the UG-2 Chromitite Layer of the Bushveld Complex. Economic Geology 77, 1348-1366.
Miller, J.D., Li, J., Davidtz, J.C and Vos, F., 2005. A review of pyrrhotite flotation chemistry in
the processing of PGM ores. Minerals Engineering 18, 855-865.
Naldrett, A.J., Gasparrini, E.C., Barnes, S.J., Von Gruenewaldt, G; and Sharpe, M.R., 1986. The
Upper Critical Zone of the Bushveld Complex and the Origins of Merensky-type Ores.
Economic Geology 81, 1105-1117.
Neethling, S.J., and Cilliers, J.J., 2008. Predicting and correcting grade-recovery curves:
Theoretical aspects. International Journal of Mineral Processing 89, 17-22.
Newell, A.J.H., Bradshaw, D.J. and Harris, P.J., 2006. The effect of heavy oxidation upon
flotation and potential remedies for Merensky type sulphides. Minerals Engineering 19, 675-686.
Olubambi, P.A., Ndlovu, S., Potgieter, J.H., and Borode, J.O., 2006. Influence of applied
mineralogy in developing an optimal hydrometallurgical processing route for complex sulphide
ores. Mineral Processing and extractive Metallurgy Review 27, 143-158.
Olubambi, P.A., Ndlovu, S., Potgieter, J.H., and Borode, J.O., 2008. Mineralogical
characterization of Ishiagu (Nigeria) complex sulphide ore. International Journal of Mineral
Processing 87, 83-89.

90
Pearse, M.J., 2005. An overview of the use of chemical reagents in mineral processing. Minerals
Engineering 18, 139-149.
Penberthy, C.J., Oosthuyzen, E.J and Merkle, R.K.W., 2000. The recovery of platinum group
elements from the UG2 Chromitite, Bushveld Complex – a mineralogical perspective.
Mineralogy and Petrology 68, 213-222.
Petruk, W., 2000. Applied Mineralogy in the Mining Industry. Elsevier Science B.V,
Amsterdam, The Netherlands, First edition, pp24-25, 48-49.
Philander, C and Rozendaal, A., 2011. The contributions of geometallurgy to recovery of
lithified heavy mineral resources at the Namakwa Sands mine, West Coast of South Africa.
Minerals Engineering 24, 1357-1364.
Pietrobon, M.C., Grano, S.R., Sobieraj, S and Ralston, J., 1997. Recovery mechanisms for
pentlandite and MgO-bearing minerals in nickel ores from Western Australia. Minerals
Engineering 10, 8, 775-7786.
Runge, K., 2010. Laboratory flotation testing - An essential tool for characterization. In:
Flotation plant optimization: A metallurgical guide to identifying and solving problems in
flotation plants. Australasian Institute of Mining and Metallurgy, Spectrum Series (Carlton, Vic)
16, 155-173.
Scoon, R.N and Mitchell, A.A., 2004. The platiniferous dunite pipes in the eastern limb of the
Bushveld Complex: Review and comparison with unmineralized discordant ultramafic bodies.
South African Journal of Geology 107, 505-520
Scoon, R.N and Mitchell, A.A, 2009. Discovery and Geology of the Platinum Group Element
Deposits of the Bushveld Complex, South Africa. SEG NEWSLETTER 78, 13-19

91
Senior, G.D., Trahar, W.J., and Guy, P.J., 1995. The selective flotation of pentlandite from a
nickel ore. International Journal of mineral Processing 43, 209-234.
Shackleton, N.J., Malysiak, V., and O’Connor, C.T., 2007a. Surface characteristics and flotation
behaviour of platinum and palladium tellurides. Minerals Engineering 20, 1232-1245.
Shackleton, N.J., Malysiak, V., and O’Connor, C.T., 2007b. Surface characteristics and flotation
behaviour of platinum and palladium arsenides. International Journal of Mineral Processing 85,
25-40.
Schouwstra, R.P., and Kinloch, E.D., 2000. A short geological Review of the Bushveld
Complex. Platinum Metals Rev., 44, 1, 33 – 39.
Schouwstra, R., de Vaux, D., Hey, p., Malysiak, V., Shackleton, N., and Bramdeo, S., 2010.
Understanding Gamsberg – A geometallurgical study of a large stratiform zinc deposit. Minerals
Engineering 23, 960-967.
Sizgoric, N.B and Alcock, R.A, 1981. Quantitative Mineralogy as an aid to Beneficiation of
Nickel Sulphide ore. In: Hausen, D.M and Park, W.C (editors), Process Mineralogy: Extractive
Metallurgy, Exploration, Energy Resources. Proceedings of Symposium, February 22-26, pp
419-428.
Smith, L.K., Senior, G.D., Bruckard, W.J., and Davey, K.J., 2011.The flotation of millerite –A
single mineral study. International Journal of Mineral Processing 99, 27 – 31.
Sutherland, D., 2007. Estimation of mineral grain size using automated mineralogy. Minerals
Engineering 20, 452-460.
Van Tonder, E., Deglon, D.A and Napier-Munn, T.J., 2010. The effect of ore blends on mineral
processing of platinum ores. Minerals Engineering 23, 621-626.

92
Vermaak, C.F., and Hendriks, L.P., 1976. A review of the Mineralogy of the Merensky Reef,
with Specific Reference to New Data on the Precious Metal Mineralogy. Economic Geology 71,
1244-1269
Vermaak, C.F., 1995. The Platinum Group Metals: A global Perspective. Mintek, Randburg,
247pp
Viljoen, F., Knoper, M., Rajesh, H., Rose, D and Greef, T., 2012. Application of a field emission
mineral liberation analyser to the in-situ study of platinum group element mineralization in the
Merensky reef of the Bushveld Complex, South Africa. Proceedings of the 10th International
Congress for Applied Mineralogy (ICAM), 757-764, Springer Berlin Heidelber.
Von Gruenewaldt, G., Martin, R.S; and Hatton, C.J., 1985. The Bushveld Complex: Introduction
and Review. Society of Economic Geologists, Inc. Economic Geology 80, 803-812.
Von Gruenewaldt, G; Hatton, C.J., Merkle, R.K.W., and Gain, S.B., 1986. Platinum Group
Element-Chromitite Associations in the Bushveld Complex. Economic Geology 81, 1067-1079.
Wiese, J., Harris, P., and Bradshaw, D., 2005. The influence of the reagent suite on the flotation
of ores from the Merensky reef. Minerals Engineering 18, 189-198.
Wiese, J., Harris, P and Bradshaw, D., 2005. Investigation of the role and interactions of a
dithiophosphate collector in the flotation of sulphides from Merensky reef. Minerals Engineering
18, 791-800.
Wiese, J., Harris, P and Bradshaw, D., 2006. The role of the reagent suite in optimising
pentlandite recoveries from the Merensky reef. Minerals Engineering 19, 1290-1300.

93
Wiese, J.G., Becker, M., Bradshaw, D.J., and Harris, P.J., 2007. Interpreting the role of reagents
in the flotation of platinum-bearing Merensky ores.The Journal of the South African Institute of
Mining and Metallurgy 107, 29-36.
Wiese, J., Harris, P and Bradshaw, D., 2011. The effect of the reagent suite on froth stability in
laboratory scale batch flotation tests. Minerals Engineering 24, 995-1003.
Wills, B.A., 1997. Mineral Processing Technology: An introduction to the practical aspects of
ore treatment and mineral recovery. 6th edition, pp110, 258-341. Butterworth-heinemann
Xiao, Z., and Laplante, A.R., 2004. Characterization and recovering the platinum group minerals
– a review. Minerals Engineering 17, 961-979.
Xiao, Z., Laplante, A.R., and Finch, J.A., 2009. Quantifying the content of gravity recoverable
platinum group minerals in ore samples. Minerals Engineering 22, 304-310

94
APPENDIX 1: METHODS
A1.0 INTRODUCTION
This chapter briefly describes the various techniques employed and experimental procedures
carried out to perform a particular activity. These include sampling, crushing, representative
sample splitting, grain mounts preparation, and grain mounts carbon coating, milling, flotation,
screening and chemical assaying.
A1.1 CHANNEL SAMPLING
The following are the source locations of channel samples of the reef facies used in this study,
from Lonmin Marikana Platinum Mine:
BK facies: 15 MW 6E1 RSE
RPM facies: 15 MW 22 RSE
WP facies: K3 # 13 ME 69 RSE
UG2: 4B UG2 UNDERGROUND
The reef ores were channel sampled using the panel sampling method through the reef, in which
10cm long (and 5cm wide) interval subsamples were collected from each of the accessible facies
types at Marikana, that is: RPM facies, WPfacies and BK facies. One set of samples per facies
type was collected and one sample of the UG2 chromitite layer was also sampled in the same
manner.
Each of the reef facies subsamples was weighed and geologically logged (Figure 3.1). Various
techniques were used to investigate the mineralogical and textural characteristics of the ores.
These included chemical analysis (fire assay), scanning electron microscope based mineral
liberation analysis (Gu, 2003 and Fandrich et al., 2007), milling and bench-top flotation. The
mineral liberation analysis technique was used to quantify modal mineralogy, particle and grain
size distribution, mineral associations and mineral locking, and mineral liberation by surface area
and by composition.

95
All sample preparations and analyses were done at the University of Johannesburg’s central
analytical facility, Spectrau. Chemical analysis was done at Genalysis Laboratories in
Johannesburg; milling and bench-top flotation were carried out at the University of
Johannesburg’s Doornfontein Campus, Extractive Metallurgy Department.
A1.2 CRUSHING
Jaw-crushing of the samples was done to achieve 100% passing 2mm. Each subsample was
stage-crushed and sieved (using a 2mm sieve) to avoid excessive fine grains or powders.
Intensive cleaning of the jaw crusher and sieve was done using water and a hot air dryer. Final
rinsing was done using acetone and wiping with paper towel to eliminate cross-contamination
between samples.
A1.3 REPRESENTATIVE SAMPLE SPLITTING
Crushed representative samples were split using riffler splitters until three fractions of about 6g
each were obtained. These were made into blocks for modal abundances determination.
A1.4 GRAIN MOUNTS PREPARATION
The 6g subsample aliquots were used to make 30mm flat rock mounts. The process of making
grain mounts involved initially lubricating the inside of the 30mm mounting cups using Vaseline
jelly for easy removal of the mounts once dried. A hardener-resin mixture was then made from 1
part hardener and 7 parts resin, thoroughly mixed and placed in an oven at 50 degrees Celsius for
2 to 5 minutes to expel air bubbles.
The air-free hardener-resin mixture from the oven was poured into the 30mm mounting cups,
followed by the crushed sample aliquots and then stirred to avoid air spaces or bubbles
forming/setting at the bottom with the sample grains. Sample labels were then placed at the top
facing upwards but covered with the hardener-resin mixture, making sure sample names were

96
clearly visible. The labelled samples were placed in a pressure vessel machine for 24 hours to
remove air bubbles and drying the samples.
After drying, the sample mounts were ground at the base to expose the mineral grains, followed
by stage polishing using a 6micron, 3micron, 1micron and 0.25micron diamond paste (DP-stick
P) to create final polished rock mounts blocks for mineralogical analysis.
A1.5 CARBON COATING
The polished grain mounts were then coated with a 25 nm thick layer of carbon (Kerrick et al.,
1973 and Andersen et al., 2009; Jasieniak and Smart., 2010) to create a conductive surface to
prevent excess charge build up in the Mineral Liberation analyser and Electron Microprobe
during analysis.
Coating was done using a 230V Agar Turbo Carbon Coater, model 208C, at a setting of 4.5V
and operating on a manual mode. A brass disk standard was employed, which produced blue
interference colours when a good enough carbon layer was achieved. A total of 240 grain mounts
were carbon coated for onward analysis using an FEI 600F Mineral Liberation Analyser (MLA)
(Appendix 1), housed at Spectrau.
A1.6 MILLING
A 210mm mill was used, in conjunction with 6x25mm, 9x20mm and 6x16mm mill rods (Wiese
et al., 2005), to mill 1kg aliquots of representatively riffled splits of the BK, RPM, WPand UG2
facies (respectively labelled as BK_A, RPM_A, WP_A and UG2_A) in order to produce milling
curves for the respective facies for determining the exact times required to mill a 1kg sample
aliquot to 60% mass passing 75µm sieve. To clean the mill, the above configuration of rods was
placed in the mill, followed by adding 1kg of pure quartz pebbles (Senior et al., 1995) and then
520ml of water was added into the mill contents to produce 66% solid slurry by weight.
97
The mill was then closed securely, placed on rollers set at a rotation speed of 61 RPM and then
milled for 10 minutes. The mill was then opened and its contents discarded, followed by
thorough washing with water. Then the above procedure was repeated using the 1kg sample
aliquot for each facies under study for the times shown in Appendix 4, Table A4.1, Table A4.2,
Table A4.3 and Table A4.4 for the BK, RPM, WP and UG2 ore facies respectively.
After milling the mill was taken and placed onto a stand in an upright position, opened, and the
slurry was washed off from the lid using a wash bottle with minimal water into the mill. The rods
were taken from the mill and the slurry washed back into the mill with minimal water. The rod
mill contents were then tipped into a clean bucket labelled with a sample number (such as
BK_A), and all the remaining slurry from the mill was washed into the bucket with minimal
water using a wash bottle.
A clean bucket labelled -75µm was placed under a 75µm sieve to receive particle slurry
consisting of -75µm sizes. The slurry was vigorously stirred and poured through the 75µm sieve
and also using minimal water to help the slurry through the sieve. The +75µm sludge was
transferred into another clean bucket labelled +75µm.
The -75µm and +75µm fractions were filtered separately and separately dried in an oven at low
temperature (170oC). The dried +75µm fraction lumps were broken down using steel rollers and
then sieved for 20 minutes through a sieve stack consisting of 300µm, 150µm and 75µm aperture
sieves and a collecting pan at the bottom. The -75µm fraction was added to the other -75µm
portion separately filtered and dried earlier. The +300µm, +150µm and +75µm fractions were
also combined. Both the combined -75µm and +75µm portions were separately weighed and the
masses recorded, including the % - passing 75µm as shown in the Table A4.1, Appendix 4 for
the BK_A sample.
The same procedure was repeated for the varied times shown in the table, using the same rod
mill, same rods configuration, same amount of water and mill rotation speed after combining the
weighed -75µm and +75µm portions of the sample.

98
A1.7 MINERAL LIBERATION ANALYSIS
A Mineral Liberation Analyser (MLA) (model 600F), an automated mineral analysis platform,
was used to perform mineralogical analyses on 30mm polished mount blocks of crushed ore
feeds (-2mm), milled ore feeds (60wt% passing 75µm) and concentrate (-75+38µm size fraction)
samples of the BK, RPM, WP and UG2 facies.
The MLA was operated under the following conditions during analyses:
Operating voltage………………………25kV
Beam spot………………………………X6
Magnification…………………………...450X, for -75+38µm sieved fraction (SPL-GXMAP)
and the -2mm crushed (XMOD) sample analyses.
Two operating modes, XMOD and GXMAP procedures, were used (Gu, 2003; Fandrich et al.,
2007.
XMOD was used to determine bulk modal mineralogy data (mineral modal abundance in wt.%)
of the various minerals in the samples, resulting in the mineral data presented in Table 3.1,
Figures 3.2-3.5 and Appendix 2, Table A2.1-A2.4).
SPL-GXMAP measurement mode was used to determine sulphides particles in the -75+38µm
sieved size fraction of the BK, RPM, WPand UG2 concentrates, in order to get more statistically
representative particles in each concentrate block for further analysis and also for particle size
distribution study (Sutherland, 2007).
A1.8 FLOTATION PROCEDURE
1kg representative riffled split aliquot of each of the BK, RPM, WP and UG2 facies was placed
in the exact same rod mill as was used for the mill testing (210mm inside diameter), with the
same rods configuration (6x25mm rods, 9x20mm rods and 6x16mm rods) (Wiese at al., 2005)
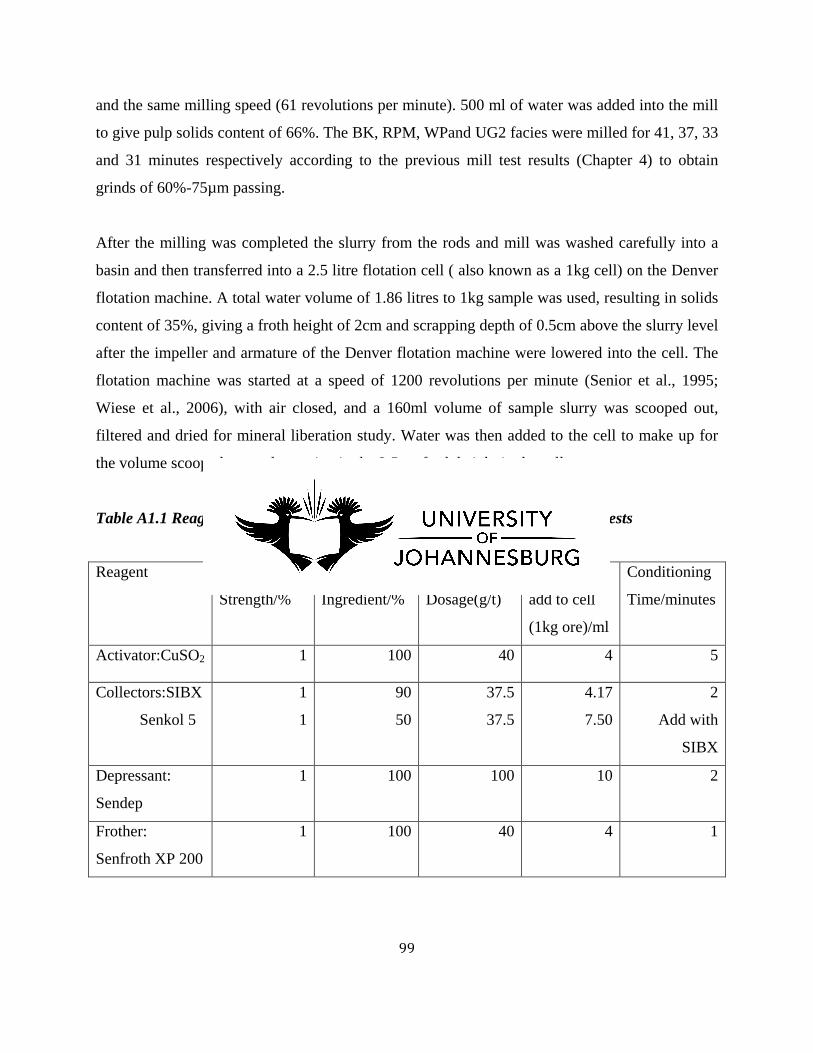
99
and the same milling speed (61 revolutions per minute). 500 ml of water was added into the mill
to give pulp solids content of 66%. The BK, RPM, WPand UG2 facies were milled for 41, 37, 33
and 31 minutes respectively according to the previous mill test results (Chapter 4) to obtain
grinds of 60%-75µm passing.
After the milling was completed the slurry from the rods and mill was washed carefully into a
basin and then transferred into a 2.5 litre flotation cell ( also known as a 1kg cell) on the Denver
flotation machine. A total water volume of 1.86 litres to 1kg sample was used, resulting in solids
content of 35%, giving a froth height of 2cm and scrapping depth of 0.5cm above the slurry level
after the impeller and armature of the Denver flotation machine were lowered into the cell. The
flotation machine was started at a speed of 1200 revolutions per minute (Senior et al., 1995;
Wiese et al., 2006), with air closed, and a 160ml volume of sample slurry was scooped out,
filtered and dried for mineral liberation study. Water was then added to the cell to make up for
the volume scooped out and to maintain the 2.5cm froth height in the cell.
Table A1.1 Reagent suite addition and conditioning used in the flotation rate tests
Reagent Solution
Strength/%
Conc Active
Ingredient/%
Required
Dosage(g/t)
Volume to
add to cell
(1kg ore)/ml
Conditioning
Time/minutes
Activator:CuSO2 1 100 40 4 5
Collectors:SIBX
Senkol 5
1
1
90
50
37.5
37.5
4.17
7.50
2
Add with
SIBX
Depressant:
Sendep
1 100 100 10 2
Frother:
Senfroth XP 200
1 100 40 4 1

100
The flotation reagents suite used in these testworks were supplied by Senmin and their additions
were based on Wiese et al (2005), adjusted for Senmin reagents suite, as summarized in the table
above.
Still with the flotation machine running, air closed, 4ml CuSO2 (Becker et al., 2010; Miller et al.,
2005; Schouwstra et al., 2010; Senior et al., 1995 and references therein) was added to the
swirling pulp and conditioned for 5 minutes, followed by adding simultaneously 4.17 ml of
SIBX and Senkol 5 phosphate collectors (Becker et al., 2005; Becker et al., 2006; Becker et al.,
2010; Corin et al., 2010; Miller et al., 2005; Wiese et al., 2005, 2006 and 2011; Pearse., 2005
and references therein). Agitation was continued for further 2 minutes and then 10 ml of Sendep
30D (depressant) added and conditioned for 2 minutes (Allison et al., 2011; Senior et al., 1995
and references therein). 1ml of frother Dow 200 was added and then conditioned for 1 minute.
Then air flow was opened and controlled manually to keep the froth height constant at 2cm and
scrapping depth at 0.5cm; and immediately a timer was also started. Concentrate collection was
done by scrapping the froth into a collecting pan every 15 seconds. Concentrate 1 was collected
every 15 seconds for the first 2 minutes. Concentrate 2 was collected for every 15 seconds for the
next 4 minutes. Concentrate 3 was collected every 15 seconds for a further 6 minutes.
The airflow was then stopped and 2ml of frother Dow 200 was added. Then the airflow was
opened again and concentrate 4 was collected every 15 seconds for 8 minutes. The flotation
process was then stopped. Duplicate flotation test rates were done for each facies.
A1.9 CHEMICAL ANALYSIS
At least 75g representative aliquots of each crushed (-2mm) channel sample block (unit),
composite milled ore, milled screened ore feed (+106µm, +75µm, +25µm) and tailings, and at
least 8g of flotation concentrates from each timed flotation test run from the BK, the RPM, the
WP facies and the UG2 reef were submitted to Genalysis Laboratories Ltd (South Africa) for
assays.

101
All representative samples from the BK, RPM, WP and UG2 ore facies were analysed for base
metals ( Co, Cr, Cu, Ni), sulfur and the platinum group elements (Ir, Os, Pd, Pt, Rh, and Ru) and
Au.
Co, Cr, Cu, Ni and S were recovered by the sodium peroxide Fusion Zirconium Crucible Fusion
process and hydrochloric acid dissolution of the melt from 75g crushed (-2mm) and milled
(60wt% passing 75µm) ore feeds and tailings, and 8g concentrates. The base metals and sulfur
were then quantitatively analysed by the Inductively Couple Plasma Optical Emission
Spectrometry (ICP-OES) Finish Technique (Lenahan et al., 1986).
Platinum group elements (Pt, Pd, Rh, Ru, Ir and Os) and Au were quantitatively recovered by the
Nickel Sulphide Collection Fire Assay procedure from the 25g crushed sample (-2mm) and
milled (60wt% passing 75µm) ore feeds aliquots and milled screened ore feed (+106µm, +75µm,
+25µm) and tailings. The recovered PGE were quantitatively analysed by the Inductively
Coupled Plasma Mass Spectrometry (ICP-MS) technique (Lenahan et al., 1986).
Only Co, Cr, Cu, Ni and S were analysed in the concentrates due to low sample volume.
PGE+Au were not analysed in the concentrates also due to inadequate sample amounts which
were available for assays.
The detection limits that were used for assays are given in the table below.

102
Table A1.2 Analytical detection limits used for assays in this study
Element Detection limits
Cr 50ppm
Cu, Ni, Co 20ppm
S 0.05%
Au 5ppb
Ir, Os, Pd, Pt, Ru 2ppb
Rh 1ppb
The assay results of the ore feeds, concentrates and tailings, including sized fractions, for the
four facies are shown in Appendix 3, Tables A3.1-A3.4 and Appendix 4, Tables A4.3-A4.4 and
Table A4.13. Assays of each timed flotation concentrate and tailings were subsequently
reconciled with the head grades of the respective reef facies (Ekmekci et al., 2005).

103
APPENDIX 2: MINERALOGICAL DATA
Appendix 2 contains tables of mineral modal abundances for BK, RPM, WP and UG2 facies ores
referred to in various parts of this study.
Table A2.1 Mineral modal abundance (wt.%) variations of samples of the BK facies of the
Merensky reef (-2mm crushed ore sample) (from top to bottom)
Sample
ID
Wt%
Anor
Wt%
Aug
Wt%
Chr
Wt%
Enst
Wt%
Epid
Wt%
Kfsp
Wt%
Phlg
Wt%
Qtz
Wt%
trem
Wt%
Serp
Wt%
Ccp
Wt%
Pn
Wt%
Po
Wt%
Other
BK21-top 75.55 4.50 0.01 16.65 0.11 0.19 0.78 0.23 0.12 0.02 0.09 0.08 0.09 1.58
BK20 70.67 5.19 0.01 20.63 0.08 0.27 0.69 0.14 0.17 0.06 0.15 0.14 0.22 1.57
BK19 46.79 7.18 0.02 43.05 0.03 0.08 0.43 0.04 0.33 0.16 0.18 0.20 0.21 1.30
BK18 25.18 8.39 0.03 62.91 0.02 0.03 0.25 0.02 0.61 0.29 0.22 0.26 0.28 1.51
BK17 19.27 6.74 0.05 68.52 0.01 0.01 0.35 0.01 0.59 0.33 0.58 0.84 1.34 1.36
BK16 10.48 7.43 0.02 78.08 0.00 0.01 0.21 0.01 0.65 0.39 0.42 0.29 0.54 1.48
BK15 12.06 5.12 0.06 79.59 0.00 0.01 0.19 0.00 0.49 0.26 0.23 0.40 0.37 1.22
BK14 7.00 21.60 7.30 57.72 0.00 0.01 0.54 0.00 0.60 0.20 0.68 1.22 1.29 1.85
BK13 24.43 11.31 0.44 57.11 0.03 0.14 0.60 0.03 0.42 0.16 0.81 1.33 1.52 1.66
BK12 15.34 12.64 0.13 63.50 0.13 0.22 1.09 0.29 0.53 0.10 1.19 2.22 1.32 1.30
BK11 10.93 10.14 0.36 74.72 0.06 0.08 0.63 0.16 0.52 0.19 0.24 0.65 0.20 1.11
BK10 5.40 15.56 1.33 73.00 0.08 0.11 0.94 0.23 0.66 0.37 0.18 0.34 0.14 1.66
BK9 5.85 9.61 0.06 77.86 0.08 0.06 0.84 0.30 0.97 0.35 0.45 1.18 1.33 1.06
BK8 14.74 19.74 0.13 59.89 0.09 0.08 0.54 0.15 0.63 0.20 0.34 0.78 1.23 1.45
BK7 14.40 8.24 0.03 73.16 0.33 0.07 0.41 0.08 0.63 0.25 0.31 0.40 0.46 1.23
BK6 21.09 7.12 0.21 67.06 0.24 0.07 0.63 0.36 1.05 0.40 0.10 0.49 0.11 1.08
BK5 7.56 5.06 0.19 82.42 0.20 0.04 1.34 0.24 1.17 0.44 0.12 0.20 0.03 0.99
BK4 22.00 4.10 0.16 68.49 0.10 0.07 0.49 0.11 0.86 0.33 0.90 0.93 0.38 1.09
BK3 34.10 2.23 3.22 48.78 0.01 0.05 0.29 0.02 0.44 0.64 0.59 4.53 3.89 1.19
BK2 94.60 3.08 0.00 0.68 0.08 0.21 0.11 0.02 0.02 0.00 0.00 0.00 0.01 1.19
BK1(btm) 92.65 2.80 0.00 2.50 0.06 0.15 0.12 0.04 0.09 0.01 0.01 0.01 0.00 1.56
Note that the rows in bold indicate chromite stringer positions across the reef facies.

104
Table A2.2 Mineral modal abundances (wt.%) variations of samples of the RPM facies of the
Merensky reef (-2mm crushed ore sample) (from top to bottom)
Sample
ID
Wt%
Anor
Wt%
Aug
Wt%
Chr
Wt%
Enst
Wt%
Epid
Wt%
Kfsp
Wt%
Phlg
Wt%
Qtz
Wt%
trem
Wt%
Serp
Wt%
Ccp
Wt%
Pn
Wt%
Po
Wt%
Other
RPM25 11.04 6.03 4.45 67.97 0.13 0.06 1.00 0.11 2.00 1.99 0.64 1.17 1.84 1.57
RPM24 14.94 4.76 0.33 73.63 0.05 0.03 0.42 0.01 2.01 2.01 0.24 0.2 0.21 1.16
RPM23 3.82 12.40 0.97 68.04 0.13 0.01 2.48 0.83 4.66 3.60 0.41 0.62 0.46 1.56
RPM22 9.93 9.59 0.47 66.77 1.05 0.09 2.21 1.32 3.41 3.37 0.06 0.09 0.11 1.54
RPM21 15.90 3.85 0.38 65.03 1.87 0.24 3.56 1.66 2.58 3.07 0.03 0.03 0.02 1.79
RPM20 17.76 3.71 0.46 69.29 0.43 0.27 1.06 0.47 1.70 3.25 0.04 0.03 0.02 1.50
RPM19 9.30 7.73 0.48 74.49 0.60 0.41 1.79 0.72 1.10 1.66 0.03 0.04 0.02 1.63
RPM18 13.92 6.50 0.04 74.90 0.19 0.06 0.48 0.22 0.67 1.74 0.04 0.06 0.00 1.18
RPM17 10.12 10.81 0.05 73.49 0.38 0.13 0.82 0.31 0.70 1.61 0.02 0.04 0.02 1.51
RPM16 14.52 9.00 0.03 72.13 0.11 0.03 0.32 0.11 0.68 1.59 0.03 0.04 0.02 1.40
RPM15 9.44 8.77 0.05 77.70 0.11 0.03 0.51 0.09 0.68 1.11 0.03 0.03 0.02 1.43
RPM14 10.81 10.07 0.04 74.94 0.05 0.01 0.53 0.05 0.72 1.31 0.03 0.03 0.02 1.39
RPM13 8.74 4.09 5.52 75.42 0.26 0.21 1.32 0.39 1.09 0.87 0.08 0.11 0.11 1.79
RPM12 4.19 3.16 0.32 80.99 0.98 0.50 2.64 1.70 2.44 1.14 0.01 0.04 0.01 1.87
RPM11 23.91 0.85 1.19 67.16 0.19 0.17 0.84 0.28 0.57 2.61 0.01 0.16 0.05 2.01
RPM10 15.76 5.26 0.89 65.24 0.77 0.58 1.79 0.68 1.72 4.22 0.01 0.08 0.12 2.87
RPM9 23.17 0.92 0.55 58.52 0.19 0.19 0.84 0.07 0.71 10.57 0.02 0.20 0.56 3.50
RPM8 11.09 6.64 1.00 69.46 0.13 0.07 0.91 0.22 0.86 7.17 0.01 0.06 0.23 2.17
RPM7 8.15 17.36 0.76 65.21 0.22 0.16 1.19 0.19 1.19 3.76 0.02 0.05 0.16 1.59
RPM6 10.26 8.31 2.25 65.08 0.17 0.09 1.01 0.28 1.05 8.82 0.03 0.14 0.43 2.07
RPM5 19.29 3.46 1.21 54.58 0.04 0.12 1.24 0.00 0.49 15.09 0.02 0.16 0.68 3.60
RPM4 21.55 2.20 1.78 51.56 0.02 0.05 0.67 0.00 0.40 17.79 0.01 0.07 0.69 3.20
RPM3 20.63 3.85 17.94 46.10 0.09 0.03 0.83 0.13 1.17 6.08 0.09 0.19 0.34 2.51
RPM2 92.48 3.35 0.00 1.75 0.16 0.22 0.13 0.03 0.05 0.02 0.01 0.01 0.01 1.77
RPM1 94.14 2.15 0.04 1.51 0.18 0.06 0.09 0.05 0.07 0.03 0.01 0.00 0.00 1.43
Note that the rows in bold indicate chromite stringer positions across the reef facies.
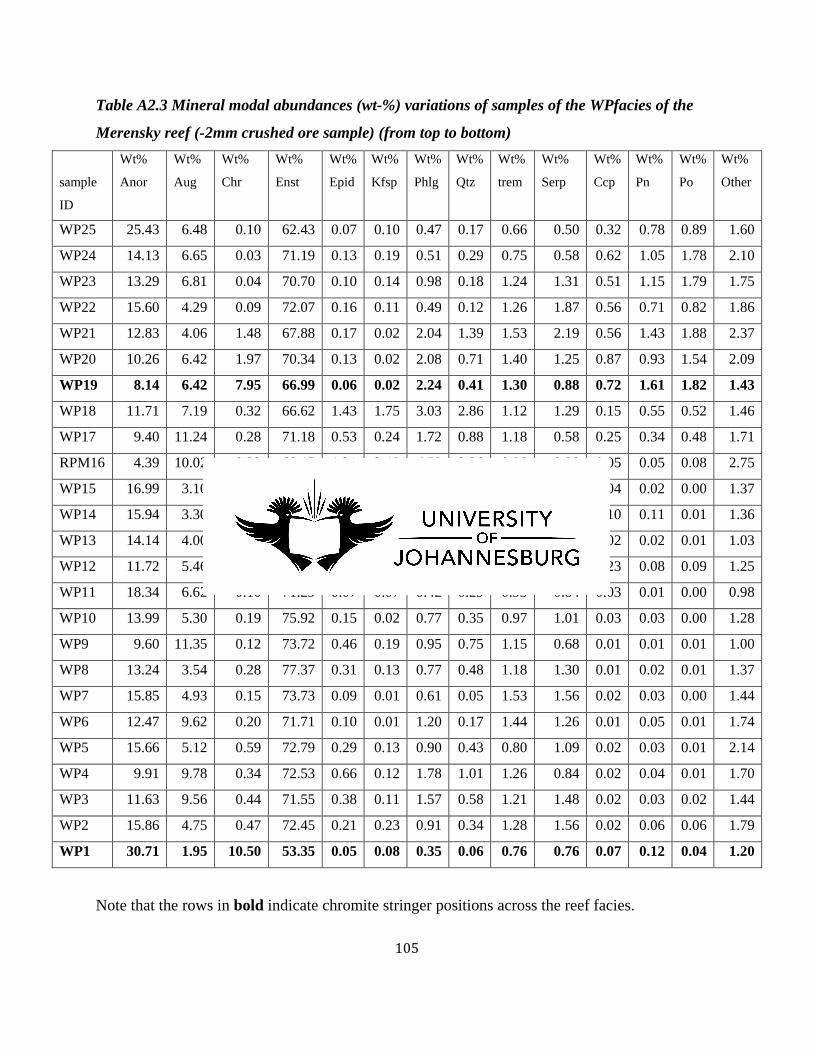
105
Table A2.3 Mineral modal abundances (wt-%) variations of samples of the WPfacies of the
Merensky reef (-2mm crushed ore sample) (from top to bottom)
sample
ID
Wt%
Anor
Wt%
Aug
Wt%
Chr
Wt%
Enst
Wt%
Epid
Wt%
Kfsp
Wt%
Phlg
Wt%
Qtz
Wt%
trem
Wt%
Serp
Wt%
Ccp
Wt%
Pn
Wt%
Po
Wt%
Other
WP25 25.43 6.48 0.10 62.43 0.07 0.10 0.47 0.17 0.66 0.50 0.32 0.78 0.89 1.60
WP24 14.13 6.65 0.03 71.19 0.13 0.19 0.51 0.29 0.75 0.58 0.62 1.05 1.78 2.10
WP23 13.29 6.81 0.04 70.70 0.10 0.14 0.98 0.18 1.24 1.31 0.51 1.15 1.79 1.75
WP22 15.60 4.29 0.09 72.07 0.16 0.11 0.49 0.12 1.26 1.87 0.56 0.71 0.82 1.86
WP21 12.83 4.06 1.48 67.88 0.17 0.02 2.04 1.39 1.53 2.19 0.56 1.43 1.88 2.37
WP20 10.26 6.42 1.97 70.34 0.13 0.02 2.08 0.71 1.40 1.25 0.87 0.93 1.54 2.09
WP19 8.14 6.42 7.95 66.99 0.06 0.02 2.24 0.41 1.30 0.88 0.72 1.61 1.82 1.43
WP18 11.71 7.19 0.32 66.62 1.43 1.75 3.03 2.86 1.12 1.29 0.15 0.55 0.52 1.46
WP17 9.40 11.24 0.28 71.18 0.53 0.24 1.72 0.88 1.18 0.58 0.25 0.34 0.48 1.71
RPM16 4.39 10.02 0.23 69.15 1.31 2.19 4.59 3.36 0.96 0.88 0.05 0.05 0.08 2.75
WP15 16.99 3.10 0.31 76.27 0.07 0.03 0.29 0.08 0.89 0.55 0.04 0.02 0.00 1.37
WP14 15.94 3.30 0.30 76.39 0.02 0.01 0.42 0.01 1.33 0.70 0.10 0.11 0.01 1.36
WP13 14.14 4.00 0.39 77.28 0.13 0.02 0.71 0.19 1.26 0.82 0.02 0.02 0.01 1.03
WP12 11.72 5.46 0.40 74.18 0.78 0.15 2.04 1.56 1.06 0.99 0.23 0.08 0.09 1.25
WP11 18.34 6.62 0.10 71.29 0.07 0.07 0.42 0.29 0.93 0.84 0.03 0.01 0.00 0.98
WP10 13.99 5.30 0.19 75.92 0.15 0.02 0.77 0.35 0.97 1.01 0.03 0.03 0.00 1.28
WP9 9.60 11.35 0.12 73.72 0.46 0.19 0.95 0.75 1.15 0.68 0.01 0.01 0.01 1.00
WP8 13.24 3.54 0.28 77.37 0.31 0.13 0.77 0.48 1.18 1.30 0.01 0.02 0.01 1.37
WP7 15.85 4.93 0.15 73.73 0.09 0.01 0.61 0.05 1.53 1.56 0.02 0.03 0.00 1.44
WP6 12.47 9.62 0.20 71.71 0.10 0.01 1.20 0.17 1.44 1.26 0.01 0.05 0.01 1.74
WP5 15.66 5.12 0.59 72.79 0.29 0.13 0.90 0.43 0.80 1.09 0.02 0.03 0.01 2.14
WP4 9.91 9.78 0.34 72.53 0.66 0.12 1.78 1.01 1.26 0.84 0.02 0.04 0.01 1.70
WP3 11.63 9.56 0.44 71.55 0.38 0.11 1.57 0.58 1.21 1.48 0.02 0.03 0.02 1.44
WP2 15.86 4.75 0.47 72.45 0.21 0.23 0.91 0.34 1.28 1.56 0.02 0.06 0.06 1.79
WP1 30.71 1.95 10.50 53.35 0.05 0.08 0.35 0.06 0.76 0.76 0.07 0.12 0.04 1.20
Note that the rows in bold indicate chromite stringer positions across the reef facies.

106
Table A2.4 Mineral modal abundances (wt-%) variations of samples of the UG2 Chromitite
facies (-2mm crushed ore sample) (from top to bottom)
sample ID
Wt%
Anor
Wt%
Aug
Wt%
Chr
Wt%
Enst
Wt%
Epid
Wt%
Kfsp
Wt%
Phlg
Wt%
Qtz
Wt%
trem
Wt%
Serp
Wt%
Ccp
Wt%
Pn
Wt%
Po
Wt%
Other
UG286 9.05 3.05 51.49 30.72 0.08 0.01 2.13 0.03 1.68 0.13 0.02 0.03 0.01 1.57
UG285 10.76 4.56 9.73 68.61 0.25 0.73 2.34 0.42 0.73 0.23 0.01 0.03 0.01 1.59
UG284 2.65 0.07 87.86 6.65 0.02 0.15 0.80 0.03 0.07 0.12 0.01 0.02 0.00 1.55
UG283 4.78 0.04 89.52 2.13 0.12 0.08 1.26 0.02 0.07 0.10 0.01 0.02 0.00 1.85
UG282 7.22 0.06 85.21 5.11 0.01 0.12 0.56 0.01 0.07 0.06 0.01 0.02 0.00 1.54
UG281 17.91 0.05 71.46 8.41 0.01 0.06 0.35 0.00 0.08 0.14 0.01 0.03 0.00 1.51
UG280 18.53 0.43 69.46 6.82 0.10 0.02 1.07 0.01 0.43 0.51 0.01 0.02 0.00 2.58
UG279 28.97 0.36 60.08 6.50 0.09 0.09 1.37 0.01 0.27 0.21 0.01 0.05 0.00 2.00
UG278 91.92 1.87 0.71 3.41 0.07 0.15 0.28 0.04 0.11 0.03 0.01 0.00 0.00 1.42
Full names of minerals abbreviations used in Tables A2.1-A2.4 are given below:
Anor…..anorthite, Aug…..augite, Chr….chromite, Enst….enstatite, Epid…epidote,
Kfsp…K-feldspar, Phlg….phlogopite, Qtz….quartz, Trem….tremolite, Serp….serpentine,
Ccp….chalcopyrite, Pn….pentlandite, Po….pyrrhotite,

107
APPENDIX 3: GEOCHEMICAL ANALYSES Table A3.1 Distribution of Cr, (ppm), S (wt.%), and 6PGE (ppb) in the BK facies of Merensky
Reef; abundant Cr, S, and PGE correlate with the position of chromitite stringers (-2mm
crushed ore sample) (from top to bottom) Element Cr Cu Ni S Au Ir Os Pd Pt Rh Ru
Units ppm ppm ppm Wt.% ppb ppb ppb ppb ppb ppb ppb
BK21 407 203 465 0.11 28 <2 <2 11 11 <1 <2
BK20 485 277 597 0.09 40 <2 <2 12 28 <1 <2
BK19 964 396 995 0.21 59 <2 <2 19 32 <1 5
BK18 1607 469 1242 0.16 74 <2 <2 27 37 2 6
BK17 1703 973 2361 0.45 163 4 <2 94 208 11 33
BK16 2112 613 1567 0.3 119 9 <2 203 385 26 65
BK15 2103 513 1562 0.28 148 15 <2 261 820 39 104
BK14 18194 1486 2971 0.57 240 202 175 1473 5711 564 1264
BK13 2664 1167 2286 0.44 425 118 83 1635 2845 351 772
BK12 2880 1756 3141 0.62 484 132 91 2789 7374 421 748
BK11 2490 460 1608 0.3 124 50 15 842 1973 145 333
BK10 3200 292 1180 0.17 86 28 <2 598 1489 78 194
BK9 2325 595 2304 0.38 293 161 126 3680 6683 506 1046
BK8 2101 471 1523 0.19 146 88 69 2299 9250 348 603
BK7 2000 771 2648 0.43 253 685 591 12851 11730 1890 3815
BK6 1940 142 761 0.1 35 43 4 1115 1296 94 280
BK5 2130 111 967 0.07 32 2 <2 131 132 9 26
BK4 1713 726 2428 0.44 1232 89 70 7157 17959 290 529
BK3 7292 1177 9602 1.43 202 460 440 14438 7354 1296 2677
BK2 87 20 72 <0.05 <5 <2 <2 4 8 3 6
BK1 99 22 104 <0.05 12 <2 <2 <2 <2 <1 2
Note that the rows in bold indicate chromite stringer positions across the reef facies.

108
Table A3.2 Distribution of Cr, (ppm), S (wt.%), and 6PGE (ppb) in the RPM facies of the
Merensky Reef (-2mm crushed ore sample) (from top to bottom) Element Cr Cu Ni S Au Ir Os Pd Pt Rh Ru
Units ppm ppm ppm Wt.% ppb ppb ppb ppb ppb ppb ppb
RPM25 10457 1430 3796 0.79 846 175 118 4377 9752 514 869
RPM24 2688 615 1389 0.32 253 26 <2 744 2600 77 157
RPM23 4051 846 2275 0.44 430 39 <2 1740 3619 116 200
RPM22 2791 73 723 0.05 56 2 <2 66 160 15 37
RPM21 2988 81 666 <0.05 13 2 <2 15 123 11 36
RPM20 3345 96 624 <0.05 5 7 <2 40 266 22 56
RPM19 3187 81 730 <0.05 <5 14 <2 67 607 56 81
RPM18 2111 76 576 0.08 <5 <2 <2 <2 14 2 <2
RPM17 2153 44 568 <0.05 <5 <2 <2 <2 29 3 4
RPM16 2099 65 567 <0.05 <5 <2 <2 <2 132 10 3
RPM15 2262 62 611 0.05 <5 <2 <2 4 94 12 12
RPM14 2287 61 656 <0.05 <5 <2 <2 11 69 3 3
RPM13 10837 210 1192 0.15 33 250 175 869 7757 807 1435
RPM12 3234 28 930 0.08 7 <2 <2 72 52 3 5
RPM11 2227 30 1290 <0.05 <5 <2 <2 63 28 2 5
RPM10 2085 42 1143 <0.05 <5 <2 <2 25 6 <1 3
RPM9 1042 20 1283 0.08 <5 <2 <2 32 <2 <1 <2
RPM8 2396 29 1247 <0.05 <5 <2 <2 44 33 3 6
RPM7 2621 41 1218 0.06 10 <2 <2 36 28 2 5
RPM6 3199 66 1544 0.06 18 13 <2 116 320 38 121
RPM5 1716 38 1415 <0.05 13 <2 <2 54 48 5 8
RPM4 1650 24 1138 <0.05 9 2 <2 29 112 15 12
RPM3 24858 173 1216 0.09 55 117 71 891 2812 368 705
RPM2 132 39 99 <0.05 8 <2 <2 27 14 5 11
RPM1 201 22 64 <0.05 <5 <2 <2 9 20 2 3
Note that the rows in bold indicate chromite stringer positions across the reef facies
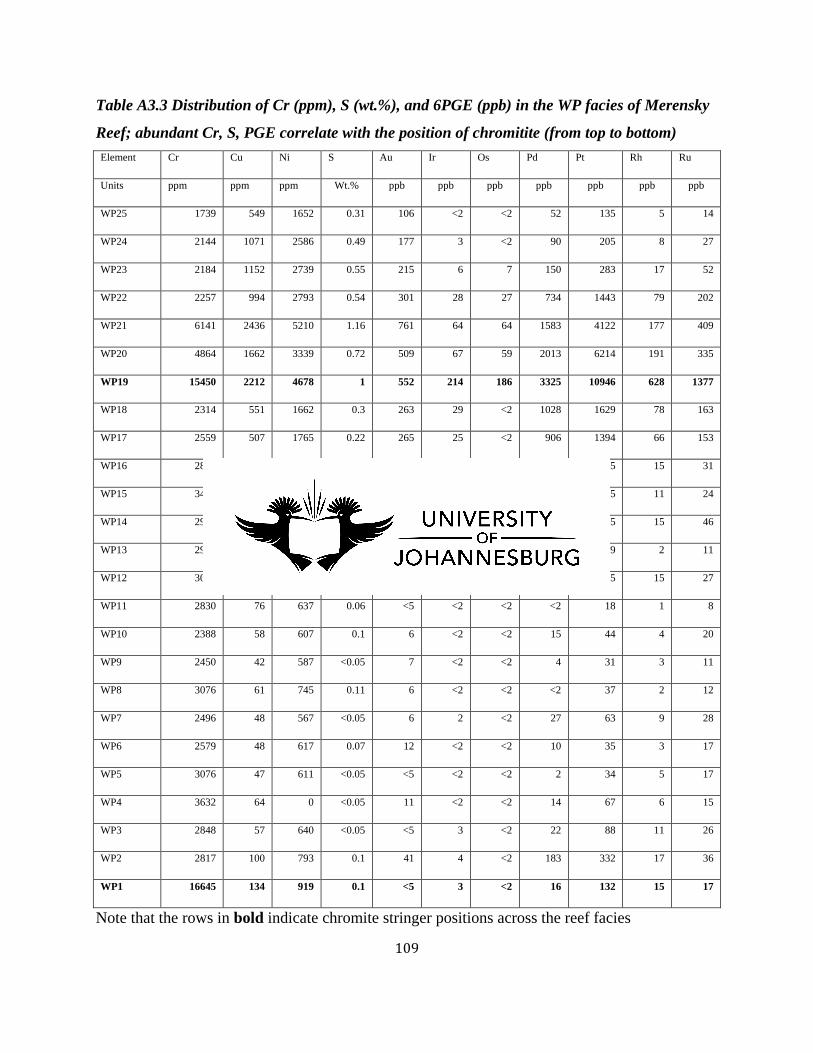
109
Table A3.3 Distribution of Cr (ppm), S (wt.%), and 6PGE (ppb) in the WP facies of Merensky
Reef; abundant Cr, S, PGE correlate with the position of chromitite (from top to bottom) Element Cr Cu Ni S Au Ir Os Pd Pt Rh Ru
Units ppm ppm ppm Wt.% ppb ppb ppb ppb ppb ppb ppb
WP25 1739 549 1652 0.31 106 <2 <2 52 135 5 14
WP24 2144 1071 2586 0.49 177 3 <2 90 205 8 27
WP23 2184 1152 2739 0.55 215 6 7 150 283 17 52
WP22 2257 994 2793 0.54 301 28 27 734 1443 79 202
WP21 6141 2436 5210 1.16 761 64 64 1583 4122 177 409
WP20 4864 1662 3339 0.72 509 67 59 2013 6214 191 335
WP19 15450 2212 4678 1 552 214 186 3325 10946 628 1377
WP18 2314 551 1662 0.3 263 29 <2 1028 1629 78 163
WP17 2559 507 1765 0.22 265 25 <2 906 1394 66 153
WP16 2837 140 1038 <0.05 38 3 <2 153 385 15 31
WP15 3466 144 809 <0.05 61 <2 <2 62 165 11 24
WP14 2904 145 857 0.11 81 6 <2 232 355 15 46
WP13 2998 68 628 <0.05 10 <2 <2 3 19 2 11
WP12 3062 331 1009 0.15 181 2 <2 423 385 15 27
WP11 2830 76 637 0.06 <5 <2 <2 <2 18 1 8
WP10 2388 58 607 0.1 6 <2 <2 15 44 4 20
WP9 2450 42 587 <0.05 7 <2 <2 4 31 3 11
WP8 3076 61 745 0.11 6 <2 <2 <2 37 2 12
WP7 2496 48 567 <0.05 6 2 <2 27 63 9 28
WP6 2579 48 617 0.07 12 <2 <2 10 35 3 17
WP5 3076 47 611 <0.05 <5 <2 <2 2 34 5 17
WP4 3632 64 0 <0.05 11 <2 <2 14 67 6 15
WP3 2848 57 640 <0.05 <5 3 <2 22 88 11 26
WP2 2817 100 793 0.1 41 4 <2 183 332 17 36
WP1 16645 134 919 0.1 <5 3 <2 16 132 15 17
Note that the rows in bold indicate chromite stringer positions across the reef facies

110
Table A3.4 Distribution of Cr, S (wt.%), Pd, Pt and 6PGE (ppm) in the UG2 Chromitite Reef
(from top to bottom)
Element Cr Cu Ni S Au Ir Os Pd Pt Rh Ru
Units ppm ppm ppm Wt.% ppb ppb ppb ppb ppb ppb ppb
UG286 152231 74 1200 0.08 8 86 15 514 1120 200 430
UG285 39549 38 791 <0.05 <5 21 <2 90 237 48 117
UG284 264184 48 1246 <0.05 7 175 85 326 2288 429 856
UG283 283937 49 1263 <0.05 <5 245 123 186 2501 376 1061
UG282 236697 61 1181 <0.05 17 235 146 528 3636 558 1235
UG281 222244 57 1192 <0.05 <5 155 63 362 1665 335 668
UG280 208765 50 1198 <0.05 13 297 192 3074 4224 863 1312
UG279 148396 45 914 <0.05 57 685 381 11574 8815 2113 2270
UG278 1789 40 167 <0.05 <5 <2 <2 10 10 4 13

111
APPENDIX 4: MILLING TESTS, ELEMENT DEPORTMENT AND FLOTATION DATA
The following tables of data show milling times for 60% mass passing 75µm sieve, grading
analysis, elemental deportment, and flotation performance data for BK, RPM, WPand UG2
facies ore samples.
Table A4.1 Mass % passing 75µm for BK, RPM, WP, and UG2 facies ore samples
Facies type Milling
times/minutes
Cumulative
mill
times/minutes
+75µ
mass/g
-75µ
mass/g
% passing
75µ
sieve
BK 10 10 765.6 225.4 22.74
15 25 548.9 431.4 44.01
25 50 292.9 684.3 70.03
RPM 10 10 746.0 245.5 24.76
15 25 522.0 465.0 47.11
25 50 229.9 739.5 76.28
WP 10 10 737.1 261.1 26.16
15 25 501.3 492.1 49.54
20 45 224.4 761.8 77.25
BK 10 10 761.5 236.7 23.71
15 25 504.9 487.1 49.10
25 50 82.3 910.0 91.71

112
Table A4.2 Grading Analysis results for BK, RPM, WPand UG2 ore facies
Facies Type Size fraction Mass-Discrete Discrete mass Cumulative mass
µm g % %
BK -25µm 12.24 1.23 1.23
+25µm 302.89 30.47 31.7
+53µm 307.24 30.9 62.6
+75µm 296.71 29.85 92.45
+106µm 75.08 7.55 100
Total 994.16
RPM -25µm 7.18 0.37 0.37
+25µm 426.24 21.92 22.29
+53µm 636.24 32.73 55.02
+75µm 736.24 37.87 92.89
+106µm 138.2 7.11 100
Total 1944.1
WP -25µm 16.02 0.86 0.86
+25µm 320.39 17.25 18.11
+53µm 616.24 33.18 51.29
+75µm 428.08 23.05 74.34
+106µm 476.65 25.66 100.00
Total 1857.38
UG2 -25µm 16.53 1.66 1.66
+25µm 284.6 28.55 30.21
+53µm 249.12 24.99 55.20
+75µm 354.51 35.56 90.76
+106µm 92.09 9.24 100.00
Total 996.85
The values in the above table were calculated as shown in Appendix 5, Example1.
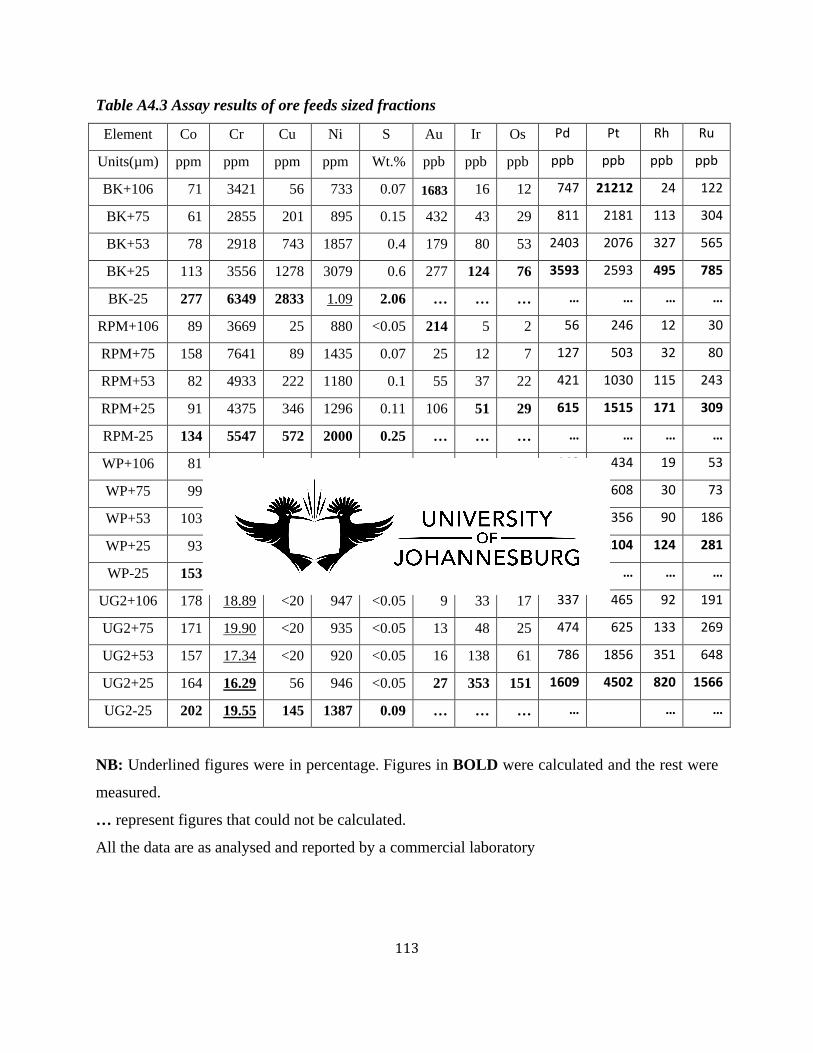
113
Table A4.3 Assay results of ore feeds sized fractions
Element Co Cr Cu Ni S Au Ir Os Pd Pt Rh Ru
Units(µm) ppm ppm ppm ppm Wt.% ppb ppb ppb ppb ppb ppb ppb
BK+106 71 3421 56 733 0.07 1683 16 12 747 21212 24 122
BK+75 61 2855 201 895 0.15 432 43 29 811 2181 113 304
BK+53 78 2918 743 1857 0.4 179 80 53 2403 2076 327 565
BK+25 113 3556 1278 3079 0.6 277 124 76 3593 2593 495 785
BK-25 277 6349 2833 1.09 2.06 … … … … … … …
RPM+106 89 3669 25 880 <0.05 214 5 2 56 246 12 30
RPM+75 158 7641 89 1435 0.07 25 12 7 127 503 32 80
RPM+53 82 4933 222 1180 0.1 55 37 22 421 1030 115 243
RPM+25 91 4375 346 1296 0.11 106 51 29 615 1515 171 309
RPM-25 134 5547 572 2000 0.25 … … … … … … …
WP+106 81 4261 124 911 0.09 234 10 9 140 434 19 53
WP+75 99 4764 261 1136 0.18 94 14 9 241 608 30 73
WP+53 103 4297 771 1833 0.35 208 33 19 692 1356 90 186
WP+25 93 4204 1085 2175 0.44 181 46 27 940 2104 124 281
WP-25 153 5857 1989 4432 0.88 … … … … … … …
UG2+106 178 18.89 <20 947 <0.05 9 33 17 337 465 92 191
UG2+75 171 19.90 <20 935 <0.05 13 48 25 474 625 133 269
UG2+53 157 17.34 <20 920 <0.05 16 138 61 786 1856 351 648
UG2+25 164 16.29 56 946 <0.05 27 353 151 1609 4502 820 1566
UG2-25 202 19.55 145 1387 0.09 … … … … … …
NB: Underlined figures were in percentage. Figures in BOLD were calculated and the rest were
measured.
… represent figures that could not be calculated.
All the data are as analysed and reported by a commercial laboratory
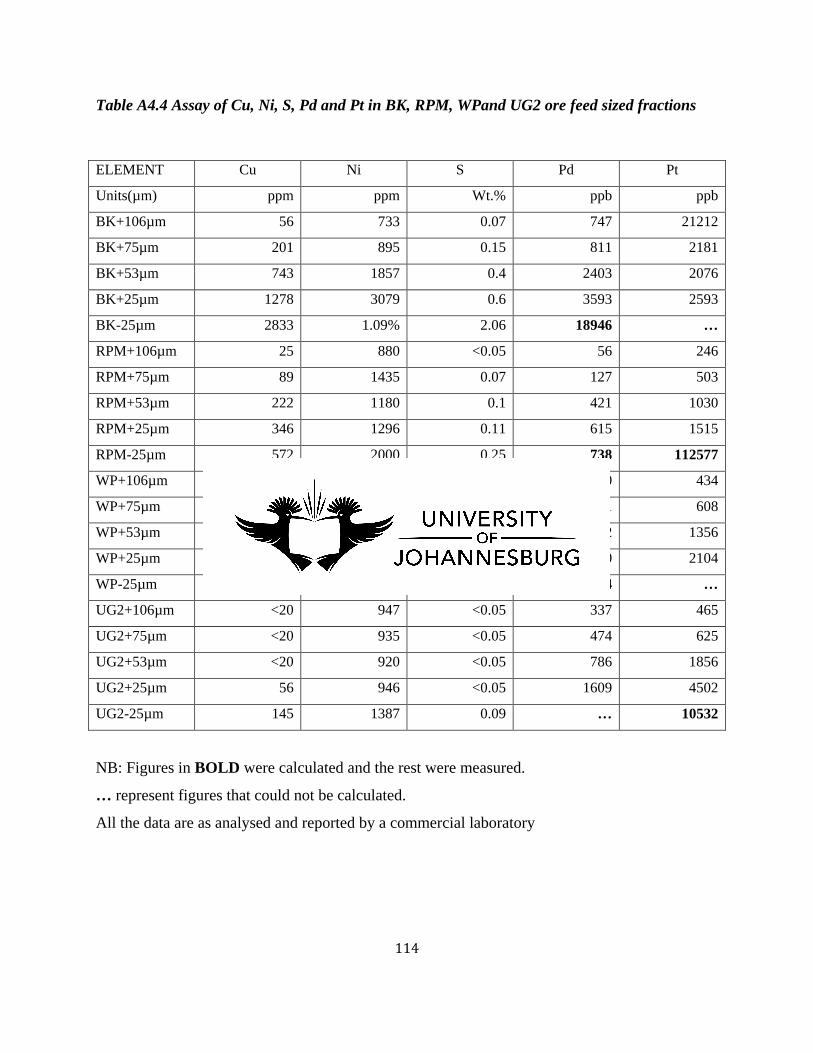
114
Table A4.4 Assay of Cu, Ni, S, Pd and Pt in BK, RPM, WPand UG2 ore feed sized fractions
ELEMENT Cu Ni S Pd Pt
Units(µm) ppm ppm Wt.% ppb ppb
BK+106µm 56 733 0.07 747 21212
BK+75µm 201 895 0.15 811 2181
BK+53µm 743 1857 0.4 2403 2076
BK+25µm 1278 3079 0.6 3593 2593
BK-25µm 2833 1.09% 2.06 18946 …
RPM+106µm 25 880 <0.05 56 246
RPM+75µm 89 1435 0.07 127 503
RPM+53µm 222 1180 0.1 421 1030
RPM+25µm 346 1296 0.11 615 1515
RPM-25µm 572 2000 0.25 738 112577
WP+106µm 124 911 0.09 140 434
WP+75µm 261 1136 0.18 241 608
WP+53µm 771 1833 0.35 692 1356
WP+25µm 1085 2175 0.44 940 2104
WP-25µm 1989 4432 0.88 1704 …
UG2+106µm <20 947 <0.05 337 465
UG2+75µm <20 935 <0.05 474 625
UG2+53µm <20 920 <0.05 786 1856
UG2+25µm 56 946 <0.05 1609 4502
UG2-25µm 145 1387 0.09 … 10532
NB: Figures in BOLD were calculated and the rest were measured.
… represent figures that could not be calculated.
All the data are as analysed and reported by a commercial laboratory

115
Table A4.5 Copper deportment results in BK, RPM, WPand UG2 ore milled feeds
Facies type Size fraction Fraction Mass Fraction Mass Cu mass Difference
µm g % % %
BK +106µm 75.08 7.55 2.01 -5.54
+75µm 296.71 29.85 31.45 1.60
+53µm 307.24 30.9 33.72 2.82
+25µm 302.89 30.47 32.77 2.30
-25µm 12.24 1.23 0.05 -1.18
Total 994.18 100 100
RPM +106µm 138.2 7.11 1.66 -5.45
+75µm 736.24 37.87 47.23 9.36
+53µm 636.24 32.73 35.27 2.54
+25µm 426.24 21.92 15.83 -6.09
-25µm 7.18 0.37 0.00 -0.37
Total 1944.1 100 99.99
WP +106µm 476.65 25.66 25.44 -0.22
+75µm 428.08 23.05 20.52 -2.53
+53µm 616.24 33.18 42.52 9.34
+25µm 320.39 17.25 11.49 -5.76
-25µm 16.02 0.86 0.03 -0.83
1857.38 100.00 100.00
UG2 +106µm 92.09 9.24 0.00 -9.24
+75µm 354.51 35.56 0.00 -35.56
+53µm 249.12 24.99 0.00 -24.99
+25µm 284.6 28.55 99.66 71.11
-25µm 16.53 1.66 0.34 -1.32
Total 996.85 100 100.00

116
Table A4.6 Nickel deportment results in BK, RPM, WPand UG2 ore milled feeds
Facies
Size
fraction
Fraction
Mass
Fraction
Mass Ni mass %difference
µm g % % %
BK +106µm 75.08 7.55 2.81 -4.74
+75µm 296.71 29.85 13.57 -16.28
+53µm 307.24 30.9 29.15 -1.75
+25µm 302.89 30.47 47.65 17.18
-25µm 12.24 1.23 6.82 5.59
Total 994.18 100 100.00
RPM +106µm 138.2 7.11 4.87 -2.24
+75µm 736.24 37.87 42.33 4.46
+53µm 636.24 32.73 30.08 -2.65
+25µm 426.24 21.92 22.13 0.21
-25µm 7.18 0.37 0.58 0.21
Total 1944.1 100 100.00
WP +106µm 476.65 25.66 15.41 -10.25
+75µm 428.08 23.05 17.26 -5.79
+53µm 616.24 33.18 40.08 6.90
+25µm 320.39 17.25 24.73 7.48
-25µm 16.02 0.86 2.52 1.66
Total 1857.38 100.00 100.00
UG2 +106µm 92.09 9.24 9.28 0.04
+75µm 354.51 35.56 35.26 -0.30
+53µm 249.12 24.99 24.38 -0.61
+25µm 284.6 28.55 28.64 0.09
-25µm 16.53 1.66 2.44 0.78
Total 996.85 100 100.00

117
Table A4.7 Sulfur deportment results in BK, RPM, WPand UG2 ore milled feeds
Facies
Size
fraction
Fraction
Mass
Fraction
Mass S mass %difference
µm g % % %
BK +106µm 75.08 7.55 1.38 -6.17
+75µm 296.71 29.85 11.72 -18.13
+53µm 307.24 30.9 32.37 1.47
+25µm 302.89 30.47 47.87 17.40
-25µm 12.24 1.23 6.64 5.41
Total 994.18 100 100.00 0.00
RPM +106µm 138.2 7.11 0.00 -7.11
+75µm 736.24 37.87 31.46 -6.41
+53µm 636.24 32.73 38.83 6.10
+25µm 426.24 21.92 28.62 6.70
-25µm 7.18 0.37 1.10 0.73
Total 1944.1 100 100.00 0.00
WP +106µm 476.65 25.66 8.74 -16.92
+75µm 428.08 23.05 15.70 -7.35
+53µm 616.24 33.18 43.95 10.77
+25µm 320.39 17.25 28.73 11.48
-25µm 16.02 0.86 2.87 2.01
Total 1857.38 100.00 100.00 0.00
UG2 +106µm 92.09 9.24 0.00 -9.24
+75µm 354.51 35.56 0.00 -35.56
+53µm 249.12 24.99 0.00 -24.99
+25µm 284.6 28.55 0.00 -28.55
-25µm 16.53 1.66 100.00 98.34
Total 996.85 100 100.00 0.00

118
Table A4.8 Palladium deportment results in BK, RPM, WPand UG2 ore milled feeds
Facies
Size
fraction
Fraction
Mass
Fraction
Mass Pd mass Difference
µm g % % %
BK +106µm 75.08 7.55 2.38 -5.17
+75µm 296.71 29.85 10.22 -19.63
+53µm 307.24 30.9 31.35 0.45
+25µm 302.89 30.47 46.21 15.74
-25µm 12.24 1.23 9.85 8.62
Total 994.16 100 100
RPM +106µm 138.2 7.11 1.22 -5.89
+75µm 736.24 37.87 14.69 -23.18
+53µm 636.24 32.73 42.08 9.35
+25µm 426.24 21.92 41.18 19.26
-25µm 7.18 0.37 0.83 0.46
Total 1944.1 100 100
WP +106µm 476.65 25.66 7.22 -18.44
+75µm 428.08 23.05 11.16 -11.89
+53µm 616.24 33.18 46.11 12.93
+25µm 320.39 17.25 32.57 15.32
-25µm 16.02 0.86 2.95 2.09
1857.38 100.00 100
UG2 +106µm 92.09 9.24 10.51 1.27
+75µm 354.51 35.56 14.78 -20.78
+53µm 249.12 24.99 24.52 -0.47
+25µm 284.6 28.55 50.19 21.64
-25µm 16.53 1.66 xxx xxx
Total 996.85 100

119
Table A4.9 Platinum deportment results in BK, RPM, WPand UG2 ore milled feeds
Facies
Size
fraction
Fraction
Mass
Fraction
Mass Pt mass Difference
µm g % % %
BK +106µm 75.08 7.55 43.48 35.93
+75µm 296.71 29.85 17.67 -12.18
+53µm 307.24 30.9 17.41 -13.49
+25µm 302.89 30.47 21.44 -9.03
-25µm 12.24 1.23 xxx xxx
Total 994.16 100
RPM +106µm 138.2 7.11 1.35 -5.76
+75µm 736.24 37.87 14.73 -23.14
+53µm 636.24 32.73 26.07 -6.66
+25µm 426.24 21.92 25.69 3.77
-25µm 7.18 0.37 32.16 31.79
Total 1944.1 100 100
WP +106µm 476.65 25.66 10.46 -15.20
+75µm 428.08 23.05 13.17 -9.88
+53µm 616.24 33.18 42.27 9.09
+25µm 320.39 17.25 34.1 16.85
-25µm 16.02 0.86 xxx xxx
1857.38 100.00
UG2 +106µm 92.09 9.24 1.96 -7.28
+75µm 354.51 35.56 10.15 -25.41
+53µm 249.12 24.99 21.19 -3.80
+25µm 284.6 28.55 58.72 30.17
-25µm 16.53 1.66 7.98 6.32
Total 996.85 100 100
NB: XXX represented valued that could not be calculated.

120
Table A4.10 Mass pull (g) and water recovery (g) variation with time for BK, RPM, WPand
UG2 samples (in duplicate)
Conc Name Flotation
Time/minutes
Wet conc
mass/g
Dry conc
mass/g
Water
recovery
mass/g
BK_B_Conc1 2 93.2 34 59.2
BK_B_Conc2 4 61.6 16.7 89.1
BK_B_Conc3 6 134 11.1 129
BK_B_Conc4 8 168.3 8.8 132.9
BK_C_Conc1 2 65.2 25.3 39.9
BK_C_Conc2 4 101.5 20.7 80.8
BK_C_Conc3 6 101.6 9.9 91.7
BK_C_Conc4 8 201.4 12.8 188.6
RPM_D_Conc1 2 71 23.9 47
RPM_D_Conc2 4 67.4 14.9 52
RPM_D_Conc3 6 115.8 12.4 103
RPM_D_Conc4 8 200.3 13.9 186
RPM_E_Conc1 2 82.8 26.6 56.2
RPM_E_Conc2 4 61.6 11.6 50
RPM_E_Conc3 6 134 13.3 120.7
RPM_E_Conc4 8 168.3 10.5 157.8
WP_E_Conc1 2 139.9 64.4 75.5
WP_E_Conc2 4 78.3 32.8 45.5
WP_E_Conc3 6 104.5 25.8 78.7
WP_E_Conc4 8 237.3 31.6 205.7
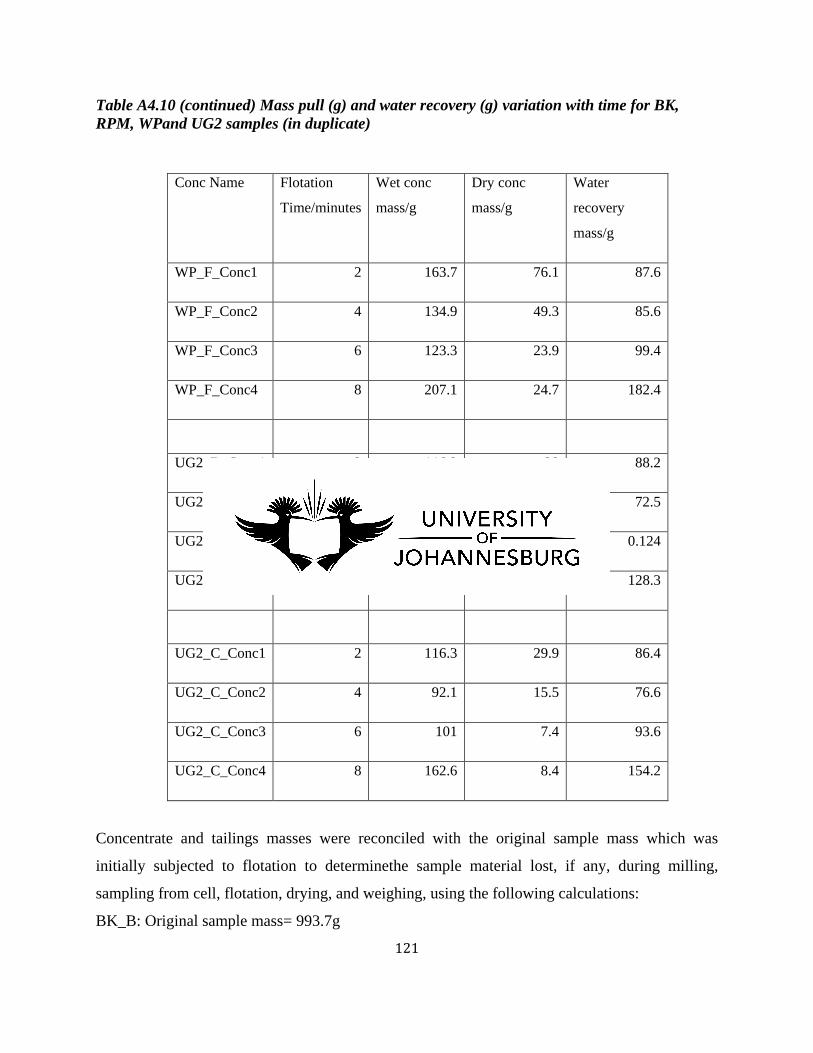
121
Table A4.10 (continued) Mass pull (g) and water recovery (g) variation with time for BK, RPM, WPand UG2 samples (in duplicate)
Conc Name Flotation
Time/minutes
Wet conc
mass/g
Dry conc
mass/g
Water
recovery
mass/g
WP_F_Conc1 2 163.7 76.1 87.6
WP_F_Conc2 4 134.9 49.3 85.6
WP_F_Conc3 6 123.3 23.9 99.4
WP_F_Conc4 8 207.1 24.7 182.4
UG2_B_Conc1 2 116.2 28 88.2
UG2_B_Conc2 4 89.7 17.2 72.5
UG2_B_Conc3 6 133.4 9.4 0.124
UG2_B_Conc4 8 0.1362 0.0079 128.3
UG2_C_Conc1 2 116.3 29.9 86.4
UG2_C_Conc2 4 92.1 15.5 76.6
UG2_C_Conc3 6 101 7.4 93.6
UG2_C_Conc4 8 162.6 8.4 154.2
Concentrate and tailings masses were reconciled with the original sample mass which was
initially subjected to flotation to determinethe sample material lost, if any, during milling,
sampling from cell, flotation, drying, and weighing, using the following calculations:
BK_B: Original sample mass= 993.7g
122
BK_B_FEED = 61 g (dry) – sampled from flotation cell before reagents additions (for assay).
BK_B_Tailings mass (dry) =850g.
Mass balance = Feed mass ( sampled)+Tailings mass+ sum of all concs = 981.6g
Mass loss = 12.1g
The average flotation test value of the duplicate sample was obtained by adding corresponding
timed concentrate masses of the same facies and dividing the sum by two. For example, the
average mass pull for BK_Conc1 is given by: (mass of BK_B_Conc1+ mass of
BK_C_Conc1)/2= (34g+25.3g)/2=29.65g

123
Table A4.11 Mineral modal abundances of feed and concentrates
Mineral FEED FEED FEED FEED CONC1 CONC1 CONC1 CONC1 BK RPM WP UG2 BK RPM WP UG2
Apatite 0.01 0.03 0.16 0.02 0 0 0.15 0
Augite 11.28 10.21 10.03 1.07 5.03 10.27 9.47 5.07
Calcite 0 0.01 0.02 0.01 0.05 0.32 0.18 0.24
Chalcopyrite 0.26 0.03 0.64 0 7.23 1.9 2.56 0.37
Chlorite 0.06 0.17 0.07 0.07 0.02 0.08 0.03 1.09
Chromite 1.09 3.1 1.56 72.96 0.09 0.27 0.23 17.41
Dolomite 0 0 0 0 0 0.01 0 0
Enstatite 57.63 63.54 68.36 9.5 39.19 68.49 66.74 56.11
Galena 0 0 0 0 0.01 0.01 0.02 0
Hornblende 0.68 1.04 0.63 0.21 1.18 1.24 0.95 2.13
Ilmenite 0.02 0.07 0 0 0 0 0.04 0
Forsterite 0.08 2.08 0.06 0.43 0.19 1.01 0.46 3.82
Orthoclase 0.1 0.15 0.17 0.12 0.04 0.05 0.02 0.25
Pentlandite 0.91 0.07 0.66 0.03 23.29 4.39 5.9 1.21
Biotite 0.26 0.59 0.61 0.57 0.35 1.85 1.09 1.58
Plagioclase 23.44 14.31 12.77 12.22 1.66 1.82 1.11 5.84
PtFeSnS 0.02 0.02 0.01 0.01 0.03 0.04 0.03 0.01
PtTeBi 0.81 0.92 0.78 0.9 0.03 0 0 0
Pyrrhotite 1.2 0.08 0.79 0.03 18.93 3.2 6.27 0.58
Quartz 0.15 0.61 0.56 0.05 0.02 0.25 0.45 0.95
RuS 0 0 0 0 0.15 0 0 0
Rutile 0 0 0 0.02 0 0 0 0.12
Serpentine 0.02 0.04 0.05 0.02 0.05 0.16 0.16 0.32
Talc 0.77 0.84 0.83 0.06 1.72 2.57 2.56 0.87
Tremolite 0.15 0.17 0.24 0.09 0.42 1.3 1.02 1.81
Wollastonite 0.01 0.02 0.02 0 0 0.01 0.02 0.11
PtPdS 0 0 0 0 0 0 0 0
PdBiTe 0 0 0 0.04 0 0 0 0
ThPO4 0.02 0.03 0.02 0.6 0 0 0 0.05
RhPtAsS 0.38 0.49 0.3 0.77 0.18 0.05 0.09 0.02
ThSiO3 0.29 0.34 0.38 0.05 0 0 0 0
Magnetite 0.29 0.97 0.2 0.06 0.13 0.7 0.46 0.01
PdBi 0.04 0.06 0.04 0.1 0 0 0 0
Total 100 100 100 100 100 100 100 100

124
Table A4.11 (continued) Mineral modal abundances of feed and concentrates
Mineral CONC
2 CONC
2 CONC
2 CONC
2 CONC
3 CONC
3 CONC
3 CONC
3 CONC
4 CONC
4 CONC
4 CONC
4
BK RPM WP UG2 BK RPM WP UG2 BK RPM WP UG2 Apatite 0 0.02 0.07 0 0.02 0 0 0 0 0 0.06 0.16
Augite 9.91 10.39 9.53 5 9.4 11.71 11.02 13.3 10.94 11.18 10.09 3.78
Calcite 0.01 0.09 0.09 0.09 0.11 0.07 0.03 0.01 0.02 0.03 0.05 0.03
Chalcopyrite
1.67 0.51 0.62 0.02 0.4 0.22 0.57 0.83 0.15 0.12 0.31 0.01
Chlorite 0.04 0.1 0.04 0.84 0.32 0.13 0.04 0.03 0.05 0.13 0.04 0.64
Chromite 0.18 0.34 0.69 16.82 5.68 0.17 0.2 0.7 0.01 0.37 0.25 21.3
Enstatite 66.29 75.46 77.84 61.02 67.78 75.03 76.8 72.34 75.59 73.93 79.16 55.9
Galena 0.02 0.01 0.01 0 0.01 0 0.01 0 0 0 0 0
Hornblende 1.21 0.92 0.64 1.77 1.94 1.91 0.93 1.75 2.32 2.64 1.04 2.55
Ilmenite 0 0.01 0 0 0 0.01 0 0 0 0 0 0
Forsterite 0.14 0.83 0.19 2.55 1.85 1.18 0.17 0.11 0.16 1.23 0.15 4.25
Orthoclase 0.05 0.04 0.05 0.27 0.17 0.08 0.13 0.08 0.04 0.14 0.11 0.14
Pentlandite 4.87 1.51 2.13 0.04 0.86 0.21 0.51 0.44 0.44 0.19 0.21 0.04
Biotite 0.51 2.05 1.31 1.71 0.88 2.18 2.06 0.63 0.83 2.11 1.19 1.65
Plagioclase 3.84 1.42 1.45 6.71 4.75 1.3 1.71 4.01 4.24 2.04 1.99 6.45
PtFeSnS 0.02 0.01 0.01 0.01 0.01 0.01 0.02 0.02 0.04 0 0 0
PtTeBi 0 0 0 0.01 0.01 0 0 0 0 0 0 0.03
Pyrrhotite 8.77 2.87 1.99 0.01 2.25 0.72 1.03 2.07 0.43 1.47 0.87 0.05
Quartz 0.28 0.26 0.64 0.66 0.31 0.51 0.79 0.18 0.23 0.37 0.8 0.82
Rutile 0.01 0 0 0.1 0 0 0.02 0 0 0 0.1 0.01
Serpentine 0.06 0.16 0.1 0.21 0.09 0.12 0.06 0.06 0.06 0.06 0.08 0.09
Talc 1.52 1.51 1.49 0.44 2.12 3.12 2.64 2.46 3.22 2.67 2.52 0.9
Tremolite 0.54 1.16 0.77 1.53 0.84 1.14 0.89 0.87 1.03 1.07 0.83 0.92
Wollastonite
0.01 0.01 0.03 0.1 0.04 0.04 0.04 0.02 0.02 0.03 0.04 0.05
PtPdS 0 0 0 0 0.01 0 0 0 0 0 0 0
ThPO4 0 0 0 0.08 0.06 0 0 0 0 0 0 0.16
RhPtAsS 0.03 0.02 0.03 0 0.02 0.02 0.01 0 0.01 0.01 0.01 0
ThSiO3 0 0 0 0 0.01 0 0 0 0 0 0 0
Magnetite 0.03 0.31 0.28 0.01 0.07 0.12 0.33 0.08 0.18 0.19 0.1 0.04
Total 100 100 100 100 100 100 100 100 100 100 100 100

125
Table A4.12 SPLGXMAP Chalc+Pent+Pyrr Wt.% locking in BK, RPM, WPand UG2 feeds
Total Sulphides locked in…
BK-Binary Particle (%)
RPM-Binary Particle (%)
UG2-Binary Particle (%)
WP-Binary Particle (%)
BK-Ternary particle (%)
RPM-Ternary Particle (%)
UG2-Ternary Particle (%)
WP-Ternary Particle (%)
Calcite 0.56 0.00 0.33 0.11 0.05 0.14 0.01 0.09 Chlorite 0.00 0.00 0.62 0.00 0.01 0.00 0.04 0.00 Chromite 0.08 0.06 5.15 0.06 0.00 0.01 1.31 0.01 Dolomite 0.00 0.00 0.00 0.00 0.00 0.00 0.00 0.00 Enstatite 2.63 3.41 2.35 5.66 0.64 1.16 2.25 0.78 Epidote 0.00 0.00 0.00 0.00 0.00 0.00 0.00 0.00 Galena 0.00 0.00 0.00 0.00 0.00 0.00 0.00 0.02 Hornblende 0.50 1.06 2.65 0.19 0.18 0.31 0.78 0.28 Ilmenite 0.00 0.00 0.00 0.00 0.00 0.00 0.00 0.00 Forsterite 0.03 0.00 0.00 0.00 0.02 0.11 0.88 0.01 Orthoclase 0.00 0.00 0.06 0.00 0.01 0.00 0.58 0.01 Biotite 0.00 0.45 0.31 0.25 0.01 0.01 1.71 0.00 Plagioclase 1.64 1.66 3.56 0.90 0.15 0.26 3.33 0.26 PtAs 0.00 0.00 0.00 0.00 0.00 0.00 0.00 0.00 PtFe 0.00 0.00 0.00 0.00 0.00 0.00 0.00 0.00 PtFeSnS 0.49 0.23 1.04 0.40 0.00 0.05 0.00 0.08 PtS 0.00 0.00 0.00 0.00 0.00 0.00 1.36 0.00 PtTeBi 0.06 0.00 0.00 0.00 0.00 0.00 0.06 0.00 Quartz 0.00 0.00 0.00 0.08 0.03 0.02 0.77 0.07 RuS 0.00 0.00 1.32 0.00 0.00 0.00 0.00 0.00 Rutile 0.00 0.00 0.00 0.00 0.00 0.00 0.05 0.00 Serpentine 0.00 0.00 0.00 0.00 0.00 0.00 0.00 0.01 Talc 0.16 0.00 0.00 0.02 0.05 0.11 0.03 0.07 Tremolite 0.00 0.00 0.00 0.02 0.01 0.00 0.10 0.01 PtPdS 0.00 0.00 1.39 0.00 0.00 0.00 0.66 0.01 RhPtAsS 4.75 3.67 6.85 5.77 0.01 0.24 0.30 0.18 ThSiO3 0.00 0.00 0.00 0.00 0.00 0.00 0.00 0.00 Magnetite 0.19 1.51 0.52 0.92 0.12 0.84 0.67 0.51 Total 11.90 12.60 26.35 15.73 1.53 3.99 15.70 2.66
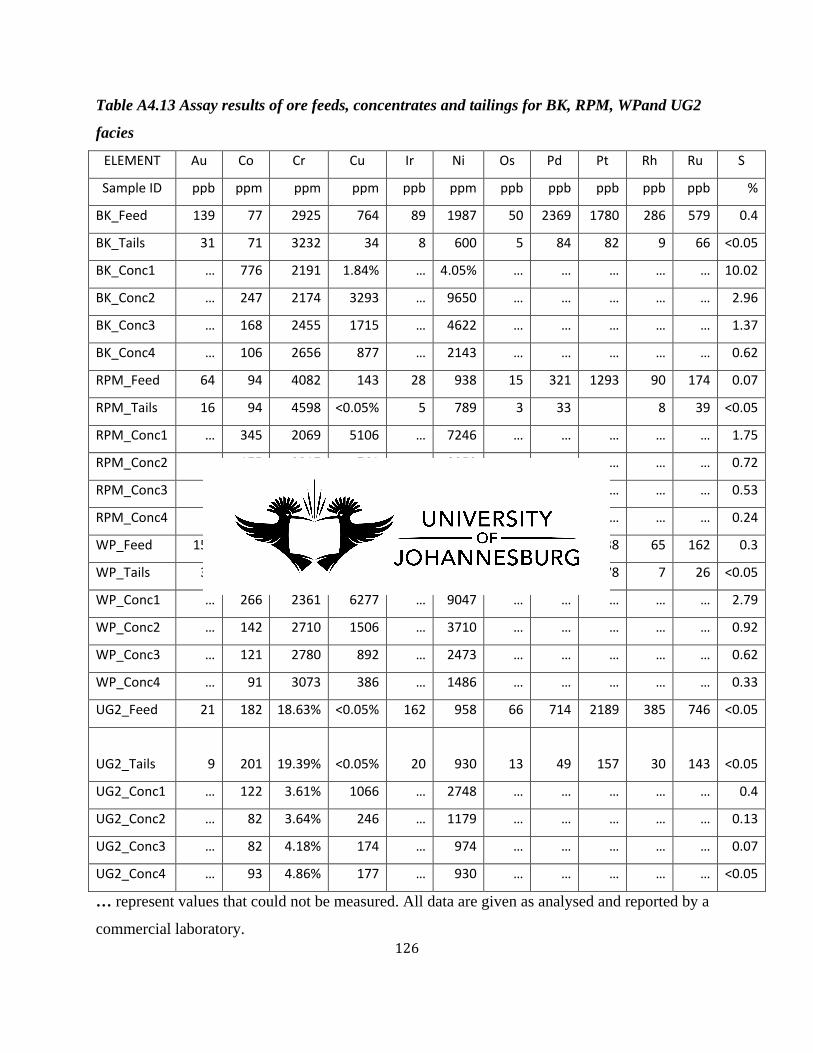
126
Table A4.13 Assay results of ore feeds, concentrates and tailings for BK, RPM, WPand UG2
facies
ELEMENT Au Co Cr Cu Ir Ni Os Pd Pt Rh Ru S
Sample ID ppb ppm ppm ppm ppb ppm ppb ppb ppb ppb ppb %
BK_Feed 139 77 2925 764 89 1987 50 2369 1780 286 579 0.4
BK_Tails 31 71 3232 34 8 600 5 84 82 9 66 <0.05
BK_Conc1 … 776 2191 1.84% … 4.05% … … … … … 10.02
BK_Conc2 … 247 2174 3293 … 9650 … … … … … 2.96
BK_Conc3 … 168 2455 1715 … 4622 … … … … … 1.37
BK_Conc4 … 106 2656 877 … 2143 … … … … … 0.62
RPM_Feed 64 94 4082 143 28 938 15 321 1293 90 174 0.07
RPM_Tails 16 94 4598 <0.05% 5 789 3 33 8 39 <0.05
RPM_Conc1 … 345 2069 5106 … 7246 … … … … … 1.75
RPM_Conc2 … 175 2317 761 … 3250 … … … … … 0.72
RPM_Conc3 … 148 2886 392 … 2216 … … … … … 0.53
RPM_Conc4 … 104 2798 243 … 1283 … … … … … 0.24
WP_Feed 153 74 4045 554 26 1413 17 498 938 65 162 0.3
WP_Tails 31 79 4803 28 3 664 2 37 78 7 26 <0.05
WP_Conc1 … 266 2361 6277 … 9047 … … … … … 2.79
WP_Conc2 … 142 2710 1506 … 3710 … … … … … 0.92
WP_Conc3 … 121 2780 892 … 2473 … … … … … 0.62
WP_Conc4 … 91 3073 386 … 1486 … … … … … 0.33
UG2_Feed 21 182 18.63% <0.05% 162 958 66 714 2189 385 746 <0.05
UG2_Tails 9 201 19.39% <0.05% 20 930 13 49 157 30 143
<0.05
UG2_Conc1 … 122 3.61% 1066 … 2748 … … … … … 0.4
UG2_Conc2 … 82 3.64% 246 … 1179 … … … … … 0.13
UG2_Conc3 … 82 4.18% 174 … 974 … … … … … 0.07
UG2_Conc4 … 93 4.86% 177 … 930 … … … … … <0.05
… represent values that could not be measured. All data are given as analysed and reported by a
commercial laboratory.
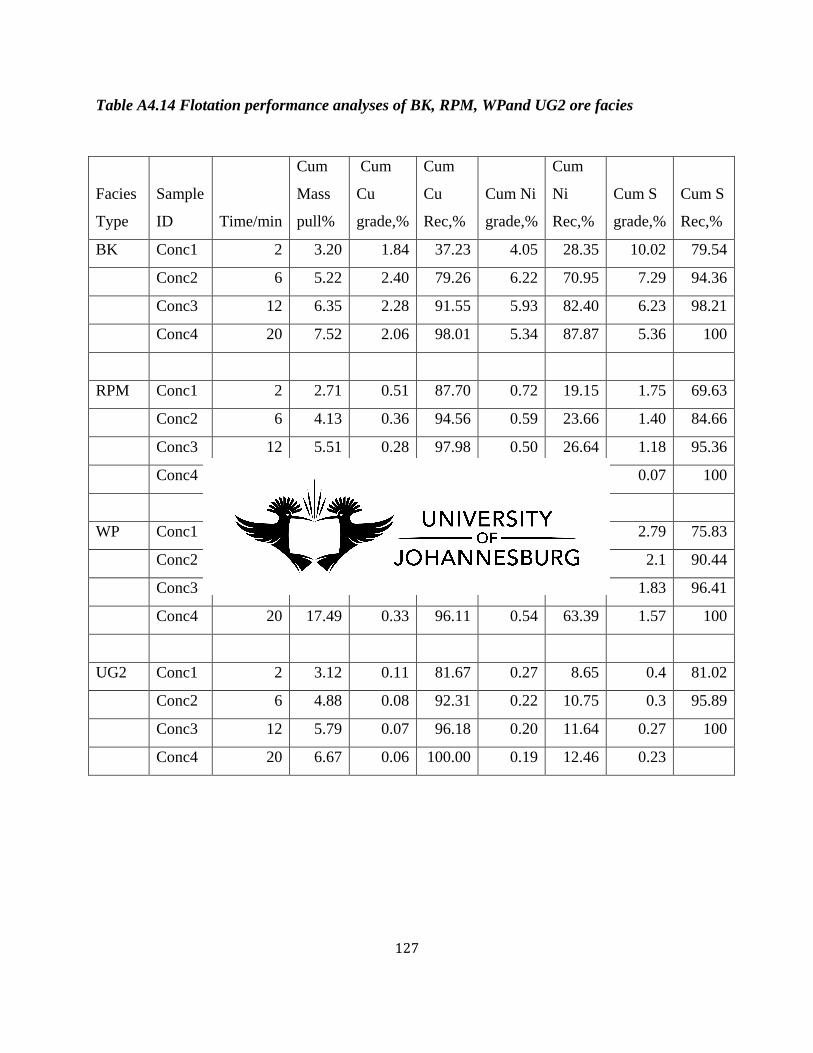
127
Table A4.14 Flotation performance analyses of BK, RPM, WPand UG2 ore facies
Facies
Type
Sample
ID Time/min
Cum
Mass
pull%
Cum
Cu
grade,%
Cum
Cu
Rec,%
Cum Ni
grade,%
Cum
Ni
Rec,%
Cum S
grade,%
Cum S
Rec,%
BK Conc1 2 3.20 1.84 37.23 4.05 28.35 10.02 79.54
Conc2 6 5.22 2.40 79.26 6.22 70.95 7.29 94.36
Conc3 12 6.35 2.28 91.55 5.93 82.40 6.23 98.21
Conc4 20 7.52 2.06 98.01 5.34 87.87 5.36 100
RPM Conc1 2 2.71 0.51 87.70 0.72 19.15 1.75 69.63
Conc2 6 4.13 0.36 94.56 0.59 23.66 1.40 84.66
Conc3 12 5.51 0.28 97.98 0.50 26.64 1.18 95.36
Conc4 20 6.82 0.23 100.00 0.43 28.28 0.07 100
WP Conc1 2 7.48 0.63 79.09 0.90 45.21 2.79 75.83
Conc2 6 11.85 0.45 90.18 0.71 56.04 2.1 90.44
Conc3 12 14.49 0.39 94.16 0.62 60.41 1.83 96.41
Conc4 20 17.49 0.33 96.11 0.54 63.39 1.57 100
UG2 Conc1 2 3.12 0.11 81.67 0.27 8.65 0.4 81.02
Conc2 6 4.88 0.08 92.31 0.22 10.75 0.3 95.89
Conc3 12 5.79 0.07 96.18 0.20 11.64 0.27 100
Conc4 20 6.67 0.06 100.00 0.19 12.46 0.23

128
APPENDIX 5: DETAILS OF CALCULATIONS PERFORMED FOR DATA REDUCTION
EXAMPLE 1: Grading analysis calculations, using BK facies sample mass
Table A5.1 Grading analysis of sample of the BK facies type of Merensky Reef
Size fraction
Sample fraction Mass
Sample fraction Mass
Cumulative Mass
µm g % %
-25µm 12.24 1.23 1.23
+25µm 302.89 30.47 31.7
+53µm 307.24 30.9 62.6
+75µm 296.71 29.85 92.45
+106µm 75.08 7.55 100
Total 994.16
Sample fraction mass %
To get sample fraction mass %, the sample fraction mass for a given size fraction is divided by
the total sample mass, and then multiplied by 100. For example, +25µm fraction mass:
Sample fraction mass% = (302.89g/994.16g)x100=30.47%.
The rest are calculated in the same way.
Cumulative mass %
Cumulative mass % is calculated by adding a given fraction mass % to the next, for example:
Cumulative mass % for -25µm fraction =1.23%
Cumulative mass % for +25µm fraction =1.23%+30.47%=31.7%
Cumulative mass % for +53µm fraction =31.7%+30.95=62.6%, and so on.
The same calculation procedure was applied to all the other facies.

129
EXAMPLE 2: Deportment study calculations, using BK facies sample mass fractions and Pd
assays
Table A5.2 Deportment analysis for Pd in sieved mass fractions of samples of the BK facies
type of Merensky Reef
Size fraction
Sample fraction Mass, g
Sample fraction Mass,%
Pd assay
in fraction,%
Pd mass in
fraction,
g
Pd mass % in
fraction
Pd upgrade/or downgrade
+106µm 75.08 7.55 0.0000747 0.0000561 2.38 -5.17
+75µm 296.71 29.85 0.0000811 0.000241 10.22 -19.63
+53µm 307.24 30.9 0.00024 0.000738 31.35 0.45
+25µm 302.89 30.47 0.000359 0.001088 46.21 15.74
-25µm 12.24 1.23 0.00189 0.000232 9.85 8.62
Total 994.16 100 0.002355 100.00
Sample fraction mass%
This is calculated as shown in Appendix 5, Example 1.
Pd mass in size fraction
Using assay values from Appendix 4, Table A4.6, Pd masses in the size fractions calculated as
follows:
Pd mass in +106µm fraction=0.0000747% x75.08g=0.0000561g.
Pd mass in +75µm fraction=0.0000811% x296.71g=0.000241g
Pd mass in +53µm fraction=0.00024% x307.24g=0.000738g
Pd mass in +25µm fraction=0.000359% x302.89g=0.001088g
Pd mass in -25µm fraction=0.00189% x12.24g=0.000232g
130
Total Pd mass in all fractions (sum of all the above Pd masses in all fractions) = 0.002355g
Pd mass % in fractions
To get Pd mass % for a given fraction, the Pd mass in that fraction is divided by the total Pd
mass in all the fractions, and then multiplied by 100 as shown below:
Pd mass % in +106µm fraction= (0.0000561g/0.002355g) x100=2.38%
Pd mass % in +75µm fraction= (0.000241g/0.002355g) x100=10.22%
Pd mass % in +53µm fraction = (0.000738g/0.002355g) x100=31.35%
Pd mass % in +25µm fraction= (0.001088g/0.002355g) x100=46.21%
Pd mass % in -25µm fraction= (0.000232g/0.002355g) x100=9.85%
Pd upgrade/or downgrade values
Upgrade or downgrade values for a given size fraction is given by the formula below:
Upgrade or downgrade value=Pd mass% in fraction-Sample fraction mass%.
For example, upgrade/or downgrade value for +106µm fraction=2.38% -7.55%=-5.17%
For +75µm fraction= 10.22% -29.85%= -19.63%
For +53µm fraction=31.35% -30.9%= 0.45%
For +25µm fraction=46.21% -30.47%= 15.74%
For -25µm fraction=9.85% -1.23%= 8.62%
The same calculation procedure is applied to all facies sized sample fractions for Cu, Ni, S and
Pt. The upgrade or downgrade values are then plotted as function of size fraction to determine
the deportment pattern of Cu, Ni, S, Pd and Pt in the various sized sample fractions.

131
EXAMPLE 3: Flotation recovery efficiency calculations
Table A5.3 Flotation recovery efficiency values from calculation examples
Facies type Ore feed mass/g Head grade/ppb
Pt
Tails mass/g Tails grade/ppb
Pt
BK 1990.4 1780 1713.3 82
RPM 2016.3 1293 1737 79
WP 2009.4 938 1550.2 78
UG2 1993 2189 1731.3 157
The values in Appendix 4, Table 5.3 were obtained as shown by the following calculations:
1ppb =1/10 000 000%.
Working:
Total Pt in ore feed = 1990.4x1780/10 000 000 = 0.003542912g
Total Pt in tails = 1713.3x82/10 000 000 = 0.000140491g
Total Pt recovered to concentrate = 0.00340242g
Percentage of Pt recovered to concentrate = (0.00340242g/0.003542912g)x100%
= 96.03% as shown in Table 5.3.
All values for the other PGE and gold recovered to concentrate were calculated in the same way.

132
EXAMPLE 4: Cumulative mass pull, grade and recovery performance calculations.
Table A5.4 Mass pulls, grades, and recoveries in a sample of the BK facies type of Merensky Reef
Sample
ID
Time min
Mass pull,
g
Cum mass pull,
g
Cum Mass pull,
%
Cu Assay,
%
Cu Mass,
g
Cum Cu Mass,
g
Cum Cu
grade,
%
Cum Cu
Rec, %
C1 2 59.30 59.30 3.20 1.84 1.09 1.09 1.84 37.23
C2 4 37.40 96.70 5.22 3.29 1.23 2.32 2.40 79.26
C3 6 21.00 117.70 6.35 1.72 0.36 2.68 2.28 91.55
C4 8 21.60 139.30 7.52 0.88 0.19 2.87 2.06 98.01
Tails 1713.30 0.0034 0.06 2.93 100.00
Total 1852.60
The values in the above table are obtained as shown by the following calculations:
C1 to C4 are Concentrate1 to Concentrate4 (mass pulls) collected at 2, 6, 12 and 20 minutes of
flotation times respectively.
Cumulative mass pulls are successive sums of mass pulls, for eaxmple:
Cumulative mass pull corresponding to C1=59.30g
Cumulative mass pull corresponding to C2 (59.3g+37.4g) =96.70g
Cumulative mass pull corresponding to C3 (96.7g+21g) =117.70g
Cumulative mass pull corresponding to C4 (117.7g+21.6g) =139.30g
Cumulative mass pull% is obtained by dividing each cumulative mass pull value by total mass of
concentrates and tails, and then multiplying by 100, for example:
Cumulative mass pull% corresponding to C1= (59.30g/1852.60g) x100=3.20%
Assay values are taken from Appendix 4, Table A4.16. For example, for C1, %Cu=1.84%

133
Mass of Cu, corresponding to C1=(1.84x59.30g)/100=1.09g. All values corresponding to C2-C4
are obtained in the same way.
Cumulative Cu masses are obtained by adding the next Cu mass pull to the previous consecutive
value, for example:
Cumulative Cu mass pull corresponding to C2=(1.09g+1.23g) =2.32g
Cumulative Cu mass pull corresponding to C3=(2.32g+0.36g) =2.68g, and so on.
Cumulative Cu grade % is obtained by dividing cumulative Cu mass by corresponding
cumulative mass pull, and then multiplying by 100%, for example:
Comulative Cu grade % corresponding to C2=(2.32g/96.7g)x100 =2.40%, and so on.
Cumulative Cu recovery % is obtained by dividing each cumulative Cu mass by the total Cu
mass recovered, and then multiplying by 100%, for example:
Cumulative Cu recovery corresponding to C3=(2.68g/2.93g)x100%=91.5%
The same calculation procedure is done for Co, Cr, Ni, and S for all the RPM, WPand UG2
concentrates, and all the results are shown in Table 5.4.

134
CORRECTIONS BASED ON REVIEWERS COMMENTS.
REVIEWER 1
Evaluation of MSc dissertation entitled: Geometallurgical characterization of Merensky reef and
UG2 at the Lonmin Marikana mine, Bushveld Complex, South Africa.
MSc candidate: Mr Thomas Dzvinamurungu (Department of Geology).
Supervisors: Prof. KS Viljoen and Mr. M Knoper
The dissertation describes and applies a protocol for a geometallurgical assessment for the
different facies types in the Bushveld complex. His applied research is relevant for the platinum
mining industry as the result can be used to improve their ore processing procedure. Further, the
thesis lays out a methodology that can be used by the mining industry to investigate the
geometallurgical characteristics of ore material. As such, this research is relevant and beneficial
to the mining industry.
The dissertation shows that the candidate has the ability to define a problem statement and that
he can successfully generate results to address the defined problem. I have indicated below
detailed comments that can help the candidate to improve his dissertation. The corrections can be
done under the guidance of the supervisors.
General comments:
• The main issue that must be addressed by the candidate is the addition of a chapter that
explains the geometallurgical assessment method used in this study. The candidate
clearly states in the study aim and abstract that the purpose of the study is to develop a
geometallurgical assessment that can aid in mineral processing. One would therefore
expect a chapter that outlines the assessment method and also briefly motivates/explains
the different techniques used in the assessment methods. The absence of this chapter
makes the reader continuously guess what the purpose is of the different assessment
techniques described in chapters 3, 4, and 5.
The following section was added:
2.3 Geometallurgy and geometallurgical assessments

135
• Format of the thesis: the author uses many one-sentence paragraphs (typical examples are
on p.12 and p.14), which in many cases can be grouped together. I would recommend
avoiding one-sentence paragraphs in the text.
Some one-sentence paragraphs were grouped together.
• Use of abbreviations: For a non-Bushveld specialist like me, the use of abbreviations like
BK, RPM, WP are confusing; rather write these names in full throughout the text.
BK facies type of Merensky Reef, RPM facies type of Merensky Reef and WP facies type of
Merensky Reef were used, and abbreviations (BK, RPM and WP) added to the terminology
section.
• Weight % vs wt.%: Both are used in the text. Rather use either weight % or wt.% but not
both. The candidate should be consistent.
Wt.% is now used in the text
• The candidate is not consistent in using a space between number and unit.
Spaces between numbers and units were deleted
• g per tonne and ppm are both used in the text. The candidate should be consistent.
ppm is now used in the text as analysed and reported by a commercial labopratory
Figures with a % scale on the y-axis: some of these diagrams (e.g Figs.4.6, 5.4) have a
value up to 120% which is obviously impossible.
% scales on y-axis were corrected to have values up to 100%

136
• At numerous places in the text, a space between words is left out. The author must
carefully check the final document on this before final submission.
Spaces between words were deleted
• Where more than one reference is used in the text, the order of these references appears
random. The standard practice is to refer to these references in chronological order.
References were chronologically re-ordered in the text (e.g.): Kapsios et al., 2006; Kapsios
et al., 2009
• The author must carefully check the number of significant numbers used in the text and
tables. This appears to be random, which does not look very scientific.
Numbers are expressed to two decimal places
• The format of the tables: (1) they are not consistent in terms of aligning and centring. (2)
Mineral names 9e.g. table A4.11, p123) are incomplete or do not fit. (3) The size of the
tables can be significantly reduced by decreasing the font size. (4) When reporting
numbers in tables, it is easier to read if the numbers are right-aligned than centred.
Font sizes were reduced for mineral names to fit in the tables. All figures in the tables
were right-aligned for easier reading.
Detailed comments per page:
p.xii, Abstract: The abstract ends with: “The influence of ore mineralogy….also investigated.”
How was this done and what were the results of these investigation? To end an abstract like this
raises questions.

137
The following was added to the text: ‘Ore facies having the most abundant anorthite required the
longest milling time to achieve the target grind of 60wt.% passing 75µm; and the ore with the
most abundant enstatite (orthopyroxene) produced the largest mass pull on floating. The facies
with higher PGE grade, modal abundance of base metal sulphides, higher degree of liberation of
base metal sulphides and least enstatite abundance produced the most favourable set of
characteristics for efficient PGE recovery’.
p.x, grade: “percentage (%) should be weight percentage (wt.%).”
Wt.% is now used in the text
p.4. Regional setting: what are the rock types found in the Bushveld Complex?
The following was added to the text:
‘The Bushveld Complex consists of ferromagnesian and calcium-aluminium-sodium silicate
rocks. Rock types found in the Merensky Reef range from feldspathic to pegmatoidal pyroxenites,
norites and anorthosites; UG2 has chromitites, pyroxenites and anorthosite; and Platreef has
pyroxenites, serpentinites and cal-silicate rocks.’
p.7.3rd paragraph: “Vermaark” should be “Vermaak”, “Gruenewaldt et al” should be
“Gruenewaldt et al.,”.
Vermaak replaced Vermaark; and Von Gruenewaldt et al., replaced Gruenewaldt et al.,
p.8, first sentence (and other places in the text): Specify the % here. Also 55+32+15 does not add
up to 100%.
Quantities are now in wt.%, and 15% is replaced by 13wt.%
p.8, 2nd paragraph: % volume should be vol.%.
Vol.% has now replaced % volume
138
p.8, 2nd paragraph: Cawthoorn should be Cawthorn.
Cawthorn replaced Cawthoorn in the text
p.9, 2nd paragraph (and other places in the text): 30% and 35%; these percentages must be
specified.
30wt.% and 35wt.% have now replaced 30% and 35% respectively
p.13, Fig.2.1: What do the red bars indicate in the diagram?
The following text was added :
‘The red bars indicate the abundance and distribution of PGE across the facies (Adapted from
Lonmin Group, 2006)’
p.14, 1st paragraph: The mineral percentages must be specified (i.e., modal percentages?).
mineral modal percentages are now expressed in wt.%
p.17, last sentence: “… further research.” Such as…?
The following text was added:
…. further research such as flotation conditions optimization and grade optimization of the
concentrates.
p.21, Table 3.1: Is it really possible to report the modal % in 4 significant numbers?
The figures are reported to two decimal places as generated by the MLA software.
p.22, 2nd paragraph (and other places): %wt should be wt.%.

139
%wt was replaced by wt.%
p.33, Fig.4.1 (and subsequent Figs.): To indicate a value for R2 is a useless exercise if there are
only 3 data points. Remove this from the table.
R2 was deleted from Figs.4.1-4.4
p.33, Fig. 4.1: The values of the % on the y-axis are given in 4 significant numbers whereas for
all the other figures it is just two.
% values on the y-axis were changed to two significant figures (Figs.4.1 and 4.3)
p.36, Table 4.1: Indicate that the mill time is in minutes.
The milling times are now expressed in minutes
p.72, section 6.2.3, Milling: The milling time appears to be controlled by the mineralogy. I
would suggest that the candidate summarises his results in a table and/ or figure to show this.
The way it is written now requires the reader to read it several times before it is clear how the
mineralogy controls the milling time.
Table 6. 1 was added
p.106, Table A3.1 (and other tables where applicable): The candidate reports values of 0.00. I
assume that these concentrations are below the detection limit. If so, they must be reported as
such.
Values of 0.00 are now expressed as below detection limits in tables
140
p.112, Table A4.3: The table shows three dots (…) at numerous places in the table. What is the
meaning of this? Also, some values are given in wt.% and not ppm. Rather use one consistent
unit for the entire table.
Three dots (…) represent figures that could not be calculated.
Wt.% and ppm units are used as analysed and reported by a commercial laboratory
p.123, Table A4.11: Do the values 0 really mean 0 or does it indicate below detection?
0 values were reported as given by MLA instrument
p.125, Table A4.13: What is the meaning of 3 (…), 4(…), or 5(…) dots in the table?
Three dots (…) represent values that could not be measured.
p.127, 128, Tables A5.1 and A5.2: What is the point of specifying the facies type in the first
column if there is only one reported on anyway? Rather use the Table caption to indicate that
grading analysis was done for the specific facies type.
Table captions were amended
p.128, Table A5.2: The candidate uses the scientific notation randomly in this table. The same is
also done in the text (p.128, last four lines).
Scientific notations were replaced by decimal fractions

141
REVIEWER 2
Supervisors: Prof. KS. Viljoen, Mr. M. Knoper
General: In this MSc thesis an MLA and flotation study of core material, feeds and concentrates
of various Merensky reef facies and UG2 samples at the Lonmin Marikana mine is carried for a
chemical and mineralogical deportment investigation.
The aim of the study is to characterize the variability of ore and gangue mineralogy and variation
in PGE abundances within the various MR facies by automated mineralogical techniques. This
characterization would then allow a geometallurgical assessment such as evaluation of responses
of the different facies to mineral processing and identification of critical characteristics
determining processing behavior, by obtaining quantitative mineralogical and textural
information.
The candidate Thomas Dzvinamurungu thereby shows that he is able to undertake scientific
research and to report it. The candidate masters the chosen topic and is able to operate
competently in the broader subject discipline. He also generates original results, which is highly
rated. The standard and level of language and technical presentation are appropriate.
The thesis states clearly the problem and purpose of the investigation, and its motivation and
objectives. It contains a review of the regional and local geological setting of the Merensky, UG2
and Platreefs and the source area for samples investigated. A description of previous work and
studies in this field at Lonmin in the western Bushveld includes stratigraphy, rock and facies
types and mineralization and grades. An appendix chapter A.1 deals with the methods employed
such as sampling, crushing, splitting, grain mounts preparation, MLA and flotation procedures.
Chapters on sample mineralogy and geochemistry as found by MLA, sample milling and element
deportment, as well as flotation tests form the data body of the thesis. On the literature side,
sufficient relevant authoritative literature is cited, which allows the evaluation and interpretation
in the context of the defined topic.
The research programme is appropriate to address the defined topic and successfully generates
new quantitative mineralogical data of selected merensky Reef (MR) and the UG2 facies at

142
Marikana allowing a geometallurgical assessment of previously existing chemical assay data.
The database created is more quantifiable and representative than previous datasets, largely
confirming existing data but creating a data set which is more useful for metallurgists. It allows
an evaluation of the responses of the different MR facies to mineral processing.
The thesis marks are the logical structure, detailed description and the appropriate
style/terminology of presentation of the findings, corresponding with the scientific conventions
of the discipline. The sources are correctly quoted and a reference list is given in the format
appropriate to our discipline.
Obviously some investigations to characterize the Merensky ore by MLA and flotation have
been done before (i.e., Becker et al., 2008, 2009; Brough et al., 2010; Wiese et al., 2005a+b,
2006, 2007; Viljoen et al., 2012). Did those studies not characterize similar facies quantitatively?
It has the impression that this is the first MLA study of MR in the area; the others have been
performed in the Northam area. The scientific question is less a dispute about genetic processes
or a formation model but more of a practical nature in assisting refinement of mineral
exploitation and processing strategies of the ore at Lonmin’s Marikana mine.
The technical editing is mostly good and the standard and level of language and style are
appropriate.
Subject, investigation: The candidate is familiar with the nature and purpose of his research.
Research: Thomas Dzvinamurungu obviously has mastered the techniques that are relevant to
his research.
Literature: He has adequate knowledge of relevant literature, although I am not convinced that
he interpretes the literature of his field of study entirely.
Scientific methodology: Thomas has a good grounding in the theory and application of
scientific methodology.

143
Research report structure: Thomas is able to structure the research report in a scientifically
justifiable manner. The arrangement of the material of the thesis is systematic and well
documented. The arrangement of the material is done in a logical way from theory as stated by
literature over description and results of experiments, where the kinetics of mineral reactions is
the most important aspects.
Detailed comments on content:
The Abstract is relatively general, one might expect slightly more detail on the results such as
how samples of the various MR facies types did mill and float in terms of mineralogy.
The terminology section offers very useful selection of technical terms for the understanding.
The introduction, chapter 1, is a brief and concise section aiming at the objectives-efficient and
effective mineral extraction and processing routes. A short geological setting and a brief
elaboration on the mineralogy of MR, UG2 Reef and the Platreef is given.
The aims of the present study, chapter 2, gives a description of facies in terms of thickness and
rock type, gangue and ore minerals, as well as PGE content and distribution and the motivation
for current study which is:
-A quantitative description of the variability of ore and gangue mineralogy and variation in PGE
abundances within the various MR facies which could pose inherent challenges to PGM
liberation behavior and metallurgical responses in beneficiation processes.
-An assessment of the influence of reef facies variability on comminution and flotation
performance such as Pt deportment.
-A development of a geometallurgical assessment such as an evaluation of responses of the
different facies to mineral processing and the identification of critical characteristics determing
processing behavior, by obtaining quantitative mineralogical and textural information.
-Lastly the study may help to refine mineral exploitation (selective reef facies extraction) and
processing strategies as a basis for further research.

144
Chapter 3 ‘Samples collected, and sample mineralogy and geochemistry’, gives a brief
description, good figures/illustrations of the results of the investigation.
The quality of the figures is high; those are well readable, right size; except figure 5.12a-d and
5.13a-d, where the font of the header is too large.
Font sizes were reduced (from 12 to 10) for numbers, headers and footers in Figs.5.12a-d and
5.13a-d
Chapter 4, the ‘Sample milling, and element deportment’ shows mostly grinding and Cu, Ni, S,
Pt and Pd downgrade/upgrade behavior which are later interpreted. The BK facies represents the
most favourable set of characteristics for the efficient recovery of PGEs; finer grain size of PGM
requires finer grinding not necessarily longer grinding times a grind of 60% passing 75 microns.
Chapter 5 ‘Flotation tests’ gives data on flotation performance, modal mineralogy of feeds and
timed concentrates with particle and sulphides grain size distribution; also sulphide liberation
analyses in the feeds are given and compared to sulphide liberation in ore feeds and concentrates.
Furthermore mineral association and locking, liberated, binary and ternary composite mineral
particles, flotation recovery efficiency and flotation performance analyses as well as grade and
recovery analyses are displayed. The amount of opx in MR has direct influence on mass pull, as
orthopyroxene is naturally floatable in character. Care is taken by not blending too much opx in
high mass pull, but dilution of the PGE grade.
In the discussion most of the results of the investigation are discussed and related to the relevant
findings of other researchers. The discussion is controversial in that it emphasizes where there
are differences to other results from other operations and which consequences it has on
downstream processes. The conclusions are a brief geometallurgical assessment, answering some
of the aims of the study from chapter 2.2, such as the influence of various proportions of gangue
minerals on grinding and flotation behavior of the various rock facies. Blending solutions are
offered to overcome problematic behaviour. The BK facies type ore is identified as offering the

145
most favourable set of characteristics for efficient recovery of PGEs; this facies seems to exist
also at Northam platinum (Brough et al., 2010).
The final paragraph gives very useful recommendations of where to progress with future test
work to clarify the effects of processing composites of MR facies and the UG2 ores such as 1.
Composites of MR and UG2; 2.Further work on flotation conditions optimization; and 3. Grade
optimization tests could be carried out.
The reference chapter is given in a proper manner and the format and layout of the bibliography
is correct and including the most important and recent sources offers a high amount of citation
(94) on 10 pages proving that discussion and conclusions are valid and presented and evaluated
in the context of authoritative published literature.
There is an instructive methods appendix A1.1-A1.9, containing clear mineralogical data
appendices 2 and clear chemical data appendices 3 with milling tests, element deportment and
flotation data making the data more digestible to the reader.
With the help of literature the candidate has identified the geometallurgical analyses of the
various MR and UG2 facies at Lonmin Marikana as feasible topic, thereby formulating the
hypothesis that different amounts of gangue minerals and amounts and sizes of BM sulphides
and PGM in various ore facies have a different effect on grinding, liberation and flotation
behaviour, calling for measures to increase effective PGE recovery. The strength of the study are
the rigorous research approach, a possible weakness could be the non-genetic approach of
mineralogy to purely assist technical solutions.
Recommendation: Thomas Dzvinamurungu has largely realized his research aims. He knows
and has applied the necessary techniques, demonstrates a sound training in research
methodologies and an understanding of the research process. The statement of the problem, and
the application of MLA investigation for geometallurgical analyses of the various MR and UG2
facies at Lonmin Marikana Mine are the essence of the thesis, the text is well structured and
readable. The statement of research question, concepts and methodology are in a good balance
146
results presentation and discussion. Formally, with 92 pages of text plus further 40 pages of
appendix, the author manages to adapt his Master thesis to a reasonable length. Taking the above
criteria into consideration, I would mark this research thesis with 75%. I trust that comments will
be addressed in the bound version of the thesis under guidance of the supervisors.