GEOLOGY AND COAL RESOURCES OF THE QUINSAM · PDF fileGEOLOGY AND COAL RESOURCES OF THE...
182
GEOLOGY AND COAL RESOURCES OF THE QUINSAM PROPERTY VANCOUVER ISLAND Submitted by: R. Engler Jan. 17, 1977
Transcript of GEOLOGY AND COAL RESOURCES OF THE QUINSAM · PDF fileGEOLOGY AND COAL RESOURCES OF THE...

GEOLOGY AND COAL RESOURCES
OF THE
QUINSAM PROPERTY
VANCOUVER ISLAND
Submitted by:
R. Engler
Jan. 17, 1977

TABLE OF CONTENTS
PAGE
INTRODUCTION
SUMMARY
CONCLUSIONS
LOCATION
PHYSIOGRAPHY
TECHNICAL INVESTIGATIONS
GEOLOGY
Regional Geolow
Stratigraphy of the Coal Bearing Formation
Structure
COAL QUALITY
Test Procedures
Analysis of Raw Coal
Ash Fusion, Mineral Analysis of Ash and Ultimate Analysis
Washability Studies aL* R~:s” 70: rnHDsn)7/& &&hf.& ‘&+q
Conclusion
RESERVES
1
2
7
9
12
14
17
17
22
28
35
35
38
41
43
48
50

TABLE
1
2
3
4
5
6
7
LIST OF TABLES
RESERVE SUMMARY
TABLE OF FORMATIONS
PROXIMATE ANALYSES ON RAW COAL
PROVEN IN PLACE RESERVES
PROVEN RESERVES NORTHERN BLOCK
PROVEN RESERVES MIDDLE BLOCK
PROVEN RESERVES SOUTHERN BLOCK
ii
PAGE
6
26
38
52
54
5s
56

FIG. NO. PAGE
QUINSAM PROPERTY LOCATION MAP
COAL EXPORT ROUTES
10
EXPLORATION PLAN
11
16
DISTRIBUTION OF COAL BEARING SEDIMENTS
5 GEOLOGIC MAP
6 STRATIGRAPHIC COLUMN COMOX FORMATION
8
LIST OF FIGURES
OVERBURDEN ISOPACH TOP OF RECOVERABLE COAL
FLOW DIAGRAM SHOWING SAMPLE PREPARATION AND ANALYSIS
iii
20
21
27
34
37

LIST OF APPENDICES I
APPENDIX I
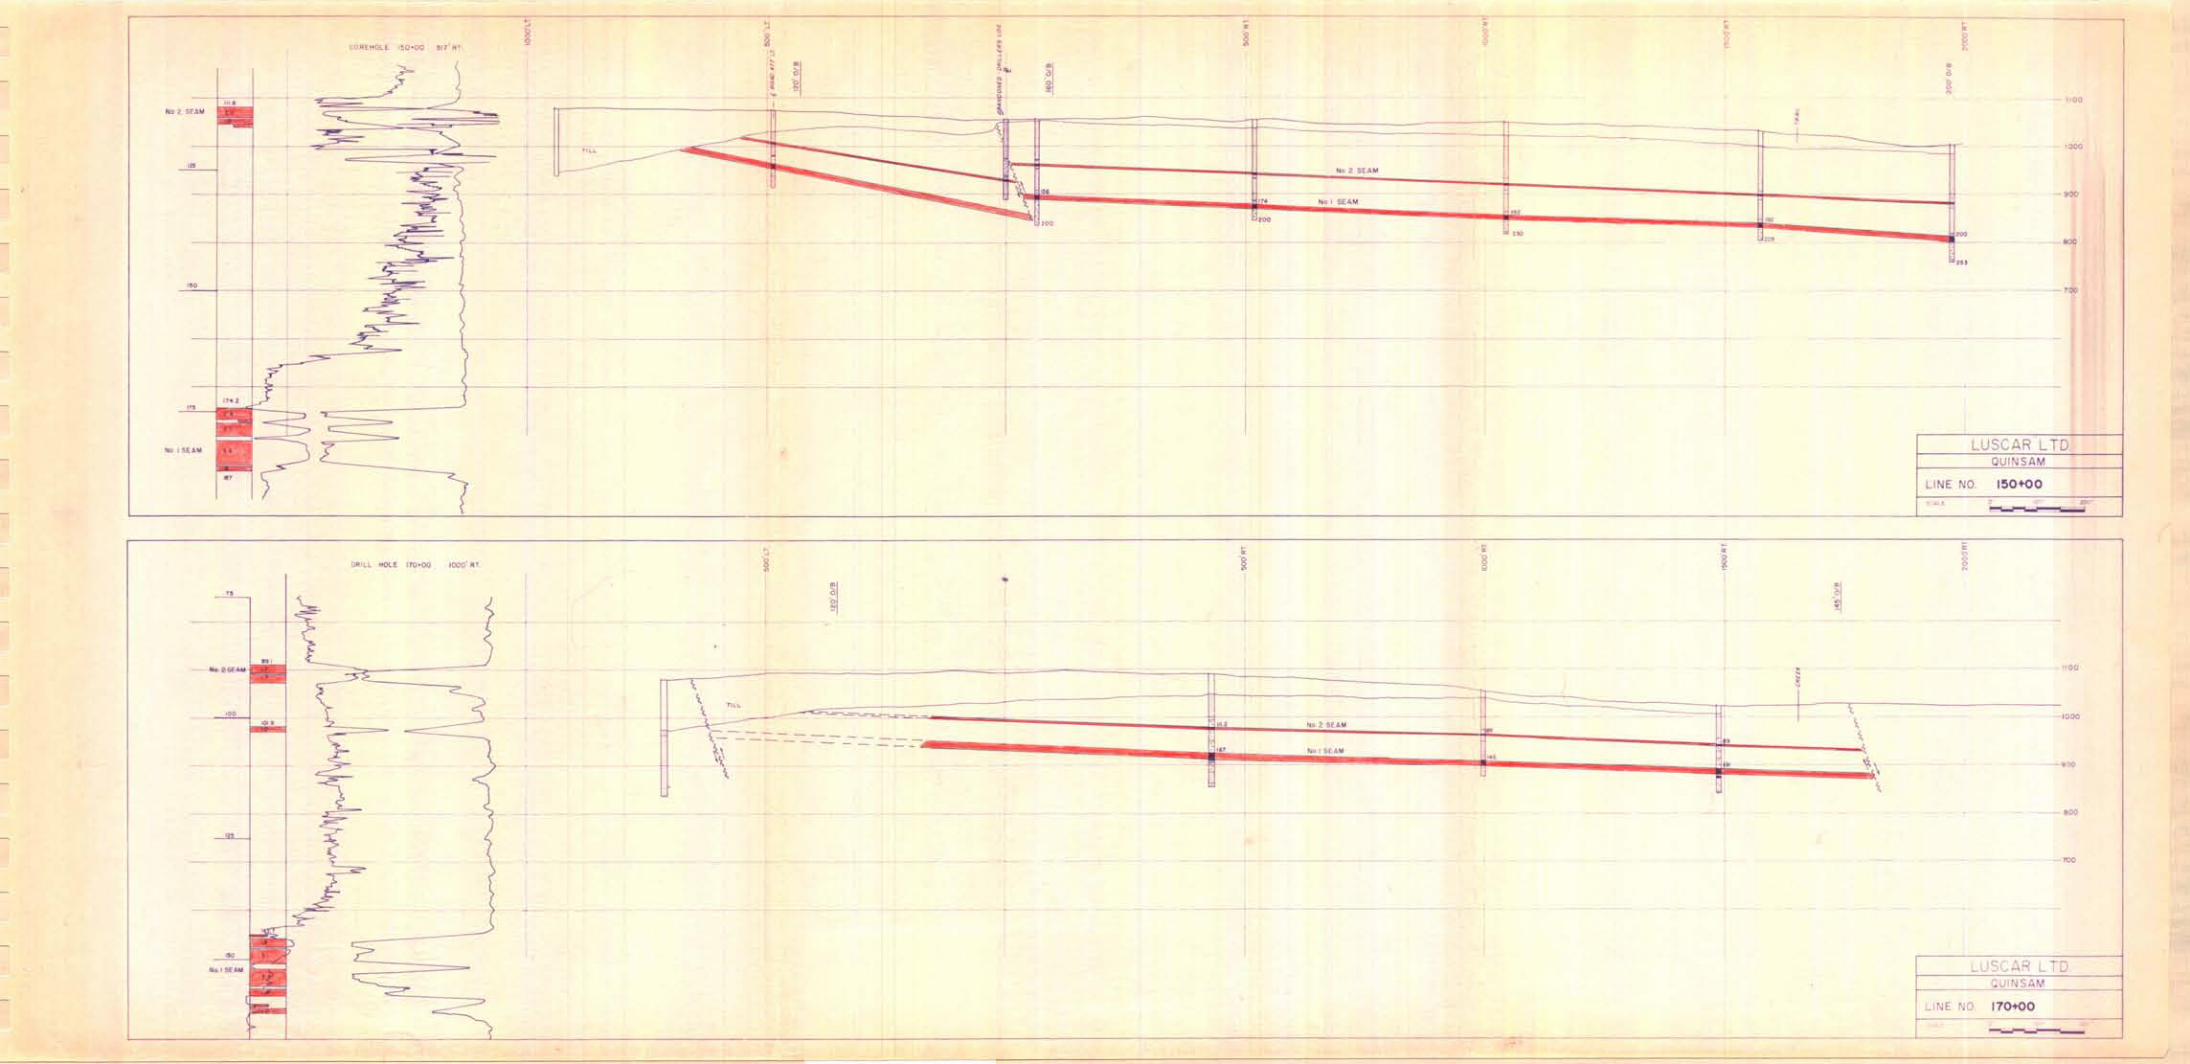
Cross Sections - Quinsam Phase I Series 1" = 200' Scale
Sections PsJg
'IO+00 and 50+00 58
60tOO and 85+00 59
lOOtO and llO+OO 60
I 12OtOO and 135+00 61
150tO0 and 17OtOO 62
I 185+00 and 195+00 63
APPENDIX II I
Maps 1 to 4 ','
I) Overburden Ispach - Structure Contour * No. 1 Seam and No. 3 Seam
Scale 1" = 200
APPENDIX III t+lsc, ,qEiz-eL. 70 cJ~Ho.sran& /+mJ& but%
Coal Quality Analytical Data
i Proximate Analysis ii Washability Test Results
iii Washability Curves
APPENDIX IV
Drill Hole Information
i Drillers' Logs ii Geophysical Logs
iii Core Description Logs
iv

INTRODUCTION
In August 1976, Luscar Ltd. entered into agreement with
Weldwood of Canada Ltd. to conduct a geological exploration program
on Weldwood's coal licenses on the northeast side of Vancouver Island.
Previous exploration by Weldwood had determined that a potential
for surface recoverable coal reserves existed in the Quinsam Lakes
area, west of Campbell River. This area, hereafter referred to as
the Quinsam Property, was targeted for the initial phase of exploration
by Luscar Ltd.
It is within the scope of this report to present the
proven "in place" coal reserves, occuring under less than 200 feet
of overburden wi.thin the confines of the study area where exploration
drilling was concentrated. Conclusions relating to the quality of
the coal measures are based on analyses of cores by Luscar's laboratory
facilities. The geologic framework and stratigraphic succession within
the study area has been interpreted from the geologic data collected
during this phase of exploration.
-l-

SUMMARY
The Quinsam property encompasses approximately 56,000 acres
between latitude 49' 48' north and 50' 00' north by longitude
125' 32' west and the eastern coast of Vancouver Island. The study
area (3840 acres) comprises the northern third of the property,
situated 17 road miles inland from the town of Campbell River along
a plateau extending southward from Campbell Lake to the Iron River.
Coal seams of economic importance occur in a series of
north easterly tilted fault bound basins which terminate along a
granitic mountain front on the western margin of the property and
are down thrown along a major fault trend on the eastern margin.
The northern third of the property can be considered as a single
coal basin, dissected into three structural blocks by major
east-west trending transverse faults. Three coal seams are present
in this area; their thickness and relative stratigraphic positions
are listed in descending order as follows:
Stratigraphic Separation Seam Thickness
Raw Coal
No. 3 5.8 ft. - 8.2 ft.
100 ft.- 130 ft.
2 1.4 ft. - 4. 2 ft.
60 ft.- 80 ft.
No. 1 9.1 ft. - 12.0 ft.
Total Coal Zone Thickness 160 ft. - 210 ft.
-2-

The No. 1 and No. 2 seams persist throughout the area, but
the No. 3 seam is known only to occur in the southern structural block
I between the Quinsam and Iron Rivers. Four major factors have affected
seam continuity within the area:
1) Normal Faulting
At least seven major normal faults have disrupted the coal
measures causing displacements ranging from 5 to 50 feet.
The downthrown block has been rotated, causing a steeper dip on
the footwall. This style of brittle fracture is dominant;
folding and thrust faulting are insignificant.
2) Glacial Erosion
Erosion by moving glacial ice has truncated the coal seams
in the middle and northern blocks to depths ranging from 60 to
150 ft. This has effectively reduced the amount of shallow
recoverable coal in these areas.
3) Irregular Surface of Deposition
The coal measures were deposited on an irregular paleotopographic
surface. As a consequence, the lower No. 1 seam pinches out
and shales out along these old basement highs. The stratigraphically
higher seams are not affected.
4) Intrusion
Intrusion of plutonic stocks and igneous dykes through the
coal measures has caused local metamorphic upgrading in the rank
of the coal seams and a metosomatic increase in the inorganic
sulphur content up to a maximum of 5%. It appears that these
effects are limited to the southern block where the sediments
are in contact with intrusive rocks.
-3-

.
I
.
I
rV LYI
p: .
QUALITY
Core samples from each of the three coal seams were analysed
excluding partings greater than 1" in thickness. The coal is classified
as High Volatile Bituminous A with the following average analysis on
a raw air dried basis:
Proximate Analysis (air dry)
Seam Number of Moisture % Ash % Sulphur % Btu/lb. FSI Samples -
No. 1 a 2.63 16.13 0.56 ii ,489 1 l/2
No.2 2 2.58 16.44 3.99 11,515 2 l/2
No.3 1 2.19 23.01 3.81 10,742 2
Ash content varies from 9.0% to 23.4% and is directly related
to the amount of bone material associated with the seam.
Sulphur content ranges from 0.19% to 4.91% increasing
directly with FSI of the coal, indicating a metamorphic upgrading
in rank of the coal and a metasomatic enrichment in sulphur, usually
in the form of pyrite.
,

RESERVES
The reserves for the Phase I Study Area are to be considered
in the proven in place category. Calculations are based on the
following parameters.
1) The coal seams are considered continuous up to a maximum
distance of 500 feet from known drill hole information or
outcrop.
2) The in place density of the coal is 90 lbs./cu. ft. or 1.2
tons/cu. yd.
3) Average in place clean coal thickness applies to the area
of influence of the drill hole.
The reserves are presented in three overburden depth
categories by seam as follows:
TABLE 1:
Depth of Overburden Overburden Volume
(feet) (cu. yds.
x 106)
0 - 120 33.52
120 - 160 38.93
160 - 200 62.78
RESERVE SUMMARY
Proven Tons Overall Ratio
(short tons x 106) (Cu. yd./tons)
Seam Seam Seam No. 1 No. 2 No. 3 ___ - __
3.05 0.99 .785
2.23 0.80 .325
3.73 1.05 .294
9.01 2.84 1.40
6.9:1
11.6:1
11.4:1
Total 135.23 13.25 10.2:1
-6-

CONCLUSIONS
1. A total of 13.25 million tons of raw in place coal has been
proven to exist in the Quinsam study area. This reserve includes all
coal that is greater than 3 feet thick on an individual seam basis
and occuring beneath less than 200 feet of overburden.
2. Quality analyses on the raw coal (excluding partings greater
than one inch) indicates that the ash content can be reduced to less
than 10% by washing at specific gravities ranging from 1.7 to 1.9.
The subsequent product yield ranges from 80% to 90%. The total sulphur
content ranges from 0.19% to 0.34% for 8 of the 9 samples of the
No. 1 seam, and cannot be economically reduced beyond 2.0% for the
No. 2 and No. 3 seams by gravity separation. Of the total in place
reserve, 9 million tons can be classified as low sulphur coal
(less than .5%) with the remaining 4.2 million tons having sulphur
contents greater than 2%. The low sulphur - high sulphur distribution
is 2.1:1
3. Geologic mapping and aero magnetic data indicate that the
coal bearing formation extends tothe south and east of the Phase I
study area. Coal seam outcrops occur along Chute Creek and the
Iron River extending south to the Oyster River, over an area roughly
twice the size presently being studied. A similarly large isolated
sedimentary basin occurs tothe southeast of the property. These two
areas warrant further investigation for the following reasons:
(a) There is an extremely good chance that additional surface
recoverable reserves occur in this area,quite possibly enough
-7-

to double the present reserve figures.
(b) Glacial erosion is limited in the southern area, thereby
increasing the potential for near surface, low ratio coal.
(c) Aeromagnetic data indicates the eastern basin has not been
structurally disturbed to the extent of the study area.
Additionally, there are less intrusive bodies in the areas south
and east of the study area. It is therefore reasonable to assume
that the metamorphic effects related to intrusion which increase
the sulphur content of the coal seams will be less pronounced in
these areas.
-8-

LOCATION
The Quinsam Property encompasses approximately 56,000 acres
between latitudes 49' 48' north and 50' 00' north by longitude
125' 32' westand the eastern coast of Vancouver Island (Fig. 1).
The boundaries are defined along a series of disjointed
rectangular timber blocks, extending 12 miles westward from Beaver
Tail Lake to the coast along the 50th parallel and southward from here
to the Oyster River, a maximum distance of 14 miles. The Phase I study
area lies in the extreme northwest corner of the property, trending
south east along the western side of Gooseneck and Middle Quinsam Lakes
to Long Lake, immediately south of the Quinsam River. The area is
roughly 3 miles long by 2 miles wide, encompassing some 3840 acres
within its boundaries.
The study area is accessable from the town of Campbell River
by travelling 13 miles west along the Gold River Highway and branching
off southward onto a gravel haul road for an additional distance of
4 miles. The gravel road forms part of the Elk River Timber haul route
which also connects with Campbell River over a 16 mile distance.
Numerous secondary logging roads and trails provide access throughout
the area.
The town of Campbell River (pop. 10,000) is the major community
in the area, providing accommodation and services including regular
scheduled airline flights to Vancouver and dock facilities from which
ore and timber products are shipped from the region. The feasibility
of shipping large tonnages of coal from these facilities is presently
under study.
-9-

,’ / ,A__-_- -I
SCALE
I 2 ‘I
Y
I”= 2 Miles
British
Columblo

,-*r I “, 7‘ li‘yx
PACIFIC
OCEA
-
N OCEAN
--/ l -MINES and P”“W’FI? MiNlNG AREdS
i
1
LUSCAR LTD
COAL EXPORT SHIPPING ROUTES
FIGURE 2

PHYSIOGRAPHY
U
u
I
I
m
U
I
I
The Quinsam Property is part of the Nanaimo Lowlands
belt that extends along the eastern coast of Vancouver Island. It
is bounded to the west by the Insular Mountain Range, to the north by
Campbell Lake, to the south by the Oyster River and to the east
by the Straits of Georgia. Elevations increase inland from the coast
reaching a maximum of 2000 ft. A.S.L. along the western margin of
the property. The topography consists of a series of low rolling
hills and plateaus separated by narrow valleys, aligned in a
northeasterly direction parallel to the mountain front. A large
glacial valley occupied by Beavertail, Snakehead, Gooseneck and
Middle Quinsam Lakes forms the northwestern boundary of the property.
Other isoated lakes (Quinsam Lake, Echo Lake, Wowo Lake) are scattered
randomly throughout the area.
Three major river systems drain the area flowing discordant
to the terrain in a northeasterly direction. In the northern part
of the property, the Campbell River drains Campbell Lake into the
Straits of Georgia. This stream is a major salmon spawning course.
The Quinsam River and Iron River drain the central part of the area.
The Oyster River drains the southern part of the property. The river
valleys are steep sided and the channels contain many cataracts.
Near the coast, the valleys and river channels broaden out.
The area is covered by a dense growth of vegetation, typical
of the northwest Pacific coast. The top story consists primarily of
Douglas fir trees with minor spruce, cedar and hemlock. Secondary
growths of alders are prevalent in old logging areas. The understory
- 12 -

is occupied by a variety of ferns, bushes and low shrubs. Outcroppings
of bedrock are almost entirely restricted to steep river gorges and
man-made roads and excavations.
The seasonal climate varies with elevation. Along Tow lying
coastal area, maritime influences restrict freezing during the winter
months whereas frost and snowfalls are common in the western part
of the property from late November to mid March. The mean annual
temperature throughout the region is 48' F. Total precipitation,
mostly in the form of rainfall, varies from 58 inches to 40 inches
annua'lly. At least 75 percent of this precipitation occurs during
the six month winter period. The dry period occurs from July to
August. The Maximum rainfall recorded for a 24 hour period is 4 l/2
inches.
- 13 -

I
I
m
I
I
I
I
I
I
II
L
TECHNICAL INVESTIGATIONS
During the period commencing October 5 through to December
13, 1976, 48 test holes were completed in the Phase I Study Area for
a total logged footage of 10,600 feet. Ten of these holes were
cored to obtain coal samples from the No. 1, No. 2, and No. 3 seam.
The test holes were spaced at 500 foot intervals along cut lines
trending at 90' to the strike of the formation. These lines were
arranged 1000 to 1500 feet apart along regional strike from the
northern to the southern boundaries at the area (Fig. 3).
Rotary drilling was performed with two of Lexco Testing Ltd.'s
air-water combination drill rigs and one top drive rig contracted
from Ken's Drilling in Victoria. Down-hole air driven hammers were
employed to penetrate the rocky till layer that overlies the coal
measures.
A wire-line coring system was used to recover coal samples.
The cores were logged and sampled and sent to Lexco Lab in Edmonton
for analysis. The remaining roof and floor rock was stored on site.
Geophysical logging of the test holes was performed by Canadian
Arctic Survey Systems of Calgary, employing a three curve gamma-
density-resistance sonde.
Additional projects included:
(a) An Aeromagnetic Survey of the Quinsam Property conducted
and interpreted by Aqua Terra Consultants Ltd. (Calgary),
designed to outline intrusive bodies and map the structure of
the volcanic basement rocks.
(b) Surficial geologic mapping conducted by Bayrock and Reimchen
- 14 -

Ltd. (Vancouver) designed to outline the glacial erosional
edge of the coal measures.
All field operations and interpretations were supervised
by Mr. Steven Gardner, Luscar's Project Geologist for the Quinsam
Area. Coal quality testing and presentation of quality data was
supervised by Mr. Ali Khair Eldin, Head of Lab Services for Lexco
Testing.
- 15 -

FIGURE 3
QUINSAM AREA PHASE I
EXPLORATION PLAN
Drill hole - l
Core hole - d”
Gravel Road - ====
Trails - ---- 4 &
SCALE: 1:25,000 / ----..- ---.---_--
\ --.. --

GEOLOGY
REGIONAL GEOLOGY
Coal seams of economic importance occur In the Late Cretaceous
Comox Formation. The Comox Formation is distributed in three isolated
fault bound basins within the Quinsam property, aligned in a northwest-
southeast orientation. The basins are disrupted by several major
normal and transverse fault systems, producing a series of northeast
dipping, slightly warped fault blocks.
The stratigraphic thickness of the Comox Formation increases
in a wedge-like fashion from 200 feet along the western boundary of
the property to 1000 feet near Campbell River on the eastern margin
of the property. The sedimentary sequence consists mainly of medium-
grained, thick bedded arkosic sandstone interbedded with minor shale
and coal seams. Locally a coarse conglomerate unit known as the
Benson Member occurs at the base of the formation. The Comox formation
is characterized by great lateral variation and lenticularity of the
sandstone, shale and coal units.
The base of the Comox Formation lies with angular unconformity
on top of the Jurassic to Triassic Vancouver Group. The Vancouver
Group is exposed in the central part of the Quinsam Property where it
has been uplifted and brought into fault contact with the Comox Formation
to the east and west. It consists of a typical eugeosyncline sequence
of alternating marine shales and limestones interbedded with a thick
series of pillow lava basalts and andesitic pyroclastics. The stratigraphic
thickness of this series is in excess of 3000 feet. The predominant
basalt units are metamorphically altered and recrystallized. They
- 17 -

I
u
I
u
t
II)
* L
i
‘L
I
are intruded by a cross cutting series of quartz veins, some of which
are mineralized.
The erosional unconformity on top of the Vancouver Group
is quite irregular. This irregularity has greatly affected and
constrained the lateral persistance of the lower members of the over-
lying Cormox Formation.
A large granite batholith forms the western boundary of
the Quinsam Property. It is Late Cretaceous in age and was uplifted
during the Coast Range Orogeny. It consists predominatly of~coarse
to medium grained granodiorite with minor inclusions of diorite.
The inplacement of this large batholith was partially penecontempouranous
with the deposition of the upper part of the Comox Formation as
evidenced by the predominance of arkosic sandstones in this series.
Uplifting during the Late Cretaceous tilted the depositional basin
to the northeast and possibly culminated in faulting the Comox strata.
In Post-Cretaceous times the Comox Formation was intruded
by isolated plutonic stocks and basic dykes. One of these isolated
stocks is exposed along the Iron River near Middle Quinsam Lake. This
magnetite-hematite rich body intrudes the Comox Formation, developing
a series of radial faults and uplifted blocks in the surrounding strata.
The Comox Formation has been metamorphically altered near the contact.
Metasomatic mineralization, primarily in the form of pyrite, is developed
in sedimentary strata in a annular zone surrounding the intrusion.
A thick layer of glacial deposits covers most of the north-
western and eastern parts of the Quinsam Property. On the coastal
lowlands this layer consists of stratified, cross-bedded sands and gravels.
- 18 -

In the northwestern part of the area above the 700 foot contour level,
bedrock is covered by a thick layer of glacial till. The till varies
in thickness from 3 feet along this plateau to greater than 150 feet
in the valley formed between Gooseneck and Middle Quinsam Lakes.
It consists primarily of scattered granitic boulders in a matrix of
cemented dark brown clay. This till is a morraine deposit formed
along the glacial erosion edge of the Comox Formation. These deposits
thin out south of the Quinsam River. The bedrock extending from here
to the Oyster River is covered by a thin mantle of weathered rock.
- 19 -

FIGURE 4
DISTRIBUTION OF COAL BEARING SEDIMENTS
--.l / 1 /! LEGEND
,/’ I /TzZ- AREA UNDERLAIN BY
COMOX FORMATION
SCALE PHASE I STUDY AREA
0 2
- I”: 2 Miles
- 20 -

,.- ‘--. 1..-...;, ,.’ ’ ^
FIGURE 5
QUINSAM AREA PHASE 1
u - Coast Range lntrusives /
Kcm

I
I
I
STRATIGRAPHY OF TiiE COAL BEARING FORMATION
Because no significant outcroppings of the Comox Formation occur
on the property a stratigraphic sequence has been reconstructed from
drill hole logs and core descriptions. The sequence of deposition
throughout the area is quite variable and susceptible to lateral
facies changes over relatively short distances. In addition, the
maximum thickness; intersected during this phase of exploration was
320 feet, and the Comox is known to exceed 1000 feet in thickness in
the Campbell River area adjacent to the east.
Within the exploration area, the Comox can be roughly divided
into two cycles of deposition from different source rocks. The upper
cycle consists primarily of coarse to medium grained arkosic sandstone
derived from the granitic Innsular Mountains which form the western
boundary of the property. The lower cycle consists of finer grained
siltstones and sandstones containing many volcanic clasts in their
matrices. These sediments were probably eroded from the Triassic
Vancouver Group which forms the basement rock in the area.
The lower cycle contains the No. 1 coal seam and extends upward
from an angular unconformity on the Vancouver Group to the base of the
No. 2 seam. The thickness of this cycle ranges from 100 to 160 feet,
,.~...~~~,~..~~~~ I ded.ent one the paleotopographic~ irregularities expressed by the
basalt basement.
The lowermost sediments consist of a series of dark reddish
siltstones overlain by a sequence of interbedded dark grey siltstone,
dark brown mudstone and massive greenish grey, medium grained sandstone,
accumulating to a maximum thickness of 60 feet. Visual examination of
- 22 -

the sandstone units indicate they are composed predominantly of volcanic
and quartz clasts.
The No. 1 seam lies on top of this lower series, usually seated
on a dark brown mudstone floor. However, when deposition encroaches on
paleotopographic basement highs, the lower series is missing and the
No. 1 seam shales out. In situations wh_e_re_~reposit_ionhas~~not~~e~
interrupted, the No. 1 seam consists of a zone ranging from 10 to 16 feet ._--,_
containing from 6.6 to 12.1 feet of coal separated by two or'three mudstone
partings and bone layers, none of which exceed 1 foot in thickness. The
No. 1 seam attains a maximum thickness in the central part of the property
and gradually thins and pinches out along a depositional margin north of
line 185.
In the central and southern-p~arts of the~~aare&, a thin rider seam
ranging in thickness from 1.5 to 2.5 feet occurs from 1 to 12 feet above
the No. 1 seam.
Upward from the No. 1 seam to the top of the lower cycle at the
base of the No. 2 seam, the sequence consists predominantly of thinly
bedded dark grey siltstones interbedded with massive medium grained sand-
stone lenses. Some of these sandstone lenses contain minor pebble bands,
and all exhibit cross bedding and some color banding. This sequence of
alternating fine and coarse elastics is extremely variable throughout the
property and correlation of individual units is difficult at best.
The No. 2 seam occurs 60 to 80 feet above the No. 1 seam and is
identified as the base of the.upper. c@Al_ - ---~ although the hiatus in deposition ~~-.
may occur in the interfingering unit between the two seams. This seam
forms a coal horizon attaining a maximum thickness of 6 feet containing from
4.6 to 1.0 feet of coal with an average coal thickness of 2 feet. Usually the
- 23 -

No. 2 seam is divided into an upper and lower part by a thin mudstone
parting. It is the upper part which increases in thickness as the seam
extends from the southern to the northern part of the property. The
No. 2 seam is typically overlain and underlain by brown mudstone
containing numerous coaly streaks and partings.
The sequence above the No. 2 seam extending upward to the No. 3
seam consists of a relatively homogeteous sequence of massive, medium to
coarse grained arkosic sandstones interbedded with layers of thin silt-
stone and mudstone. The sandstones are light to medium gray in color,
composed of uniform sized sub-angular clasts in a calcareous or silic-
eously cemented tmatrix. Cross bedding and banding are expressed in some
of the finer grained layers.
The No. 3 seam is the uppermost coal horizon in this region,
occurring 100 to 130 fee-t above the No. 2 seam. It occupies an interval
ranging from 12 to 15 feet thick containing 5.8 to 9.9 feet of blocky
coal, usually in four sub-equal bands separated by brown mudstone
partings. It is typically directly overlain by sandstone and seated
either on a mudstone or sandstone floor. The No. 3 seam exhibits
extreme lateral variation but can usually be identified by its distinctive
four coal band kick on a density log.
At present, the No. 3 seam is known only from the southern part of
the area,(south of the Quinsam River) 1 Future drilling has been planned
down dip of the No. 2 seam in the central and northern parts of the area
to locate the No. 3 seam and extend its continuity.
- 24 -

The sequence above the No. 3 seam continues as arkosic sandstone
which outcrops on surface as a rust weathering, friable unit or is
truncated and buried by glacial deposits.
The contrast between the relatively homogeneous characteristics of
the upper cycle and extreme variability of the lower cycle reflect the
difference in depositional styles that were active as the Comox forma-
tion was being laid down in this area. The lowermost sediments and the
No. 1 seam were deposjted,~in-a seri.es of paralic basins between topo-
graphic hiqhs on the old volcanic basement as the land was slowly
emerging during late Cretaceous times. Obviously this was a low energy -- ,..,._ -..- .-._ _____ - environment as evidenced by the lack of coarse grained elastics,, __ __,_. ~_~~~~. --------~~~-~-
p~rotected in1 and frnm~the sea~.inq~,e_t~,la~goo~ns and~es~tuaries. As the
depositional basin slowly subsided under the sediment Toad, or was tilted - __~
by the rising granitic mountain range to the west, the old basement .--. ~~...~ __ ..-.- -.--- .._._._. ~.~., ..,_ ~~.. ~.~
topography was buried and deposition of the No. 2 and No. 3 seams took
place in the upper cycle. The range of this cycle was much more wide- . . . .~~
spread since the restricting highs were now buried. Also, deposition of
the upper cycle must have been more rapid as evidenced by the predominance
of coarser grained elastics. Indeed the lack of,a seat earth beneath the. .~.
No. 3 seam suggests an accumulation of plant material in a large estuary
by river action rather than static accumulation in a bog or lagoon. __.~
The economic significance of this depositional history means that
the No. 3 and No. 2 seams are much more likely to be persistent than the
No. 1 seam within the area.
- 25 -

TABLE 2
Table of Formations
PERIOD FORMATION LITHOLOGY
Recent Alluvium - fluvitile sands and gravels, clays, weathered bedrock
Pleistocene Glacial Till and Outwash
Unconformity
- stratified sands and gravels compacted clay rich boulder till
Tertiary Plutonic Stocks - porphyritic dacite, quartz Igneous Sills and Dykes diorites, skarn deposits
and breccias
Disconformity
Upper Cretaceous
Coast Range Instrusives - granodiorite, minor quartz diorite
Disconformity
Comox Formation - arkosic sandstone, minor siltstone, mudstone, conglomerate and coal seams
Jurassic and
Triassic
Unconformity
Vancouver Group - amygdaloidal pillow basalts, andesitic tuffs and breccia, minor limestone and argillites
- 26 -

Depth
0
100
200
300
U
F E R
v”
t E
:,:
: ‘.
.‘.
;. ;.
‘.
‘,
t
.’
..’
‘,
‘.‘. ;.
., :
‘. : . .
(’
L 0 W E R
t C
k
I$ <I II : :.
k
:, :,:. ” ,, ” 0 “V “Y “V
Stratigraphic Column
Comox Formation Quinsam
Unit Thickness Li thology
Glacial Till 0 - 150’
.
No. 3 Seam 12’-15’
No. 2 Seam 5’- I’
No. I Rider
No. I Seam
.
Vancouver Gp.
lOO’- 130’
Figure 6
Compacted and cemented clay v / boulders.
Sandstone, tn.- gr, arkosic.
6.0’-10.0’ coal W/ 3 pWtil7gS.
Sandstone m.- CS. gr. arkoslc massive, minor flItstone and mudslone partings.
4.5’-1.0’ coal w/I parting.
60’-60’ Interbedded dk. grey siltstone wr’greenrsh grey sandstone.
2.0”1.0’
IO’- 16’
I, 5’- I .O’ COOI.
Mudstone.
6.5’-12.0’ coal w/3 minor partings.
O-60’ Primarily dk. grey sillstone w/green sandstone tenses, red siltstone at base.
- 27 -
Metavolcanics argillites.

STRUCTURE
In the Quinsam area, tectonic activity has produced a series
of down faulted blocks of Comox sediments trending northwest and
dipping from 3' to 17' northeast. A series of secondary transverse
faults branch off from the main northwest trending normal faults
and dissect the Comox formation in a radial fashion, primarily
alined in an east-west orientation. Minor high angle reverse faulting
occurs along the western boundary of the area where the Comox formation
has been affected by an uplift of the granitic Innsular Mountain Range.
In these situations, the footwall has been rotated downward to a
greater dip than the hanging wall.
The predominant style of faulting is brittle fracture at angles
ranging from 60') to near vertical. Displacements range from
in excess of 300 feet along some of the major northwest trending normal
faults to 5 feet or less along the subsiduary imbricate reverse faults.
Flexure folding and overthrusting are limited to the immediate area of
some of the more prominent faults as minor drag phenomena along the
planes of slippage. No evidence of structural thickening or thinning
is apparent in the coal seams although minor rolls were documented in
the underground workings in the Comox area to the south. In areas where
the Comox formation has been intruded by plutonic stocks or igneous
dykes, an extremely complex pattern of radial faults and closely spaced
joints is developed. Very limited work has been done in these areas
and it is not within the scope of this report to deal with them further.
Within the confines of the study area, the Comox formation occurs
in a single basin, down thrown to the east by a major normal fault which
- 28 -

trends northwest from a 90' bend in the Quinsam River to the
western shoreline of Beaver Tail Lake. The southern boundary of this
area is defined along a major transverse fault which runs parallel to
two elongated lakes south of the Quinsam River in a west to east
direction, roughly at 90' to the major east bounding fault. The
northern and western boundaries are defined along the glacial erosion
edge of the Comox formation which extends along the eastern margins of
Beaver Tail, Snakehead, Gooseneck and Middle Quinsam Lakes. Fig. 7
illustrates the structural framework of the study area.
The study area has been dissected by a series of seven, sub-
equally spaced, transverse faults trending in an east-west direction.
A secondary series of four high angle reverse faults intersect these
transverse faults at approximately 30' and effectively uplift and
increase the dip of the strata.
For the purposes of this report, the study area has been divided
into three adjoining structural blocks identified as the northern,
middle and southern blocks. Each block in turn has been subdivided
into sub-blocks labled A, 6, C. Detailed maps (Appendix II Maps 1, 2,
3 and 4) were constructed using drill hole information and air photo
interpretation to illustrate the structural framework of the study area.
These maps show the surface expression of all known faults and the
structure contour and overburden thickness isopach on the top of the
No. 1 and No. 3 seams. Detailed descriptions of each of the three
structural blocks follows:
- 29 -

1. Northern Block
The northern block extends southward from grid line ZOO+00
to 13OtOO. The northern limit is defined along the depositional
margin of the coal measures. The western boundary is marked by the
erosion edge of the coal measures and the eastern margin is defined
along the 200 foot overburden limit on top of the No. 1 seam. The
block is subdivided into four subblocks by four major east-west
trending transverse faults and one high angle reverse fault. Sub-
blocks D and C lie to the north and south respectively of a major
transverse fault which marks the northern boundary of the block. These
two subblocks exhibit the structural pattern on top of the No. 2 seam
as the No. 1 seam has shaled, out in this area. The strata strikes
336' N and dips 6' to the northeast in subblock D, and strikes 350' N
and dips 3' to the northeast in subblock C. The major transverse fault
separating the two areas has uplifted D to a maximum of 45 feet with
respect to C and increased the dip of the strata to the northeast. Cross
sections 195+00 and 185+00 illustrate this structural relationship.
Information is limited in the area and the boundaries of these sub-
blocks have been arbitrarily drawn using a 500 foot confidence limit on
the drill holes.
Subblock B includes all the strata extending southward from
gridline 185+00 to 130+00. The northern and southern boundaries are
marked by two major transverse faults trending 265' N and 240' N
respectively. The area is roughly bisected in an east-west fashion by
a subsidiary transverse fault trending 260' N. Displacement along this
fault attains a maximum throw of 10 feet. The strata within subblock B
strikes 330' N and dips 3' to the northeast. The uniform, gently dipping
- 30 -

nature of the coal seams within this block is illustrated on cross
sections 170+00 and 150+00.
Subblock A lies immediately south of subblock B, separated
by a high angle reverse fault trending 287' N. It has been downthrown
and rotated along this fault to a maximum displacement of 25 feet with
respect to subblock 6. The strike is 300' N and the dip is 12' to the
northeast. Glacial erosion has truncated the subblock to the south
and west. Cross section 15OtOO illustrates the relationship between
A and 6.
2. Middle Block
The middle block lies adjacent to the south of the northern
block, separated and downthrown from it a distance of 25 feet by a
major transverse fault. It extends southward from here to the Quinsam
River where it is separated from the southern block by another major
transverse fault. The western boundary is defined along the glacial
erosion edge of the coal measures and the eastern boundary is marked
by the 200 foot overburden limit on the top of the No. 1 seam.
The middle block is divided into three subblocks by transverse
faulting. The subblocks are labled A to C proceeding in a south to
north direction. The faults trend roughly east-west across the block,
uplifting south over north. The resulting pattern is such that subblock
A is displaced 25 feet upward with respect to B and B uplifted 35 to 40
feet with respect to subblock C. The strike ranges from 321' N to
327' N within the middle block and the dip increases progressively
southward as each uplifted subblock tilts slightly more to northeast.
- 31 -

Subblock C dips 7' to the northeast, B dips 7%' northeast and A dips
at,8' to the northeast. A complex structural zone is developed
where two major faults join along the boundary between subblock B and C,
creating a possible fourth structural subblock. The drill hole informa-
tion in this region is not sufficient to make any inference about the
structure. Crolss sections 120+00, 11OtOO and lOO+OO illustrate the
structural patterns of subblocks C, B and A respectively.
3. Southern Block
The southern block extends southward from the Quinsam River
to a major transverse fault running parallel to Long Lake. The western
boundary is marked by the outcrop of the No. 1 seam and the eastern
margin lies along the 200 foot overburden limit on top of the No. 3
seam. The area is bisected by a major fault trending 318' north which
intersects the north and south bounding faults at approximately 90'.
This fault is joined at 30' in the southern half of the block by a
smaller high angle reverse fault. The resulting pattern is subdivided
into three subblocks; A on the eastern side of the main fault, B on
the western side of the fault and C in the wedge shaped area between
the intersection of the two faults.
The action along the main fault is complex. It appears to
be hinged along an east-west axis in the northern part of the block
near grid line 60+00. At this location, there is little or no dis-
placement between subblock A or B. North of this axis subblock B has
been downthrown to a maximum of 45 feet and rotated 20' southward with
respect to subblock A. The dip of the strata increases from 7' east
in subblockA to 8%' northeast in subblock B. On the south side of
- 32 -

the axis, as is illustrated on cross section 50+00, subblock 8 has
been uplifted 40 feet with respect to subblock A. The. minor reverse
fault that intersects the main fault south of Line 50+00 thrusts
subblock A a maximum of 30 feet upwards with respect to subblock C,
forming a southwesterward plunging graben between subblocks A and B.
Cross section 4OtOO shows the relationship between A and C. The major
transverse fault forming the southern boundary intersects the middle
block along a plane dipping at 82'; displacing the No. 3 coal seam
80 feet downward south of this block.
This complex fault system has been developed by the uplifting,
tilting and rotation of subblock B with respect to A. The tectonic
action was generated by the rising granitic mountains to the west. The
stress must have been compressional in the north half of the block where
A is uplifted rela~tive to 8. The graben formed by subblock C would then
have been developed by extentional forces as subblock A and B were torn
apart. This is evidenced by the radical difference in strike between
A and B, ranging from 305' N to 275' N respectively.
- 33 -

FIGURE 7
OUINSAM AREA PHASE I
Overburden lsopach Top of Removeable Coal
LEGEND
n - 0 - 120’ Overburden
E - 120’- 160’ Overburden
q - 160’- 200’ Overburden ,!
SCALE I 25,000 /

COAL QUALITY
I. TEST PROCEUURES
1. Coal Istudied in this report was obtained by coring and
recovered in plastic tubes. Partings greater than 1" in thickness
were omitted from the samples.
2. Head :Sample Preparation and Analysis:
The sample preparation procedure is outlined in the flow-
sheet shown in Fig. 8. Each sample to be tested is air-dried accord-
ing to A.S.T.M. specification and then crushed under controlled
conditions in Hammer Mill crusher to give (1) inch top size.
The sample is then split 3 to 6 times (depending on the original weight)
to give a representative sample of raw coal which is subjected to
Proximate Analysis (Inherent Moisture, Ash, Volatile Matter and Fixed
Carbon),Calorific value, Free Swelling Index and Total Sulphur. A
composite of cores 1 to 11 was established for Ultimate Analysis, Ash
Fusion and Mineral Analysis of ash.
The rest of the sample is first screened (each size has been
analyzed for the percentage of ash)
Coal + %", "z x 28 mesh and 28 x 100 mesh (Core hole No. 4,5,6,10,
Composite of 8, Composite of 9 and Composite of 11).
Coal t k", k" x 28 mesh and 28 x 100 mesh (Core hole No. 1,2 and 3) is
subjected to Float-sink separation at specific gravities 1,3,1.35,1.40,
1.45, 1.50, 1.55, 1.60, 1.70, 1.80 and 1.90 using organic liquid of
standardized specific gravity.
Each specific gravity fraction is assayed for Ash, Total Sulphur and
BTU/lb.
- 35 -

3. Graphical Representation:
Washability Curves -
i) Cumulative Float ii) Cumulative Sink
iii) Elementary Ash iv) Specific Gravity
Distribution
were plotted for each fraction and combined fractions.
- 36 -

Scrk?ned
I
Raw Coal
Volatile Fixed Ash ~,,+,er carbon ::“,:ur Wdlb. Fs’.
I
Composite of IO cores from Seam No. 1,2,83
Ultimate Analysis
lndicotes Floai- Sink Test
FIGURE f3: FL,OW DIAGRAM SHOWING SAMPLE
PREPARATION AND ANALYSIS
- 37 L

II. PROXIMATE ANALYSES ON RAW COAL
1. Raw Coal Analysis
on air dry basis
Lab # Core Hole #
1065 1 (Seam 1)
1068 1 (Seam 1)
1066 1 (Seam 2)
1067 1 (Lower Seam 2)
1069 2 (Seam 1)
1070 3 (Upper Rider 1)
1071 3 (Seam 1)
1085 4 (Rider 1)
1074 4 (Seam 1)
1083 5 (Rider 1)
1072 5 (Seam 1)
1082 6 (Rider 1)
1073 6 (Seam 1)
1089 6 (Lower Seam 1)
1081 8 (Rider)
1086 8 (Seam 3)
1084 8 (Seam 3)
1076 8 (Seam 3)
1090 8 (Seam 2)
1075 9 (Seam 1)
1077 9 (Seam 1)
1080 lO(Seam 2)
1078 ll(Seam 1)
1079 11 (Seam 1)
Table 3
Bed Moist- Ash Vol. Fixed Total Thickness ure % %
1'22.4-197.4
Matter Carbon Sulph FSI BTU/lb
3.03 16.22 34.41 46.34 0.27 1% 11,289
198.7,.199.2 2.78 12.32 35.25 49.65 0.21 1% 12,083
131.6-134.75 2.65 14.78 38.49 44.08 2.52 1;; 11,874
139.1-140.2 2.40 18.97 37.88 40.75 4.40 1% 11,270
174.0-186.0 2.59 23.37 32.52 41.52 0.19 1% 10,369
108.7-110.4 2.45 14.58 38.33 44.64 2.54 1% 11,999
113.1-123.3 2.82 9.88 37.30 50.00 0.20 1% 12,626
165.05-167.1 2.54 11.54 38.87 47.05 3.47 1 12,232
173.6-185.4 2.58 10.11 37.67 49.64 0.30 1% 12,402
,183.6-184.6 2.10 25.09 34.76 38.05 0.41 1 10,199
187.3-198.0 2.73 11.54 36.40 49.33 0.27 1% 12,105
254.0-255.6 2.09 20.32 38.21 39.38 2.92 2 10,903
255.3-264.0 2.66 13.23 36.25 47.86 0.34 1% 11,923
264.5-265.4 2.43 25.39 31.91 40.27 1.76 1% 9,826
38.62-39.73 1.76 17.48 38.02 42.74 4.73 1% 11,209
47.94-49.99 2.09 18.73 37.14 42.04 1.91 2% 11,260
52.0-53.19 2.45 34.82 31.19 31.54 6.49 1% 9,051
53.82-56.31 2.04 15.47 37.59 44.90 3.04 2 11,915
164.4-165.5 3.14 17.97 35.79 43.10 4.14 1% 10.670
115.8-121.1 2.40 14.47 38.05 45.08 1.79 2 11,989
122.0-125.7 1.90 29.58 31.15 37.37 0.93 1% 9,480
149.23-152.82 2.14 14.02 36.87 46.97 4.91 2% 12,246
146.0-148.5 2.90 9.03 36.18 51.89 0.21 1% 12,579
149.9-158.0 2.79 18.36 34.12 44.73 0.30 1% 11,199
1087 No. 1 - Iron River 3.97 16.37 37.53 42.13 2.03 0 10,600
1088 No. 3 - Iron River 7.78 10.96 43.50 37.76 0.54 0 9,292
- 38 -

Moist. Ash Vol. Fixed Total % % Matter Carbon Sulph FSI Btu/lb
1. Average (Sean 1)
Standard Deviation (Seam 1)
2. Average (Rider 1)
Standard 'Deviation (Rider 1)
3. Average (Seam 2)
Standard Deviation (Seam 2)
4. Average (Seam 3)
Standard Deviation (Seam 3)
5. (Rider 3)
2.63 16.13
0.30 6.72
2.29 17.88
0.23
2.58
0.42 2.41
2.19 23.01
0.22 10.36
1.76 17.48
6.03
16.44
35.10 46.14 0.56 1.5 11,489
2.30 4.49 0.60 0.1 1,073
37.54 42.29 2.34 1.5 11,333
1.88 4.27 1.34 0.4 953
37.26 43.72 3.99 2.3 11,515
1.18 2.58 1.03 1.8 692
35.31 39.49 3.81 2.0 10,742
3.57 7.03 2.39 0.5 1,500
38.02 42.74 4.73 1.5 11,209
2. Proximate, Sulphur and Calorific Value
Average Moisture Ash Volatile Fixed Total (Seam 1) % % Matter Carbon Sulph
-
As analyzed
Dry basis
On 6.00% moisture
21.63
6.00
16.13 35.10
16.57 36.05
15.58 33.89
46.14 0.56 1.5 11,489
47.39 0.58 1.5 11,799
44.55 0.54
Average (Seam 2)
As Analyzed
Dry basis
On 6.00% moisture
2.58 43.72 3.99 2.5 11,515
44.88 4.10 2.5 11,820
6.00
16.44 37.26
16.88 38.25
15.87 35.96 3.85 2.5 11,111
Average (Seam 3)
As Analyzed
Dry basis
On 6.00% moisture
2.19
42.19
39.49
40.37
37.95
3.81
3.90
6.00
23.01 35.31
23.53 36.10
22.12 33.93
- 39 -
3.67
FSI Btu/lb
1.4
2.0
2.0
2.0
11,091
10,742
10,983
10,324

1. The average as-received ash content is ranging from 16.0 - 22.0%,
Seam No. 3 has higher ash than seam 1 and 2.
2. The average as received volatile matter is ranging from 34.00 -
36.00%.
3. The average as-received sulphur content is ranging from 0.55 - 4.0%.
The highest sulphur occurs in seam 2 and 3, in general sulphur
content is low in northern part and high in southern part.
4. As-received heat value averages between 10,300 - 11,000 btu/lb
Seam 1 and 2 have higher heat value than seam 3
On Moist Mineral Matter free basis the coal range 13,500 - 14,000 btu/lb
5. Coal has weak coking properties, FSI ranging 1% to 2%.
Seam 2 and 3 have 2.0 - 2% FSI while seam 1 has 1%.
6. Coal classified as high volatile/bituminous coal.,, II c
- 40 -
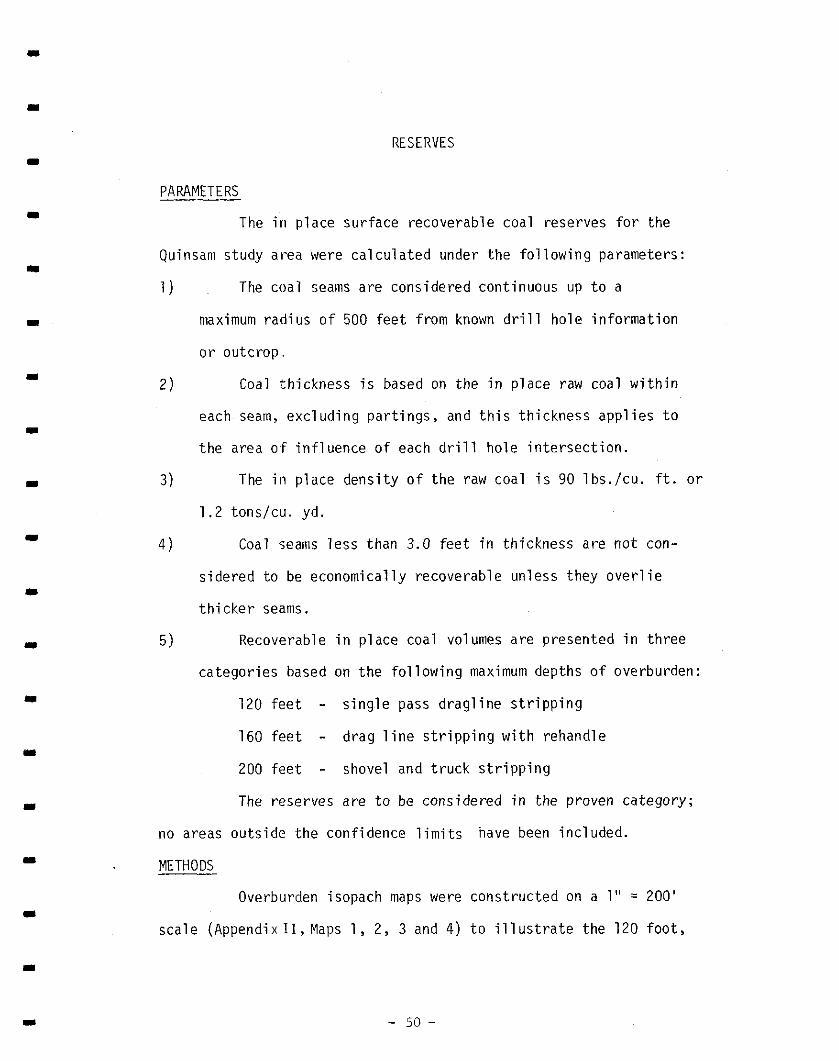
RESERVES
PARAMETERS
The in place surface recoverable coal reserves for the
Quinsam study area were calculated under the following parameters:
1)
2)
3)
4)
5)
The coal seams are considered continuous up to a
maximum radius of 500 feet from known drill hole information
or outcrop.
Coal thickness is based on the in place raw coal within
each seam, excluding partings, and this thickness applies to
the area o.f influence of each drill hole intersection.
The in place density of the raw coal is 90 lbs./cu. ft. or
1.2 tons/cu. yd.
Coal seams less than 3.0 feet in thickness are not con-
sidered to be economically recoverable unless they overlie
thicker seams.
Recoverable in place coal volumes are presented in three
categories based on the following maximum depths of overburden:
120 feet - single pass dragline stripping
160 feet - drag line stripping with rehandle
200 feet - shovel and truck stripping
The reserves are to be considered in the proven category;
no areas outside the confidence limits have been included.
METHODS
Overburden isopach maps were constructed on a 1" = 200'
scale (Appendix II,Maps 1, 2, 3 and 4) to illustrate the 120 foot,
- 50 -

160 foot and 200 foot overburden limits above the recoverable coal
seams within each of the structural blocks. The areas between each
overburden limit were calculated by planimetering the maps and these
were converted to square yards. The volume of coal was calculated by
multiplying the average raw coal thickness by the surface area
with each structural block. Coal volume was converted to tonnage
and overburden volumes were estimated by multiplying surface area
by mean overburden thickness. A raw in place tons of coal to cubic
yards of overburdenratio was calculated for each structural
block.
Throughout the study area,the overburden limits were
calculated to the top of the No. 1 seam with two exceptions. In
the northern block, the No. 1 seam is missing in sub blocks C and
D, so the overburden isopachs were drawn on the top of the No. 2
seam. In the southern block, the No. 1 seam is too deep to be
economically recovered in sub block A so the overburden isopach is
constructed on top of the stratigraphically higher No. 3 seam.
The results of the reserve calculations are summarized
as follows. Table 5 through 7 list the detailed calculation for
each individual sub block included in the reserves.
- 51. -

TABLE 4 PROVEN IN PLACE RESERVES
(Short Tons x 106)
A. Northern Block
Depth of Overburden Seam No. 2 Seam No. 1 Overall Ratio
0 - 120 feet .868 1.273 8.7:i
120 - 160 feet .689 1.175 12.4:1
160 - 2DO feet .894 2.569 12.2:1 -- -__
Sub Total 2.451 5.017 11.5:1
B. Middle Block
0 - 120 feet .124 i .oza 6.1:1
120 - 160 feet .115 ,822 8.6:1
160 - 200 feet .152 1.093 11.1:1
Sub Total .391 2.943 8.6:1
C. Southern Block
Depth of Overburden Seam No. 3 Seam No. 1 Overall Ratio
0 - 120 feet .785 .751 5.1:1
120 - 160 feet .325 .232 13.5:1
160 - 200 feet .294 .071 17.9:1
Sub Total 1.40 1.05 9.5:1
- 52 -

RESERVE SUMMARY
Depth of Overburden Proven Tons Over all Ratio Overburden Volume
(feet) (Cu. Yds. (short tons x 106) (Cu. yds./tons)
x 106) Seam Seam Seam No. 1 No. 2 No. 3
0 - 120 3,3.52 3.05 0.93 .785 6.9:1
120 - 160 38.93 2.23 0.80 .325 11.6:1
160 - 200 62.78 3.73 1.05 .294 12.4:1
Sub total 9.01 2.84 1.40
Total 135.23 13.25 10.2:1
- 53 -

Table 5
Proven In Place Reserves
Northern Block
Subblock Seam No. Average Seam Overburden Overburden In Place Ratio Thickness Thickness Volume
(feet) (feet) (Cu. Yds. x 106) (ShortT~~~~g~ 106) (Cu. Yds./Tons)
A No. 1
No. 2
Total
9.1
2.4
11.5
75 - 120 .54 .064 8.5:1
120 - 160 1.80 .140 12.8:1
160 - 200 1.87 .113 16.5:1
75 - 120 .017
120 - 160 .037 Overall Ratio
160 - 200 .030 Mining No. 1 and No. 2
4.21 .401 70.5:1
B No. 1 10.0 40 - 80 2.14
80 - 120 6.51
120 - 160 14.21
160 - 200 40.49
No. 2 3.1 40 - 80
80 - 120
120 - 160
160 - 200
13.1 63.35
.428 5.O:l
.781 8.3:1
1.035 13.7:1
2.456 16.5:1
.107
.234
.378 Overall Ratio
.864 Mining No. 1 and No. 2
6.283 lO.D:l
C No. 2 4.2 80 - 120 5.47 .276 10.8:1
120 - 140 7.07 .2?4 25.8:1
Total 4.2 12.54 .550 22.8:1
D No. 2 3.6 60 - 120 4.44 .213 20.8:1
Total Northern Block 84.54 7.45 11.3:1

II 8 I I I I I I I I I I I I I I I I
Table 6
Proven In Place Reserves
Middle Block
Sub block Seam No. Average Seam Overburden Overburden In Place Ratio Thickness Thickness Volume
(feet) (feet) (Cu. Yds. x 106) (Shor:":iizex 106) (Cu. Yds./Tons)
A No. 1 12.0 60 - 120 2.82 .452 6.3:1
120 - 160 2.61 .268 9.7:1
160 - 200 5.83 .467 12.5:1
No. 2 1.4 60 - 120 .053
120 - 160 .031 Overall Ratio
160 - 200 .054 Mining No. 1 and No. 2
Total 13.4 11.26 1.325~ 8.5:1
B No. 1 12.2 55 - 120 2.55 .427 6.0:1
120 - 160 1.80 .188 9.6:1
160 - 200 1.97 .160 12.3:1
No. 2 1.3 55 - 120 .045 Overall Ratio
120 - 160 .020 Mining No. 1 and No. 2
160 - 200 .017 Total 13.5 6.32 .857 7.4:1
C No. 1 11.5
No. 2 2.0
Total 13.5
95 - 120 1.16 .149 7.8:1
120 - 160 2.20 .217 10.2:l
150 - 160 1.68 .149 11.3:l
160 - 200 6.08 .466 13.r):l
95 - 120 .826
120 - 160 .038 Overall Ratio
150 - 160 .026 Mining No. 1 and No. 2
160 - 200 .r)81
11.12 1.152 9.7:1
Total Middle Block 28.70 3.334 8.6:l

I I I I I
Subblock Seam No.
A NO. 3
Total 8.2
B No. 1 9.2
I I
Average Seam Thickness
(feet)
8.2
I I I I I
Table 7
Proven In Place Reserves
Southern Block
Overburden Overburden Thickness Volume
(feet) (cu. yds. x 106)
0 - 120 3,81
120 - 160 4.62
160 - 200 5.39
13.82
0 - 120 4.08
120 - 160 2.95
160 - 200 1.15
B I I
In Place Tonnage
(short tons x 106)
,624
.325
.294
Ratio
(cu. ydsltons)
6.1:1
14.2:l
18.3:1
1.243 11.1 :l
.751 6.5:1
.232 12.7:1
.071 16.2:1
Total
C No 3
9.2
5.8
8.18
0 - 120 1.38
1.054
.161
7.8:1
8.6:1
Total 23.38 2.458 9.5:1

APPENDIX I
Cross Sections - Quinsam Phase I Series 1" = 200' Scale Sections: 40+00 and 50+00
60+00 and 85+00 lOO+OO and llO+OO 120+00 and 135+00 150+00 and 170+00 185+00 and 195+00
- 57 -


QUINSAM COAL LIMITED
CORE HOLE DRILLING
PROSPECTUS
STAGE I
STAGE II
STAGE II GOV’T REVIEW STAGE II ADDENDUM
VOL.1 MIDDLE BAY
VOL.2 MINE SITE
STAGE II GOV’T REVIEW STAGE III
COMpM$;;; INFORMATION
ENGINEERING AND FEASIBILITY STUDIES
CONSTRUCTION
OPERATION
- 1974
SUMMARY OF ACTIVITIES I975 - 1976
-
I
-
1980 1981 - 1982
lill Irni lllllll
Ill
1983
I Ill
1984 1986
J ’ !. 11111 lllllllllllllll
III111111
L
I !
11111~
- 1987 -
I
I -

-2-
A BRIEF HISTORY OF QUINSAM COAL LIMITED
Quinsam Coal Limited was incorporated as a joint venture company in 1976 by Weldwood of Canada Limited and Luscar Limited of Edmonton, Alberta, to explore and develop Weldwood's coal reserves in the Campbell River area.
On August -19, 1981, Weldwood and Brinco jointly. announced that Brinco would assume Luscar's interest in Quinsam Coal, which included the management of the project.
THE QUINSAM COAL PROJECT
The project is located in Electorial area D, which is within the Regional District of Comox - Strathcona. The topography consists of a series of low rolling hills and plateaus separated by narrow valleys. The total project area consists of 1,400 acres of which only 200 to 300 acres will be mined at any one time. Access to the property is by a 22 km paved road and 5 km of gravel logging roads.
GEOLOGY
Three coal seams occur on the Quinsam property. of these seams persist throughout the area. The.third seam occurs only in the southern structural block.
To date a total of 503 geophysically logqed.holes, and 56 cored exploration holes have been drilled to define the coal reserves.
Presently Brown, Erdman consultants are reviewing the property geology from a&&&&~i~;a_l_point of view. Numerous additional drilled holes will be necessary to complete this investigation.
MINING
OPEN PIT MINING/RECLAMATION
Present open pit mine planning is based on developing seven pits to a maximum depth of 61 meters. Variations 'of raw coal quality will necessitate the operation of two to three pits at one time in order that the various coals can be blended.
The materia 1 to be mined in the open pits above the

To: A. Matheson Coal Inventory
Date: May 22, 1980 Our File:
Re: Middle Quinsam Coal Reserves
An estimate of the reserves has now been completed, wi,th the following results:
Seam #3 1,250,OOO tonnes Seam #2 9,090,OOO tonnes Seam #l 15,400,OOO tonnes
Total 25,740,OOO tonnes
The source of all data was the drillers' logs from the 1977-78 period submitted by Weldwood of Canada Limited. In the fall of 1979 I had Ulrich Suesser draw cross-sections and some longitudinal sections through the holes to (a) es- tablish the structural pattern and (b) facilitate seam iden- tification. This spring I have had Greg Elliott making the calculations. He re-plotted the holes for each seam, plot- ting only those holes in which the seam thickness exceeded a certain mini.mum, 4 feet for No. 1 and 5 feet for Nos. 2 and 3. The 4-foot minimum was a mistake, but inspection shows that elimination of these eight holes would decrease the areas very little, and it would of course increase the average thickness slightly. Where the log indicated several seams separated by thin beds of shale, they were treated as one seam and the aggregate thickness of coal was used. No intersections were deeper than 1,000 feet (300 m). Rec- tangles were drawn around clusters of productive holes in such a manner that no part of the rectangle was more than 1,000 feet (300 m) from a productive hole. Where the side of a cluster was a row of productive holes, the side of the rectangle was placed 250 feet (75 m) beyond. An arithmetic average of the thickness was calculated for each rectangle. The computed volumes within the rectangles were summed for each seam and converted from cubic feet to metric tons. A back-calculation showed a specific gravity of 1.29 had been used in calculating the reserve for the Quinsam area given by Muller & Atchi~son, and that figure was used in the present calculations.
G.E.P. Eastwood
GEPE/dlb
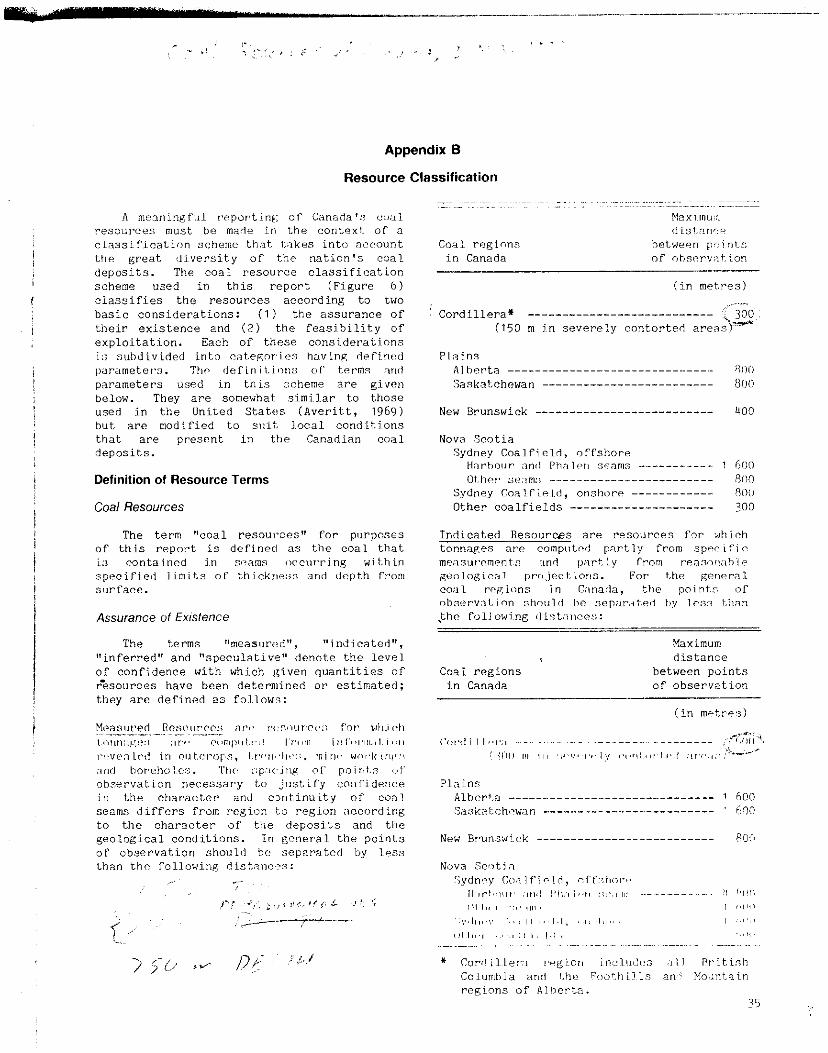
Appendix B
Resource Classification
i
i
* mc3i~ingPuI reporting; of Canada ‘:i cua1 reSO”,‘CeS must be made in the context of a classification scheme that ILakes into account the great diversity of the nation’s coal deposits. The coal I’~SOUK!E classification scheme used in this report (Figure 6) classifies the resources according to two basic considerations: (1) the assurance of their existence and (2) the feasj~bility of exploitation. Each of these considerations i:; subdivided into rat.ep;orics havinp defi~nr:ri ,mwnetcr:i. IT,<. drfirr i 1. ion:: of terms and parameters used in this ::cheme are given below. They are somewhat similar to those used in the United Stateis (Averitt, 1969) but are modified to slii~t. jocal condition.? that are present in ttre Canadian coal deposits.
Definition of Resource Terms
Coal Resources
Assurance of Exktence
The terms “measurtid”, “jMdicated”, “inferred” and “speculative” denote the level of confidence with which (given quantities of r’esources have been determined or estimated; they are defined as follow;:
(in met,res)
Cordillera* T:‘,-.d
_____-__-___-______________ (150 m Ian severely contorted aren~3*

It i:; realized that it would be more meaningful to expre;.; the a:is"ra"ce of existence (level of confidence) by a range of possible error rather than by an arbitrary spacing of the points iof observation. As an example, a measured resource estimate might be stated to have a level of confidence to within plus or minus 10 per cent. To dchieve this ~~~"i~~S ColnpleK analysis. It is intended to proceed with the work so that ultimately the coal rnS""rCe Will. bc reported in this rxinner'.
Resources of Immediate Interest consist of coal seam.5 that, because of favourable c"mbi~":,ti~"ns Of 0, ickrlc!::s, quai i Ly, drpt~h, iam I <,c::3,. I 01,) ,',I~'<, ,~<,,l:i i ',iil.,.., 1.0 ,>l, II,' imrarr, i;3tc i"l.Cl'lfliL l'i,l t~,x,,ih,~;iLi~o" 0,' exploitation activities,. The conditions set out below do not app1.y rigorously in each case, but they give a ((enera indication of thickness and <depth of CoJl seams inclllded in this category. In all areas, coal beds are included that are thinner OF deeper than listed below but are nsnetheless being mined at this time.
Cordillera: Coal of all ranks in beds at least 1.5 m thick that can be surface-mined.
Plains: (Alberta and Saskatchewan)
N,,“,~, ::s, ,,I, i ,,: ~,*‘fsh”re :
Onshore:
Bituminous and subbituminous coal beds a+. least 1.5 " thick to a depth of 730 m. ,.ily,it.* seams at least. 1.5 "i f.h i~Ck that. can be :;llrf,acn mi ricd (,~,~enrrxI ly 1.0 dir~,pt,hs ,t.:iii t.,i:in 145 "i,.
Seams at. least 0.4 m to a dvpth Of 24 In.
Seams at least one metre thick to a depth of 1 200 m.
Seams at least 0.5 m thick t.0 depths of 115 e xld Rli :;<~:,l":: :1I. ,fv:;t. on<- ,,,,-,; ,.P Ii~ick 1.0 depth of 1 ;'OO m.
Rez3”urces of Future Interest consist of coal seams that, because of less fav$urable combinations of thickness, quality, depth, and location, are not of immediate interest but may become of interest in the foreseeable future. The following limits we applied (excluding the resources of immediate interest described above):
,‘,,;,ill:i: ill.:lm:i at ,w:i,; c>ric mr:trr, (nl~hel-ta 311’1 thick to depths of 450 m. Saskatchewan)
Onshore: senms at least one metre thick with depths in excess of 1 200 m.
Future Consideratims
When new mining technologies and/or changing economic conditions have indicated the possibility of mining thinner OF deeper Seams, or seams that are otherwise currently excluded from the estimates, it may become necessary to change the parameters for determining the feasibility of exploitation so as to include these coals in the estimates.

DEFINITIONS 6 I’ARAMETERS
Measured Coal Reserves are those which have a maximum data point
spacing of 375 metces. These are found only
on Chose properties which have completed feas-
ibility studies containing enough exploration
information co do a detailed mine design and
cost analyses.
Indicated Coal Resources allow a maximum spacing oE 750 metres becveen
data points but are not restricted to those
properties having completed feasibility studies.
Inferred Coal Resources are those resources having a data point spacing
of greater than 750 metres. A depth limit of
750 metres is imposed here. although economic
coal seams may exist beyond this depth. Proper-
ties containing coal resources of less than one
million metric tonnes are considered inferred
as well.
Acceptable Data Points include boreholes (diamond, rotary and some Winkie).
adics and trenches and have accurate physical
measurements of seam thickness.
In Situ Coal is defined here as in place, underground coal seams of
greater than 1.5 metres chick (and riders of 1.0 metres chick)
wlaicll exclude the partings of greater than IO centimetres
in thickness.
Run-of-Nine Coal is in place. underground coal which excludes chose part-
ings that can be selectively mined “UC ac the pit site,
and may be more or less than ttw total coal seam thickness
Clean Product Coal is that coal which is refined through the wash plant
(mccallurgical coal). Thermal coal may be clearled for
a partial refining.
The R.O.M. and Clean Product coal figures were obtained from the companies.
Due to confidentiality requirements individual property ceserves and
resources vere cocallcd by coalfields.

m
m
1
m
I
I
I
m
m
QUALITY
Core samples from each of the three coal seams were analysed
excluding partings greater than 1" in thickness. The coal is classified
as High Volatile Bituminous A with the following average analysis on
a raw air dried basis:
Proximate Analysis (air dry)
Seam Number of Moisture % Ash % Sulphur % Btu/lb. FSI Samples _ -
No. 1 8 2.63 16.13 0.56 11,489 1 l/2
No.2 2 2.58 16.44 3.99 11,515 2 l/2
No.3 1 2.19 23.01 3.81 10,742 2
Ash content varies from 9.0% to 23.4% and is directly related
to the amount of bone material associated with the seam.
Sulphur content ranges from 0.19% to 4.91% increasing
directly with FSI of the coal, indicating a metamorphic upgrading
in rank of the coal and a metasomatic enrichment in sulphur, usually
in the form of pyrite.
All samples were crushed and sink-float tests were
conducted on four size ranges (from 1” to 100M). Proximate analyses
were conducted for ash and sulphur on the floats separated at 1.30
to 1.90 S.G. The results of these tests indicate the following:
1) Recoveries of 90% can be achieved on floats between 1.70 to
1.90 S.G. to yield a product with a maximum ash content of 10%.
2) Sulphur content ranges from 0.20% to 0.35% for 8 of the 9 samples
analized for the No. 1 seam. In the remaining No. 1 seam sample and
the samples from the No. 2 and No. 3 seams, the sulphur content
-L-

cannot be economically reduced beyond 2% by float-sink methods.
3) Most of the high ash, high sulphur coal is concentrated
in the size fractions (-100 M). The percentage of fines is
usually not in excess of 5% of the total raw coal.
It is conceivable that this coal,could be cleaned by a
jig system to yield a product with a 10% ash content. However, other
methods will have to be employed to reduce the total sulphur content.
-5-

I
‘V
I
I
I
I
I
III. ASH FUSION, MINERAL ANALYSIS OF ASH AND ULTIMATE ANALYSIS
1. Ash Fusion Temperature F"
Initial Hemi- Deformation Spherical spherical Fluid
Reducing 2264 2408 2462 2516
Oxidizing 2444 2471 2498 2534
It is difficult to report specific temperature for any
area or district. A composite of Raw Coal (all seams)(l6% ash)
gives softening temperature of 2408, 2471 on reducing and
oxidizing atmospheres respectively. This softening temperature
of ash is medium fusibility. The clinkering characteristics will
depend on the furnace temperature, the kind of stoker and the
distrit'ution of the ash forming constituents in the coal.
2. Mineral Analysis of Ash (on 16.00% ash) All Seams
s102 % A1203 % Fe203 % Cao % Mgo %
31.24 23.82 16.90 13.41 0.65
I
I 3. Ultimate Analysis (on 16.00 ash) All Seams
I
Na20 %
0.27
K20 %
0.25
so3 %
8.01
P205 %
0.34
T102 %
2.17
H20% C% H% N% S% A% 0%
As Determined 2.28 64.02 4.30 0.77 2.53 16.00 12.38
Dry Basis __ 65.51 4.14 0.79 2.59 16.37 10.60
-41 -

I
w
I
4. On Clean Coal (lo.24 % Ash ), Composite of all seams give
the following results:
a. Ash Fusion Temperature F"
Initial Hemi- Deformation Spherical spherical Fluid
I Reducing 2264 2390 2444 2498
Oxidizing 2408 2475 2516 2570
The ash fusion temperature (softening) is lowered with
clean coal (10.24% ash) and gives 2390°, 2475O on reducing and
oxidizing atmosphere respectively.
b. Mineral Analysis of Ash (On 10.24% ash)
s102 % A1203 %
24.29 21.62
Fe203 %
15.82
Cao %
18.29
Mgo %
0.30
Na20 % K20 % so3 % P205 % T102 %
0.25 0.32 11.61 0.53 2.21
C. Ultimate Analysis
H20% C% H% N% S% A% 0%
As determined 2.20 69.93 4.92 0.88 1.81 10.24 12.22
Dry Gasis 71.50 4.78 0.90 1.85 10.47 10.50
On 6.00% Moisture 6.00 67.21 4.49 0.85 1.74 9.84 9.87
d. F.S.I. has not improved after cleaning the coal.
- 42 -

I
I
I
I
I
IV. WASHABILITY STUDY
From the ash percent of the size analysis, washability
curves for each, size and also of the combined sizes (2" x 100 mesh).
These curves indicate the following: (on air dry basis)
1. CcNre Hole #l - Lab. No. 1065
a. The Coal becomes progressively dirtier with a
decrease in size; the dirtiest size is 100 x 0 mesh
(34.5% ash)
b. By comparing washability curves of each size and the
combined sizes:
i) There is no cleaning advantage in crushing this
coal to finer than 2" x 0.
ii) Theoretical recovery and ash % at cut point 1.8.
FRACTION ASH %-S % RECOVERY % BTU/lb.
1" x 28 mesh 8.2 0.22 88.0 12,400
$k" 8.0 0.19 89.0 12,550
k' x 8 mesh 8.0 0.21 88.0 12,550
8 x 28 mesh 8.0 0.22 87.0 12,600
2. Core Hole #2 - Lab. No. 1069
a . The Coal becomes progressively dirtier with a decrease
in size; the dirtiest is 100 x 0 mesh (41.8% Ash)
b . By comparing washability curves of each size and the
combined sizes:
i) There is no need to crush this coal to finer
than 2" x 0.
ii) Theoretical recovery and ash % at cut point 1.8
FRACTION ASH % S % RECOVERY % BTU/lb.
1" x 100 mesh 10.5 0.24 84.0 12,28O
ty 12.5 0.22 82.5 12,200
&" x 8 mesh 10.0 0.21 83.5 12,350
8 x 28 mesh 9.0 0.23 80.5 12,30n
28 x 100 mesh 9.0 0.26 74.0 12,310
- 43 -

I,
‘4
.
I
L
I
4
-
3. Core Hole #3 - Lab. No. 1071
a . The cleanest size range is %" x 28 mesh with both
the coal larger and smaller than this size becoming
progressively dirtier.
b By comparing washability curves of each size and the
combined sizes:
i) Theoretical recovery and ash % at cut point 1.8
FRACTION ASH% S% RECOVERY % BTU/lb.
1" x 28 mesh 8.0 0.23 95.5 12,800 ty 9.0 0.21 96.5 12,600
k' x 8 mesh 7.5 0.20 95.5 13,200
8 x 28 mesh 7.0 0.24 94.5 13,250
4. Core Hole #4 - Lab. No. 1074
a . The cleanest size range is $" x 28 mesh with both the
coal larger and smaller than this size becoming
progressively dirtier.
b . By comparing washability curves of each size and the
combined sizes: . > i) Theoretical recovery and ash % at cut point 1.8
FRACTION ASH % S % RECOVERY q/ BTU/lb.
1" x 100 mesh 8.5 0.23 96.0 12,500 tk2" 11.0 0.23 98.0 12,400
$" x 28 mesh 8.5 0.22 96.0 12,600
28 x 100 mesh 8.5 0.22 90.0 12,590.
5. Core Hole #5 - Lab No. 1072
a . The coal becomes progressively dirtier with decrease
in size, the dirtiest size is 100 x 0 mesh (34.85%).
b By comparing washability curves of each size and the
combined size;
7) There is no need to crush this coal to finer than 2" x 0
ii) Theoretical recovery & ash % at cut point 1.8
- 44 -

FRACTION
1" x 100 mesh
+ b*"
k" x 28 mesh
28 x 100 mesh
ASH % S % RECOVERY % BTU/lb.
8.5 0.27 92.5 12,750
11.5 0.26 93.0 12,590
8.0 0.25 93.0 12,800
7.5 0.30 78.0 13,000
6. Core Hole #6 - Lab. No. 1073
a. The coal becomes progressively dirtier with decrease
in sizes, the dirtiest size 100 x 0 mesh (52.16% ash)
b. By comparing washability curves of each size and the
combined sizes;
i) Theoretical recovery and ash % at cut point 1.8
FRACTION ASH% S% RECOVERY % BTU/lb.
1" x 100 mesh 8.0 0.31 93.0 12,900
+ y 12.0 0.26 96.5 12,250
g" x 28 mesh 7.5 0.30 93.5 12,950
28 x 100 mesh 6.5 0.34 79.0 13,400
7. Core Hole #8 - Lab. No. X (1081, 1086, 1084 and 1076)
(Composite of Seam # 3)
a. Seam No. 3 was sampled in four sections from top to bottom
omitting parting, size analysis was conducted on the four
samples to examine the ash % of each in descending order
through the seam, the coal becomes progressively dirtier with
a decrease in size, for Rider (30.54% ash) for top
(30.52% ash), for middle (30.16% ash) and for bottom
(27.43% ash)
b. Theoretical recovery and ash % at cut point 1.8
FRACTION ASH % s "0 / RECOVERY % BTU/lb.
+ b2" 17.0 2.20 55.0 11,200
k" x 28 mesh 11.0 4.30 91.0 12,600
28 x 100 mesh 8.5 3.50 84.5 12,900
- 45 -

I
I
I
I
I
I
a. Core Hole #9 - Lab. No. (1075 and 1077), (Composite of Seam #l)
a. Lower part of the seam is relatively dirtier than
upper part.
b. In lower part of the seam the cleanest size range is
k" x 100 mesh larger and smaller than this size becoming
progressively dirtier; In upper part of the seam the
cleanest size range is 3/4" x 100 mesh.
C. Theoretical recovery and ash % at cut point 1.8
FRACTION ASH% 2% RECOVERY % BTU/lb. f!;" 28.0 1.37 63.5 9,950
J& x 28 mesh 12.0 3.00 91.5 12,000
28 x 100 mesh a.5 3.20 86.5 12,700
i) There is some improvement by crushing coal to k"
x 28 mesh.
ii) Coal is easy to wash at k" x 28 mesh, difficult at ++"
9. Core Hole #lO - Lab. No. 1080
a. The coal becomes progressively dirtier with decrease in size.
b. By comparing washability curves of each size and the
combined sizes;
i) There is no need to crush this to finer than 1" x 0
ii) Theoretical recovery and ash % at cut point 1.B
FRACTTON ASH% S% RECOVERY % Btu./lb. - 1" x 100 mesh a.0 5.00 89.0 12,800 ty __ __
!i" x 28 mesh a.5 5.10 91.5 13,oor)
28 x 100 mesh a.5 3.50 92.5 12,700
10. Core Hole #ll - Lab. No. 1078 (Composite of upper and lower
Seam #l)
a. The coal becomes dirtier with decrease in size below 100 m.
The dirtiest size 100 x 0 (25.5% ash)
b. By comparing washability curves of each size and the
combined sizes;
- 46 -

i) There is some improvement by crushing coal to
k" x 28 mesh.
ii) Theoretical recovery and ash % at cut point 1.8
FRACTION ASH % S % RECOVERY % BTU/lb.
1" x 100 mesh 11.0 0.26 89.5 12,400 + q 17.0 0.23 81.0 11,000
!s" x 28 mesh 11.0 0.20 91 .o 12,500
;?8 x 100 mesh 7.5 0.28 87.5 13,100
11. Core Hole #l - Lab. No. (1066 and 1067), (Composite of
upper and lower seam #2)
a. The coal becomes progressively dirtier with decrease
in size, the dirtiest size 100 x 0 mesh (39.00% ash).
b. Theoretical recovery and ash % at cut' point 1.8
FF!ACTION ASH% S% RECOVERY % BTU/lb.
combined &" x 28 mesh 10.5 3.50 87.5 12,300
upper seam k' x 8 mesh 9.0 2.00 91.0 12,500
upper ' 8 x mesh 9.0 2.00 87.0 12,550
lower 'I- '4" x 8 mesh 12.5 4.50 86.5 12,200
- 47 -

I
#
I
c
I
I
I
CONCLUSION
The range of recoveries, ash %, sulphur and Btu/lb at cut point 1.8
Seam 1: "2" x 28 Mesh (73.0% of Total Seam)
No. of Sulphur % Btu/lb core holes Recovery Ash % air dry on 6% M air dry on 6% M
basis basis -__ -
7 82.0 -92.0 8.0-10.0 0.2-0.3 0.19 12,400 11,970 0.25 12,800 12,355
Seam #l could give better recovery in 1" x 100 Mesh fraction
(Recovery 90$ - 10% Ash 0.2% S) than Y' x 28 Mesh fraction.
Seam 2: 4" x 28 Mesh (60.0% of Total Seam)
No. of Sulphur% Btu/lb core holes Recovery Ash % air dry on 6% M air dry on 6% M
basis basis -__ -
3 87.5 - 91.5 8.0-12.0 2.2 2.1 12,200 11,780 4.3 4.2 12,700 12,260
(I
I
Seam 3: k" x 28 Mesh (73.0 % of Total Seam)
No of Sulphur % Btu/lb core holes Recovery Ash % air dry on 6% M air dry on 6% M
basis basis -__ ~ -__
1 91 .l 11.00 3.5 3.4 12,550 12,115 4.0 3.9 12,600 12,165
Seam # 2 and 3 could give better recovery in k" x 28 Mesh fraction
than 1" x 100 Me,sh
- 48 -

m
I
I
I
I
1) The washability studies suggest that most if not all
Vancouver Island coals can be readily washed to a desirable
and low ash level with a minimal loss of yield.
The coal analysed excluded any out of seam dilutant and
all in seam dilutant greater than 1" thickness. Therefore
the recoveries determined are basically for the coal sections
and do not necessarily reflect the quality of the feed to
the preparation plant.
In order to establish the preparation feed quality and
hence practical washing plant recovery the diluation must be
calculated ,and washability data modified accordingly.
2) Seams No. 2, 3 and 1 (core hole 9) have a high sulphur
content ranging from 2.0% to 5.0% in the clean coal. Further
work should be done to determine methods of sulphur reduction
other than gravity separation.
-49 -

,.. .,_
. - -~

LEXCQ TESTING LTD. coal washability a.nalysis
COAL FIELD: QUINSAM LAB NO.* 1065
HOLE NO.1 No. 1 Seam No. 1 DATE SAMPLED:
LOCATION 1 150 + 00 1500 RT DATE RECIEVED:
INTERVAL’ 192.4 - 197.4 DATE REPORTED:
RAW COAL SIZE FRACTION: .‘.)f
WT.% ASH% B.TU.1 ANALYST2

LEXCO TESTING LTD. coal washability a.nalysis
COAL FIELD: (IUINSAM
HOLE NO.3 No. 1 Seam No. 1
LOCATION 1 150 + 00 1500 RT
INTERVAL1 192.4 - 197.4
RAW COAL SIZE FRACTIONI k x 8 mesh
WT.% ASH% B.TU.1
LAB NO.1 1065
DATE SAMPLED:
DATE RECIEVED:
DATE REPORTED:
ANALYST’
1.90 1.90
1.50 52.76 0.09 5,547
89.50 8.91 .I8 112.00 ,I 71.49 I .oo I 1.90 10.50 74.17 ---- ---- 100.00 15.76 --- 10.50 74.17 --- l
REMARKS’

LExCO TESTING LTD. coal washability analysis
COAL FIELD: Ouinsam LAB NO.1 1065
HOLE NO.1 1 Seam No. 1 DATE SAMPLED: LOCATION 1 150+00 1500 RT DATE RECIEVED:
INTERVAL’ 192.4 - 197.4 DATE REPORTED:
RAW COAL SIZE FRACTION: 8 x 28 mesh
WT.% ASH% B.TU.I ANALYST1
CUMULATIVE
1.35 1.40 8.50 9.97 0.22 12,198 74.70 4.75 .21 33.80 AklLiLL- 12
1.40 1.45 4.30 17.070.20 11,077 79.00 5.42 .21 25.30 51.81 .o8
1.45 1.50 1.2 24.56 0.20 9,874 80.20 5.70' .21 .06
1.50 1.55 1.4 29.29 0.19 9,369 81.25 6.13 .21 .05
I.55 1.60 0.6 11.23 0.15 8,928 82.20 6.31 .21 19.80 61.03 .o4
1.60 1.70 2.10 34.~63 0.13 7,906 84.30 7.02 .21 17.80 64.44 .o2
1.70 I.80 1.90 45.68 0.11 -86.20 7.87 .2o 15.70 68.43 .ol
1.80 1.90 1.70 48.36 0.10 5.749 87.90 8.65 .I8 l3.80 71.56 .oo
1.90 12.10 74.82 ---- ---- 100.00 16.66 --- 12.10 74.82 ---
REMARKS’

LEXCO TESTING LTD. coal washability analysis
COAL FJELD: Ouinsam LAB NO.: 1066
HOLE NO.: 1 No. 2 Seam DATE SAMPLED:
LOCATION 1 150 + 00 yjcc y\y DATE RECIEVED:
INTERVAL1 131.6 - 134.7 DATE REPORTED:
RAW COAL SIZE FRACTION: k x 8
WT.% ASH% BTU.1 ANALYST 1
I SPECIFIC GRAVITY I ELEMENTARY
I SINK I FLOAT 1 wt. 1 wt % 1 ASH%i 5% Iiwlb.
( I.30 1 (25.00 1 4.11 1 .75 113538
130 1.35 39.60 6.05 1.54 13181
1.35 1.40 11.10 11.36 2.17 12372
I 1.40 1 1.45 I I6.10/16.0613.00 111549
i I I 1.50 1.55 j 1.9 j26.5413.90 jiOi9i
I.55 1.60 3.52 27.31 4.45 97131
1.60 1.70 1.30 34.79 5.45 8730
1.70 I.EO 1.80 39.17 5.49 7433
1 LEO I 1.90 I I 1.80 147.40 I - I -
I 1.90 6.90 63.86 - -
REMARKS’

LEXCO TESTING LTQ. coal washability analysis COAL FIELD: nllinsnm LA8 NO.* 1067
HOLE NO.: MO. 1 No. 2 Seam DATE SAMPLED:
LOCATIONI 150 + 00 1500 RT DATE RECIEVED:
INTEkVALl 139.1 - 140.2 DATE REPORTED:
RAW COAL SIZE FRACTION: k x 28
WT.% ASH% RTU.: ANALYST I
1.80 1.90 2.60 40.30 g.4g 7771 89.10 12.86 13.50 59.83
1.90 10.90 64.49 - - 100.00 18.49 10.90 64.49
REMARKS:
- 2 l--l---l 1 1 I a t %--- 1 1 1 1 1 a 1 1 I

LExcO TESTING LTD. coal washability analysis
COAL FIELD: nuiP.snm LAB NO.* 1066
HOLE NO.1 No. 1 No. 2 Seam DATE SAMPLED:
LOCATION 1 150 + 00 1500 RT DATE RECIEVED:
INTERVAL1 131.6 - 134.7 DATE REPORTED:
RAW COAL SIZE FRACTION: 8 x 28
WT.% ASH% RTU.: ANALYSTS
1.90 11.90 67.77 - 100.00 _ 16.53 1.41 11.90 67.77 _
REMARKS:

LEXCO TESTING LTD. coal washability analysis
COAL FIELD: Quinsam LAB NO.1 1069
HOLE NO.: L No. 1 Seam DATE SAMPLED:
LOCATION 1 150 + 00 500 RT DATE RECIEVED:
INTERVAL: 174.0 - 186.0 DATE REPORTED:
RAW COAL SIZE FRACTION: i I/4"
WT.% ASH% RTlJ.~ ANALYST3
1.90 15.20 74.60

LEXCO TESTING LTQ. coal washability analysis
COAL FIELD: Quinsam
HOLE NO.: 2 No. 1 Seam
LOCATION 1 7 7 ” 1~ “cl 500 RT
INTERVAL’ i/4.0 - XG. 0
RAW COAL SIZE FRACTION: k" x 8 mesh
WT.% ASH% BTU.:
LAB NO.1 1069
DATE SAMPLED 3
DATE RECIEVED:
DATE REPORTED:
ANALYST:
1.90 1.90 1.90 / 50.59 --- ---- 85.20 10.43 .17 116.70 72;27 1 .OO
REMARKS’

LEXCO TESTING LTD. coal washability a.nalysis
COAL FIELD1 Ouinsam LAB NO.: 1069
HOLE NO.: 7 I-_ SP DATE SAMPLED:
LOCATION 1 150 + 00 500 RT DATE RECIEVED:
INTERVAL1 174.0 - 186.0 DATE REPORTED:
RAW COAL SIZE FRACTIONI 8 x 28
WT.% ASH% R-KU.1 ANALYST1
REMARKS:

LEXCO TESTING LTD. coal washability zmalysis
COAL FIELD: Quinsam LAB NO.1 1069
HOLE NO.: 2 No. 1 SPxn DATE SAMPLED: LOCATION 1 150 + 00 500 RT DATE RECIEVED:
INTERVAL: 174.0 - 186.0 DATE REPORTED: RAW COAL SIZE FRACTIONS 28 x 100
WT.% ASH% B.TU.t ANALYST 7
1.90 1.90 3.10 45.00 --- ----- 77.10 10.69 26.00 68.72
1.90 g2.90 71.93 --- ----- 100.00 24.72 22.90 71.93
REMARKS’

LEXCO TESTING LTD. coal washability a.nalysis
COAL FIELD: Quinsam LAB NO.1 1071
HOLE NO.1 3 No. 1 Seam DATE SAMPLED i
LOCATION1 ,,n I nn Inn” TT DATE RECIEVED:
INTERVAL1 113.1 - 123.3 DATE REPORTED:
RAW COAL SIZE FRACTION1 + ”
WT.% ASH% B.TU.1 ANALYST I
I.55 1.60 2.4 24.84 .12 9187 91.10 7.48 14.50 34.78
1.60 1.70 3.50 26.830.12 8500 94.60 8.19 8.90 42.6V
1.70 1.80 1.60 40.730.10 6500 96.20 a.73 5.40 52.97
- 1.80 1.90 .80 44.10 5,676 97.00 9.02 3.80 58.12
1.90 3.00 61.86 - - 100.00 10.61 3.00 61.86
REMARKS:

LEXCO TESTING LTD. coal washability a.nalysis
COAL FIELD: Ouinsam LAB NO.: 1071
VOLE NO.: 3 No. 1 Seam DATE SAMPLED:
LOCATION1 110 + 00 1000 LT DATE RECIEVED:
INTERVAL: 113.1 - 123.3 DATE REPORTED:
RAW COAL SIZE FRACTIONI ?’ x s mesh
WT.% ASH% BTU.: ANALYST:
I SPECIFIC GRAVITY I ELEMENTARY
I SINK I FLOAT 1 wt. 1 wt % 1 ASH%1 S% Ilwlb.
1 1.30 1 137.60 1 3.2110.24 b3673
I.30 1.35 37.60 6.42 0.30 13304
1.35 1.40 9.00 lo.56 0.28 12321
1.40 1 1.45 3.50 16.72 0.28 11132 I
1.45 1.50 2.3 121.53 0.22 10246
I I 1.5” 1.35
I.55 1.60 I .5 24.“4/0.25 9020
1.60 1.70 ,1.60 36.70 0.21 7792
I 1.70 1 1.60 1 Il.00 I38.0010.28 / 6509 95.60 1 7.67 1 .27 1
1 I.80 I 1.90
1.90 .90 53.20 - -
CUMULATIVE FLOAT
wt. % 1 ASH?4. 1 S?‘o 1 Btu./lb.
37.60 3.21 .24
75.20 4.82 .27
84.20 1 5.43 1 .27 /
si-a: 91.57 / 6,58 / .27 /
CUMULATIVE SINK
wt. ?k ASH% S% Btu./lb.
100.00 9.48 .26
62.40 13.26 .27
24.80 23.62 .23
15.80 31.06 .20
.18
.i8
10.00 38.27 .l?
7.00 44.45 .14
5.40 46.74 .12
4.40 48.73 .08
2.90 53.20 0.00

LEXCO TESTING LTD. coal washability a.nalysis
COAL FIELD: Quinsam
HOLE NO.: 3 No. 1 Seam
LOCATION 1 110 + 00 1000 LT
INTERVAL’
RAW COAL SIZE FRACTION: a x 2s
WT.% ASH% BTU.:
LAB NO.: 1071
DATE SAMPLED:
DATE RECIEVED:
DATE REPORTED:
ANALYST 1
1.90 1.90 112.0 41.85N.S. N.S. 95.70 6.70 5.50 55.92
1.90 - - 4.30 59.85 100.00 8.99 4.30 59.85
REMARKS:

LEXCO TESTING LTD. coal washability analysis
COAL FIELD: Ouinsam LAB NO.: 1074
HOLE NO.2 4 No. 1 Seam DATE SAMPLED:
LOCATION 1 120 + 00 500 LT DATE RECIEVED:
INTERVAL’ 173.6 - 185.4 DATE REPORTED:
RAW COAL SIZE FRACTION1 + 112"
WT.% ASH % ET:U.I ANALYST;
I.80 1.90 .80 58.79 - - 98.50 10.64 2.30 59.55
1.90 1.50 59.96 - - 100.00 11.38 1.50 59.96
REMARKS:

LEXCO TESTING LTD. coal washability analysis
COAL FIELD: QUINsAM LAB NO.1 1074
HOLE NO.1 ~No. 4 No. 1 Seam DATE SAMPLED s
LOCATION, I:?” + OfI 500 LT DATE RECIEVED:
INTERVAL: 173.6 - 185.4 DATE REPORTED:
RAW COAL SIZE FRACTION: % x 28 .-
WT.% ASH% RTU.1 ANALYST 1
1.90 67.06 - - 100.00 10.36
REMARKS'

LEXCO TESTING LTD. coal washability a.nalysis
COAL FIELD: OUINSAM LAB NO.: 1074
HOLE NO.: No. 4 No. 1 ‘earn DATE SAMPLED z
LOCATION 8 120 + 00 500 LT DATE RECIEVED:
INTERVAL: 173.6 - 185.4 DATE REPORTED:
RAW COAL SIZE FRACTIONI 28 x loo
WT.% ASH % R-KU.1 ANALYST1
REMARKS:

LExCO TESTING LTD. coal washability a.nalysis
COAL FIELD: (luinsam LAB NO.1 1072
HOLE NO.: 5 SP wn 1 DATE SAMPLED: LOCATION 1 100 + on 1000 LT DATE RECIEVED:
INTERVAL1 187.3 - 198.0 DATE REPORTED:
RAW COAL SIZE FRACTION: + 1’2”
WT.% ASH% RTU.1 ANALYST:
1.90 3.80 67.55--- --- 100.00 14.66 3.80 67.55
REMARKS:

LEXCO TESTING LTD. coal washability a.nalysis
COAL FIELD: Quinsam LAB NO.: 1072
HOLE NO.: 5 Seam No. 1 DATE SAMPLED:
LOCATION 1 1.00 + 00 1000 LT DATE RECIEVED:
INTERVAL’ 187.3 - 198.0 DATE REPORTED:
RAW COAL SIZE FRACTION: ‘/,” x 28 mesh
WT.% ASH% B.T u. ’ ANALYST;
1.35 1.40 15.20 9.98 0.24 12,61L 82.40 5.42 32.80 27.26
1.40 1.45 3.90 17.6~ ppp----
0.23 ll,lji 86.30 5.98 17.60 42.18
1.45 I.50 1.5 20.34 0.28 10,385 87.80 6.22
1.50 1.55 1.5 25.94 0.33 9,634 89.21 b.>>
I.55 1.60 1.3 28..65 0.20 8,810 90.60 6.87 12.20 52.70
1.60 1.70 1.40 37.KO.13 7,829 92.00 7.33 9.40 60.30
1.70 1.80 1.20 46.1:--- 6,485 93.20 1.83 8.00 64.35
I.80 1.90 1.50 52.59--- --- 94.70 8.54 6.80 67.57
1.90 5.30 71.8;--- --- 100.00 11.89 5.30 71.81
REMARKS:

IEXCO TESTING LTD. coal washability a,nalysis
COAL FIELD: Quinsam LAB NO.: 1072
HOLE NO.: 5 Seam No, 1 DATE SAMPLED s LOCATION 1 100 + 00 I oon T.T DATE RECIEVED: INTERVAL! 187.3 - 198.0 DATE REPORTED: RAW COAL SIZE FRACTION: 28 x 100
WT.% ASH % BTU.: ANALYST:
1.90 100.00 19.66
REMARKS:

LEXCO TESTING LTD. coal washability a.nalysis
COAL FIELD: Q”i*sam LAB NO.1 107;
HOLE NO.: 6 No. 1 Seam DATE SAMPLED s
LOCATION t 85 + 00 1000 LT DATE RECIEVED:
INTERVAL1 255.3 . 264.0 DATE REPORTED:
RAW COAL SIZE FRACTION; + 112"
WT.% ASH% ETU.: ANALYST 1
I.55 1.60 3.6 21.53 .li 9.179 90.30 10.19 .26 15.10 36.90 .lO
1.60 1.70 3.00 30.81 .I6 7,990 93.30 10.86 .25 9.70 45.74 .07
1.70 1.60 3.10 39.75 .I5 6,929 96.40 11.79 -25 6.70 52.42 ---
1.60 1.90 1.30 47.31--- 5,462 97.70 12.26 .24 3.60 63.33 ---
1.90 2.30 72.38 --- --- 100.00 13.64 2.30 72.38
REMARKS:

LEXCO TESTING LTD. coal washability a.nalysis
COAL FIELD: Quinsam LAB NO.: 1073
HOLE NO.2 6 No. 1 Seam DATE SAMPLED s
LOCATION’ 95 +‘Dil 1nnn T,T DATE RECIEVED:
INTERVAL1 255.3 - 264.0 DATE REPORTED:
RAW COAL SIZE FRACTION: 2 x 28
WT.% ASH% B.1:U.t ANALYST 1
1.50 1.55 2.6 22.oc0.21 9,603 88.50 6.22
I.55 1.60 1.4 23.970.21 8,907 90.40 6.46 13.60 46.67
1.60 1.70 1.90 29.55 0.2” 7,861 92.30 6.93 9.60 56.67
1.70 1.80 1.40 42.40 0.16 6,562 93.70 7.46 7.70 63.36
I.90 1.90 1.40 48.61 --- 4,765 ~95.10 8.07 6.30 68.02
1.90 4.90 72.56 --- --- 100.00 11.28 4.90 73.56
REMARKS:

LEXCO TESTING LTD.
COAL FIELD: quinsam
HOLE NO.1 6 No. 1 Seam
LOCATION 1 85 + 00 1000 LT
INTERVAL’ 255.3 - 264.0
RAW COAL SIZE FRACTlONt 28 x 100
WT.% ASH% B.TU.1
coal washability malysis
LAB NO.: 1073
DATE SAMPLED:
DATE RECIEVED:
DATE REPORTED:
ANALYST1 >. i I
CUMULATIVE SINK
I I I
REMARKS’

LEXCO TESTING LTD. coal washability a.nalysis
COAL FIELD: ~UIi<SAbT LAB NO.: X
HOLE NO.1 No. 8 No. 3 sea1 DATE SAMPLED:
LOCATION 1 60 + 00 1000 LT DATE RECIEVED:
INTERVAL! 38.6 - 56.3 DATE REPORTED:
RAW COAL SIZE FRACTION: + i$’
WT.% ASH% BTU.: ANALYST1
1.80 1.90 1 1.40 58.71 8.92; ---- 56.10 18.08 2.73 1 145.30 1 68.13 ( 8.74
1.90 43.90 68.43 --- ---- 100.00 40.18 5.45 43.90 68.43 8.92
REMARKS’

LEXCO TESWNG LTD. coal washability analysis
COAL FIELD: QUINSAM LAB NO.3 X
)-lOLE NO.: No. 8 No. 3 Seam DATE SAMPLED:
LOCATION1 60 + UO 1000LT DATE RECIEVED:
INTERVAL* 38.6 - 56.3 DATE REPORTED:
RAW COAL SIZE FRACTION: ?$' x 28 mesh
WT.% ASH% B.-KU.: ANALYST:
1.90 1.90 1.00 44.38 8.71 7,249192.20 11.02 3.51 I 8.80 1 60.84 1 .99 1 1.90 7.80 62.95 ---- ---- 00.00 15.07 3.23 7.80 62.95 0.00 I
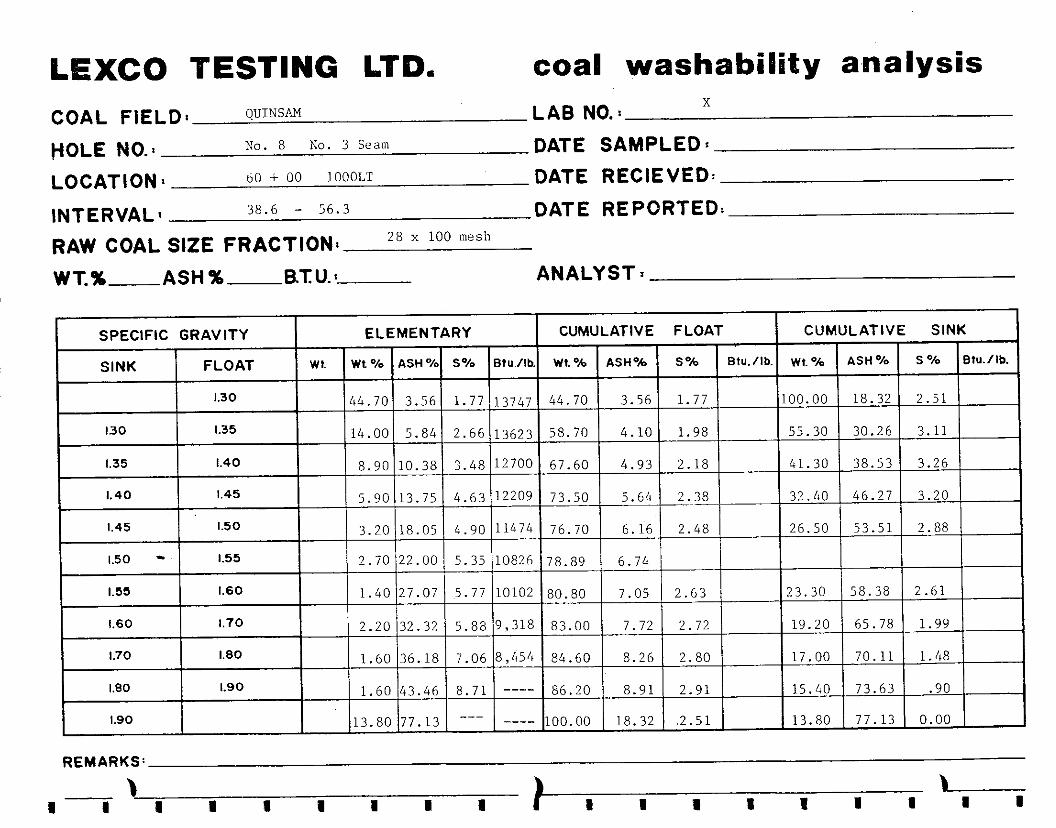
LExCQ TESTING LTD. coal washability a,nalysis X
COAL FIELD: QUINSAM LAB NO.:
HOLE NO.: No. 8 No. 3 Seam DATE SAMPLED3
LOCATION 1 tie i 00 1OOOLT DATE RECIEVED:
INTERVAL: 38.6 - 56.3 DATE REPORTED:
RAW COAL SIZE FRACTIONI 28 x 100 mesh
WT.% ASH% RTU.I ANALYST;
1.50 - 1.55 2.70 22.00 5.35 10826 78.89 6.74
I.55 1.60 1.40 27.07 5.77 10102 80.80 7.05 2.63 23.30 58.38 2.61
1.60 1.70 2.20 32.32 5.88 9,318 83.00 7.72 2.72 19.20 65.78 1.99
1.70 1.60 1.60 36.18 7.06 8,454 84.60 8.26 2.80 17.00 70.11 1.48
I.90 1.90 1.60 43.46 8.71 ---- 86.20 8.91 2.91 15.40 73.63 .90
1.90 13.80 77.13 --- ---- 100.00 18.32 .2.51 13.80 17.13 0.00
REMARKS’

LEXCO TESTING LTD. coal washability analysis
COAL FIELD: QJINSAM LAB NO.: 1075
HOLE NO.: No. 9 NO. 1 Seam DATE SAMPLED:
LOCATION 1 50 + 00 1500 LT DATE RECIEVED:
INTERVAL1 115.8 - 121.1 DATE REPORTED:
RAW COAL SIZE FRACTION: k” x 28 Mesh
WT.% ASH% RTlJ.1 ANALYST:
ELEMENTARY
REMARKS’

LExCO TESTING LTD. coal washability a.nalysis COAL FIELD: QUINSAM LAB NO.: 1075
HOLE NO.: No. 9 No . 1 Seam DATE §AMPLED z LOCATION 1 50 + 00 1500 LT DATE RECIEVED:
INTERVAL1 115.8 - 121.1 DATE REPORTED:
RAW COAL SIZE FRACTIONI 28 x 100 Mesh
WT.% ASH% RTU.I ANALYST 1
1.50 1.55 3.5 21.90 3.48 10836 79.29 6.14
1.55 1.60 1.6 26.60 3.37 9,999 81.60 6.49 1.92 23.50 48.41 1.73
1.60 1.70 2.50 31.51 3.22 8,969 84.10 7.23 1.97 18.40 55.36 1.25
1.70 I.60 2.20 38.00 3.02 7,497 86.30 8.02 2.00 15.9!1 59.11 .92
I.60 1.90 1.60 44.30 N.S. N.S. 87.90 8.68 2.02 13.70 62.49 .55
1.90 12.10 64.90 --- --- ,lOO.OO 15.48 1.80 12.10 64.90 .22
REMARKS’

LExCO TESTING LTD. coal washability analysis
COAL FIELD: QUINSAM LAB NO.1 1077
VOLE NO.1 No. 9 NO. 1 Seam DATE SAMPLED:
LOCATION 1 ;3 + 00 1500 LT DATE RECIEVED:
INTERVAL1 i22.0 - 125.7 DATE REPORTED:
RAW COAL SIZE FRACTION: + ‘i”
WT.% ASH % RTU.1 ANALYST 1
1.90 24.20 73.68 ---
REMARKS:

coal washability a.nalysis
COAL FIELD: QUINSAM LAB NO.: 1 nun
HOLE NOat No. 10 No. 2 Seam DATE SAMPLED s
LOCATION 1 40 + 00 1500 LT DATE RECIEVED:
INTERVAL1 149.2 - 152.8 DATE REPORTED:
RAW COAL SIZE FRACTIONI + y
WT.% ASH % RT.U.1 ANALYST 1
ELEMENTARY
1.35 1.40 14.3 11.80 4.65 12762 55.4 8.42
1.40 1.45 0.0 0.0 0.0 0.0 55.4
1.45 1.50 0.0 0.0 0.0 0.0. 55.4
1.50 i.55 2.8 25.10 6.27 10580 I 58.2
1.55 1.60 0.0 0.0 0.0 0.0 58.2
. 1.60 1.70 0.0 0.0 0.0 0.0 58.2
1.70 I.80 0.0 0.0 0.0 0.0 58.2
I.90 1.90 0.0 0.0 0.0 0.0 58.2
1.90 41.5 63.95 100.00
REMARKS’

LEXCO TESTING LTD. coal washability a,nalysis
COAL FIELD: QUINSAM
HOLE NO.: No. 10 No. 2 Seam
LOCATION’ 40 + 00 1500 LT
INTERVAL: 149.2 - 152.S
RAW COAL SIZE FRACTiON: k" x 28 mesh
WT.% ASH% B.TU.:
LAB NO.1 1080
DATE SAMPLED:
DATE RECIEVED:
DATE REPORTED:
ANALYST 1
.90143.451 --- 17,6881 92.60 / 8.87 4.09 1
1.90 7.40 57.16 --- ----- 100.00 12.45 3.78 7.40 57.16 0.00
REMARKS:

LEXCO TESTING LTQ. coal washability a.nalysis
COAL FIELD: QUINSAY
HOLE NO.: No. 10 No. 2 Seam
LOCATION’ /.i, + I,0 1500 LT
INTERVAL’ 149.2 - 152.8
RAW COAL SIZE FRACTIONS 28 x 100 mesh
WT.% ASH% B.TU.I
LAB NO.1 1080
DATE SAMPLED:
DATE RECIEVED:
DATE REPORTED:
ANALYST :
I 1.35 1 1.40
SPECIFIC GRAVITY
1.40 1 1.45
1.45 1.50
1.50 1.35
I.55 1.60
1.60 1.70
I.80 1.90
1.90
I 1.70 ( 1.80 I I 1.80139.56
1.80 42.14 7.60 57.38 0.00
5.80 62.11 5,80 62.11 0.00
REMARKS’
1 1 \ a a a a a I I a a a a a a a a a a a
I ELEMENTARY CUMULATIVE FLOAT
S% Btu./lb. wt. % ASH?& S% Btu./lb.
1.90 13721 40.60 2.70 1.90
2.75 13340 62.70 3.66 2.20
I l10.101 9.89 3.30 12696 72.80 4.52 2.35
5.40 14.08 3.62 12074 78.20 5. la 2.44 __-.-
3.30 18.67 4.22 11350 81.50 5.73 2.51
3.3 '22.94 4.64 lo/l> 84.69 6.4i /
2.5 27.01 4.95 10041 87.30 6.99 2.65
3.30 33.36 4.95 9,005 90.60 7.95 2.74
6.26 N.S. 92.40 8.57 2.81
94.20 9.21 2.75
--- ---- ioo.00 12.28 2.59
27.20 33.02 1 3.23 ) I I I I
21.80 37.72 3.14 /
18.50 41.11 2.95
12.70 48.61 2.17
9.40 53,.97 1.20

LEXCO TESTING LTD. coal washability a.nalysis
COAL FIELD: Q”INsAM LAB NO.: 1078
HOLE NO.: No. 11 No. 1 Seam DATE SAMPLED c
LOCATION 1 1701-00 1000 RT DATE RECIEVED:
INTERVAL’ 146.0 - 148.5 DATE REPORTED:
RAW COAL SIZE FRACTIONt +g -
WT.% ASH% R-KU.1 ANALYST;
SPECIFIC GRAVITY
SINK I FLOAT
ELEMENTARY
Wt. Wt % ASH % 5% Btu./lb,
I 120.501 4.34 I 0.22113570
130 1.35 9.80 6.50 0.21 13041
1.35 1.40 15.40 11.84 0.20 12482
1.40 1.45 7.00 15.27 0.19 1121h
1.45 1.50 4.90 20.33 0.23 10511
1.50
I I.55 ) 1.60 1 / 2.5 j30.2"( 0.13(9044
1.60 1.70 8.10 37.00 0.16 7872
1.70 I.90 5.60 46.19 0.13 6372
I.80 1.90 6.20 54.40 - I-
I 1.90 12.60 67.21 - -
CUMULATIVE FLOAT I CUMULATIVE SINK I
wt. % ASH% S% Btu./lb. wt. % ASH% S % Btu./lb.
20.50 4.34 100.00 25.31
30.30 5.04 79.50 30.72
45.70 7.33 69.70 34.12
52.70 8.39 54.30 40.44
57.60 9.40 I 47.30 I 44.17 I I
I 63.09 i 11.30
I I I I I I
67.50 11.68 42.40 46.92
I I 75.60 14.39 I I 32.50 53.62 I 81.20 16.59 24.40 59.13
87.40 19.27 18.80 62.99
100.00 25.31 12.60 67.21
REMARKS’
b I-----K 8 8 8 8 8 8 8 a a 8 8 8 a

LEXCO TESTING LTD. coal washability analysis
COAL FIELD: OUINSAM LAB NO.1 1078
HOLE NO.2 No. 11 Iio.~ 1 seam DATE SAMPLED:
LOCATION 1 170 + 00 1000 RT DATE RECIEVED:
INTERVAL’ 146.0 - 148.5 DATE REPORTED:
RAW COAL SIZE FRACTION: k x 28
WT.% ASH% R-KU.: ANALYSTa
I SPECIFIC GRAVITY I ELEMENTARY
SINK FLOAT Wt. wt % ASH% S% stu./ll
1.30 42.40 3.46 0.22 13637
1.30 1.35 13.20 6.08 0.21 13193
I 1.35 ( 1.40 I 114.30110.1010.20 h2391
1.40 I 1.45 6.40 17.17 0.19 11104
1.45 I.50 3.40 22.19 0.19 1027'
I 1.60 1 1.70 1 / 3.10 138.08 IO.15 17536 87.801 9.35 ( /
I 1.70 1 1.60 1 1 3.20~45.01~0.11 16292
I.60 1.90 3.40 53.21 - -
1.90 5.60 69.07 - -
CUMULATIVE FLOAT
69.90 I I 5.31
84.70 8.30

LExCO TESTING LTD. coal washability a.nalysis
COAL FIELD: QUINSAM LAB NO.1 1078
HOLE NO.: No. 11 No. 1 Seam DATE SAMPLED:
LOCATION 1 170 + nn 1 WORT DATE RECIEVED:
INTERVAL’ 146.0 - 148.5 DATE REPORTED:
RAW COAL SIZE FRACTION: 28 x 100
WT.% ASH% BTU.: ANALYST:
I.90 1.90 2.20 48.41 - 6,272 89.70 8.17 12.50 71.35
1.90 10.30 76.25 - - 100.00 15.18 10.30 76.25
REMARKS:

s3m
n3
wIT
I3vH
svA


3
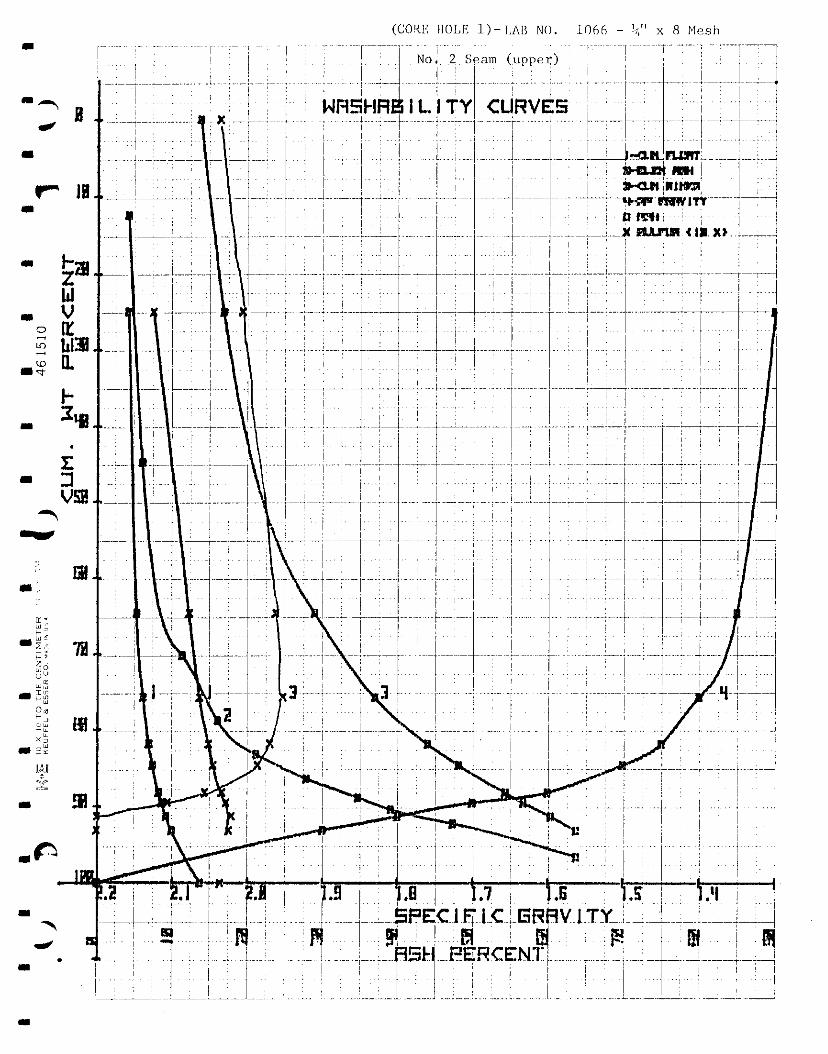
: .I~,~ ..,.....,. j.. .:.
i / i ! ~ i /
i ,


I

WRSHRGILITY CURVES ;r
11 ! , !
L
F
.
/
r
*
i
I ..,


(C~RJ: HOLE 2)- LAB NO. 1069 - tY'
, 1


I
m w
0
10
$34 . 5 VSB
a
.

I


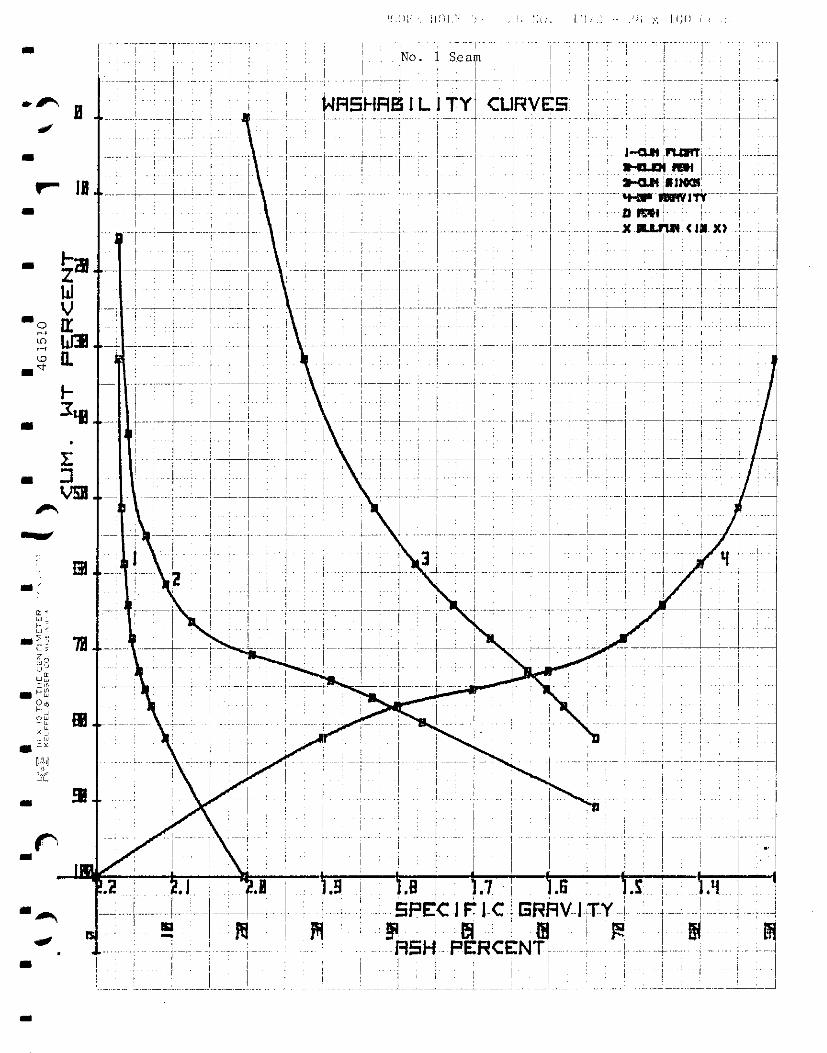


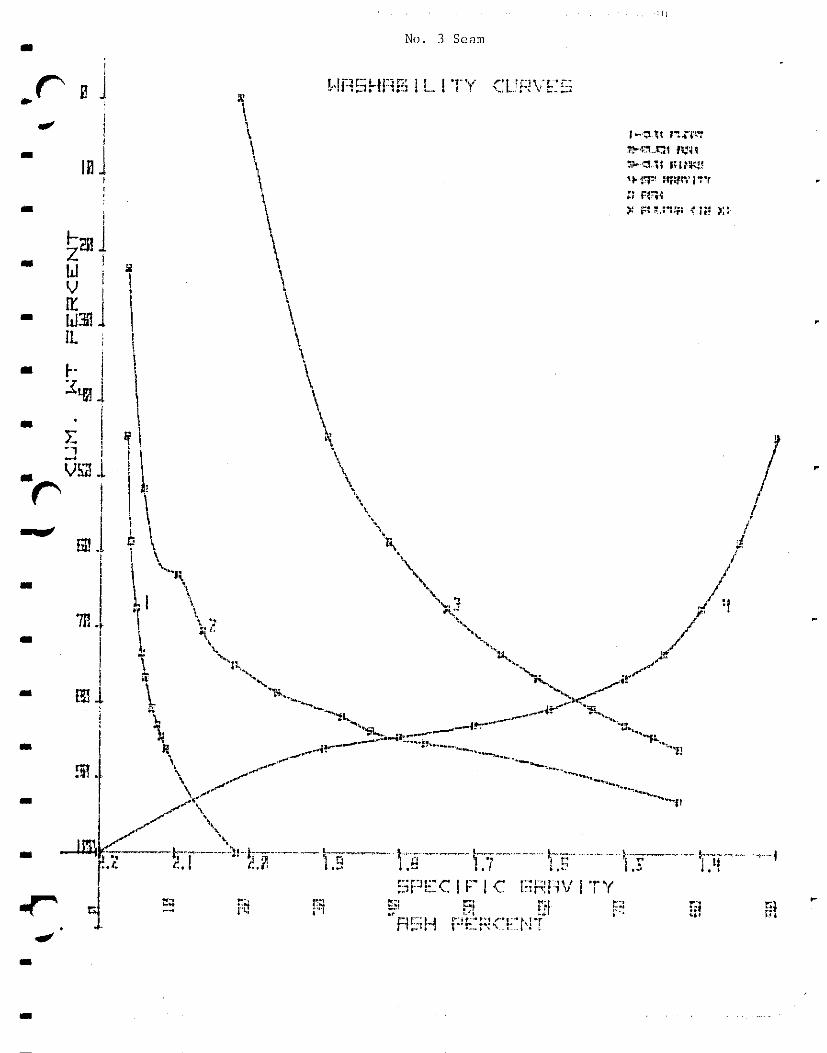


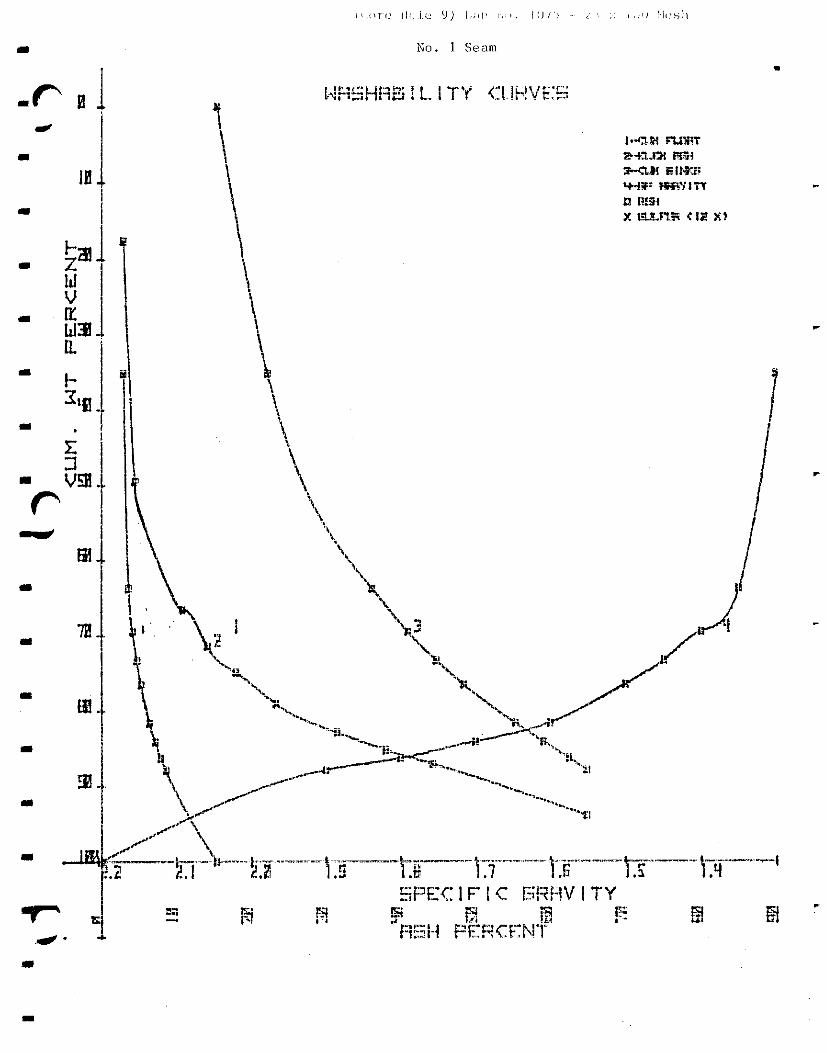


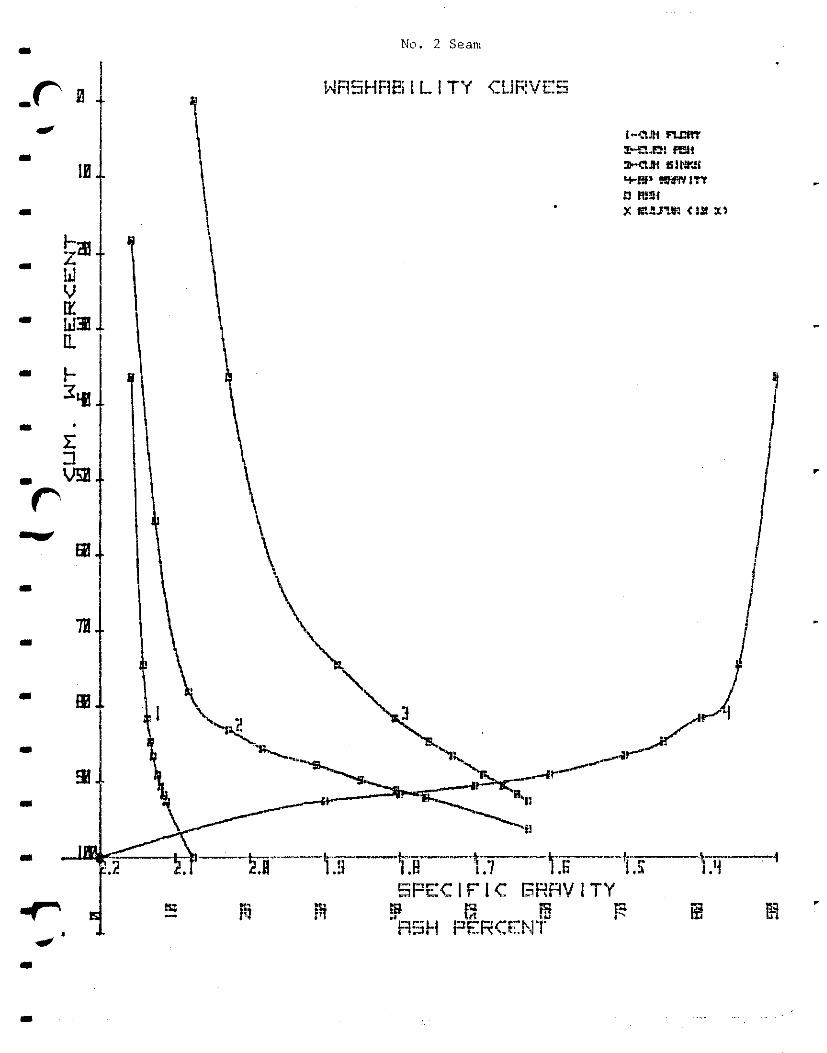


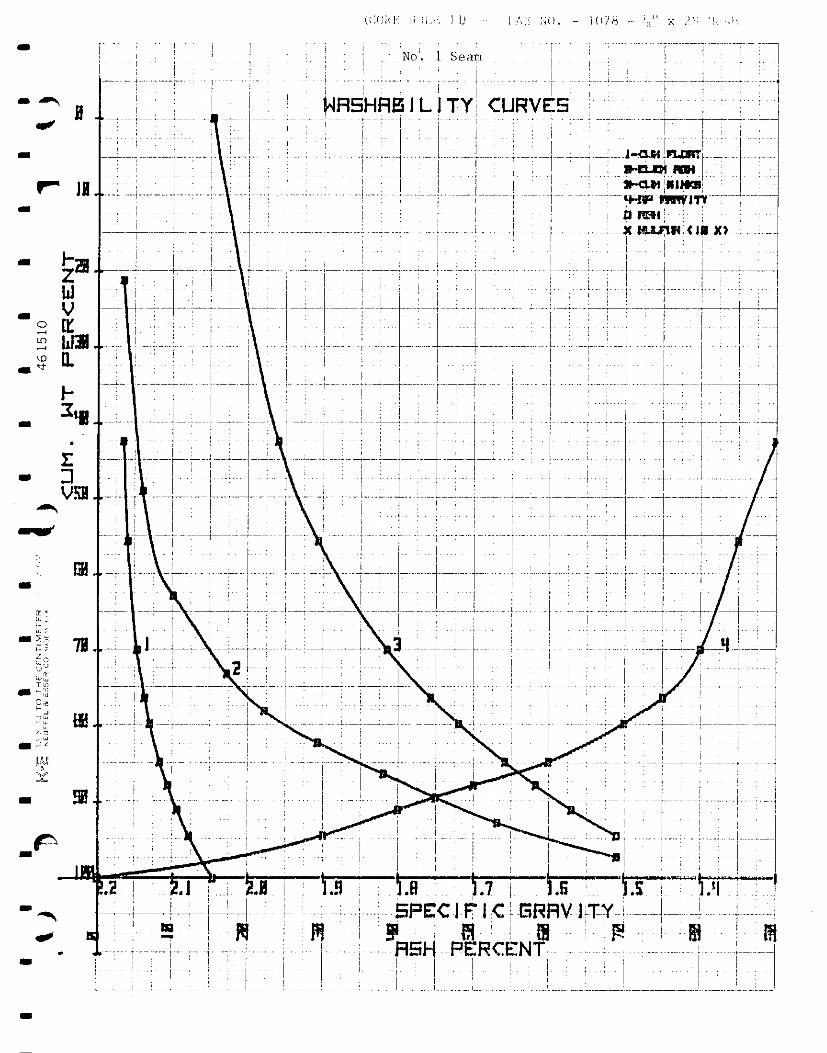


APPENDIX III
QUINSAM PHASE I
Coal Quality Analytical Data
i Proximate Analysis ii Washability Test Results
iii Washability Curves
CX~. ~YlFJ5ljt6M 7714lg
GEOLOGICAL BRANCH ASSESSMENT Ra;PORT

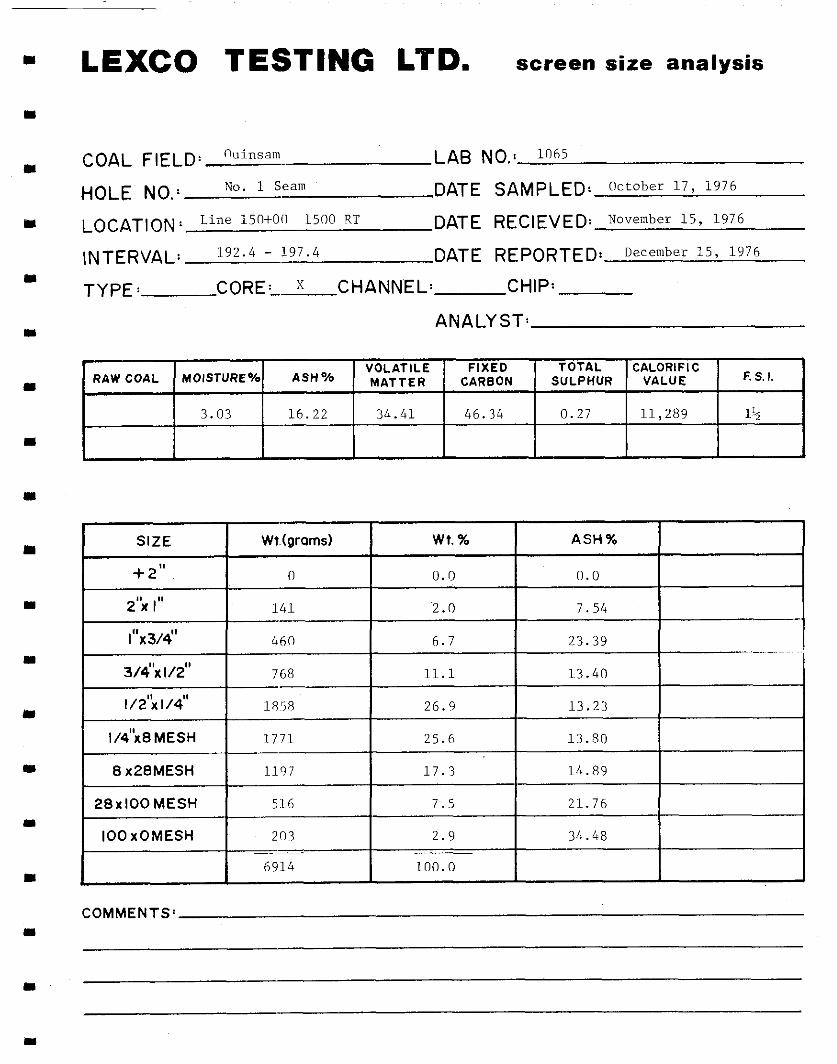
LEXCO TESTING LTD. screen size analysis
COAL FIELD: “llinsam- LAB NO.1 lo65
HOLE NO.: No. 1 Seam DATE SAMPLED: October 17, 1976
LOCATION : Line 151)+Ofl 1500 RT DATE RECIEVED: November 15, 1976
INTERVAL: 192.4 - 197.4 DATE REPORTED: December 15, 1976
TYPE: CORE: x CHANNEL: CHIP:
ANALYST:
FIXED TOTAL CALORIFIC RAW COAL MOISTURE% ASH%
VOLATILE MATTER CARBON SULPHUR VALUE F. S. I.
3.03 16.22 34.41 46.34 0.27 11,289 14
I SIZE Wt.lgr0m.s) wt. % ASH% 1
I + 2" I 2'; I" 141 '2 . 0 7.54
l”X3d 46n 6.7 23.39
3dxV2" 768 11.1 13.40
1/2';1/4"
I/4”x8MESH
8 x28MESt-l
28x100 MESH
IOOxOMESH
COMMENTSx
J
1858 26.9 13.23
1771 25.6 13.80
1197 17.3 14.89
5 :I, 6 7.5 21.76
203 2.9 34.48
6 9 :I, 4 100.0

2
1
314
l/2
L/4
9
28
LOO
LOO
EXCO TESTING LTD. screen size analysis
COAL FIELD: Quinsam LAB N0.t 1066
HOLE NO.: 1 (Seam No. 2) DATE SAMPLED: Oct. 17176
LOCATION * 150 .i- 00 1500 RT DATE RECIEVED: Dec. l/76
INTERVAL: 131.6 - 134.8 DATE REPORTED: Dec. 15176
TYPE: CORE:- x CHANNEL: CHIP:
ANALYST:
MOISTURE% ASH% VOLATILE FIXED TOTAL CALORIFIC
RAW COAL MATTER CARBON SULPHUR VALUE F.S.1.
2.65 14.78 38.49 44.08 2.52 11,874 1%
8 x28MESH 949 21.5 15.20
28x100 MESH 314 7.0 21.43
IOOxOMESH 100 2.3 35.47
4471 100.0
COMMENTS’

LEXCO TESTING LTD. screen size analysis
COAL FIELD: Quinsam LAB NO.1 1067
HOLE NO.1 No. 1 (Seam No. 2) DATE SAMPLED: Oct. 17176
LOCATION : 150 + 00 1500RT DATE RECIEVED: Dec. l/76
INTERVAL: 139.1 - 140.2 DATE REPORTED: De=. 15176
TYPE: CORE:- x CHANNEL: CHIP:
ANALYST:
MOISTURE% ASH% VOLATILE FIXED TOTAL CALORIFIC
RAW COAL MATTER CARBON SULPHUR VALUE F.S.I.
2.40 18.97 37.88 40.75 4 .4 11.270 1 +
28.36
40.30
COMMENTS’

- LEXCO TESTING LTD. screen size analysis
. COAL FIELD: ““lNSAM LAB NO.1 Iott9
HOLE NO.: 2 No. 1 hm DATE SAMPLED: October 19, 1976
I Lo~~~lo~: Line 15Of00 500 RT DATE RECIEVED: November 15, 1976
INTER,,&, 174.0 - 186.0 DATE REPORTED* December 15, 1976
I TYPE: CORE:- x CHANNEL: CHIP:
ANALYST: I
“OLAT,LE ClYCn I Tntnl lrn,
I RAW COAL MOISTURE% ASH % MATTER
I I I I I I I
TIAC” , “ I . - .L
CARSON 1 SULPHUR ( VALUE “--oR’F’C ) F.S.I. 1
2.59 23.37 32.52 41.52 0.19 10,369 1% I I I I I I I I
- I I I I I I 1
8 x28MESH 4057 19.7 20.83
28xiOOMESH 15:39 7.4 27.05
IOOxOMESH 729 3.5 41.79
20629 100.0
COMMENTS’ I,

LEXCO TESTING LTD. screen size analysis
COAL FIELD: Quinsam LAB NO.1 1070
HOLE NO.: No. 3 (Rider N;,im DATE SAMPLED* Oct. 22/76 1
LOCATION : KLOi-00 1000 LT DATE RECIEVED: Dec. 1/76
INTERVAL: 108.7 - 110.4 DATE REPORTED! Dec. 15’76
TYPE: CORE:- x CHANNEL: CHIP:
ANALYST:
VOLATILE FIXED TOTAL CALORIFIC 1 RAW COAL MOISTURE% ASH% MATTER CARBON SULPHUR VALUE F.S.I.
2.45 .L4C58 38.33 44.64 2.54 11,999 1 ii
SIZE Wt.(grams)
-I- 2" 0
2'; II' 23
wt. 96 ASH%
0.0
0.8 45.32
l"X3A' 8,5 3.0 25.92 I I
8 x28MESH

LEXCO TESTING LTD. screen size analysis
COAL FIELD: 01!T'J?AM LAB NO.: 1071
HOLE NO.: 3 No. _LSeam DATE SAMPLED: October 22, 1976
LOCATION: Line llO+OO 100 RT DATE RECIEVED: November 15, 1976
INTERVAL: 113.1 - 123.3 DATE REPORTED: December 15, 1976
TYPE: CORE:- x CHANNEL: CHIP:
ANALYST:
TOTAL CALORIFI C SULPHUR VALUE F. S. I. I
VOLA-, ILL rl RAW COAL MOISTURE% ASH% MATTER CAI
2.82 9.88 37.30 50.00 0.20 12,626 1%
I I I I I I I I 1
COMMENTS’

- LEXCO TESTING LTD. screen size analysis
COAL FIELD: Quinsam LAB NO.1 1085
HOLE NO.: No. 4 (No. 1 Rider) DATE SAMPLED1 Nov. 4176
LOCATION : 120 + 00 500 LT DATE RECIEVED: Dec. 1176
INTERVAL: 165.0 - 167.1 DATE REPORTED: Dec. 15/76
TYPE: CORE:- x CHANNEL: CHIP:
ANALYST:
VOLATILE FIXED TOTAL CALORIFI C RAW COAL MOISTURE% ASH% MATTER CARBON SULPHUR VALUE F.S.I.
2.54 1~1.54 38.87 47.05 3.47 12,232 1
COMMENTS’ I
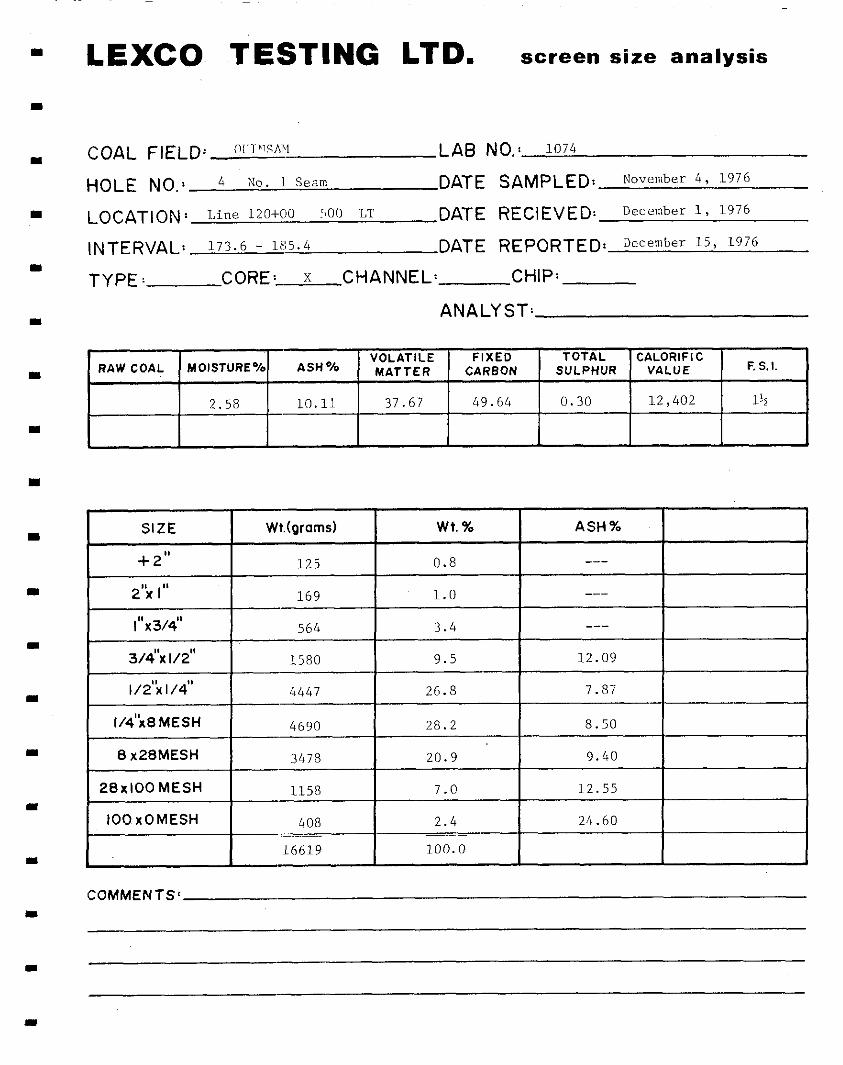
LEXCO TESTING LTD. screen size analysis
COAL FIELD: OIIT”lSAN LAB NO.: 1074
HOLE NO,, 4 No. 1 Seam DATE SAMPLED: November 4, 1976
LOCATlONt Line 12OfCiO 100 LT DATE RECIEVED: December 1, 1976
INTERVAL: 173.6 - 185.4 DATE REPORTED* December 15, 1976
TYPE: CORE:- x CHANNEL: CHIP:
ANALYST:
ASH*h VOLATILE FIXED TOTAL CALORIFIC
RAW COAL MOISTURE% MATTER CARSON SULPHUR VALUE F. S. I.
2.58 10.1.1 37.67 49.64 0.30 12,402 1%
SIZE
+2"
2% I"
l"X3/6'
3A'x l/Z"
1/2';(1/4"
1/4'hMESH
8 x28MESH
28x100 MESH
IOOxOMESH
COMMENTS’
Wt.(prams)
125
169
564
1580
4447
4690
3478
1158
408
16619
wt. 96 ASH%
0.8 ---
1.0 ---
3.4 ---
9.5 12.09
26.8 7.87
28.2 8.50
20.9 9.40
7.0 12.55
2.4 24.60 -- 100.0
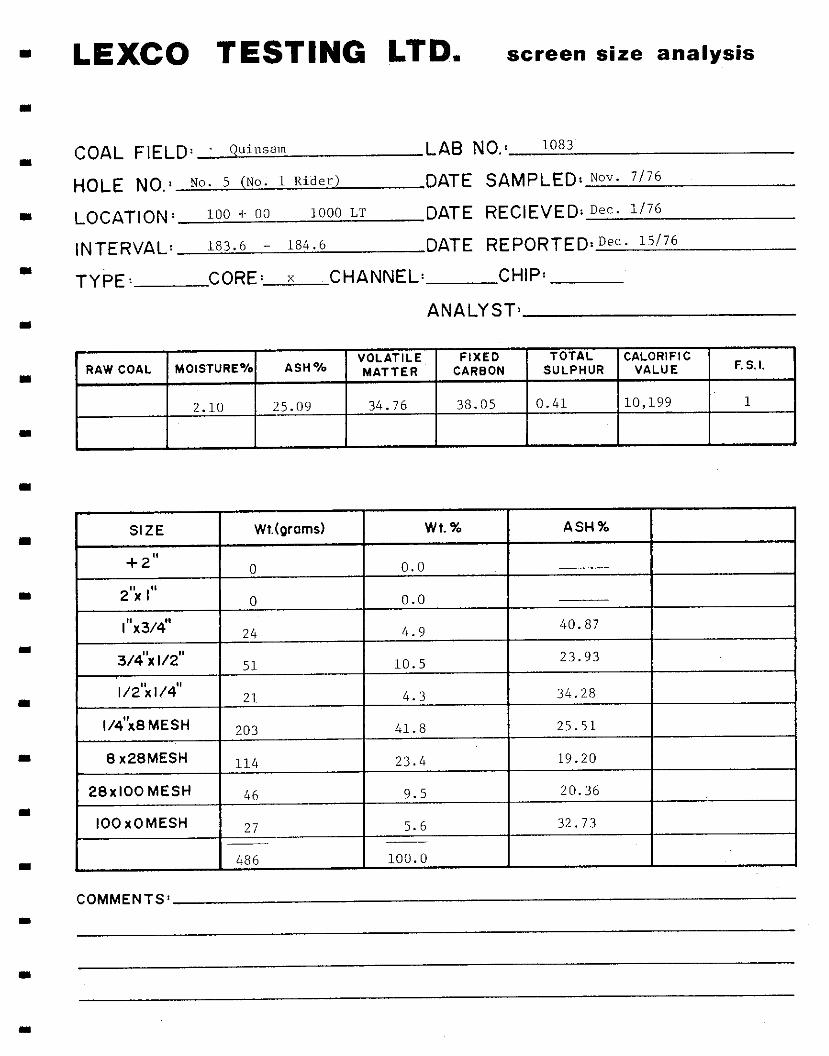
- LEXCO TESTING LTD. screen size analysis
COAL FIELD: Quinsam LAB NO.1 1083 I
HOLE NO.: No. 5 (No. 1 Rider) DATE SAMPLED; Nov. ‘/‘6
I LOCATION : 100 + 00 1000 LT DATE RECIEVED: Dec. 1176
INTERVAL: 183.6 - 184.6 DATE REPORTED: Dec. 15176 I
TYPE: CORE:- x CHANNEL: CHIP:
ANALYST: I
VOLATILE FIXED TOTAL CALORIFIC RAW COAL MOISTURE% ASH%
I MATTER CARBON SULPHUR VALUE F. S. I.
2.10 25.09 34.76 38.05 0.41 10,199 1
I
I 28xlOOMESH
IOOxOMESH
486 100.0 I
COMMENTS’ I

- LEXCO TESTING LTD. screen size analysis
COAL FIELD: ““I>,$: A”, LAB NO.1 1072 I
HOLE NO.: 5 No. 1 Seam DATE SAMPLED: November 7, 1976
I LOCAT[ON: Line 100+70 1000 RT DATE RECIEVED: December 1, 1976
INTERVAL: 187.3 - 198.0 DA-f-E REPORTED3 December 15, 1976
I TYPE: CORE:- X CHANNEL: CHIP:
ANALYST: I
VOLATILE FIXED TOTAL CALORIFIC RAW COAL MOISTURE% ASH % MATTER CARBON SULPHUR VALUE F. S.I.
I
2.73 11,.54 36.40 49.33 0.27 12,105 1:s
I
i/4 x8 MESH
8 x28MESH 2607 19.8 12.26
28x100 MESH 978 7.4 18.90
IOOxOMESH 526 4.0 74.85 -.-
13215 100.0
COMMENTS’

I
P
I
I
I
I
LEXCO TESTING LTD. screen size analysis
COAL FIELD: Qui=~mT LAB NO.1 1082
HOLE NO.: No. 6 ( No. 1 Rider) DATE SAMPLED: *O”. l”j76
LOCATION: 85 + 00 1000 LT DATE RECIEVE-j: Dec. l/76
INTERVAL: 254.0 - 255.6 DATE REPORTED: Dec. 15176
TYPE: CORE:- x CHANNEL: CHIP:
ANALYST:
RAW COAL MOISTURE% ASH % VOLATILE FIXED TOTAL CALORIFIC
MATTER CARBON SULPHUR VALUE F. S. I.
2.09 20. 32 38.21 39.38 2.92 10,903 2
28xlOOMESH 121 8.7
IOOxOMESH 58 4.2 38.28 __-
1393 100.0
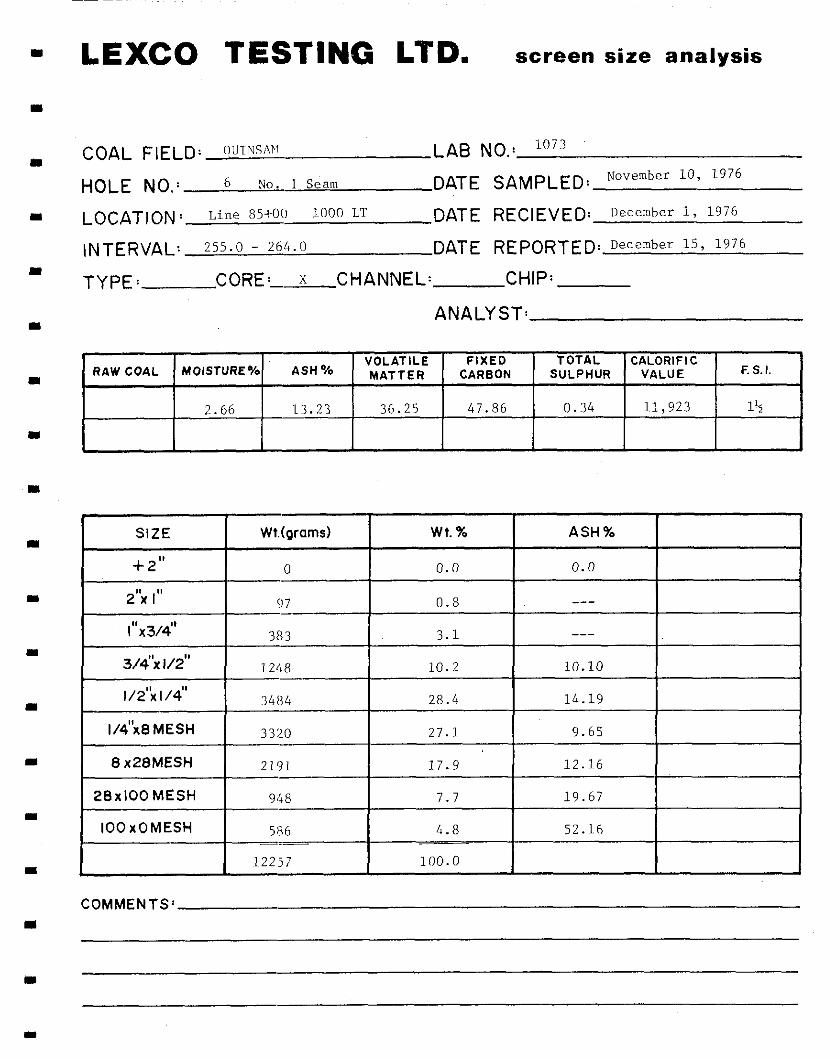
LEXCO TESTING LTD. screen size analysis
COAL FIELD: QLlTNSiiFi LAB NO.1 1”73 HOLE NO.: 6 No. 1 Seam DATE SAMPLED: November 10, 1976
LOCATION1 Line 85+00 1000 LT DATE RECIEVED: December 1, 1976
INTERVAL: 255.0 - 264.0 DATE REPORTED: December 15, 1976
TYPE: CORE:- x CHANNEL: CHIP:
ANALYST:
ASH % VOLATILE FIXED TOTAL CALORIFIC
RAW COAL MOISTURE% MATTER CARBON SULPHUR VALUE F. S. I.
2.66 13.23 36.25 47.86 0.34 11,923 l$
28x100 MESH 948 7.7 19.67
IOOxOMESH 5:s 4.8 52.16 -.- --
12257 100.0
COMMENTS’

- LEXCO TESTING LTD. screen size analysis
COAL FIELD: Quinsm LAB NO.1 1089
HOLE NO.: No. 6 ( No. 1 Seam) DATE SAMPLEDx Nov. 1o’76
LOCATION’ 85 + 00 1000 LT DATE RECIEVED: Dec. 1’76
INTERVAL: 264.5 - 265.4 DATE REPORTEDIDeC. 15’76
TYPE: CORE: x CHANNEL: CHIP:
ANALYST:
VOLATILE FIXED TOTAL CALORIFIC RAW COAL MOISTURE% ASH% MATTER CARBON SULPHUR VALUE F. S. I.
2.43 25.39 31.91 40.27 1.76 9,826 1%
SIZE Wt.(grams)
+ 2" 0
2'; 1" 22
wt. % ASH%
0.0
2.7
I"X3/4" 21 2.6
3/4';l/2'1 90 11.0
1/2';1/4" 206 25.3
l/4%8 MESH 227 27.8
8 x28MESl-l 155 19.0 1
28xl00MESH 58 7.1 I I I
IOOxOMESH 37 4.5 I I I I I
COMMENTS’ I

LEXCO TESTING LTD. screen size analysis
COAL FIELD: Quinsm LAB NO.1 1081
HOLE NO.: No. 8 (Ho. 3 Seam) DATE SAMPLED: No”. 17/76
LOCATION ’ 60 + 00 ,I000 LT DATE RECIEVED: De=. l/J6
INTERVAL: 38.6 - 39.7 DATE REPORTED:Dfc. 15/76
TYPE: CORE:- x CHANNEL: CHIP:
ANALYST:
FIXED TOTAL CALORIFIC RAW COAL MOISTURE% ASH%
VOLATILE MATTER CARBON SULPHUR VALUE F. S. I.
1.76 17.48 38.02 42.74 4.73 11,209 1%
28x100 MESH 196 10.6 20.99
100 x0ME.W 82 4.5 30.54
1836 100.0
COMMENTS2

- LEXCO TE§TING LTD. screen size analysis
COAL FIELD: Quinsam LAB NO.1 1086 I
HOLE NO.: No. 8 ( No. 3 Seam) DATE SAMPLED: Nov. I’/76
I LOCATION’ 60 + 00 1000 LT DATE RECIEVED: Dec. 1176
INTERVAL: 47.9 - 50.0 DATE REPORTED: Dec. 151’6 I
TYPE: CORE: x CHANNEL: CHIP:
ANALYST: I
MOISTURE% ASH% VOLATILE FIXED TOTAL
RAW COAL CALORIFIC
I MATTER CARBON SULPHUR VALUE F. S. I.
2.09 18.73 37.14 42.04 1.91 11,260 2$
I
I
28x100 MESH I
COMMENTS: I

LEXCO TESTING LTD. screen size analysis
COAL FIELD: Quinsam LAB NO.1 1084
HOLE NO.: No. 8 (No. 3 Seam) DATE SAMPLED: No”. 17176
LOCATION* 60 + 00 + 1000 LT DATE RECIEVED: Dec. 1176
INTERVAL: 52.0 - 53.2 DATE REPORTED: Dec. 15/76
TYPE: CORErx CHANNEL: CHIP:
ANALYST:
VOLATILE FIXED TOTAL CALORIFIC RAW COAL MOISTURE% ASH% MATTER CARBON SULPHUR VALUE F. S. I.
2.45 34.82 31.19 31.54 6.49 9,051 1:s
28xlOOMESH
IOOxOMESH
COMMENTS’

LEXCO TESTING LTD. screen size analysis
COAL FIELD: Quinsam LAB NO.1 1076
HOLE NO.: No. 8 (No. 3 Seam) DATE
LOCATION : 60 + 00 1000 LT DATE
INTERVAL: 53.8 - 56.3 DATE
SAMPLED: Nov. 17/76
RECIEVED: Dec. l/76
REPORTED: Dec. 15176
TYPE: CORE:-- x CHANNEL: CHIP:
ANALYST:
VOLATILE FIXED TOTAL CALORIFIC RAW COAL MOISTURE% ASH % MATTER CARBON SULPHUR VALUE F. S. I.
2.04 15.47 37.59 44.90 3.04 11,915 2
SIZE Wt.(grams)
+ 2" 0
wt. 96 ASH%
0.0
25.8 11.59
21.7 11.15
7.6 18.85
100xOMESH 2.8 27.43
100.0
COMMENTS’

LEXCO TESTING LTD. screen size analysis
COAL FIELD: Quinsam LAB NO.: 1090
HOLE N0.l No. 8 ( No. 2 Seam) DATE SAMPLED: Nov. 17176
LOCATION’ 60 + 00 1000 LT DATE RECIEVED: Dec. 1176
INTERVAL: 164.4 - 165.5 DATE REPORTED: Dec. 15’76
TYPE: CORE: x CHANNEL: CHIP:
ANALYST:
FIXED TOTAL CALORIFI C RAW COAL MOISTURE% ASH%
VOLATILE MATTER CARBON SULPHUR VALUE F. S. I.
3.14 17.97 35.79 43.10 4.14 10,670 1%
SIZE Wt.(grams)
+ 2" 0
2% I" 0
l”x3/4” 9
3/4"X l/2" 49
wt. % ASH%
0.0
0.0
1 . 4
7.8 23.19
8 x28MES.H 141 22.3 13.37
28xlOOMESH 51 8.1 20.94
IOOxOMESH 37 5.8 31.90 __-
632 100.0
COMMENTS’

LEXCO TESTING LTD. screen size analysis
COAL
HOLE
FIELD: Quinsam LAB NO.1 1075
NO.$ NO. 9 (No. 1 Seam) DATE
LOCATION’ 50 + 00 1500 LT DATE
INTERVAL: 115.8 - 121.1 DATE
SAMPLED: Nov. 18176
RECIEVED: Dec. 1176
REPORTED: De=. 15176
TYPE: CORE:- x CHANNEL: CHIP:
ANALYST:
MOISTURE% ASH % VOLATILE FIXED TOTAL
RAW COAL CALORIFIC
MATTER CARBON SULPHUR VALUE E S. I.
2.4 14.47 38.05 45.08 1.79 11,989 2
COMMENTS’

I
I
-
I
LEXCO TESTING LTD. screen size analysis
COAL FIELD: Quinsam LAB NO.1 1077
HOLE NO.1 No. 9 (No. 1 Seam) DATE SAMPLED: Nov. 18/76
LOCATION: 50 + 00 1500 LT DATE RECIEVED: Dec. 1/76
INTERVAL: 122.0 - .L25.7 DATE REPORTED! Dec. 15’76
TYPE: CORE:- x CHANNEL: CHIP:
ANALYST:
VOLATILE FIXED TOTAL CALORIFIC RAW COAL MOISTURE% ASH % MATTER CARSON SULPHUR VALUE F. S. I.
1.9 29.58 31.15 37.37 0.93 9.480 15
8 x28MESH
28xlOOMESH
IOOxOMESH
COMMENTS’
533 16.9
229 7.2
102 3.2 -__ -__ 3155 100.0
20.61
21.36
29.50
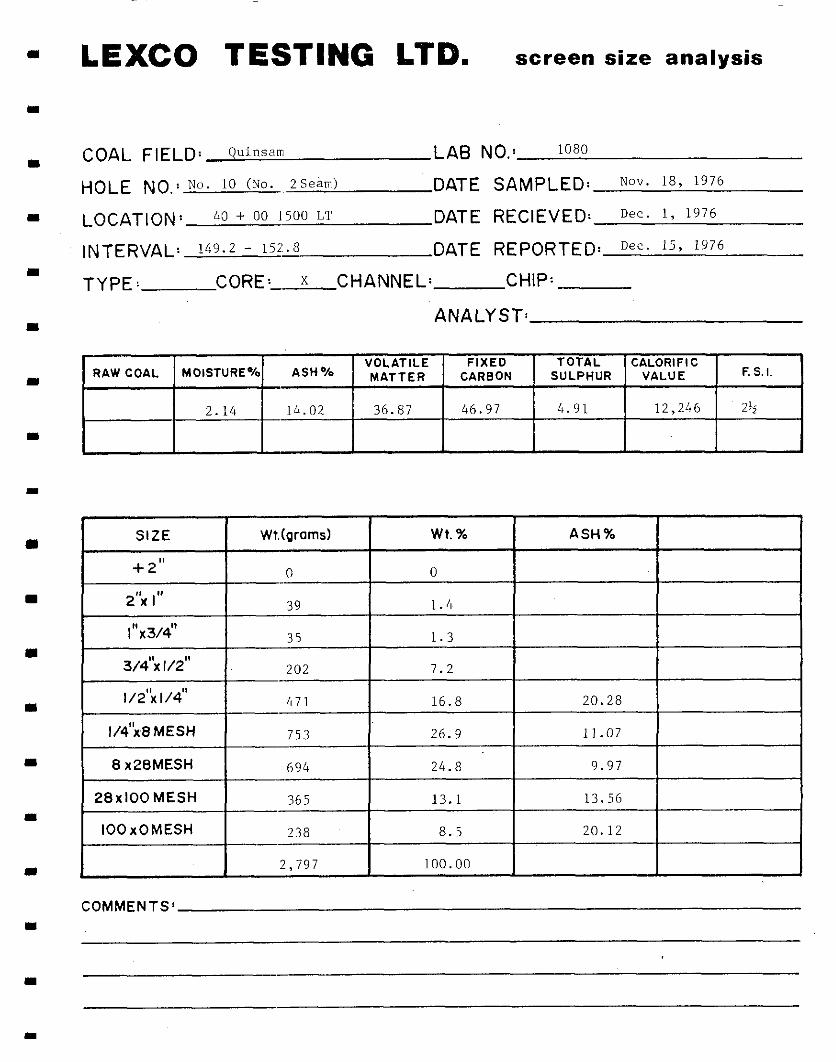
m
I
m
LEXCO TESTING LTD. screen size analysis
COAL FIELD: Quinsam LAB NO.1 1080
HOLE NO.8 No. 10 (No. 2Seh) DATE SAMPLED: NOV. 18, 1976
LOCATION’ 40 + 00 1500 LT DATE RECIEVED: Dec. 1, 1976
INTERVAL: 149.2 - 152.8 DATE REPORTED: Dec. 15y 1976
TYPE: CORE:- x CHANNEL: CHIP:
ANALYST:
ASH% VOLATILE FIXED TOTAL
MOISTURE% CALORIFIC
RAW COAL MATTER CARBON SULPHUR VALUE F. S.I.
2.14 14.02 36.87 46.97 4.91 12,246 2)s
28x100 MESH 365 13.1 13.56
IOOxOMESH 238 a.5 20.12
2,797 100.00
COMMENTS’

LEXCO TESTING LTD. screen size analysis
COAL FIELD: OUINSAM LAB NO.1 1078
HOLE N0.l 11 No. 1 Seam DATE SAMPLED: November 19, 1976
LOCAT~ONX Line 17O+llO 1000 RT DATE RECIEVED: December 1, 1976
INTERVAL: 146.0 - U8.5 DATE REpORTED:December 15, 1976
TYPE: CORE:-, x CHANNEL: CHIP:
ANALYST:
VOLATILE FIXED TOTAL CALORIFIC RAW COAL MOISTURE% ASH% MATTER CARBON SULPHUR VALUE F. S. I.
2.9 9.03 36.18 51.89 0.21 12,579 1%
28x100 MESH 168 3.2 10.70
IOOxOMESH 61 3.3 26.01
1822 100.0
COMMENTS’

LEXCO TESTING LTD. screen size analysis
COAL FIELD: nlII”‘S.4~’ LAB NO.1 lo79 HOLE NO.: 11 No. 1 Seam DATE SAMPLED: November 1976 19,
LOCATION: Line 170+00 1100 RT DATE RECIEVED: December 1, 1976
INTERVAL: 149.9 - 158.0 DATE REPORTED: December 15, 1976
TYPE: CORE:- X CHANNEL: CHIP:
ANALYST:
VOLATILE FIXED TOTAL CALORIFIC 7 RAW COAL MOISTURE% ASH% MATTER CARBON SULPHUR VALUE F. S. I,
2.79 18.36 34.12 44.73 0.30 11,199 1'5
8 x28MESH 2006 22.5 12.88
28x100 MESH 676 7.6 16.53
IOOxOMESH 233 2.6 25.68
P902 100.0 4
COMMENTS’

I
I
I
LEXCO TESTING LTD. screen size analysis
COAL FIELD: IQuinsam LAB NO.1 1087
HOLE NO.ti Iron River No. 1 DATE SAMPLED: -
LOCATION: DATE RECIEVED: Dec. 1176
INTERVAL: DATE REPORTED:D=. 15/76
TYPE: CORE:- CHANNEL: x CHIP:
ANALYST:
ASH% VOLATILE FIXED TOTAL CALORIFIC
RAW COAL MOISTURE% MATTER CARBON SULPHUR VALUE F.S.I.
I I I I I I I 1 42.13 2.03 1 10,600 0
I I I I I I I I J
8 x28MESl-l 375 26.6 13.59
28x100 MESH 14; 10.4 18.55
IOOxOMESH 68 4.8 28.03 ___-
1409 100.0
COMMENTS’
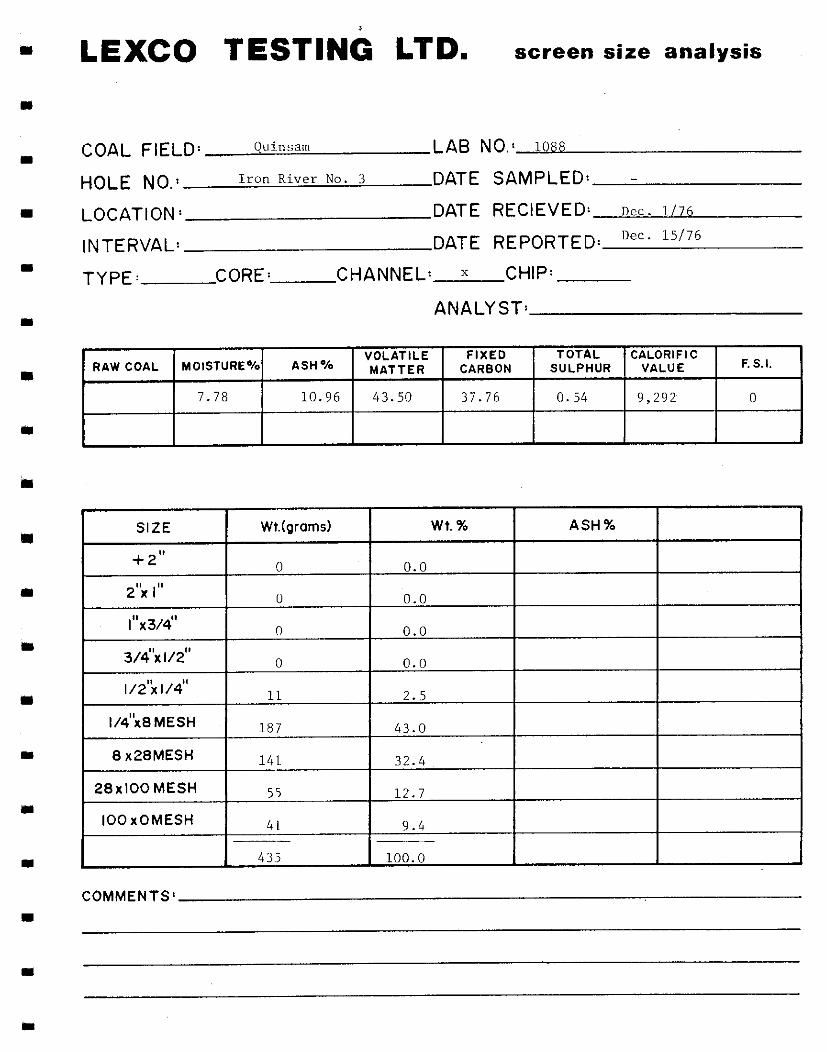
LEXCO TESTlNi3 LTD. screen size analysis
COAL FIELD: Qui~nsam LAB NO.1 1088
HOLE NO.: Iron River No. 3 DATE SAMPLED: -
LOCATION’ DATE RECIEVED: Dec. l/76
INTERVAL: DATE REPORTED: Dec. 15’76
TYPE: CORE: CHANNEL: x CHIP:
ANALYST:
FIXED TOTAL CALORIFIC RAW COAL MOISTURE% ASH%
VOLATILE MATTER CARBON SULPHUR VALUE F. S. I.
7.78 10.96 43.50 37.76 0.54 9,292 0
h
I 9.4 __-
I 43~5 100.0
COMMENTS2
wt. % I ASH% I I
0.0 I I I 0.0
0.0
43.0 I I
32.4
12.7