GEOHYDROLOGY OF THE ENGLISHTOWN … OF THE ENGLISHTOWN FORMATION IN THE NORTHERN COASTAL PLAIN OF...
68
GEOHYDROLOGY OF THE ENGLISHTOWN FORMATION IN THE NORTHERN COASTAL PLAIN OF NEW JERSEY By W. D. Nichols U.S. GEOLOGICAL SURVEY Water-Resources Investigations 76-123 Prepared in cooperation with the NEW JERSEY DEPARTMENT OF ENVIRONMENTAL PROTECTION, DIVISION OF WATER RESOURCES February 1977
-
Upload
duongkhanh -
Category
Documents
-
view
221 -
download
1
Transcript of GEOHYDROLOGY OF THE ENGLISHTOWN … OF THE ENGLISHTOWN FORMATION IN THE NORTHERN COASTAL PLAIN OF...
GEOHYDROLOGY OF THE ENGLISHTOWN FORMATION IN THE NORTHERN COASTAL PLAIN OF NEW JERSEY
By W. D. Nichols
U.S. GEOLOGICAL SURVEY
Water-Resources Investigations 76-123
Prepared in cooperation with the
NEW JERSEY DEPARTMENT OF ENVIRONMENTAL
PROTECTION, DIVISION OF WATER RESOURCES
February 1977

UNITED STATES DEPARTMENT OF THE INTERIOR
Thomas S. Kleppe, Secretary
GEOLOGICAL SURVEY
V. E. McKelvey, Director
For additional information write to:
DeS. Geological Survey Rm. 420 Federal Bldg. P.,O .. Box 1238 Trenton, N.J. 08607
CONTENTS
Abstract .••........•..•...•..................•..•.•.•..... ,. Introduction ..................................................................................... o .... ..
Purpose and scope .............................................. . Prev'ious investigations ................................... ,. ...... ,. .. ,. ..................... . 3 Acknowledgments ................................................................. ~ .......... ,. ..... ..
Stratigraphic sunnnary of the Cretaceous fonnations of the northern Coastal Plain of New Jersey ........................................ ..
Raritan and Magothy Formations •••••••••••••••••••••••••••• Matawan Group ...................................................................................... .. Monmouth Group.................................................................................. 20
Geohydrology of the Englishtown aquifer system......................................... 20 Aquifer geometry and boundaries •••••••••••••••••••• ••••••••··~¥ 22 Aquifer coefficients ............................................ ~ 22 Regional configuration of the potentiometric surface and water-
level trends ................................................ @ • ., 26 Ground-water withdrawals .............................................. ~ 38 Confining layer geometry ••••••••••••••••••••••••••••••••••• § ••• e. 43 Confining layer coefficients•••••••••••••••••••••••••••••e•••••••0 48
Conclusions...................................................................................... 59 References cited.................................................... 59
ILLUSTRATIONS
Figure 1. Index map of New Jersey showing the area of investigation •• $
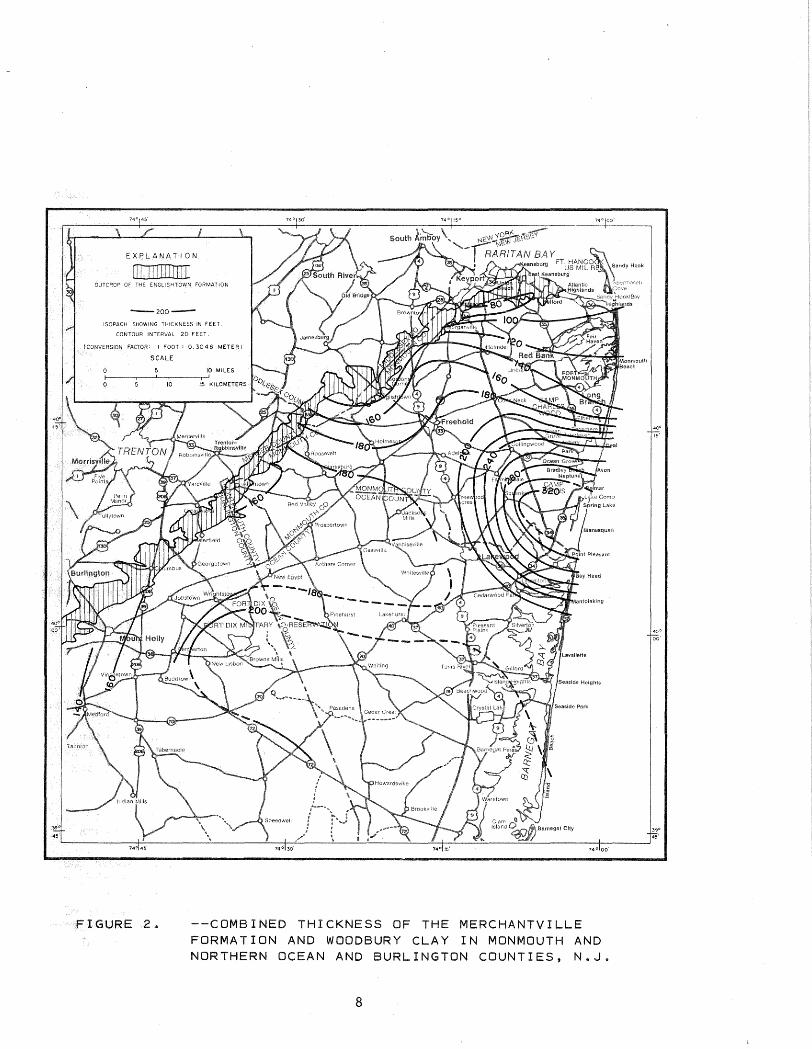
2 .. Map showing the combined thickness of the Merchantville Formation and Woodbury Clay in Monmouth and northern Ocean and Burlington Counties, N. J .. •••••••••••••••••••• 8
3. Map showing location of wells used for stratigraphic control data ............................................ ~. 9
4. Structure-contour map of the top of the Englishtown Formation in Monmouth and northern Ocean Counties, N. J. 13
5. Cross-sections A-A' and B-B' showing the sand and clayey silt lithofacies of the Englishtown aquifer in northern Ocean County, N.J. ••••••••••••••••••••••••••••••••••••• 14
6. Map showing the thickness of the Englishtown Formation in Monmouth_and northern Ocean and Burlington Counties, N .. J • • • • e • • • • o • • • • • • o • • • • e • o • • e • • o e e o e e • • e • e • • & • • • e e e 16
7. Map showing the thickness of the lower sand lithofacies of the Englishtown Formation in northern Ocean County, N. J. 17
8. Map showing the thickness of the clayey silt lithofacies of the Englishtown Formation in northern Ocean County, N. J • •••••••••••••••••••••••• 0 .......................... . 18
9 .. Map showing the thickness of the upper sand lithofacies of the Englishtown Formation in northern Ocean County, N. J
10 .. Map showing the decline in water level between January, 1959, and November, 1970, in the Englishtown aquifer in Monmouth and northern Ocean Counties, N. J. ••••••••••ae• 21
III

ILLUSTRATIONS--Continued
Page
11. Map showing the thickness of the Englishtown aquifer in Monmouth County and of the upper sand lithofacies of the Englishtown Formation in northern Ocean and Burlington Counties, N.J. •••••••••••••••••••••••••••• 23
12. Map showing the transmissivity of the Englishtown aquifer in Monmouth and northern Ocean Counties, N.J. •••••••• 25
13. Map showing the altitude of the potentiometric surface in the Englishtown aquifer about 1900, in Monmouth, and northern Ocean and Burlington Counties, N.J. •••••••••• 27
14.. Map showing the altitude of the potentiometric surface in the Englishtown aquifer in January, 1959, in Monmouth and northern Ocean Counties, N.J. ••••••••••••••••••••• 28
15. Map showing the decline in water level between about 1900 and January 1959 in the Englishtown aquifer in Monmouth and northern Ocean Counties............................. 39
16. Map showing the altitude of the potentiometric surface in the Englishtown aquifer in November, 1970, in Monmouth and northern Ocean Counties, N. J. •••••••••••• 40
17. Hydrographs of observation wells tapping the Englishtown aquifer in Monmouth and northern Ocean Counties, N. J. • 41
A. Allaire State Park, U.S.G.S. observation well, Monmouth County, N. J.
B. Colliers Mills, u.s.G.S. observation well TW 1, Ocean County, N. J.
c. Lakewood Water Company observation well, Lakewood, Ocean County, N. J.
18. Location of pumping wells listed in table 8 and observation wells described in figure 17•••••••••••••••••••••••e•••• 42
19. Map showing location of wells developed in the Englishtown aquifer in Monmouth and Ocean Counties................... 44
20. Map showing the thickness of the confining layer overlying the Englishtown aquifer in Monmouth, and northern Ocean and Burlington Counties, N.J. ••••••·••••••••••••••••••• 45
21. Sediment classification diagrams for selected samples from test holes penetrating the confining layers of the Englishtown aquifer system •••••••••••••••••••••••••••••• 49
TABLES
Table le Stratigraphic units of the northern Atlantic Coastal Plain of New Jersey ....................... .,...................................................... 6
2 .. Stratigraphic control data.......................................... 10 3'* Estimated transmissivity and hydraulic conductivity of the
Englishtown aquifer based on the specific capacity of selected wells............................................. 24
4.. Extreme and average values of aquifer and confining layer hydraulic coefficients ............................. e.............................. 26
IV

TABLES--Continued
Table 5 .. Water-level data used in constructing 1900 surface map for the Englishtown aquifer ............... @ •••
6 .. Yield and water-level data for wells developed in the Englishtown aquifer in Monmouth and Ocean Counties .. ~@ ..
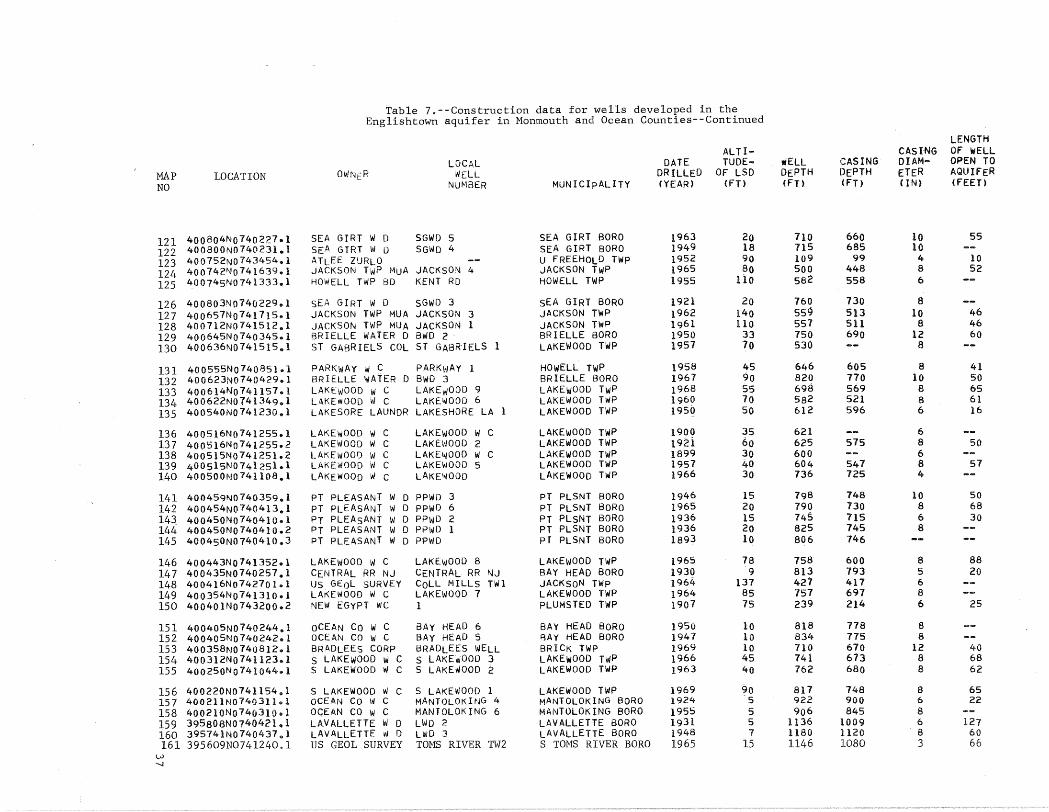
7 .. Construction data for wells developed in the aquifer in Monmouth and Ocean Counties ........... ~ a•
Q Vo Rate of ground-water withdrawal for public supply in
Monmouth and Ocean Counties ................................. .. 9. Consolidation test data ......................................... .
v

CONVERSION FACTORS
Factors for converting English units to the International System of Units are given below to four significant figures. However, in the text
the metric equivalents are shown only to the number of significant figures consistent with the values for the English units.
Multiply by Metric (SI)
ft (feet) 0 .. 3048 m (meters)
ft/s (feet per second) 30.48 cm/s (centimeters per second)
ft/mi (feet per mile) 0.1894 m/km (meters per kilometer)
2 f /day (square feet per day) 0.0929 m /day (square meters per day)
2 f /s (square feet per second) 929 em /s (square centimeters per second)
/min (gallons per minute) 0.06309 1/s (liters per second)
3 1/d (million gallons per 0 .. 04381 m /s (cubic meters per second) day)
2 (square miles) 2.590 km (square kilometers)
2 (pounds per square inch) .07031 kg/em (kilograms per square centimeter)
VI

GEOHYDROLOGY OF THE ENGLISHTOWN FORMATION IN
THE NORTHERN COASTAL PLAIN OF NEW JERSEY
By W. D. Nichols
ABSTRACT
The Englishtown Formation of the Matawan Group of Late Cretaceous age is exposed in the western part of the New Jersey Coastal Plain along a northeast-southwest trending zone extending from Raritan Bay to Delaware Bay. In outcrop, in the northern part of the Coastal Plain, the Englishtown typically consists of a series of thin, cross-stratified, fine- to medium-grained lignitic quartz sand beds intercalated with thin beds of sandy silty clay and clayey silt, ranging in total thickness from about 140 feet (43 meters) near Raritan Bay to about 50 feet (15 meters) near Trenton. In the subsurface of the northern part of the Coastal Plain, the formation retains most of the lithologic characteristics displayed in outcrop. In northern and eastern Ocean County the Englishtown can be subdivided into three distinct lithologic units; upper and lower units of quartz sand with thin interbeds of dark sandy silt, separated by a thick sequence of sandy and clayey lignitic silt.
The confined part of the aquifer in the Englishtown Formation is utilized as a source of water over an area of about 1,100 square miles (2,849 square kilometers) of the New Jersey Coastal Plain and is an important source of supply in Monmouth and northern Ocean Counties& The annual average rate of withdrawal from the aquifer in th~ two-county area increased from 5.5 million gallons per day (0.24 cubic meters per second) in 1959 to 9.5 million gallons per day (0.4 cubic meters per second) in 1970. Water levels in parts of this area were declining 8 to 12 feet (2e4 to 3.6 meters) per year as of 1970 and they declined as much as 140 feet (43 meters) between 1959 and 1970 near pumping centers. The aquifer transmissivity ranges from 2,400 square feet per day to 650 square feet per day (223 square meters per day to 60 square meters per day); the estimated hydraulic conductivity ranges from about 11 feet per day to 20 feet per day (3.3 meters per day_§o 6.1 meters per day); and the storage coefficient ranges from 8 x 10 to 3 x lo-4. The underlying and overlying confining beds, which have an average thickness of 200 feet (61 meters) and 40 feet (12 meters), respectively, have vertical hydraulic conductivities on the order of 1 x lo-5 feet per day (3 x 10⁻⁶ meters per day) and specific storage on the order of 8 x lQ-5 ft-1 (2.4 X 10⁻⁵ m-1).
1

ishtown aquifer is an integral part of the complex multiof the New Jersey Coastal Plain. The withdrawal of water
from ishtown has had a marked effect on the water level the Mount Laurel aquifer, and these effects will continue so
as the level in the Englishtown continues to decline. Any increase in of the Mount Laurel aquifer that reduces the volume of shtown will cause an increase in the rate of water-level shtown even with no increase in direct ~;vithdrawals.. and interdependency between pumping stresses in individual within the complex Coastal Plain aquifer
must be recognized and appreciated, and the hydrodynamics of all of the system must be considered if reliable predictions of aquifer
response to these stresses are to be made. Such predictions generally a simulation model analysis of the system.
INTRODUCTION
The aquifer in the Englishtown Formation of the Matawan Group of Late Cretaceous age is one of the more important sources of ground-water supplies
the northern of the New Jersey Coastal Plain. Total ground-water withdrawals for public supply in Monmouth and northern Ocean Counties increased from 5.5 Mgal/d (million gallons per day) [0.24 m3fs (cubic meters per ] in 1959 to 9.5 Mgal/d (0.4 m3/s) in 1970. Although these withdrawals may seem small in comparison with withdrawals from ground-water sources in other areas, they have placed a considerable stress on the
aquifere Water levels in the aquifer have been declining at the rate of 8 to 12 ft (feet) [2.4 to 3.6 m (meters)] per year over large areas since 1959. The rate of decline has accelerated during the past several years in some areas, near pumping centers, in response to increased withdrawals.
the need for quantitative solutions to the questions arising from the demands for continued increased development of the ground-water resources of the New Jersey Coastal Plain, the u.s. Geological Survey began
program of regional geohydrologic studies of the aquifers in the Coastal Plain system in cooperation with the Division of Water Resources of
Department of Environmental Protection. These studies, in the applicable analytical techniques needed to define
, include simulation modeling of individual aquifers. The models in most, if not all, cases are to be digital computer simulation models and will serve three specific purposes. First, the modeling effort
1 those data that are essential to a quantitative study of the ics of the aquifer and the areas where such data are most needed.
Second, the model will provide a tool for the investigator to test and evaluate different concepts of the functioning of the ground-water system. Third, when completed and calibrated, the model will be a tool that can be used the water-resource planner and manager to predict the effects of alternative schemes of resource development.
2
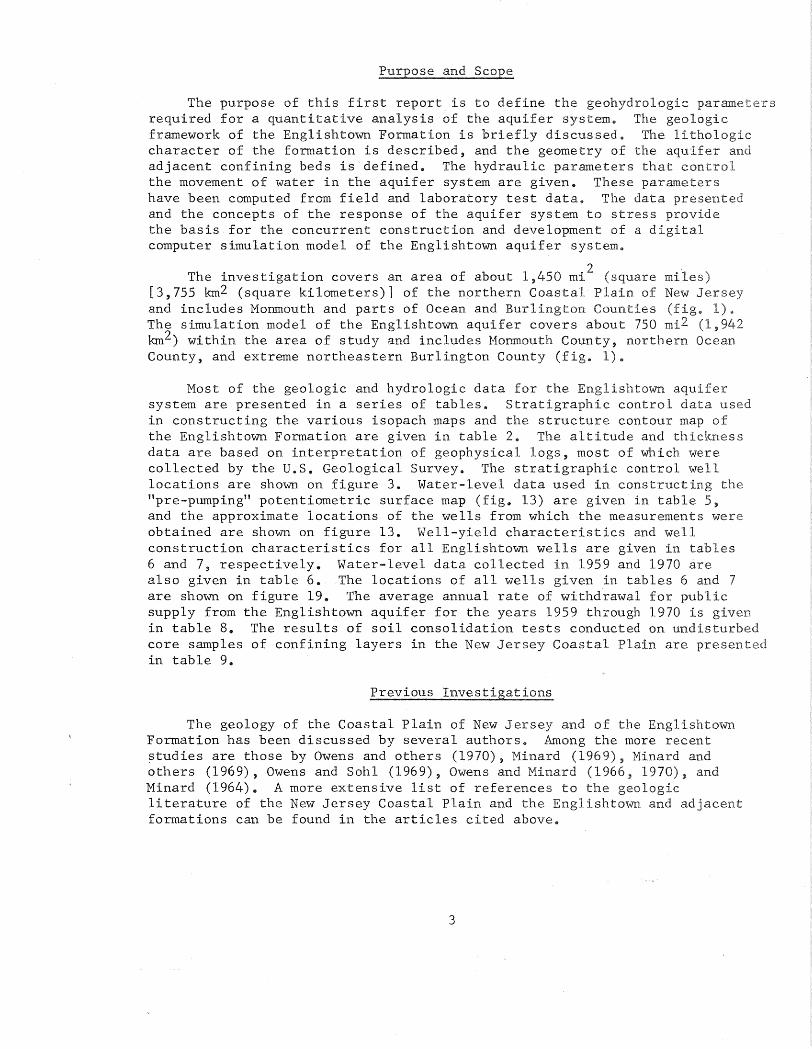
The purpose of this first report is to define the geohydrol required for a quantitative analysis of the aquifer systemo The framework of the Englishtown Formation is briefly discussed. The character of the formation is described, and the geometry of the adjacent confining beds is defined. The hydraulic parameters that control the movement of water in the aquifer system are given. These have been computed from field and laboratory test data. The data and the concepts of the response of the aquifer system to stress the basis for the concurrent construction and development of a d computer simulation model of the Englishtown aquifer system.
2 The investigation covers an area of about 1,450 mi (square mi [3,755 km2 (square kilometers)] of the northern Coastal Plain of and includes Mo~mouth and parts of Ocean and Burlington Counties (fige 1) The simulation model of the Englishtown aquifer covers about 750 mi2 (1 942 km2) within the area of study and includes Monmouth County, northern Ocean County, and extreme northeastern Burlington County (fig. 1).,
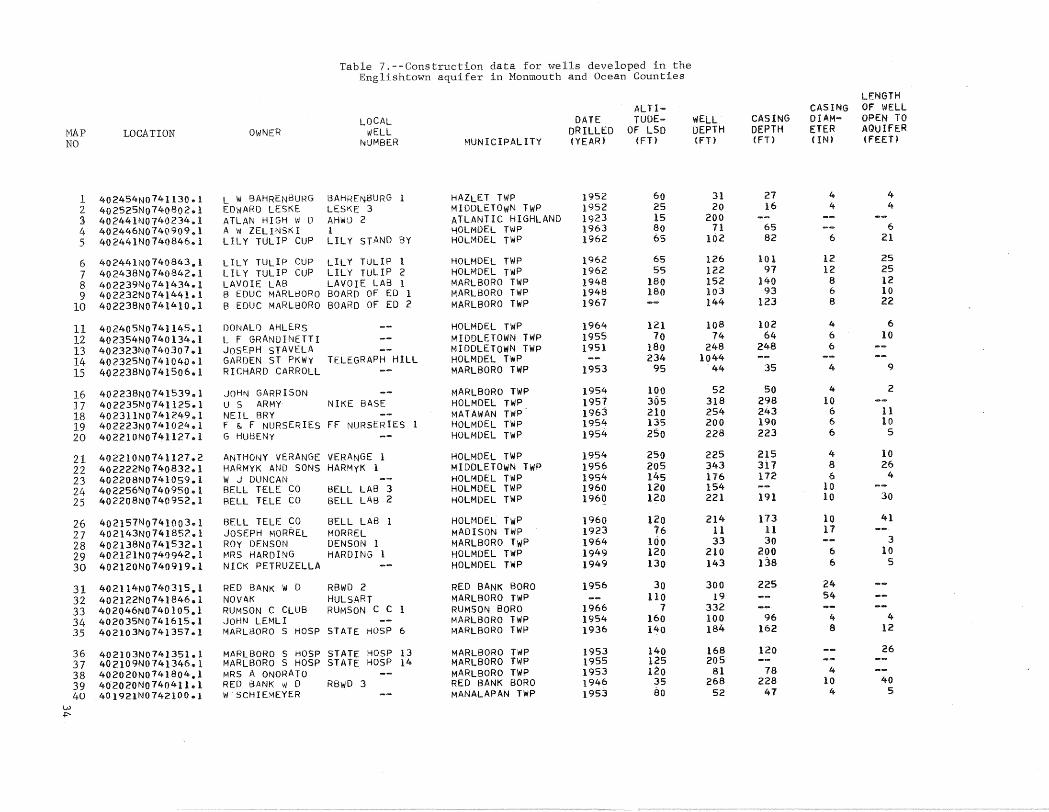
Most of the geologic and hydrologic data for the Englishtown system are presented in a series of tablese Stratigraphic control data used in constructing the various isopach maps and the structure contour map of the Englishtown Formation are given in table 2. The altitude and thickness data are based on interpretation of geophysical logs, most of which were collected by the U.S. Geological Survey. The stratigraphic control well locations are shown on figure 3. Water-level data used in construct the "pre-pumping" potentiometric surface map (fig., 13) are given in table 5, and the approximate locations of the wells from which the measurements were obtained are shown on figure 13. Well-yield characteristics and well construction characteristics for all Englishtown wells are in tables 6 and 7, respectively. Water-level data collected in 1959 and 1970 are also given in table 6. The locations of all wells given in tables 6 and are shown on figure 19. The average annual rate of withdrawal for public supply from the Englishtown aquifer for the years 1959 thLough 1970 is in table 8. The results of soil consolidation tests conducted on undisturbed core samples of confining layers in the New Jersey Coastal Plain are in table 9.
Previous Investigations
The geology of the Coastal Plain of New Jersey and of the Formation has been discussed by several authors. Among the more recent studies are those by Owens and others (1970), Minard (1969), Minard and others (1969), Owens and Sohl (1969), Owens and Minard (1966 19 and Minard (1964). A more extensive list of references to the literature of the New Jersey Coastal Plain and the Englishtown and acent formations can be found in the articles cited above$
3

FIGURE 1.
EXPLANATION
Outcrop of the Englishtown Formation
Area of investigation
0 10 20 30 MILES I d
11 i I I 1
1
0 tO 20 30 40 50 KILOMETERS
--INDEX MAP OF NEW JERSEY SHOWING AREA OF INVESTIGATION.
4

The regional hydrology of the Englishtown Formation is discussed briefly by Barksdale and others (1958) and by Parker and others Reports by Jablonski (1959, 1960, 1968) on Monmouth ; Rush (1962, 1968) on Burlington County; Anderson and Appel (1969) on Ocean County; Dansky (1963) and Farlekas and others (1974) on Camden County; Vecchioli and Palmer (1962) on Mercer County; Hardt (1963) and Hardt and Hilton on Gloucester County; and Rosenau and others (1969) on Salem County contain well records, logs, chemical analyses, and brief descriptions of the geology, hydrology, and water quality of the Englishtown Formation in these counties. Seaber (1965) has given a short discussion of the geology and geohydrology of the Englishtown Formation and a more extensive discussion of the chemical quality of the water in the Englishtown throughout much of the formation in the New Jersey Coastal Plain.
Acknowledgments
This investigation was conducted by the u.s. Geological Survey in cooperation with the Division of Water Resources of the New Jersey Department of Environmental Protection. Bronius Nemickas, Richard E. Harry Farsett, William Cushing, and Floyd Price assisted the author in the collection, compilation, and analysis of basic data. Harold E. Gill provided invaluable guidance and assistance in the interpretation of ical logs during the early stages of the investigation.
STRATIGRAPHIC SUMMARY OF THE CRETACEOUS FORMATIONS OF THE NORTHERN COASTAL PLAIN OF NEW JERSEY
The New Jersey Coastal Plain is underlain by a wedge-shaped mass of unconsolidated and partly consolidated marine, marginal marine, and nonmarine deposits of clay, silt, sand, and gravel@ The sediments range in age from Cretaceous to Holocene (table 1) and lie unconformably on the pre-Cretaceous basement. The total thickness of the sedimentary sequence in outcrop ranges from 500 to 1,000 ft (152 to 305m); the sequence thickens downdip, toward the southeast, and attains a maximum aggregate thickness of about 6,500 ft (1,980 m) at the extreme southern tip of New Jersey.
The geology of the pre-Quaternary Coastal Plain formations of New Jersey has been discussed by several investigators and was recently summarized by Owens and Minard (1970) and Owens and Sohl (1969). These studies, especially the more recent ones, have shown that there are significant differences in the character and occurrence of these formations between Raritan Bay in the northeast and Delaware Bay to the southwest. The differences reflect the varying patterns and environments of sedimentation that existed throughout the region, especially during Late Cretaceous time Depositional patterns in the northern Coastal Plain of New Jersey seem to have been controlled largely by two basement tectonic elements; a trough or small basin centering in the vicinity of Raritan Bay and a northwestsoutheast trending high in southern New Jersey.
5

Table 1.--Stratigraphic units of the northern Atlantic Coastal Plain of New Jersey!/
System Series Formation Lithology
Alluvium Sand, silt, and black mud. Holocene
Beach sand and gravel Sand, quartz, light-colored, medium-grained, pebbly.
Quaternary
Cape May Forma.tion
Sand, quartz, light-colored, hetero-Pleistocene Pensauken Formation~/ I geneous, clayey, pebbly, glauconitic.
Bridgeton Formation
Pliocene(?) Beacon Hill Gravel Gravel, quartz, light-colored, sandy.
Pliocene(?) Sand, quartz, light-colored, medium-and Cohansey Sand to coarse-grained, pebbly; local clay
Miocene(?) beds.
Sand, quartz, gray to tan, very fine to Miocene Kirkwood Formation medium-grained, micaceous, and dark-
colored diatomaceous clay. Tertiary
Shark River Marl Sand, quartz and glauconite, gray, Eocene brown, and ·green, fine- to coarse-
Manasquan grained, clayey, and green silty p. Formation and sandy clay. ;:l 0 H
C!> Sand, quartz, gray and green, fine- to tJl Vincentown coarse-grained, glauconitic, and brown lll u Formation clayey, very fossiliferous, glauconite 0
Paleocene u and quartz calcarenite, c:: . OS
!Xi Hornerstown Sand, glauconite, green, medium- to Sand coarse-grained, clayey.
Tint<>n Sand and Sand, quartz and glauconite, brown and p. Red Bank Sand gray, fine- to coarse-grained, clayey, ;:l 0 undivided micaceous H
C!>
.c: Navesink Sand, glauconite and quartz, green, .w ;:J Formation black, and brown, medium- to coarse-0
grained, clayey. a 0 ;:;::
Mount Laurel Sand, quartz, brown and gray, fine- to Sand coarse-grained, glauconitic.
Wenonah Sand, quartz, gray and brown, very fine Formation to fine-grained, glauconitic, micaceous.
Upper p. Cretaceous ;:l Marshall town Sand, quartz and glauconite, gray and
Cretaceous 0 H Formation black, very fine to medium-grained,
C!> very clayey. c::
OS :;:
Englishtown Sand, quartz, tan and gray, fine- to ~ Formation medium-grained; local clay beds, "' ;:;::
Woodbury Clay Clay, gray and black, micaceous.
Merchantville Clay, gray and black, micaceous, Formation glauconitic, silty; locally very fine
grained quartz and glauconite sand.
Magothy Formation Sand,. quartz, light-gray, fine-grained, and dark-gray lignitic clay.
Raritan Formation Sand, quartz, light-colored, fine- to coarse-grained, pebbly, arkosic, and red, white, and variegated clay.
Precambrian and early Paleozoic crystalline rocks - metamorphic schist and gneiss;
Pre-Cretaceous locally Triassic basalt, sandstone, and shale.
])Modified after Seaber, 1965, table 3.
1/Age of Pensauken Formation now considered late Miocene.
6

Raritan and Magothy FQnnations
The Raritan Formation is the oldest stratigraphic unit in the northern Coastal Plain of New Jersey. This formation, which lies unconformably on the pre-Cretaceous basement, consists chiefly of interstratified lightcolored sands and dark or variegated silty clays and clayey silts. Depositional environments ranging from marine and marginal marine to those of a subaerial and subaquaceous deltaic plain (Owens and others, 1968) are represented in the various beds of this formation. The Raritan has a maximum thickness, in outcrop, of about 500 ft (152m) in the northern New Jersey Coastal Plain.
The Magothy Formation overlies the Raritan Formation throughout New Jersey. In the Raritan Bay area the Magothy consists of three units; a basal unit of massive to laminated dark micaceous silt, a middle unit of thin-bedded dark clays and silts and light-colored sand, and an upper unit of cross-bedded sand (Owens and Sohl, 1969). Farther south, near Trenton, the Magothy consists of a unit of light-colored cross-bedded sand, which has been correlated (Berry, 1906) with the uppermost unit of the Magothy at Raritan Bay. Along its outcrop, the Magothy ranges in thickness from about 175 ft (53 m) near Raritan Bay to about 500 ft (152 m) near Trenton.
Matawan Group
The Matawan Group is divided into five formations; ascending they are the Merchantville Formation, Woodbury Clay, Englishtown Formation, Marshalltown Formation, and Wenonah Formation. The Merchantville Formation disconformably overlies the Magothy throughout the New Jersey Coastal Plain. It consists primarily of an interbedded marine sequence of dark-colored thin micaceous clayey silt and very fine silty sand with massive thick beds of silty glauconite sand in the Raritan Bay area. The formation becomes thicker bedded toward the southwest.
The Woodbury Clay overlies the Merchantville Formation in the northern and central part of the New Jersey Coastal Plain. It pinches out in the area just north of Swedesboro in southwestern New Jersey and is not seen in outcrop south of that point. The contact between the two formations is gradational. The Woodbury is a massive-bedded dark-gray to grayish-black lignitic sandy to clayey silt and silty clay of marine origin.
The Merchantville Formation and Woodbury Clay are both about 50 ft (15 m) thick along their outcrop between Trenton and Raritan Bay. South and southeast from the outcrop area, the combined thickness of the Merchantville Formation and Woodbury Clay gradually increases to about 200 ft (61 m). The total thickness of the two units then increases sharply to more than 300 ft (91 m) over a roughly elliptically shaped area of southeastern Monmouth County. An isopach map of the combined thickness of the two formations is shown in figure 2. The thickness data used in constructing the map is given in table 2. The location of stratigraphic control wells are shown on figure 3.
7
EXPLANATION
OlJJJTIJIOTIJ OUTCROP OF THE ENGLISHTOWN FORMATION
-2oo-ISOPACH SHOWING THICKNESS IN FEET
CONTOUR INTERVAL 20 FEET
{CONVERSION FACTOR I FOOT
SCALE
10
FIGURE 2. --COMBINED THICKNESS OF FORMATION AND WOODBURY
THE MERCHANTVILLE CLAY IN MONMOUTH AND
BURLINGTON COUNTIES, N.J. NORTHERN OCEAN AND
40' oo'
8

EXPLANATION
mrromiTID OUTCROP OF THE ENGLISHTOWN FORMATION
e31
WE:LL DEVELOPED IN ENGLISHTOWN AQUIFER (SEE TABLE 4, 6, AND 7).
eiBS
WELL DEVELOPED IN AQUIFER BELOW THE ENGLISHTOWN AQUIFER (SEE TABLE 4).
A A' B e-------4
TRACE OF CROSS-SECTiON (
SCALE
FIGURE 3. --LOCATION OF WELLS USED FOR STRATIGRAPHIC CONTROL DATA.
40°
i5'
4QO
oo'
9

Table 2.--Stratigraphic control data
MAP NO
LOCATION 01-JNFR LOCAL
liiELL NU"'iBER
ALTI-TUDE-
OF LSD (fT)
DATE DRILLED <YEAR)
WELL DEPTH (FH
ITUDE OF TOP
OF ENGt_ISHTOWN
FORMATION
THICKNESS OF
ENGLISHTOWN FORMATION
<FT>
THICKNESS OF
LAYER (FT>
THICKNESS oF
LAYER {FT)
31 43 53 84
105
402114NO 7403l5ol 40I927No735842ol 40l720N07403Is.1 40l322N0740l55.,l 40l025N0740212 .. l
RED BANK W D MON BCH CLD STR R H MACY So CO MONMOUTH CON WC WALL HIP W D
RBWD 2 MBCS 2 BAMBERGER TEST WHITESVILLE 3 WEST BELMAR
30 10 70 10 25
1956 1961 195·7 195•+ 1959
300 430 430 566 575
-112 -286 -280 --'~36 -541
1313 136 116 104
a:o+
42 42 42 40 35
144
111 112 118 120 124
400908N0741330el 400832N0740B2l.,l 400823N0741520e1 4ooB24No74oSoB .. 1 400742N0741639.,1
ALDRICH W CO US GEOL SURVEY JACKSON TWP MUA WALL TWP W 0 JACKSON TWP MUA
ALDRICH ''II CO 4 ALLAIRE S P C JACKSO~ 2 ALLENWOOD 2 JACKSO~ 4
130 96
156 80 80
196.7 1963 1962 1959 1965
550 633 577 710 soo
-380 -£•69 -330 -524 -366
56+ 108 118+
74 138+
40 40 40 44 50
133 131 140 146 148
400614N0741157 .. 1 400555N0740B51.,1 400500N074llOB.l 400443N0741352el 400416No74270l•l
LAKEWOOD W C PARKWAY W C LAKEWOOD W C LAKEWOOD W C US GEOL SURVEY
LAKEWOOD 9 PARKWAY 1 LAKEWOOD LAKEWOOD 8 COLL MILLS T\111
55 45 30 78
137
1968 1958 1966 1965 1964
698 646 736 758 427
-478 -558 -552 -520 -249
110 124+ 110 160
96+
54 50 94
100 44
153 154 161
lS 2S
400358N0740812.1 400312N074ll23el 395609No741240•l 402536N0735905.1 402449N0740910.l
BRADLEES CORP S LAKEWOOD W C US GEOL SURVEY STATE OF NJ LILY TULIP CUP
BRADLEES WELL S LAKEwOOD 3 TOMS RIVER TW2 SANOY HOOK SPl DEEP TEST WELL
10 45 }5 10 60
1969 1966 1965 1965 1969
710 741
1146 397 799
-640 -616 -886
·-55 --
62+ 54+
222 146 122+
48 62 46 10 --
94 81)
3S .4S 5S 6S 7S
402102N074I353.,1 40l902N07418U.4 40l639No735936el 401633NQ74172B•l 401633N074l726.,2
MARLBORO S HOSP GoRDONS W C MONMOUTH CONsOL FREEHOLD W D FREEHOLD W D
STATE HOSP 15 GoRUoNS 4 MCWC l FREEHOLD 3 TOP.,LAKE TEST
135 150
10 120 110
1966 1968 1956 1964 1967
810 810 981 567 585
+17 +38
-384 +16 +34
70 80
122 lOB 100
14 19 42 36 24
148 164 140 160 178
8S 9S
lOS llS 12S
401625N074150le2 401609N074l206ol 401607N0742014.1 401558N0740908e1 40l557No742318el
SO GULF UTIL HARMONY GOLF CL BATTLEGROUND CC NAD EARLE BOY sCOUTS AMER
SO GuLF 2 HARMON GOLF l IRRIGATION NAD EARLE 2 QUAIL HILL 2
195 135 125 135 250
1966 1963 1967 1944 1967
656 712 569 836 527
-66 -137
+6 -202
+62
92 98
100 98 62
36 12 26 22 16
190 186 174 210 152
13S 14S lSS 16S 17S
40l5lONo741604el 401412N0741606el 401322N0740202el 401223N0742B47.l 40ll34No7410l4el
NESTLE CO FREEHOLD TWP MONMOUTH CON WILLIAM LEE ROKEACH SONS
WD WC
3 SUPPLY KOENIG LANE 1 WHITESVILLE 4 --ROKEAC'"i 1
155 130
25 175
80
1970 1957 1956 1960 }961
650 670 957 456 885
-71 -92
-421 +50
-302
ll04 100 100
76 102
28 32 44 32 c;2
186 172 242 165 261
18S 19S 20S 21S 22S
40l005N0742939.l 400957N07413l7e1 400921No74o743·l 400853N0741925.,1 400733N0742635.,l
PUNK 8ROS ALDRICH \II CO STA.TE OF N J
5,. SWITLICK
PUNK DEEP WELL ALDRICH W CO 2 ALLAIRE S P G2 OIL TEST WELL TEST WELL 68-1
140 150
30 110 120
1964 1960 1967 --·
1968
952 440
1029 5000
404
-4 -320 -482 -251) -172
84 124
90 156 100
28 34 44 24 40
116 --
326 172
I-' 0

Table 2.--Stratigraphic control data--Continued
THICKNESS THICKNESS ALTITUDE THICKNESS Of OF
ALTI- OF TOP OF OVERLYING UNDERLYING LOCAL TUDE- DATE WELL OF ENGLISHTOI!JIN CONFINING CONFINING
MAP LOCATION OWNER iN ELL OF LSD DRILLED DEPTH ENGLISHTOWN FORMA TIONI LAYER LAYER (FT) <YEAR) (FT) NO NUMBER FORMATION (FT) <FT> {FT)
23S 400454N074C414.1 PT PLEASANT W D PPWD 5 18 1960 1342 -705 158+ 42 188 24S 40t)3}9"JQ74}957.1 GLIDDEN-DURKEE SCM 3 lOS 1962 }128 -402 166 62 162 25S 400300N0743517.l US AIR FORCE MCGUIRE 8 126 1960 835 -112 50 80 178 26S 400256N0744lll.l wM G HELlS STOCK FARM 3 70 1962 372 +2 so 35 172 27S 400211JN07403l0.2 OCEAN Co W C MANTOLOKING 7 10 1960 1369 -854 180 38 202
28S 400l38N0743753.1 US ARt-iY FORT DIX 3 172 -- 869 -130 54 58 230 29S 400129N0743656.1 US ARMY FORT DIX 2 131 1941 1051 -155 70 58 162 30S 4001l5N07440Q9.1 WM G HELlS STOCK FARM SO 90 498 -- -96 52 56 170 31S 400I05N0742244.l US NAVY LAKE NAS 32 100 1964 1583 -418 152 56 170 32S 400046N074l838.l LAKEHURST WD 1 65 ll928 1035 -559 148 96 190
33S 400021N0744737.1 ACME FOOD STORE 1 62 1956 545 +2 74 34 142 34S 400009N074Q337e1 OCEAN CO W C NOR4ANDY 4 8 1967 1500 -92it 176 180 35S 395938N0743742•1 US ARMY FT OIX FORT DIX 6 160 !970 1140 -232 28 40 214 36S 395930N0741421,.1 TOMS R CHEM CO TOMS R 84 66 1968 1·~80 -7U 148 66 196 37S 395830N0744803el BROWN CO TEST 1 40 1961 355 -4ll 60 25 180
38S 395808NQ740416ol LAVALLETTE W D LAVALLETTE 4 5 1960 1515 -946 178 190 39S 395721N074482l.l LUMBERTON L W S LLWS 3 10 1960 400 -90 80 28 152 40S 395720N0744822.l LUMBERTON L W S LLWS 2 10 1960 359 -90 80 28 152 41S 395524N074S025.1 US GEOL SURVEY MEDFORD 1 70 1963 '+10 -11.2 84 28 128 42S 3951221'.JQ741017 .. 1 US GEOL SURVEY BUTLER PLACE 1 130 1964 2117 -684 68 18 294
43S 394829N0740535.3 US GEOL SURVEY Is BEACH 3 8 1962 2756 -1390 152
1-' 1-'

The Englishtown Formation is exposed in the western part of the New Jersey Coastal Plain along a northeast-southwest trending zone extending from Raritan Bay to Delaware Bay (fig. 1). The formation dips gently from 30 to 50 ft/mi (feet per mile) [5.7 to 9.5 m/km (meters per kilometer)] toward the southeast. The top of the formation is 700 to 800 ft (213 to
m) below sea level in northeastern Ocean County (fig. 4, table 2).
The Englishtown conformably overlies the Woodbury Clay in the northern of the New Jersey Coastal Plain and the Merchantville Formation farther
to the south (Owens and Minard, 1970). The transitional contact between the Woodbury and the Englishtown "is characterized by a gradual increase in sand-sized quartz and a decrease in silt and clay" (Owens and Sohl, 1969, p. 244). The Englishtown Formation along its outcrop in the northern part of the Coastal Plain is typically a series of light-gray to white thin· cross-stratified fine- to medium-grained lignitic quartz sand beds intercalated with thin beds of dark-gray sandy silty clay and clayey silt. A marine and marginal marine origin has been established for parts of the Englishtown, especially along its outcrop south of Trenton. The internal structure of the Englishtown indicates an alluvial origin for the formation exposed between Trenton and Raritan Bay (Owens and Sohl, 1969, p. 245); in the vicinity of Raritan Bay a shallow-water to beach-complex environment of deposition is suggested by Minard (1969) and Seaber (1965).
The formation in the subsurface in northern, northwestern, and western Monmouth County seems to retain most of the lithologic characteristics displayed in outcrop. However, along a line extending roughly from Long Branch westward to the Freehold area and then southwest through extreme northwestern Ocean County, the Englishtown can be subdivided into two or three ill-defined thick dominantly sandy zones separated by one or two indistinct silty zones, which range in thickness from about 5 to 15 ft (1.5 to 4.6 m). This lithologic subdivision can be traced downdip into southeastern Monmouth County and northern and eastern Ocean County, where the formation can be subdivided into three distinct lithologic units over an area extending from north of Lakewood east to Point Pleasant, south to Toms River, and southwest into east-central Burlington County (fig. 5). The upper and lower units consist of light-colored fine- to very fine-grained
lignitic quartz sand with thin interbeds of dark sandy silt. These units are separated by a thick sequence of dark-gray sandy and clayey lignitic silt beds. The uppermost sand pinches out, apparently grading laterally into the silty lithofacies somewhere between Mantoloking and Normandy Beach and between Toms River and Lavallette. Farther southeast at Island Beach State Park the very fine-grained silty sand to sandy lithofacies predominates.
Seaber (1965) restricted the name Englishtown Formation to the quartz sand lithofacies, as described in outcrop, limiting the name Englishtown to a distinctive water-bearing rock-stratigraphic unit. However, Owens and Sohl (1969) and Owens, Minard, Sohl, and Mello (1970) include more than one
12

EXPLANATION
mmrrn OUTCROP OF THE ENGLISHTOWN FORMATION
STRUCTURE CONTOUR ON TOP OF ENGLISHTOWN FORMATION SHOWING ALTITUDE IN FEET. DATUM IS MEAN SEA LEVEL.
CONTOUR INTERVAL 100 FEET
(CONVERSION FACTOR· I FOOT" 0. 3048 METER I
SCALE
10 MILES
10
FIGURE 4. --STRUCTURE CONTOURS OF THE TOP OF THE ENGLISHTOWN FORMATION IN MONMOUTH AND NORTHERN OCEAN COUNTIES, N.J.
13

A A'
MARSHALLTOWN FORMATION
upper sand lithofacies
ENGLISHTOWN
clayey slit lithofacies
""'V~l1!,;,, ------FORMATION---
lower sand lithofacies
.-..: ,,;,,(·":&,\.("~
j ....
.. ::0
..
s] ~A'
upper aand lithofacies
ENGLISHTOWN
clayey silt lithofacies
0 5· 10 MILES
0 5 10 15 KILOMETERS
vertical txQ9Geralion X 417
FIGURE 5 • --CROSS SECTIONS A-A' AND 8-B' SHOWING THE SAND AND CLAYEY SILT LITHOFACIES ON NATURAL GAMMA RADIATION LOGS OF THE ENGLISHTOWN FORMATION IN NORTHERN
E C SS-SE S 3
._j
.-l

lithofacies in the formation. This report follows the usage of Owens and Sohl and includes more than one lithofacies in the Englishtown. The lowermost sand in the subsurface of Ocean County, previously not recognized as part of the Englishtown, can be traced northward into the more typical Englishtown sequence in Monmouth County. The middle silty sequence is included in the formation because of its stratigraphic position between the two sand units; it is probably continuous with one of the silty zones observed in the subsurface of central Monmouth County.
The thickness of the Englishtowu along its outcrop Ln the northern New Jersey Coastal Plain ranges from about 140 ft (43 m) near Raritan Bay to about SO ft (lS m) near Trenton. The formation averages about 100 ft (30
·thick in the subsurface throughout most of central Monmouth County. It gradually thickens to about 160 ft (49 m) in northern Ocean County and attains a maximum thickness of more than 200 ft (61 m) in the Toms River area of east-central Ocean County (fig. 6, table 2)e Figures 7, 8, and 9 show the thickness of each of the three units into which the Englishtown can be subdivided in southeastern Monmouth County and northern Ocean County. Figure S shows these units in cross section. The upper sand unit thins southeastward from a maximum thickness of more than 80 ft (24 m) in northern Ocean County to less than 40 ft (12 m) near Toms River and about 20 ft (6 m) at Mantoloking@ This lithofacies is absent from the section at Island Beach. The middle silt sequence thickens southeastward from about 20ft (6 m), where it can be clearly identified in northern Ocean County and southeastern Monmouth County to more than 130 ft (39 m) in the Toms River-Lavallette area. The lower sand had an average thickness of between 30 and 40 ft (9 and 12 m) in north-central Ocean County. The unit thic~ens slightly toward the southeast to a maximum of about SO ft (lS m) at Toms River and Lavallette. It cannot readily be recognized in the section at Island Beach State Park.
The Marshalltown Formation, which overlies the Englishtown throughout the New Jersey Coastal Plain is a massive dark-greenish-black fine- to very fine-grained clayey glauconite-quartz sand and silt. The abrupt contact between the Marshalltown and Englishtown and the presence of reworked Englishtown material in the basal few feet of the Marshalltown suggest a disconformable relationship (Owens and Sohl, 1969). The formation is remarkably uniform in thickness along its entire outcrop in New Jersey, ranging from 10 to 20 ft (3 to 6 m). The same uniformity is observed everywhere in the subsurface of the northern Coastal Plain of New Jersey.
The overlying Wenonah Formation is a poorly sorted dark silty very fine to fine sand. The contact with the underlying Marshalltown is gradational. The Wenonah obtains a maximum thickness in outcrop of about 70 ft (21 m) in the vicinity of Mount Holly, N.J. (Minard and others, 1964) •. It thins along the outcrop both to the northeast and southwest. Minard (1969, 196S) reports a thickness of 2S to 30 ft (7.6 to 9 m) near Raritan Bay and 15 to 25 ft (4.S to 7.6 m) in extreme southwestern New Jersey. A similar range in thickness is observed in the subsurface of the northern Coastal Plain of New Jersey, although accurate identificatibn of the formation on geophysical logs is difficult.
15

EXPLANATION
OUTCROP OF
mm1mom THE ENGLISHTOWN FORMATION
-4o-ISOPAcH SHOWING THICKNESS IN FEET
CONTOUR INTERVAL 20 FEET,
(CONVERSION FACTOR: I FOOT • 0.3048 METER)
SCALE
10 MILES
10
400
oo'
FIGURE 6. --THICKNESS OF THE ENGLISHTOWN FORMATION IN MONMOUTH AND NORTHERN OCEAN AND BURLINGTON COUNTIES, N.J.
16

EXPLANATION
ffiilliiDITIO OUTCROP OF THE ENGLISHTOWN FORMATION
-4olsaPACH SHOWING THICKNESS IN FEET. DASHED WHERE INFERRED.
CONTOUR INTERVAL 20 FEET.
I CONVERSION FACTOR: I FOOT , 0. 30 4 8
SCALE
10 MILES
10
FIGURE 7. --THICKNESS OF THE LOWER SAND LITHOFACIES OF THE ENGLISHTOWN FORMATION IN NORTHERN OCEAN COUNTY, N.J.
17

EXPLANATION
OJUIIillO]J OUTCROP OF THE ENGLISHTOWN FORMATION
-zoISOPACH SHOWING THICKNESS IN FEET
CONTOUR INTERVAL 20 FEET
FACTOR' I FOOT • 0. 3048 METER)
SCALE
10 MILES
10
40°
15'
400
oo'
FIGURE 8 • --THICKNESS OF THE CLAYEY SILT LITHOFACIES OF THE ENGLISHTOWN FORMATION IN NORTHERN OCEAN COUNTY, N.J.
18

EXPLANATION
OUTCROP OF
mmiiDITID THE ENGLISHTOWN FORMATION
-40-
ISOPACH SHOWING THICKNESS IN FEET
CONTOUR INTERVAL 20 FEET
(CONVERSION Fi\CTOR' I FOOT' 0. 3048 METER)
SCALE
10 MILES
10
FIGURE 9 . --THICKNESS OF THE UPPER SAND LITHOFACIES OF THE ENGLISHTOWN FORMATION IN NORTHERN OCEAN· COUNTY, N.J.
19

Monmouth Group
Overlying the Wenonah Formation of the Matawan Group in the northern Coastal Plain of New Jersey is a sequence of medium- to coarse-grained quartz and glauconite sands named the Monmouth Group which is divided into four formations. The Wenonah Formation is the oldest and grades upward into the Mount Laurel Sand, which, like other coarse clastic units in the Coastal Plain, consists of more than one lithofacies along its outcrop. Near Raritan Bay the Mount Laurel consists of light-colored thin-bedded fine- to mediumgrained glauconite sand with thin interbeds of dark clay and silt. This facies interfingers along strike to the southwest with a massive-bedded darkgray medium sand, which constitutes the formation near Trenton. The thickness of the Mount Laurel ranges from 20 to 70ft (6 to 21m). The Navesink Formation, a massive dark-colored clayey glauconite sand ranging in thickness from 5 to 35ft (1.5 to 10.6 m), abruptly overlies the Mount Laurel throughout the New Jersey Coastal Plain. The Navesink grades upward into the Red Bank Sand, which has been subdivided into two members; a lower member of dominantly massive dark silty sand, which grades laterally into a glauconitic sand, and an upper member of light-colored fine to coarse sand. The Red Bank has a maximum thickness of about 130 ft (39.6 m) in the Raritan Bay area, but pinches out downdip and along strike to the southwest. The Red Bank is overlain by the Tinton Sand; the contact between the two formations is gradational. The Tinton is a fine to medium glauconite-quartz to quartz-glauconite sand, which, like the underlying Red Bank, occurs only in the northern part of the New Jersey Coastal Plain. Its maximum thickness in outcrop is about 25ft (7.6 m). The top of the Cretaceous section in New Jersey is marked by a generally subtle unconformity with the basal Tertiary sediments overlapping progressively lower beds in the Cretaceous section from northeast to southwest (Minard and others, 1969).
GEOHYDROLOGY OF THE ENGLISHTOWN AQUIFER SYSTEM
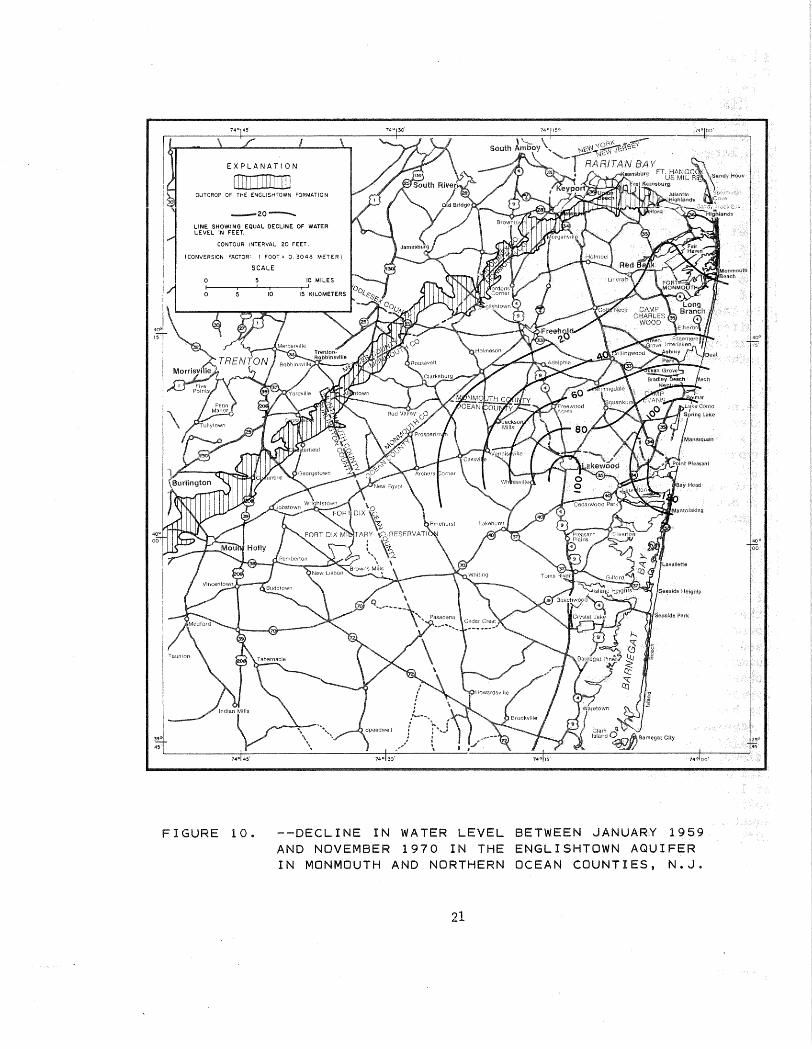
The quartz sand lithofacies (two units shown on fig. 5) of the Englishtown Formation, hereafter referred to as the Englishtown aquifer, are utilized as a source of water throughout an area of about 1,100 mi2 (2,849 km2) of the New Jersey Coastal Plain (fig. 1) (Seaber, 1965, p. Bl6). It is an important source of water supply in the northeastern Coastal Plain in Monmouth County and northern Ocean County. The aquifer is less developed in Burlington, Camden, Gloucester, and Salem Counties to the southwest, largely because ·of a decrease in thickness and water-yield capabilities, and the presence of other more productive aquifers. Total ground-water withdrawals for public supply in Monmouth and northern Ocean Counties increased from about 5.5 Mgal/d (0.24 m3/s) in 1959 to about 9.5 Mgal/d (0.4 m3/s) in 1970. Water levels in some parts of this area are declining 8 to 12 ft (2.4 to 3.6 m) per year and have declined more than 100 ft (30 m) near centers of pumping between 1959 and 1970 (fig. 10).
The Englishtown aquifer, together with the underlying and overlying beds, constitute the Englishtown a~uifer system. This system is,
20
-zo---LINE SHOWING EQUAL DECLINE OF WATER LEVEL IN FEET.
CONTOUR INTERVAL 20 FEET.
FACTOR: I FOOT' 0. 3048 METER)
SCALE
10
oo'
FIGURE 1 0. --DECLINE IN WATER LEVEL BETWE~N JANUARY 1959 AND NOVEI\1BER 1970 IN THE ENGLISHTOWN AQUIFER IN MONMOUTH AND NORTHERN OCEAN COUNTIES, N.J.
21

in turn, a subsystem of the larger Coastal Plain aquifer system of New Jersey. The overlying confining bed, which includes the Marshalltown Formation and part of the Wenonah Formation, provides the interconnection between the Englishtown subsystem and the overlying part of the larger system. The Merchantville Formation and Woodbury Clay, which together constitute the lower confining bed, perform the same function with respect to that part of the larger system underlying the Englishtown.
Aquifer Geometry and Boundaries
The thickness of the Englishtown aquifer in Monmouth County and the upper sand lithofacies of the aquifer in northern Ocean and Burlington Counties is shown in figure 11. Throughout most of Monmouth County the aquifer includes the entire thickness of the Englishtown Formation. In southeastern Monmouth County and northern Ocean and Burlington Counties, however, only the upper sand lithofacies (fig. 9) is included as part of the aquifer. Because of the lack of data, the lower sand lithofacies (fig. 7) is not included in the aquifer for the purposes of this study, even though it is lithologically and hydrologically continuous with the aquifer over some undefined area across southern Monmouth County.
The outcrop of the upper contact of the Englishtown Formation marks the northwestern boundary of the confined part of the aquifer. The southward extent of the aquifer into southern Ocean County cannot be determined because of a lack of data. The eastward extent and thickness trends of the aquifer, beyond the New Jersey coast, are also unknown. The thickest parts of the aquifer are in northeastern Monmouth County and south-central Monmouth and north-central Ocean Counties, where it is more than 120 ft (36 m) thick. The aquifer generally thins toward the south into central and eastern Ocean County.
Aquifer Coefficients
Two pumping tests of the Englishtown aquifer have been conducted; one at Lakewood in north-central Ocean County on May 14 and 15, 1959, and the other near Allenwood in Wall Township in extreme southeastern Monmouth County on November 28, 1959. The Theis (1935) nonequilibrium formula was used in 1959 to evaluate the data collected during both of these tests. This formula, however, does not take into account the leaky nature of the aquifer. Consequently, the transmissivity ascribed to the Englishtown by previous investigators (Seaber, 1965; Rush, 1968; Anderson and Appel, 1969) generally has been too large. The data collected during the two pumping tests were re-evaluated during this study using the Hantush (1960) modified leaky aquifer theory. The transmissivity computed from the drawdown data at Lakewood using the Theis equation was 1,300 ft2/day (square feet per day)
2[121m /day (square meters per day)]. This compares with a transmissivity 2of 1,100 ft /day (102m2/day) computed from drawdown data with the Hantush
modified equations. The storage coefficients computed with the Theis equation were 2.7 x lo-4. These compare with a storage coefficient of 2.2 x
computed with the modified leaky aquifer equations.
22

OUTCROP OF THE ENGLISHTOWN FORMATION
--eo-IsoPAcH SHOWING THICKNESS IN FEET. DASHED WHERE INFERRED.
CONTOUR INTERVAL 20 FEET.
(CONVERSION FACTOR ' I FOOT = 0.3048 METER l
DATA CONTROL •
POINT
SCALE 5 10 MILES
FIGURE 11'! --THICKNESS OF THE ENGLISHTOWN AQUIFER IN MONMOUTH COUNTY AND OF THE UPPER SAND LITHOFACIES OF THE ENGLISHTOWN AQUIFER IN NORTHERN OCEAN AND BURLINGTON COUNTIES, N.J.
23

The drawdown and recovery data obtained during the test at Allenwood 2were used in the Theis equation to compute transmissivities of 1,200 ft /day
2 2(111m /day) and 1,300 ft /day (121m2/day). These same drawdown data were 2used to compute a transmissivity of 1,100 ft /day (102 m2/day) with the
Hantush modified leaky aquifer equations. The storage coefficients computed with the Theis equations
_c;: were 8.8 x lo-5 and 8.3 x lo-5 which are close to
the value of 7 .. 6 x 10--' computed with the modified leaky aquifer equations.
The aquifer thickness in the vicinity of the Lakewood test is between 70 and 75 ft (21 and 23m). The hydraulic conductivity, using the value of transmissivity computed with the modified leaky aquifer equations, is about 15 ft/day (feet per day) [4.6 m/day (meters per day)]. At Allenwood the hydraulic conductivity is about 12 ft/day (4.6 m/day) based on an aquifer thickness of approximately 90ft (27m).
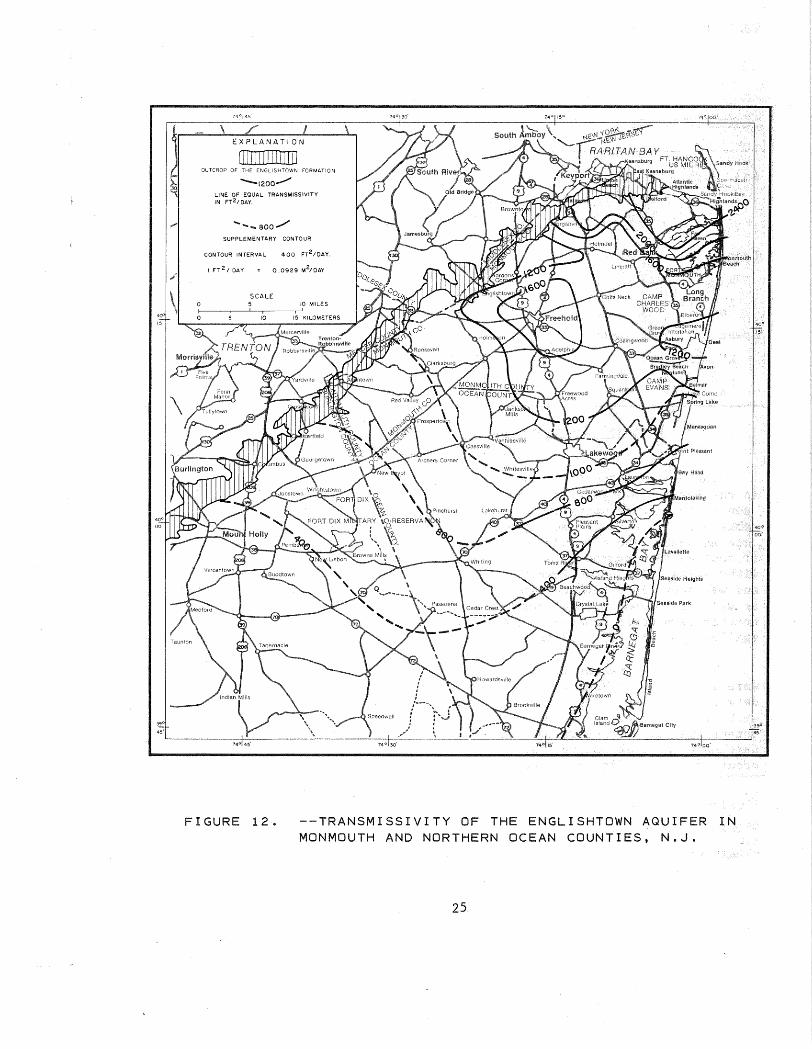
Additional values of transmissivity have been estimated using specific capacity data from large diameter wells. The estimated transmissivities range from 650 ft2/day (60m2/day) to 2,400 ft2/day (223m2/day) (table 3). The technique used (Hurr, 1966) to make these estimates is based on a manipulation of the Theis equation. The approach suffers from the same shortcomings as applying the Theis equation to aquifer test data since water released from storage in the confining layers is neglectedc The estimates serve as a guide, however, to the approximate range of transmissivity that might reasonably be expected. Hydraulic conductivity values obtained from the estimated transmissivities range from 11 ft/day (3.3 m/day) to 20 ft/day (6.1 m/day)., The mean and median of 15 values of hydraulic conductivity is 15 ft/day (4.5 m/day). This compares very well with the mean hydraulic conductivity of 13.5 ft/day (4.1 m/day) computed from the results of the two aquifer tests using the modified leaky aquifer equations. The extreme and average values of aquifer hydraulic conductivity and specific storage for the aquifer and confining layers are given in table 4. The transmissivity of the Englishtown aquifer which is based on all available data is shown in figure 12.,
Table 3.--Estimated transmissivity and hydraulic conductivity of the Englishtown aquifer based on the specific capacity of selected wells
T K Well No. (ft2/day)- (m2/day) (ft/day) (m/ day)
Red Bank Boro 2 2,400 223 17 5.2 Belmar Boro 11 1,400 130 16 4.9 Spring Lake Boro 3 960 99 12 3.6 Brielle Boro 2 1,100 102 14 4 .. 2 Lakewood Water Co. 6 1,100 102 16 4.9 Point Pleasant Water Dept .. 1 740 69 12 3.6
do. 2 900 84 15 4 .. 6 do. 3 750 70 12 3.,6
Central RR of New Jersey 1,100 102 19 5 .. 8 Ocean County Water Co .. Bay Head 6 650 60 13 3 .. 9 Lavoie Labs 1,600 149 20 6 .. 1 Frank Gumina 1,900 176 17 5 .. 2 Anthony Verange 2,000 186 20 6 .. 1 Laura Harding 1,200 111 12 3 .. 6 U.s .. Army, Camp Evans Bldg., 82 1,000 93 11 3 .. 3
24
\ I EXPLANATION
OUTCROP OF THE ENGLISHTOWN FORMATION
--1200 ..........
LINE OF EQUAL TRANSMISSIVITY IN FT2/DAY .
........... aoo/ SUPPLEMENTARY CONTOUR
2CONTOUR INTERVAL 400 FT /DAY.
2 2I FT I DAY 0.0929 M /0AY
SCALE 5 10 MILES
FIGURE 12. --TRANSMISSIVITY OF THE ENGLISHTOWN AQUIFER IN MONMOUTH AND NORTHERN OCEAN COUNTIES, N.J.
25

Table 4.--Extreme and average values of hydraulic coefficients of the aquifer and confining layer
(K - hydraulic conductivity)
(S - specific storage) s
Maximum Minimum
A .f l/ qu1. er:-
K (ft/sec) 2 .. 31 X 1()-4 .LV 1.29 X
1 (\ -4 .LV 1.,65 X 10-4
s s
Upper
K'
s ' s
Lower
K"
s H
s
(1/ft) 2 .. 98 X 10-6 8 .. 48 X 10-7
confining layer:
(ft/sec) 5,.7 X 10-9 6.5 X 10⁻¹¹
(1/ft) 9.,2 X 10-5 5 .. 1 X 10⁻⁵
• confining layer:
(ft/sec) 6.9 X 10⁻¹⁰ 4.2 X 10⁻¹¹
(1/ft) 4 .. 6 X 10⁻⁴ 9.6 X 10⁻⁵
2:.1
1 .. 7 X 10⁻¹⁰
7 .. 1 X 10⁻⁵
7.6 X 10⁻¹¹
8.8 X 10 .. 5
Regional Configuration of the Potentiometric Surface and Water-level Trends
The approximate configuration of the prepumping potentiometric surface in the Englishtown aquifer in Monmouth, Ocean, and Burlington Counties has been reconstructed using the earliest available water-level data (fig. 13, table 5). The data are mostly from the period 1890-1900, but some are as late as 1920. The altitude of the surface in the Belmar-Spring Lake area of southeastern Monmouth County probably reflects the effects of pre-1900 withdrawals. The potentiometric surface was everywhere above sea level and was above land surface along the coastal areas south of Long Branch as well as in some inland areas. Several wells drilled at Lakewood in northeastern Ocean County in 1899 flowed between 100 and 150 gal/min (gallons per minute) [6.3 and 9.4 1/s (liters per second)] at land surface.
Water-level measurements obtained in December 1958 and January 1959 were available for Monmouth and Ocean Counties (table 6). Well construction data are shown on table 7. It is apparent from these data that ground-water withdrawals between 1900 and 1959 caused a significant lowering of the potentiometric surface in eastern and southeastern Monmouth County and northeastern Ocean County (fig. 14) .. A decline of 40ft (12m) or more occurred over a wide area, and a decline of more than 100 ft (30 m) occurred
l/calculated from aquifer test data
~/Insufficient field data 3- /H armon1.c . mean va 1 ues.
26

\
EXPLANATION
OUTCROP OF
lTIIDiilliTTIJ THE ENGLISHTOWN FORMATION
-4oISOPOTENTIAL LINE SHOWING ALTITUDE IN FEET. DATUM IS MEAN SEA LEVEL.
CONTOUR INTERVAL 20 FEET.
{CONVERSION FACTOR· I FOOT • 0. 30 4 8
SCALE
10 MILES
10
4()0
oo'
FIGURE 13. --ALTITUDE OF THE POTENTIOMETRIC SURFACE IN THE ENGLISHTOWN AQUIFER ABOUT 1900 IN MONMOUTH AND NORTHERN OCEAN AND BURLINGTON COUNTIES, N.J.
27

OUTCROP OF THE ENGLISHTOWN FORMATION
-4olsoPorENTIAL LINE SHOWING ALTITUDE, IN FEET. DATUM IS MEAN SEA LEVEL.
CONTOUR INTERVAL 20 FEET
(CONVERSION FACTOR' I FOOT = 0.3048 METER)
DATA CONTROL •
POINT
SCALE 10 MILES
FIGURE 14. --ALTITUDE OF THE POTENTIOMETRIC SURFACE IN THE ENGLISHTOWN AQUIFER IN JANUARY 1959 IN MONMOUTH AND NORTHERN OCEAN COUNTIES, N.J.
28
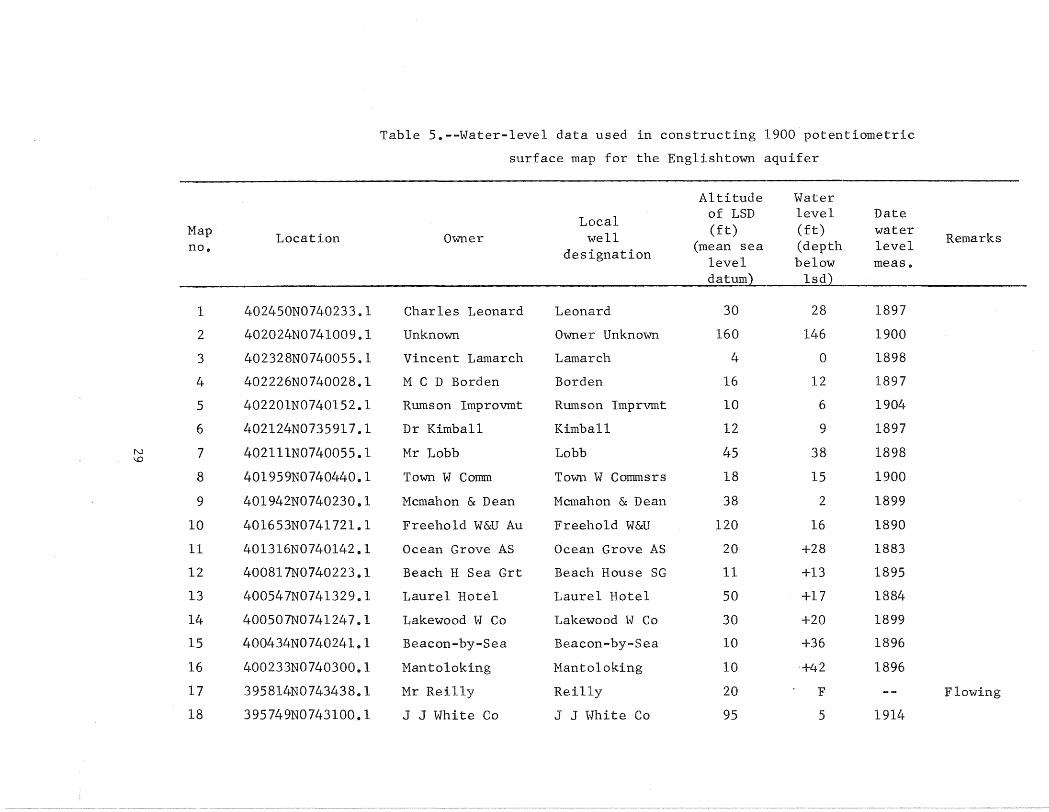
Table 5.--Water-level data used in constructing 1900 potentiometric
surface map for the Englishtown aquifer
Altitude Water
Local of LSD level Date Map Location Owner well (ft) (ft) water
Remarks no .. designation
(mean sea (depth level level below meas .. datum) lsd)
1 402450N0740233.1 Charles Leonard Leonard 30 28 1897
2 402024N0741009.1 Unknown Owner Unknown 160 146 1900
3 402328N0740055.1 Vincent Lamarch Lamarch 4 0 1898
4 402226N0740028.1 M C D Borden Borden 16 12 1897
5 402201N0740152.1 Rumson Improvmt Rumson Imprvmt 10 6 1904
6 402124N0735917.1 Dr Kimball Kimball 12 9 1897
7 402111N0740055.1 Mr Lobb Lobb 45 38 1898
8 401959N0740440.1 Town W Cormn Town W Cormnsrs 18 15 1900
9 401942N0740230.1 Mcmahon & Dean Mcmahon & Dean 38 2 1899
10 401653N0741721.1 Freehold W&U Au Freehold W&U 120 16 1890
11 401316N0740142.1 Ocean Grove AS Ocean Grove AS 20 +28 1883
12 400817N0740223.1 Beach H Sea Grt Beach House SG 11 +13 1895
13 400547N0741329.1 Laurel Hotel Laurel Hotel 50 +17 1884
14 400507N0741247.1 Lakewood W Co Lakewood W Co 30 +20 1899
15 400434N0740241.1 Beacon-by-Sea Beacon-by-Sea 10 +36 1896
16 400233N0740300.1 Mantoloking Mantoloking 10 +42 1896
17 395814N0743438.1 Mr Reilly Reilly 20 F -- Flowing
18 395749N0743100 .. 1 J J White Co J J White Co 95 5 1914
N \0

Table 6.--Yield and water-level data for wells developed in the Englishtown aquifer in Monmouth and Ocean Counties
ALTI- DATE DATE DATE LOCAL TUDE- DRAW PUMPING SPECifiC WATER WATER WATER WATER WATER WATER
MAP OWNER WELL Of LSD YIELD DOWN PERIOD CAPACITY LEVEL LEVEL LEVEL LEVEL LEVEL LEVEL NO NUMBER (fT) (GAL/MIN) (fT) <HOURS) (fT) MEASURED (fT) MEASURED <FT) MEASURED
1 L W BAHREN8URG BAHRENBURG 1 60 -- 6 8 -- 13 1-52 2 EDWARD LESKE LESKE 3 25 5 6 -- 0 .. 8 10 11-52 3 ATLAN HIGH W D AHWD 2 15 -- -- -- -- 16 -23 41() l-59 14 11-70 4 A W ZELINSKI 1 8() 60 14 4 4.,3 26 8-63 5 LILY TULIP CUP LILY STAND BY 65 -- 32 4 -- 19 1-62
6 LILY TULIP CUP LILY TULIP l 65 500 44 8 u .. 4 25 2-62 7 LILY TULIP CUP LILY TULIP 2 55 -- 32 8 -- 26 2-62 8 LAVOIE LAB LAVOIE LAB 1 180 110 30 19 5.7 85 10-48 9 B EDUC MARLBORO BOARD Of ED l 180 60 18 -- 3.3 70 7-48
10 8 EDUC MARLBORO ·BoARD OF ED 2 -- 150 28 -- 5.4 64 9-67
11 DOhlALD AHLERS -- 121 10 -- -- -- 40 5-64 12 L F GRANDINETTI -- 70 30 28 -- 1.1 35 12-55 13 JOSEPH STAVELA -- 180 12 ll 12 le1 178 5-51 14 GARDEN ST PKWY TELEGRAPH HILL 234 -- -- -- -- -- --15 RICHARD CARROLL -- 95 15 6 -- 2.5 22 12-53
16 JOHN GARRISON -- 100 10 13 4 o.8 17 1-54 17 u s ARMY NIKE BASE 305 30 58 -- o.5 215 12-57 18 NEIL BPY -- 210 10 20 -- o.s 221 4-63 19 f & f NURSERIES Ff NURSERIES 1 135 60 90 6 0.7 60 2-54 20 G HUBENY -- 250 10 30 -- 0.3 180 1-54
21 ANTHONY VERANGE VERANGE 1 250 30 4 4 7 .. 5 174 -54 22 HARMYK AND SONS HARMYK l 205 350 56 9 6.2 174 l-56 23 W J DUNCAN -- 145 20 23 -- o .. 9 75 8-54 24 B~LL TELE CO BELL LAB 3 120 300 -- -- -- 40 10-66 25 BELL TELE Co BELL LAB 2 120 300 -- -- -- 51 10-60 66 ll-70
26 BfLL TELE CO BELL LAB 1 120 300 -- -- -- 54 12-66 27 JOSEPH MORREL MORREL 76 -- -- -- -- 5 9-55 2 -59 28 ROy DENSON DENSON 1 100 15 5 -- 3.0 5 l0-64 29 MRS HARDING HARDING l 120 35 8 -- 4e4 50 1-49 30 NICK PETRUZELLA -- 130 25 62 4 0.4 43 10-49
31 RED BANK W D RBWD 2 30 525 53 -- 9.9 21 4-56 13 -59 32 NOVAK HULSART 110 -- -- -- -- 16 1-58 34 ll-70 33 RUMSON C CLUB RUMSON C C 1 1 -- -- -- -- -- -- 12 U-70 34 JOHN LEMLI -- 160 10 20 -- o.s 10 5-54 35 MARLBORO S HOSP STATE HOSP 6 140 200 92 -- 2.2 57 10-69
36 MARLBORO S HOSP STATE HOSP 13 140 310 54 -- 6.9 62 H-53 59 11•70 37 MARLBORO S HOSP STATE HOSP 14 125 300 -- -- -- -- --38 MRS A ONORATO -- 120 9 38 -- 0.2 35 7-53 39 RED BANK W D R8WD 3 35 421 159 -- 2.6 25 6-46 39 11-70 40 W SCHIE>...,EYER -- 80 15 -- -- -- 18 9-53
w 0

Table 6.--Yield and water-level data for wells developed in the Englishtown aquifer in Monmouth and Ocean Counties--Continued
ALTI- DATE DATE LOCAL TUDE- DRAW PUMPING SPECIFIC WATER WATER WATER WATER WATER
MAP Ow~ER WELL oF LSD YIELD DOWN PERIOD CAPACITY LEVEL LEVEL LEVEL LEVEL LEVEL NO NUMBER (FT) (GAL/MIN) (fl) <HOURS) eFT) MEASURED (Fif) MEASURED (fT) MEASURED
41 MARLBORO S HOSP STATE HOSP 4 125 100 42 MARLBORO S HOSP STATE HOSP 5 135 100 43 MON BCH CLD STR MBCS 2 10 480 136 8 3.5 12 4-61 44 H&L FAQMS -- 160 55 as 6 0.,6 62 8-51 45 R E MORGAN -- 140 20 70 6 0.,3 so 12-47
46 HENRY HIGGINS -- 170 12 27 -- Oe4 73 7-54 47 M ROSENBERG ROSENBERG 1 8() 100 40 8 2.,5 35 1-57 43 U-70 48 J p FoCARILE fOCARILE 95 10 30 -- 0.3 28 1-64 49 VILLAGE WC VILLAGE 215 120 292 110 48 2.7 44 9-64 50 OLD ORCHARD C C OLD ORCHARD 1 40 200 180 10 1.1 20 4-52
51 CEDAR OR EL SCH -- 122 75 100 8 o.7 45 12-63 52 GEORGE THOMPSON -- 100 10 8 -- 1 .. 2 12 10-54 53 R H '-1ACY & CO BAMBERGER TEST 70 123 63 24 2.0 67 9-57 54 E R DURAND -- 180 15 30 -- o .. s 80 3-60 55 TAYLOR PALMER 1 90 15 13" -- 1.2 22 12-55
56 TENNENT ORCH I -- 130 12 70 -- o.2 35 10-54 57 SO GULF UTIL SO GULF l 200 80 140 8 0.,6 uo 8-64 58 ATLANTIC TWP SC ATLANTIC SCH 1 86 25 30 -- 0 .. 8 30 10-54 ll09 11-70 59 K A JAOASSOHN -- 120 10 30 -- 0 .. 3 30 1-56 60 ROY H KIRSHNER -- 95 10 27 -- 0.4 20 10-53
61 FREEHOLD TWP WO POINT IVY 1 130 1486 159 72 9.3 16 9-67 l1 ll-70 62 ABE COHEN -- 84 12 -- -- -- 37 8-53 63 FRANK GUMINA GUMINA 1 190 200 30 8 6.7 75 U-53 64 MON~OUTH COUNTY MD CO C H 2 110 275 140 12 2.0 81 9-54 65 AM KARAGHEUSIAN l 150 240 88 -- 2.7 87 l-48
66 80Y SCOUTS AMER QUAIL HILL l 250 65 -- -- -- 1401 8-67 67 MR SCATUORCHIO SCATUORCHIO 1 140 30 60 8 o.s 60 8-50 68 F J MOREAU -- 185 -- -- -- -- -- -- 72 1-59 69 GEORGE MOuNT MOuNT 2 }35 12 25 6 o.s 10 10-53 ....... --70 MANALAPAN W C M.b.NALAPAN 1 122 240 1s4 6 1.6 2 4-67 4 11•70
71 S WURTZEL -- 180 10 7 -- 1.4 40 l0-53 72 C BOROUNOVICH -- 160 10 40 -- o.2 42 3-54 73 BROCKWAY GLASS BROCKWAY l 130 220 56 -- 3.9 44 -- 47 11-70 74 SEASIDE INvEST -- 160 20 62 8 o.3 58 9-63 75 LF:ON VASSEUR -- 140 10 3 -- 3.3 9 6-52 9 12-58
76 ARE KUHL -- 230 10 34 -- o.3 so 12-56 77 CLAYTON WM D CLAYTON 2 180 530 154 9 3,.4 56 3-55 79 l-59 78 0 MAYK -- 145 12 35 4 0.3 65 10-49
79 HENRY WIKOFF -- us 14 15 -- o .. 9 10 7-53 80 FREEHOLD TWP WD KOENIG LANE 2 130 130 160 6 o .. s 41) l0-66 42 ll.-70
w 1--'

Table 6.--Yield and water-level data for wells developed in the Englishtown aquifer in Monmouth and Ocean Counties--Continued
ALTI- DATE DATE DATE LOCAL TUDE- DRAW PUMPING SPECIFIC WATER WATER WATER WATER WATER WATER
MAP OWNER WELL Of LSD YIELD DOWN PERIOD CAPACITY LEVEL LEVEL LEVEL LEVEL LEVEL LEVEL NO NUMBER (fT) (GAL/MIN) (fT) (HOURS} (fT) MEASURED (ff) MEASURED (fT> MEASURED
81 ALLENHURST W 0 AWO 2 10 525 169 -- 3.1 45 7-50 82 ALLENHURST W D AWO 4 10 524 123 8 4.3 90 7-50 4·4 1-59 84 H-70 83 ASBURY PARK W 0 APWO 4 10 500 160 8 3 .. 1 -- 5-63 -·- --84 MONMOUTH CON WC WHITESVILLE 3 10 465 162 4 2.9 so 3-54 108 U-70 85 MONMOUTH CON WC OCEAN GROVE 20 20 300 134 -- 2·2 61 6-49 14·1 H-70
86 FARMINGDALE W D fARMINGDALE 1 80 300 -- -- -- -- -- 71 1-59 87 FARMINGDALE W D FARMINGDALE 2 80 90 155 -- o.6 45 1-49 88 fARMINGDALE W 0 FARMINGDALE 4 85 302 118 8 2.6 130 12-70 89 FARMINGDALE W D FARMINGDALE ~ 80 300 146 8 2.1 86 8-64 90 MRS ERRICKSON -- 130 5 93 -- o.l 37 9-54
91 MR VANHISE -- 145 10 85 -- o.l 35 7-54 92 BELMAR BORO WD BWD 4 ELEC 15 630 103 -- 6.1 62 7-41 151 11•70 93 DEPT OF ARMy IMPERIAL PARK2 100 302 73 -- 4.1 87 4-43 206 11-70 94 DUNCAN THECKER D T ASSOC 1 100 80 48 -- 1.7 7 6-69 7 U-70 95 BELMAR BORO WD BWD 8 SUB 20
96 BELMAR BORO WD BWD 5 SUB 20 97 BELMAR BORO WD BWD l ELEC 20 -- -- -- -- -- -- 173 H-70 98 BELMAR BORO WD BWD 3 SUB 20 99 BELMAR BORO WD BWO 6 SUB 20
100 BELMAR BORO WD BWD l SUB 20
101 BELMAR BORO 'wo BWD 4 SUB 20 102 BELMAR BORO WO BWD 2 ELEC 20 -- -- -- -- 20 103 BEU>1AR BORO WD BWD 3 ELEC 20 305 162 -- 1.9 100 10-49 104 BELMAR BORO WO BWD 7 SUB 20 -- -- -- -- -- --105 WALL HIP W 0 WEST BELMAR 25 400 225 10 1.8 112 9-59
106 WA.LL TWP W 0 RT 34 WELL so 402 116 8 3.5 206 l-68 242 H-70 107 C I St-HTH -- 130 20 57 -- 0.4 25 8-53 108 U FREEHOLD B ED BoARD EO 1 135 15 121 6 o.1 24 2-51 109 SPRING LAKE W 0 SLWD 4 10 608 us -- 5.3 145 8-65 172 U-70 110 SPRING LAKE W 0 SLWD 3 20 545 128 -- 4.3 62 6-41 120 12-58
111 ALDRICH W Co ALDRICH W CO 4 130 1100 149 8 7.4 165 8-67 185 11-70 112 US GEOL' SURVEY ALLAIRE S P C 96 -- -- -- -- 100 12-63 20'5 U-70 113 SPRING LK HT WO SPRING LK HGT2 60 510 118 8 4.31 125 5-53 114 SPRING LK HT WD SPRING LK HGTJ 25 457 us 8 4.0 180 11-66 206 11-70 115 SPRING LAKE W 0 SLWD 1 15 600 57 -- 1o.s 97 8-40 1415 12-58 196 11-70
116 SPRING LAKE W D SLWD 2 15 535 103 11 5.2 91 7-41 117 E W HARVEY -- us 100 10 -- 10.0 10 8-50 118 JACKSON TWP MUA JACKSON 2 }56 412 109 8 3.8 144 ll-62 231 ll-70 119 WALL HIP W 0 ALLENWOOD 1 100 4oo 100 10 4.,0 185 l0-59 _ ... --120 WALL TWP W D ALLENWOOD 2 8() 400 98 10 4.1 167 11-59 256 H-70
1-v N

Table 6.--Yield and water-level data for wells developed in the Englishtown aquifer in Monmouth and Ocean Counties--Continued
ALTI- DATE DATE DATE LOCAL TUDE- DRAW PUMPING SPECifiC WATER WATER WATER WATER WATER WATER
MAP OWNER WELL oF LSD YIELD DOWN PERIOD CAPACITY LEVEL LEVEL LEVEL LEVEL LEVEL LEVEL NO NUMBER (fy) (GAL/MIN) CFT> CHOURS) <FT) MEAsURED {fT) MEASURED (f'T) MEASURED
121 SEA GIRT W D SGWD 5 20 400 62 8 6.5 178 ll-63 188 H-70 122 SEA GIRT W D SGWD 4 18 310 157 24 2.0 103 7-49 123 ATLEE ZURLO --· 90 20 -- 4 -- 30 9-52 124 JACKSON TWP MUA JACKSON 4 81') 520 ISO 8 3.5 90 7-65 133 H-70 125 HOWELL TWP BD KENT RD 110 120 49 8 2.4 96 2-s5
126 SEA GIRT W D SGWD 3 20 300 54 -- 5,.6 47 127 JACKSON TWP MUA JACKSON 3 140 421 76 8 5,.5 119 5-62 193 H-70 128 JACKSON TWP MUA JACKSON l 110 415 111 8 3 .. 7 10 l 7-61 201 ll-70 129 BRIELLE WATER D BWD 2 33 510 uo -- 4.6 75 2-so uo 12-58 212 U-70 130 ST GABRIELS COL ST GABRIELS 1 70 130 166 -- o.a 34 -57 149 U-70
131 PARKWAY W C PARKWAY 1 45 179 85 5 2·1 81 8-58 132 BRIELLE WATER D BWD 3 90 400 95 -- 4,.2 2~5 -·- 268 ll-70 133 LAKEWOOD W C LAKEWOOD 9 55 412 147 24 2.8 126 5-68 170 u-to 134 LAKEWOOD W C LA"KEWOOD 6 70 503 109 8 4.6 93 ll-60 tao H-70 135 LAKESORE LAUNDR LAKESHORE LA 1 so 70 135 -- o.s so
136 LAKEWOOD W C LAKEWOOD W C 35 137 LAKEWOOD W C LAKEWOOD 2 60 300 -- -- -- 20 138 LAKEWOOD W C LAKEWOOD W C 30 -- -- -- -- +20 139 LAKEWOOD W C LAKEWOOD 5 40 215 91 2 2.4 67 5-57 140 LAKEWOOD W C L~KEWOOD 30 -- -- -- -- 46 -·- 124 U-70
141 PT PLEASANT W D PPWD 3 15 300 11"7 48 2e6 56 4-,+6 224 U-70 142 PT PLEASANT W D PPWD 6 20 517 22~5 8 2.3 146 5-65 143 PT PLEASANT W D PPWD 2 15 265 83 21 3,.2 34 9-36 144 PT PLEASANT W D PPWD l 20 277 5"7 4 4.9 3() 6-36 145 PT PLEASANT W D PPWD 10 -- -- -- -- +35
1-4-6 LAKEWOOD W C LAKEWOOD 8 78 soo 230 8 2.2 84 12-65 194 U-70 1-4-7 CENTRAL RR NJ CENTRAL RR NJ 9 250 65 -- 3.8 20 -- -- --148 US GEOL SURVEY COLL MILLS TWl 137 -- -- -- -- 56 l-64 57 H-70 149 LAKEWOOD W C LAKEWOOD 7 as 350 us 8 3.,0 176 5-64 150 NEW EGYPT WC 1 75 70 -- -- -- +15 l-59
151 OCEAN CO W C BAy HEAD 6 10 338 139 24 2 .. 4 104 9-50 152 OCEAN CO W C BAY HEAD 5 10 220 75 1 2 .. 9 64 3-47 202 ll-70 153 BRADLEES CORP BRADLEES WELL 10 300 177 12 1 .. 7 138 9-69 154 S LAKEWOOD W C S LAKEWOOD 3 45 508 176 8 2 .. 9 143 8-66 155 S LAKEWOOD W C S LAKEWOOD 2 40 400 -- -- -- -- -- 204 u ... 1o 156 S LAKEWOOD W C S LAKEWOOD 1 90 500 -- -- -- -- --· 245 U-70 157 OCEAN CO W C MANTOLOKING 4 5 -- -- -- -- 42 --· -- --158 OCEAN CO W C MANTOLOKING 6 5 239 224 4 l .. l 58 --· 149 U-70 159 LAVALLETTE W D LWD 2 5 512 50 4 10.2 20 4-~11 160 LAVALLETTE W D LWD 3 1 soo 240 3 2..1 58 7-<4,8 161 US GEOL SURVEY TOMS RIVER TW2 15 -- -- -- -- 54 12-65
w w
MAP NO
1 2 3 4 5
6 7 8 9
10
11 12 13 14 15
16
19 20
21 22 23 24 25
26 27 28 29 30
31 32 33 34 35
36 37 38 39 40
w ~
LOCATION
402454N074ll30el 402525No74osoz.I 402441N0740234,.1 402446N074Q9Q9.,l 402441N0740846 .. 1
402441N0740843.,l 402438NQ74Q842 .. 1 402239No741434 .. 1 402232NQ74144lol 402238N0741410.,1
402405N074ll45 .. 1 402354N0740134 .. 1 402323N074o3o7 .. 1 402325NQ741040 .. l 40223BN07415Q6.,1
402238N0741539 .. 1 402235No741125.I 402311N0741249,.1 402223N0741024ol 402210N0741127.l
402210N074ll27.2 402222No740832 .. 1 402208N074l059.l 402256NQ74Q950e1 402208N0740952.,1
402157No74too3 .. 1 402143N0741852 .. 1 40213BNo741532 .. 1 402121N0740942.1 402120N0740919el
402114N07403I5.1 402122NQ741846el 402046N0740l05.1 402035N0741615.1 402l03N0741357 .. 1
402103N0741351.1 402109N0741346 .. 1 402020N0741804.1 402020N07404ll .. l 401921N0742100.l
Table 7.--Construction data for wells developed in the Englishtown aquifer in Monmouth and Ocean Counties
OWNER
L W 8AHRENBURG ED\~ARD LESKE ATLAN HIGH itJ D A W ZELINSKI LILY TULIP CUP
UL Y TULIP CUP LILY TULIP CUP LAVOIE LAB
LOCAL WELL
NUMBER
BAHREt\}BURG 1 LESI\E 3 AHWO 2 1 LILY STAND BY
LILY TULIP 1 LILY TULIP 2 LAVOIE LAB l
B EDUC MARLBORO BOARD Of ED 1 B EDUC MARLBORO BOARD OF ED 2
DONAL[) AHLE..RS --L F GRANDINETTI --JOS~PH STAVELA --GARDEN ST PKWY TELEGRAPH HILL RICHARD CARROLL --JOHN GARRISON --u s ARMY NIKE BASE NEIL BRY --F & F NURSERIES FF NURSERIES 1 G HUBENY --ANTHONY VERANGE VERANGE l HARMYK AND SONS HARMyK l W J DUNCAN --BELL TELE CO BELL LAB 3 BELL TELE CO BELL LAB 2
BELL TELE CO BELL LAB 1 JOSEPH MORREL MORREL ROY DENSON DENSON 1 MRS HARDING HARDING 1 NICK PETRUZELLA --RED BANK W 0 RBWD 2 NOVAK HULS.ART RUMSON C CLUB RUMSON C C l JOHN LEMLI --MARLBORO S HOSP STATE rlOSP 6
MARLBORO S HOSP STATE HOSP 13 MARLBORO S HOSP STATE HOSP 14 MRS A ONORATO --RED BANK w 0 RB\.JD 3 w·scHIE)JIEYER --
MUNICIPALITY
HAZLET TWP MIDDLETOWN TWP ATLANTIC HIGHLAND t-tOLMDEL HIP HOLMDEL TWP
HOLMDEL TWP HOLMDEL TWP MARLBORO TWP MARLBORO TWP MARLBORO TWP
HOLMDEL TWP MIDDLETOWN HIP MIDDLETOWN TWP HOLMDEL TwP MARLBORO TWP
MARLBORO TWP HOLMDEL HIP MATAWAN TWP HOLMDEL HIP HOLMDEL TWP
HOLMDEL HIP MIDDLETOWN TWP HOU1DEL TWP HOLMDEL TWP HOLMDEL TWP
HOU1DEL TWP MADISON TWP MARLBORO TWP HOLMDEL TWP HOLMDEL TWP
RED BANK BORO MARLBORO TWP RUMSON BORO MARLBORO TWP 1-1ARLBORO TWP
MARLBORO TWP MARLBORO TWP MARLBORO TWP RED BANK BORO MANALAPAN TWP
DATE DRILLED <YEAR)
1952 1952 1923 1963 1962
1962 1962 1948 1948 1967
1964 1955 1951 --1953
1954 1957 1963 1954 1954
1954 1956 1954 1960 l96Q
1960 1923 1964 1949 1949
1956 --
1966 1954 1936
1953 1955 1953 1946 1953
ALTITUDE
OF LSD (fT)
60 25 15 80 65
65 55
180 180 --121
70 180 234
95
100 365 210 135 2SO
250 205 145 120 120
120 76
100 120 130
30 1io
1 160 140
140 125 120
35 ao
\NELL DEPTH <FT)
31 20
200 71
102
126 122 152 103 144
lOB 74
248 1044
44
52 318 254 200 228
225 343 176 154 221
214 u 33
210 143
300 19
332 100 184
168 205
81 268
52
CASING DEPTH (fT)
27 ]l6
-·~ 65 82
101 97
140 93 1~3
102 ()4
2~~8
-·~
35
so 298 243 190 223
2JL5 3JL7 H2 -·· 191
1"73 11 30
200 138
2i~5
-·· 96
162
120 --78
228 •+7
CASING DIAMETER CIN)
4 4
----6
12 12
8 6 8
4 6 6 --4
4 10 6 6 6
4 8 6
10 10
10 11 --
6 6
24 54
4 8
----4
10 4
LENGTH Of WELL OPEN TO AQUIFER (fEET)
4 4 --6
21
25 25 12 10 22
6 10
9
2
ll 10
5
10 26
4
30
41
3 10
5
4 12
26
40 5

MAP NO
41 42 43 44 45
46 47 48 49 50
51 52 53 54 55
56 57 58 59 60
61 62 63 64 65
66 67 68 69 70
71 72 73 74 75
76 77 78 79 80
w U1
LOCATION
401937N0741428.l 40l933No741336.1 401927N073Sa42.1 401948N074154l.l 401918N0741507.1
401858N0741506.1 40I8o3No74o8I4.1 401710N0741925.1 40l906No74I514el 401742N074020l.l
401747N074122l.l 40]657NQ741944.,l 401720NQ740315ol 401712N0741428.l 40}7}8N07422l1•l
401644N0741929.l 40l624N07415o2.l 401719N0741016 .. l 401628N0742026 .. 1 40111 ONO 742220.1
401654N0741736.1 401710N0742147.,1 4016181'!0741452.1 40154 71--JO 741640 .l 401545NQ74}6Q3ol
401SS7No74231B.2 40lt:OON0741204.l 401505N0741110,.1 40 15451\!0 742536.1 401518N0742230 .. l
401443N0742320.l 401511N074202lel 40l500No741514•l 40l429N0741254.1 4t1l323NQ742824 .. l
401333N074264Q.l 40133lN074I944.,l 401426NQ74163l .. l 40l323No743118 .. 1 401412N074l606e2
Table ?.--Construction data for wells developed in the Englishtown aquifer in Monmouth and Ocean Counties--Continued
Oi.llt·JFR LOC/l.L
tJt.LL NUMBER
MARLBORO S HOSP STAT~ ~OSP 4 MARLBORO S HOSP STATE HOSP 5 MON BCH CLO STR MBCS 2 H&L FARMS --R E MORGAN --HPJRY HIGGlf'lS --M ROSENBERG ROSEi'IBERG 1 J P FOCARILE FOCARILE VILLAGE WC VILLAGE 215 OLD ORCHARD C C OLD ORCHARD l
CEDAR DR EL SCH --GEORGE THOMPSON --R H I"'ACy & CO BAMBERGER TEST E R DURAND --TAYLOR PALMER 1
TEt'iNENT ORCH' I --SO GULF UTIL SO GULF 1 ATLANTIC TWP SC ATLANTIC SCH 1 K A JADAssOHN --ROY H KIRSHNER --FREEHOLD TWP WD POINT IVY 1 ABE CoHEN --FRANK GUMINA GUMINA 1 MONMOUTH COUNTY MO CO C H 2 AM KARAGHEUSIAN l
BOY SCOUTS AMER QUAIL HILL l 1'-lR SCATUORCHIO SCATUORCHIO 1 F J MORt:AU --GEORGE t-10UNT MOUNT 2 MA~lALAPAN W C t-iANALApA,IJ 1
S ~11URTZEL --C BoRDUNOVICH --BROCKWAy GLASS BROCKWAy 1 SEASIDE INVEST --LEON VASSEUR --ABE KUHL --CLI-IYTON 1dM D CLAYTO"J 2 D MAYK --HENRY WIKOFF --FREEHOLD TWP WD KOENIG LANE 2
MUNICIPALITY
111ARLBORO HIP MARLBORO TWP MONMOUTH BCH 80RO MARLBORO HIP MARLBORO HIP
MARLBORO TWP COLTS NECK TWP MANALAPAN TWP r-IARLBORO TWP IllEST LONG BRANCH
COLTS NECK TWP MANALAPAN TWP EATONTOWN BORO FREEHOLD TWP MANALAPAN TWP
MANALAPAN TWP FREEHOLD TWP COLTS NECK TWP ~~ANALAPAN TWP MANALAPAN HiP
FREEHOLD HIP MANALAPAN TWP FREEHOLD Tlt/P FREEHOLD BORO FREEHOLD BORO
MANALAPAN TWP COLTS NECK TWP FREEHOLD BORO ~1ILLSTONE TWP MANALAPAN TWP
MILLSTONE TWP MANALAPAN TWP FREEHOLD HiP HOl~ELL HIP ROOSEVELT BORO
~1ILLSTONE TWP MANALAPAN TWP FREEHOLD TWP i'HLLSTONE HIP FREEHOLD HIP
DATE DRILLED <YEAR)
--}935 1961 1951 1947
1954 1957 1964 1964 1952
1963 1954 1957 1960 1955
1954 1964 1954 1956 1953
1967 1953 1953 1954 1948
1967 l95Q --
1953 1967
1953 1954 }956 1963 1952
1956 1955 1949 1953 1966
ALTITUDE
OF LSD <FT>
125 135 lo
160 140
110 so 95
120 40
122 100 7o
180 90
130 200
86 120
95
130 84
190 170 ISO
250 140 185 135 122
180 160 130 160 140
230 180 145 us 130
wELL DEPTH <Fn
124 144 430 206 175
176 342 116 215 425
233 86
430 257
60
167 356 280 us 84
212 78
324 323 323
241 250 300
52 185
178 170 260 380
96
160 3.33 310 so
301
CASING DEPTH CFT>
90 110 390 197 160
111 322 100 186 360
213 83
416 249
53
157 327 270 110
80
150 73
304 307 303
;231 ;238 ·--46 125
174 166 240 .364
92
154 :304
;262
CASING DIAMETER <IN)
6 6
10 6 6
4 8 4 8 8
--4 6 6 4
6 8 6 4 4
12 6 6 8 8
6 6 ----
10
6 4 8 4 4
4 10
6 4 6
LENGTH Of WELL OPEN TO AQUIFER (fEET>
1 30 40
9 15
5 20
6 29 20
20 3
14 8
10 29 10
5 4
so 5
20 16 20
12 --
6 60
4 4
4
6 29 10
3

MAP NO
81 82 83 84 85
86 87 88 89 90
91 92 93 94 95
96 97 98 99
100
101 102 103 104 105
106 107 108 109 110
111 112 113 114 115
116 117 118 119 120
w 0\
LOCATION
401401N0740026.,1 40l40lN0740025 .. l 401346N0740034.,1 401322N0740l55 .. 1 40l223N0740l04.1
401154N07410l8ol 40ll54N07410l8.2 40U53NQ741012ol 40ll43No74!0l8.1 401104NQ743146el
40ll07N0743052.1 40ll02N0740045el 40l053NQ74034lol 401005N0743200.1 401042N0740l50.l
401042N0740l43.1 401040N0740145.1 401039N0740144e1 401039N0740l4l.l 40l038N0740l47o1
40l038N0740l46.1 401038N0740}46e2 401037N0740l48.1 401036N0740146.1 40l025N0740212e1
401028N0740638.l 400949N0743142.1 400942N0743052.1 400952N0740149.1 400915N0740l46.1
4009Q8NQ741330ol 4oos3zNo74oB2l·l 400859N0740308.2 400845N0740312.1 400849NQ740207.1
400849N0740207 .. 2 400824NQ74312la1 400823N0741S20.,l 400825N0740502.1 400824N0740508.,1
Table 7.--Construction data for wells developed in the Englishtown aquifer in Monmouth and Ocean Counties--Continued
OWNER
ALLENHURST W D ALLENHuRST W D
AWD 2 AwD 4
LOCAL wELL
NUMBER
ASBURY PARK W D APWD 4 MONMOUTH CON WC WHITESVILLE 3 MONMOUTH CON WC OCEAN GROVE 20
FARMINGDALE W D FARMINGOALE l FARMINGDALE W D FARMINGDALE 2 FARMINGDALE W D FARMINGDALE 4 FARMINGDALE W D FARMINGDALE 3 MRS ERRICKSON --MR VANHISE --BELMAR BORO WD BWD 4 ELEC DEPT OF ARMY IMPERIAL PARK2 DUNCAN THECKER !;> T ASSOC 1 BELMAR BORO WD BWD 8 SUB
BELMAR BORO WD BWD 5 SUB BELMAR BORO WD BWD 1 ELEC BELMAR BORO WD BWD 3 SUB BELMAR BORO WD BWD 6 SUB BELMAR BORO WD BWD 1 SUB
BELMAR BORO WD BWD 4 SUB BELMAR BORO WD BWD 2 ELEC BELMAR BORO WD BWO 3 ELEC BELMAR BORO WD BWD 1 SUB WALL TWP W D WEST BELMAR
WALL TWP W D RT 34 WELL C I SMITH --U FREEHOLD B ED BOARD ED 1 SPRING LAK~ W D SLWD 4 sPRING LAKE W D SLWD 3
ALDRICH W CO ALDRICH W CO 4 US GEOL SURVEY ALLAIRE S P C SPRING LK HT WD SPRING LK HGT2 SPRING LK HT WD SPRING LK HGT3 SPRING LAKE W D SLWD 1
SPRING LAKE W D SLWD 2 E W HARVEY- --JACKSON TWP MUA JACKSON 2 WALL HJP W D ALLENWOOD 1 WALL TWP W D ALLENWOOD 2
MUNICIPALITY
ALLENHURST BORO ALLENHuRST BORO ASBURY PARK ASBURY PARK NEPTUNE HIP
FARMINGDALE BORO FARMINGDALE BORO FARMINGDALE 80RO FARMINGDALE BORO U FREEHOLD TWP
U FREEHOLD HIP BELMAR BORO WALL HIP U FREEHOLD TWP BELMAR BORO
BELMAR BORO BELMAR BORO BELMAR BORO BELMAR BORO BELMAR BORO
BEU.1AR BORO BELMAR BORO BELMAR BORO BELMAR BORO WALL TWP
WALL HIP U FREEHOLD HIP U FREEHOLD TWP SPRING LAKE BORO sPRING LAKE BORO
HOWELL TWP WALL TWP SPRNG LK HGTS BO SPRNG LK H~TS BO SPRING LAKE BORO
SPRING LAKE BORO U FREEHOLD TINP JACKSON TWP WALL HIP WALL TWP
DATE DRILLED (YEAR)
1950 1950 1963 1954 1949
1926 1949 1970 1964 1954
1954 1941 1943 1969 --1900 1900 1900 --
1900
--1938 1949 --
1959
1968 1953 1951 1967 1941
!967 }963 1953 1966 1940
1941 1950 1962 1959 1959
ALTITUDE
OF LSD (FT)
10 lo 10 10 20
eo 80 85 so
130
145 15
100 100
2o
20 20 20 20 20
20 2o 20 20 25
80 130 135
lo 20
130 96 60 25 15
15 115 156 100
8o
WELL DEPTH CFT>
570 570 580 566 605
480 480 470 460 134
131 679 662 H9 640
515 545 518
600
524 581 594 648 575
649 139 157 670 705
550 633 711 680 698
101 150 577 740 710
CASING DEPTH (FT)
525 525 540 498 570
450 410 420 128
126 601 616
96 640
----------581 563 --440
549 134 148 600 640
363 623 660 630 631
640 96
S41 689 658
LENGTH CASING OF WELL DIAM- OPEN TO ETER AQUIFER (IN) <FEET)
2•1+ 1:2 45 li~ 40
1!3 68 u~ 35
~~ 30 16 60 10 40
4f. 6
6 5 2a 78 12 --10 23
8
6
-·· 6
06
6 181 --· 31
€1 }()1 40
10 100 6 5 6 9
10 70 a 65
12 40 6 10 8 51
10 so 6
8 6 8 36
10 50 10 50
MAP NO
121 122 123 124 125
126 127 128 129 130
131 132 133 134 135
136 137 138 139 140
LOCATION
400804N0740227el 400800N074023l.l 400752N0743454.1 400742No74I639.l 400745N0741333.1
400803N0740229.1 400657No74I715•l 400712N0741512.1 400645NQ740345.1 400636N0741515.,1
400555No74o851 .. 1 400623N0740429 .. l 400614No 741157.1 400622N0741349.l 400540N0741230.l
400516No741255.1 400516No741255.2 400515N0741251.2 4005l5N074125l.l 400500N074ll08.,1
141 400459~0740359.1 142 400454N0740413.,1 143 400450N0740410·1 144 400450N0740410.2 145 400450N0740410,.3
146 400443N0741352el 147 400435N0740257.1 148 400416N074270lol 149 400354No7413lo .1 150 4oo4o1No7432oo.2
151 400405N0740244 .. 1 152 400405N0740242el 153 400358N0740812 .. 1 154 400312NO 741123 .. 1 155 400250No741044 .. 1
156 400220N0741154,.l 15 7 400211N07403U .. l 158 40021 ONO 740310 ol 159 395808N074042l,.l 160 395741N0740437.l 161 395609N0741240.1
w -..J
Table 7.--Construction data for wells developed in the Englishtown aquifer in Monmouth and Ocean Counties--Continued
OWNt:R
SEA GIRT W D SEA GIRT W D ATLEE ZURLO
LOCAL WELL
NU"18ER
SGWD 5 SGWD 4
--JACKSON TwP MuA JACKSON 4 HOWELL TWP BD KENT RD
sEA GIRT W D SGWD 3 JACKSON TWP MUA JACKSON 3 JACKSON TWP MUA JACKSON 1 BRIELLE WATER D BWD 2 ST GABRIELS COL ST GABRIELS 1
PARKWAY W C PARKwAY l BRIELLE WATER D BWD 3 LAKEwOOD W C LAKEwOOD 9 LAKEwOOD W C LAKEWOOD 6 LAKESORE LAUNDR LAKESHORE LA l
LAKEWOOD W C LAKEWOOD W C LAKEWOOD W C LAKEWOOD 2 LA.KEWOOO W C LAKEI./OOD W C LAKEWOOD W C LAKEWOOD 5 LAKEWOOD W C LAKEIA/000
PT PLEASANT W D PPWD 3 PT PLEASANT W D PPWD 6 PT PLEAsANT W D PPWD 2 PT PLEASANT W D PPWD 1 PT PLEASANT W D PPWD
LAKEWOOD W C LAKEwOOD 8 CENTRAL RR NJ CENTRAL RR NJ US GEoL SURVEY CaLL tHLLS TWl LAKEWOOD W C LAKEWOOD 1 NEW EGYPT WC 1
oCEAN Co W C BAY HEAD 6 OCEAN CO W C BAy HEAD 5 BRADLEEs CORP BRADLEES WELL S LAKEWOOD W C S LAKEiliOOD 3 S LAKEWOOD W C S LAKEwOOD 2
S LAKEWOOD W C S LAKEWOOD 1 OCE6.N CO l~ C MANTOLOKING 4 OCEAN CO W C MANTOLOKING 6 LAVALLETTE W 0 LWD 2 LAVALLETTE w D LWD 3 US GEOL SURVEY TOMS RIVER TW2
MUNICipALITY
SEA GIRT BORO SEA GIRT BORO U FREEHOLD HiP JACKSON TWP HOWELL HIP
sEA GIRT BORO JACKSON TWP JACKSON HiP BRIELLE BORO LAKEWOOD HIP
HOWELL Tlt/P BRIELLE BORO LAKEwOOD TwP LAKEWOOD HJP LAKEWOOD TWP
LAKEWOOD TWP LAKEWOOD TWP LAKEWOOD HJP LAKEWOOD HiP LAKEWOOD TWP
PT PLSNT BORO PT PLSNT BORO PT PLSNT BORO PT PLSNT BORO pT PLSNT BORO
LAKEWOOD TWP BAY HEAD BORO JACKSON TWP LAKEWOOD TWP PLUMSTED TWP
BAY HEAD BORO RAY HEAD BORO BRICK HIP LAKEWOOD TWP LAKEWOOD TWP
LAKEWOOD TWP MANTOLOKING BORO MANTOLOKING BORO LAVALLETTE BORO LAVALLETTE BORO S TOMS RIVER BORO
DATE DRILLED <YEAR)
1963 1949 1952 1965 1955
1921 1962 1961 1950 1957
1958 1967 1968 1960 195{)
1900 192i 1899 1957 1966
1946 1965 1936 1936 1893
1965 1930 1964 1964 1907
1950 1941 1969 }966 1963
1969 1924 1955 1931 1948 1965
ALTITUDE
OF LSD <Fn
20 18 90 so
110
20 140 110
33 7o
45 90 55 70 so 35 6o 30 '+0 30
15 20 15 20 10
78 9
137 85 75
10 10 10 45 '+O
90 5 5 5 7
15
wELL DEPTH CFT>
710 715 109 500 582
760 559 557 750 530
646 820 698 582 612
621 625 600 604 736
798 790 745 825 806
758 813 427 757 239
818 834 no 741 762
817 922 906
1136 1180 1146
CASING DEPTH <FT)
660 685
99 448 558
730 513 SH 690 --605 770 569 521 596
--575 --547 725
748 730 715 745 746
600 793 417 697 214
778 775 670 673 680
748 900 845
1009 1120 1080
CASING DIAMETER (IN)
10 10
4 8 6
8 10
8 12
8
8 10
8 8 6
6 8 6 8 4
10 8 6 8
8 5 6 8 6
8 8
12 8 8
8 6 8 6 8 3
LENGTH OF WELL OPEN TO AQUIFER (FEET)
55
10 52
46 46 60
41 50 65 61 16
50 --57
50 68 30
88 20
25
40 68 62
65 22
127 60 66

along the shore area of southeastern Monmouth County (fig. 15). The altitude of the potentiometric surface was below sea level throughout eastern Monmouth County and northeastern Ocean County; the potentiometric surface in the Belmar-Spring Lake area was more than 80 ft (24 m) below sea level and in the vicinity of Lakewood was more than 20 ft (6 m) below sea level.
A second series of water-level measurements in the Englishtown aquifer in Monmouth, Ocean, and Burlington Counties was made in November 1970 (table 6). The altitude and configuration of this potentiometric surface is shown in figure 16. The regional decline of the potentiometric surface between 1959 and 1970 (fig. 10) was greater than the decline from 1900 to 1959. The heavy ground-water withdrawals along the coastal areas of southern Monmouth County and northern Ocean County and in the Lakewoo~ area caused decline of 100 ft (30 m) or more during this period. The effects of the pumping in these areas extended as far west as Freehold, where 12 to 15 ft (3.6 to 4.6 m) of decline occurred.
Continuous records of water-level changes in the confined part of the Englishtown aquifer became ayailable in 1964, when the U.S. Geological Survey installed two observation wells as part of the cooperative statewide observation well network. One well was installed at Allaire State Park in southeastern Monmouth County and the other at Colliers Mills Hunting and Fishing Grounds in northwestern Ocean County. The well at Allaire State Park is situated approximately midway between the two main centers of pumpage; one near Lakewood and the other along the coast in southern Monmouth County. The water level in this well declined 50 ft (15 m) between February 1964 and February 1970 at an average annual rate of decline of 8 ft (2.4 m) per year (fig. 17). The net decline between February 1969 and February 1970 was 12 ft (3.6 m). As the observation well at Colliers Mills is considerably west of the Lakewood area, water-level declines recorded in this well (fig. 17) are considerably less than those seen at Allaire State Park. The water-level at Colliers Mills declined only about 8 ft (2.4 m) between February 1964 and February 1970; the average rate of decline over this period was 1.3 ft (0.4 m) per year. The water level declined 1.2 ft (0.37 m) between February 1969 and February 1970.
The Lakewood Water Company installed an observation well southeast of Lakewood in late 1966. Continuous records of water levels in this well have been kept by the company since that time (fig. 17). The measurements show an almost continuous water-level decline of 81 ft (24.7 m) from January 1967 to September 1970.
Ground-water Withdrawals
Ground-water withdrawals from the Englishtown aquifer in Monmouth and Ocean Counties are dominantly for public supply (fig. 18). Domestic pumpage is not known but is probably small. Because shallower aquifers are capable of yielding quantities of water suitable for domestic purposes, it is not
38

LINE SHOWING EQUAL DECLINE OF WATER LEVEL IN FEET
CONTOUR INTERVAL 20 FEET
(CONVERSiON FACTOR' I FOOT" 0. 3048 METER)
SCALE
10 MILES
10
FIGURE 15. --WATER-LEVEL DECLINE BETWEEN ABOUT 1900 AND JANUARY 1959 IN THE ENGLISHTOWN AQUIFER IN MONMOUTH AND NORTHERN OCEAN COUNTIES, N.J.
39
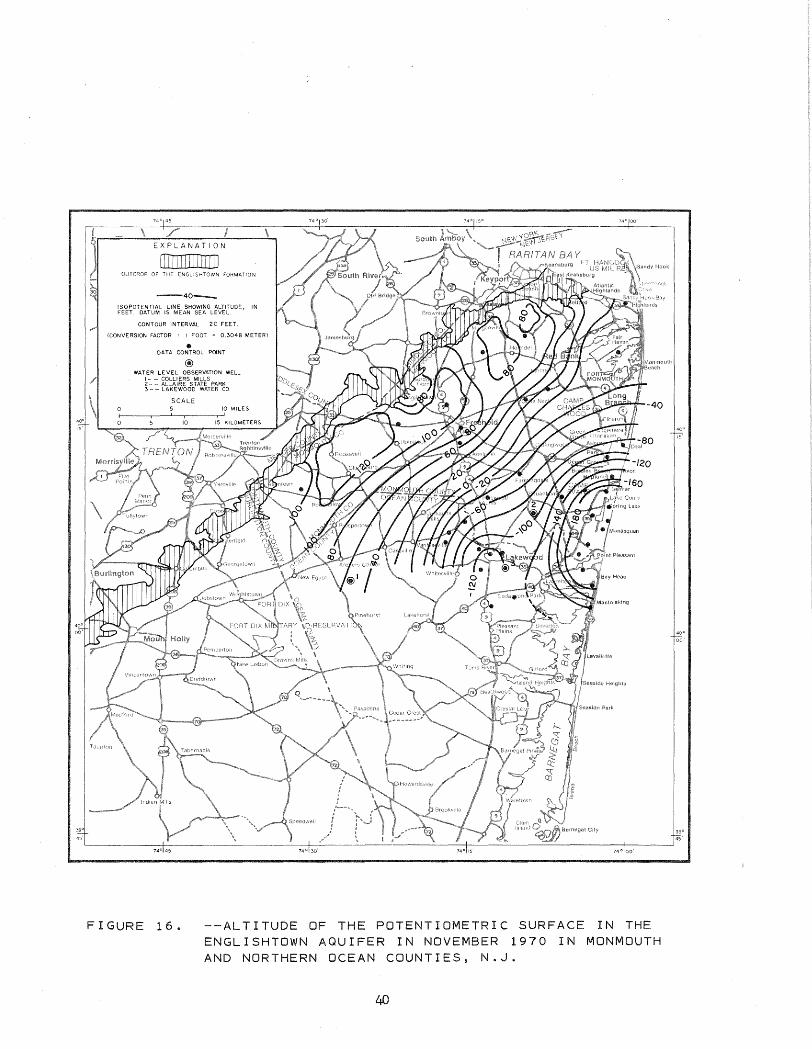
--40-
ISOPOTENTIAL LINE SHOWING ALTITUDE, IN FEET. DATUM IS MEAN SEA LEVEL
CONTOUR INTERVAL 20 FEET
(CONVERSION FACTOR I FOOT =
• 0.3048 METER!
DATA CONTROL POINT
@ WATER LEVEL OBSERVATION WELL
1- - COLLIERS MILLS 2-- ALLAIRE STATE PARK 3-- LAKEWOOD WATER CO
40°
oo·
FIGURE 16. --ALTITUDE OF THE POTENTIOMETRIC SURFACE IN THE ENGLISHTOWN AQUIFER IN NOVEMBER 1970 IN MONMOUTH AND NORTHERN OCEAN COUNTIES, N.J.
40
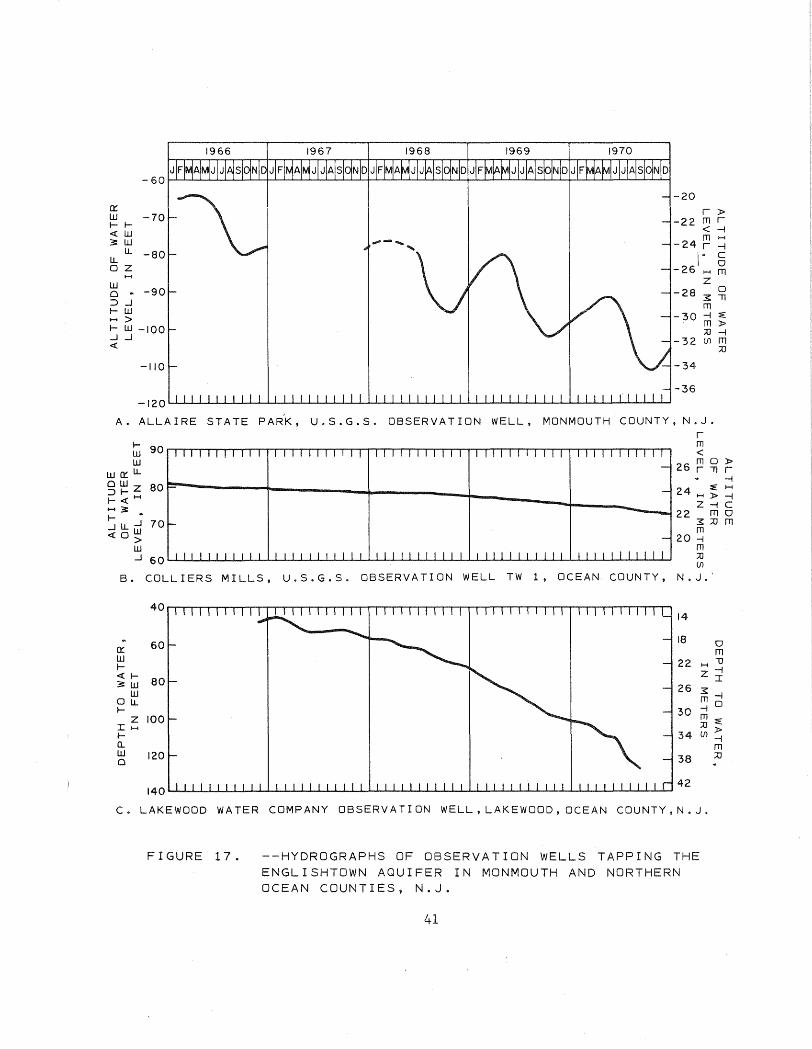
1966 1967 1968 1969 1970
-20 a-.: w 1--1- -22 ~ 'f:-
<-I <(W m 3 w ~
u_ -24 r --1 u_ c 0
I ~ z -26 .... ~ z w
0 .. -90 :::> _J
~-28 3: ~
m 1--W ~ > -30 ~ ;; I- w -100 ;a -I _j_J
(j) <( -32 m ;a
-110 -34
-36 -120~~~~~~~~~~~~~~~~~~~~~~~~~~~~~~~~~~~
A. ALLAIRE STATE PARK, U.S.G.S. OBSERVATION WELL, MONMOUTH COUNTY, N.J. r
1- m 90 w < w
wa::u_ 26 ~ ~ 'f:---1
OWz 80 :>I-I-<(~ ~3:
I- .. r~-----------r-------------r-------------r------------~--------____ j24 Z--IC 22
~ ~ m o
~ _JU,__J 70 :s:;am <(Ow m
> 20 -i w m _J ;:o
60 (/)
B. COLLIERS MILLS, U.S.G.S. OBSERVATION WELL TW 1, OCEAN COUNTY, N.J.·
40 14
18 a:: 60 0
m w I- 22 ~
i lJ
<(I- z 3W 80
w 26 3: --1 au_ mo I- 30
z -i
100 m :E: I~ ;:o)> I- 34 (/) -I 0.. m w 120 ;a 0 38
140
c. LAKEWOOD WATER COMPANY OBSERVATION WELL, LAKEWOOD, OCEAN COUNTY,N.J.
FIGURE 17. --HYDROGRAPHS OF OBSERVATION WELLS TAPPING THE ENGLISHTOWN AQUIFER IN MONMOUTH AND NORTHERN OCEAN COUNTIES, N.J.
41

\ I \ EX PLAN AT I 0 N
ITiilliiD[JIIJ OUTCROP OF THE ENGLISHTOWN FORMATION
e2 LOCATION OF PUMPING WELL OR WELL FIELD DEVELOPED IN THE ENGLISHTOWN AQUIFER FOR WHICH PUMPING DATA ARE GIVEN IN TABLE 8.
@ow3 LOCATION OF OBSERVATION WELL IN THE ENGLISHTOWN AQUIFER FOR WHICH A HYDROGRAPH IS SHOWN IN FIGURE 17.
OWl- ALLAIRE STATE PARK OW2- COLLIERS MILLS OW3-LAKEWOOD WATER CO
SCALE 10 MILES
40°
15'
400
oo'
FIGURE 1 8 • --LOCATION OF PUMPING WELLS LISTED IN TABLE 8 AND OBSERVATION WELLS DESCRIBED IN FIGURE 17.
42
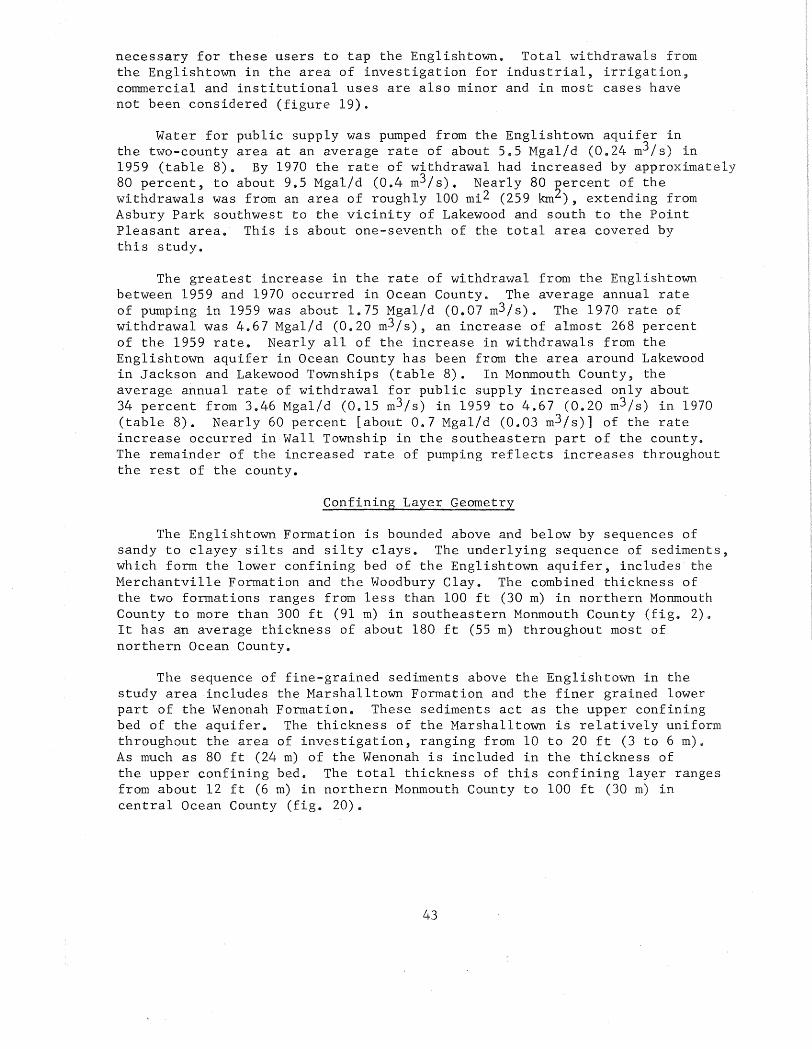
necessary for these users to tap the Englishtown. Total withdrawals from the Englishtown in the area of investigation for industrial, irrigation commercial and institutional uses are also minor and in most cases have not been considered (figure 19).
Water for public supply was pumped from the Englishtown aquifer in the two-county area at an average rate of about 5.5 Mgal/d (0.24 m3/s) in 1959 (table 8). By 1970 the rate of withdrawal had increased by approximately 80 percent, to about 9.5 Mgal/d (0.4 m3/s). Nearly 80 ~ercent of the withdrawals was from an area of roughly 100 mi2 (259 km ), extending from Asbury Park southwest to the vicinity of Lakewood and south to the Point Pleasant area. This is about one-seventh of the total area covered by this study.
The greatest increase in the rate of withdrawal from the Englishtown between 1959 and 1970 occurred in Ocean County. The average annual rate of pumping in 1959 was about 1.75 Mgal/d (0.07 m3/s). The 1970 rate of withdrawal was 4.67 Mgal/d (0.20 m3/s), an increase of almost 268 percent of the 1959 rate. Nearly all of the increase in withdrawals from the Englishtown aquifer in Ocean County has been from the area around Lakewood in Jackson and Lakewood Townships (table 8). In Monmouth County, the average annual rate of withdrawal for public supply increased only about 34 percent from 3.46 Mgal/d (0.15 m3/s) in 1959 to 4.67 (0.20 m3/s) in 1970 (table 8). Nearly 60 percent [about 0.7 Mgal/d (0.03 m3/s)] of the rate increase occurred in Wall Township in the southeastern part of the county. The remainder of the increased rate of pumping reflects increases throughout the rest of the county.
Confining Layer Geometry
The Englishtown Formation is bounded above and below by sequences of sandy to clayey silts and silty clays. The underlying sequence of sediments, which form the lower confining bed of the Englishtown aquifer, includes the Merchantville Formation and the Woodbury Clay. The combined thickness of the two formations ranges from less than 100 ft (30 m) in northern Monmouth County to more than 300 ft (91 m) in southeastern Monmouth County (fig. 2) It has an average thickness of about 180 ft (55 m) throughout most of northern Ocean County.
The sequence of fine-grained sediments above the Englishtown in the study area includes the Marshalltown Formation and the finer grained lower part of the Wenonah Formati0n. These sediments act as the upper confining bed of the aquifer. The thickness of the Marshalltown is relatively uniform throughout the area of investigation, ranging from 10 to 20 ft (3 to 6 m). As much as 80 ft (24 m) of the Wenonah is included in the thickness of the upper confining bed. The total thickness of this confining layer ranges from about 12 ft (6 m) in northern Monmouth County to 100 ft (30 m) in central Ocean County (fig. 20).
43
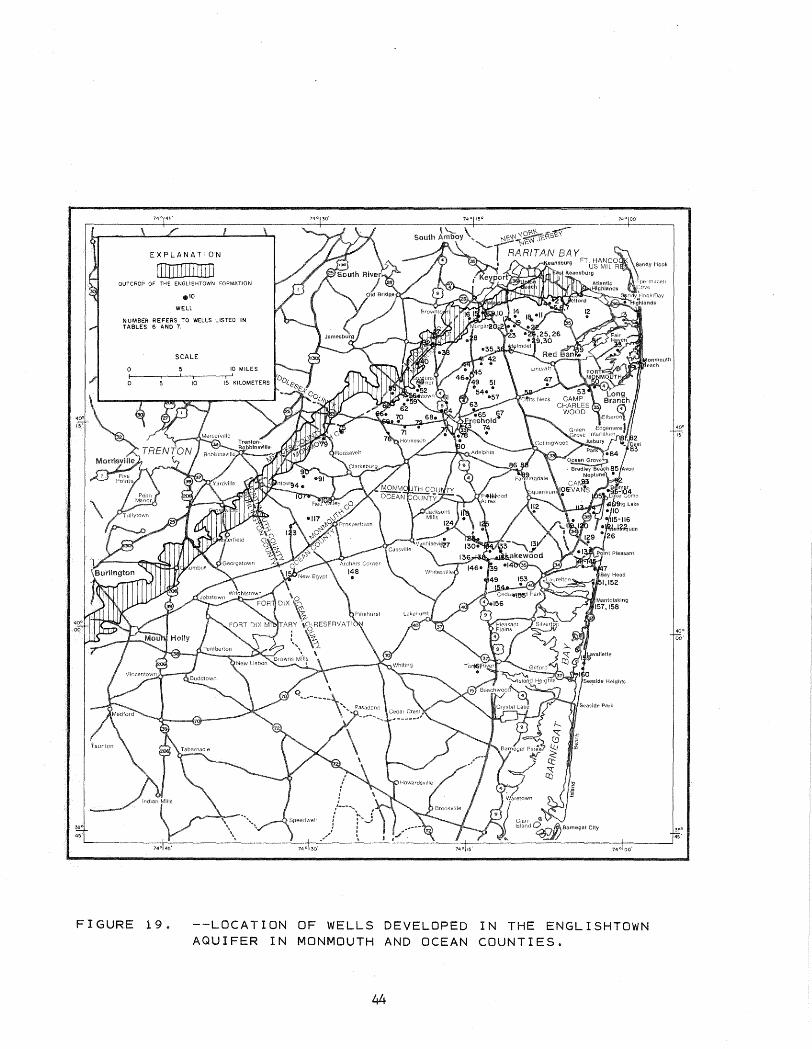
EXPLANATION
OUTCROP OF THE ENGLISHTOWN FORMATiON
eiO
WELL
NUMBER REFERS TO WELLS LISTED IN TABLES 6 ANO 7.
SCALE
10 MILES
10
40° 15'
40' oo'
FIGURE 1 9 • --LOCATION OF WELLS DEVELOPED IN THE ENGLISHTOWN AQUIFER IN MONMOUTH AND OCEAN COUNTIES.
44

OUTCROP OF THE ENGLISHTOWN FORMATION
--20--ISOPACH SHOWING THICKNESS IN FEET. DASH- DOT WHERE INFERRED.
CONTOUR INTERVAL 20 FEET.
(CONVERSION FACTOR ' I FOOT = 0.3048 METER)
.............. ..._3o-""'" SUPPLEMENTARY CONTOUR
SCALE 10 MILES
400
oo'
FIGURE 20. --THICKNESS OF THE CONFINING LAYER OVERLYING THE ENGLISHTOWN AQUIFER IN MONMOUTH AND NORTHERN OCEAN AND BURLINGTON COUNTIES, N.J.
45

Table 8.--Rate of ground-water withdrawal for public supply from the Englishtown aq~ifer in Monmouth and Ocean Counties
Owner Water department well number Average annual rate of withdrawal (Mgal/d)
Map or (see fig. 18 Year No. camE any for locationsl 1959 1960 1961 1962 1963 1964 1965 1966 1967 1968 1969 1970
1 Aldrich Water Co. 4fo4 -- -- -- -- -- -- -- -- -- .04 .ll .17
2 Allenhurst Water Co. {fo4 .13 .14 .14 .14 .15 .14 .14 .15 .15 .17 .15 .15
3 Asbury Park Water Dept. 4fo4 .10 .10 .10 .10 .10 .10 .10 .10 .10 .10 .10 .10*
4 Atlantic Highlands 4F2 .23 .25 .27 .29 .30 .20 .13 .15 .13 .17 .19 .19 Water Dept.
5 Belmar Water Dept. 10 wells • 93 • 70 .68 • 72 .83 .83 .79 .80 .84 • 93 .92 .91
6 Brielle Water Dept. 4F2-3 .17 .18 .15 .16 .16 .16 .16 .21 .20 .32 .34 .32
7 Farmingdale Water Dept. All wells .04 .04 .05 .b5 .06 .07 .09 .14 .15 .09 .10 .09
8 Freehold Water & Util. Point Ivy 4H -- -- -- -- -- -- -- -- -- -- .02 .04*
9 Freehold Twp. Water Dept. Koenig Lane 4F2 -- -- -- -- -- -- -- -- -- -- -- .60
10 Monmouth Consolidated Ocean Grove Sta. #20 .. 33 .07 .60 .71 .04 .05 .02 .08 -- -- -- .01 Water Co •
ll Parkway Water Co. .02 .03 .04 .07 .07 .10 .08 .08 .08 .09 .09 .10
12 Red Bank Water Dept. 4/=2-3 .64 .68 .69 .6 7 .67 .67 .65 .6 7 .64 .77 .72 .62*
13 Sea Girt Water Dept. #4-5 .19 .19 .19 .20 .23 .21 .21 .21 .18 .19 .19 .05
14 Spring Lake Heights 4F2-3 .20 .23 .24 .23 .30 .33 .28 .29 .32 .42 .44 .53* Water Dept.
15 Spring Lake Water Dept. 4/=1-4 .48 .52 .45 .47 .49 .52 .45 .49 .46 .53 .55 ~63
16 Wall Twp. Water Dept. Allenwood 4fl -- -- -- .11 .13 .16 .17 .19 .19 .18 .15 .18
17 Wall Twp. Water Dept. Allenwood 4/=2 -- -- -- .10 .12 .14 .16 .18 .20 .20 .19 .20
18 Wall Twp. Water Dept. West Belmar -- -- -- .09 .10 .11 .12 .14 .13 .13 .13 .15
19 Wall Twp. Water Dept. Route 34 well -- -- -- -- -- -- -- -- -- .08 .16 .18
20 Wall Twp. Water Dept. Imperial Park 4F2 -- -- -- -- -- -- -- -- -- -- -- .06
.j::-0\

Table 8.--Rate of ground-water withdrawal for public supply from the Englishtown aquifer in Monmouth and Ocean Counties--Continued
Owner Water department well ntunber Average annual rate of withdrawal (Mgal/d)
Map or (see fig. 18 Year No. com:eany for locations2 1959 1960 1961 1962 1963 1964 1965 1966 1967 1968 1969 1970
21 Jackson Twp. MUA ifl -- -- -- .09 .19 .17 .17 .13 .13 .11 .13 .19
22 Jackson Twp. MUA 112 -- -- -- -- .07 .21 .17 .17 .15 .18 .19 .28
23 Jackson Twp. ~A ifo3 -- -- -- -- .01 .02 .01 .11 .12 .14 .17 .17
24 Jackson Twp. MUA #4 -- -- -- -- -- -- -- .16 .16 .18 .14 .11
25 Lakewood Water Co. ifo5 • 75 .77 • 78 • 75 .65 .so .22 .20 .17 .10 .08 .10*
26 Lakewood Water Co. ifo6 -- -- -- .12 .27 .42 .56 .53 .47 .47 .32 .33*
27 Lakewood Water Co. #7 -- -- -- -- -- .24 .44 .53 .45 .63 .60 .63*
28 Lakewood Water Co. #8 -- -- -- -- -- -- -- .06 .29 .30 .32 .29*
29 Lakewood Water Co. 4fo9 -- -- -- -- -- -·· -- -- -- .01 .25 .40*
30 Lavallette Water Dept. if2-3 .32 .31 .30 .29 .30 .32 .33 • 25 .19 .37 .40 .35*
31 New Egypt Water Co. .10 .ll .ll .10 .12 .n .12 .14 .ll .ll .ll .12*
32 Ocean County Water Co. Bay Head ifo5-6 .38 .39 .41 .44 .45 .47 .47 .47 .51 .63 .60 .65
33 Ocean County Water Co. Mantoloking ifo6 -- -- -- -- -- -- -- -- .01 .oo .03 .04
34 Point Pleasant Water Dept. ffo3 .20 .09 .12 .25 .26 .45 .40 .21 .03 .05
35 Point Pleasant Water Dept. 4fo6 -- -- -- -- -- -- .33 .72 .32 .54 .47 .39
36 South Lakewood Water Co. #1-3 (#1 drilled 69) -- -- -- -- -- -- .05 .06 .18 .38 .56 • 73
*Estimated
.p-'-J
Confining Layer Coefficients
The quantitative analysis of ground-water flow in complex aquifer systems requires reliable values of hydraulic conductivity and specific storage for the confining layers which separate the individual aquifers. These values can be computed from the results of standard soil consolidation tests perfonned in the laboratory on undisturbed samples (Lambe, 1951; Domenico and Mifflin, 1965). Subsurface core samples were obtained at three sites for laboratory analysis. In all 58 samples were collected and tested; 16 of the samples are from confining beds of the Englishtown aquifer system.
Samples were collected with an 18-inch (0.45-m) split barrel sampler with three 6-inch (0.15-m) brass liner inserts. The liner segment containing the sample to be tes.ted was capped at each end, sealed with wax, and stored in a controlled temperature and humidity environment. Consolidation tests were performed by the Hydrologic Laboratory of the u.s. Geological Survey and by the Division of Materials of the New Jersey Department of Transportation •... The results of these tests are shown in table 9.
The upper confining bed of the Englishtown aquifer system was penetrated by the Bradlees Corporation well located in Brick Township in northeastern Ocean County. The samples obtained at depths of 605 ft (184 m) and 625 ft (190 m) are from the Wenonah Formation; those from 635 ft (193 m) and 645 ft (196 m) are from the Marshalltown Formation. The sediments recovered are of the sand-silt-clay and clayey silt types according to the Shepard (1954) classification system (fig. 21B).
Hydraulic conductivity values computed from consolidation test data range from 2.79 x lo-10 ft/s (feet per second) [8.5 x lo-9 cm/s (centimeters per second)] to 6.57 x 10⁻¹¹ ft/s (2.0 x lo-9 cm/s). These values were calculated from data at the load increment nearest the approximate computed overburden pressure of 480 psi (pounds per square inch) [33.7 kg/cm2 (kilograms per square centimeter)]. Computed values of specific storage range from 1.37 x lo-4 ft ... l (4.49 x lo-6 cm-1) to 5 .. 14 x lo-5 ft""l (6.07 x lo-6 cm-1) for the same samples (table 9) .. The hydraulic diffusivity of the four samples ranges from 1.27 x lo-6 ft2/s (square feet per second) [1.18 x lo-3 cm2/s (square centimeters per second)] to 2.29 x 10⁻⁶ ft2/s
2(2.13 x ln-3 cm /s).
Samples of both confining layers were obtained from a well drilled by the u.s. Anny at Fort Dix, New Jersey. One sample was taken of the Marshalltown Formation at a depth of 390 ft (119 m) and five samples were collected from the Merchantville-Woodbury Formations between depths of 456 ft (139m) and 625 ft (190m). The Marshalltown sample is a silty sand according to the Shepard classification. A variety of sediment types were recovered from the Merchantville-Woodbury sequence. They ranged from clayey sand to silty clay according to Shepard's classification system (fig. 21A).
48
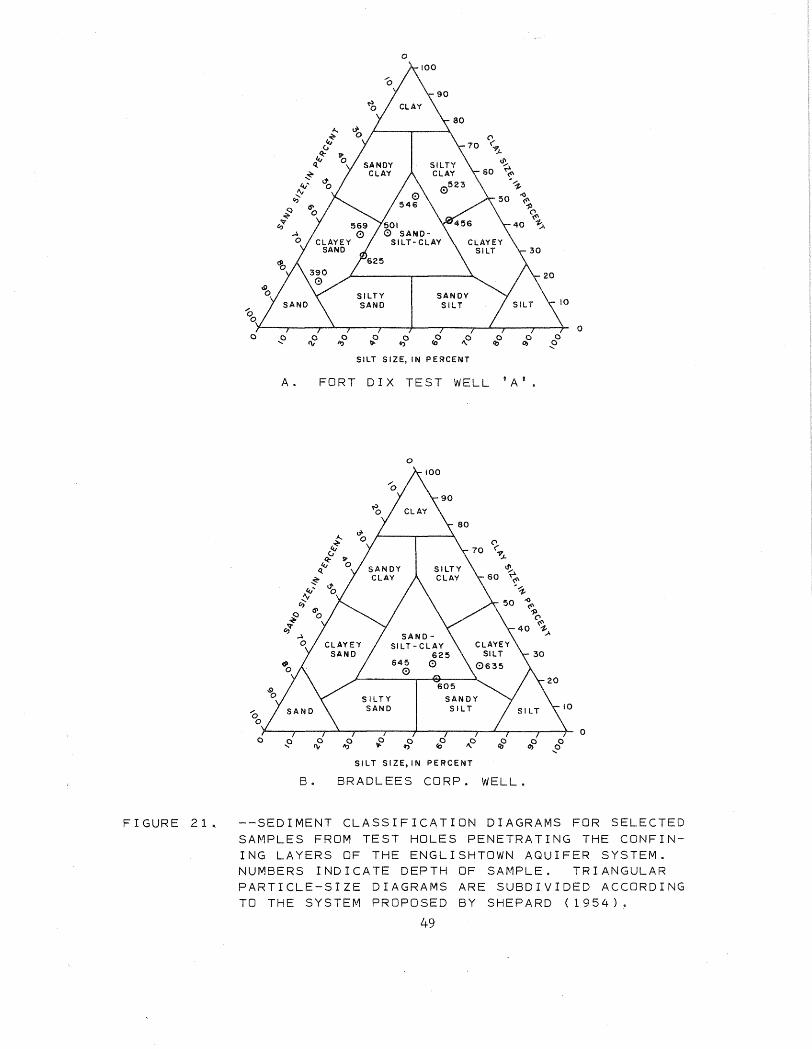
0
0 0 0 0
0) .!? SILT SIZE, IN PERCENT
A. FORT DIX TEST WELL 'A'.
0
'0 0
0 0 .!? 0 ,.,o ~ lr>o 0 1\0 QJO 0 0>0 IV (0 .!?
SILT SIZE,IN PERCENT
B. BRADLEES CORP. WELL.
FIGURE 21. --SEDIMENT CLASSIFICATION DIAGRAMS FOR SELECTED SAMPLES FROM TEST HOLES PENETRATING THE CONFINING LAYERS OF THE ENGLISHTOWN AQUIFER SYSTEM. NUMBERS INDICATE DEPTH OF SAMPLE. TRIANGULAR PARTICLE-SIZE DIAGRAMS ARE SUBDIVIDED ACCORDING TO THE SYSTEM PROPOSED BY SHEPARD (1954).
49
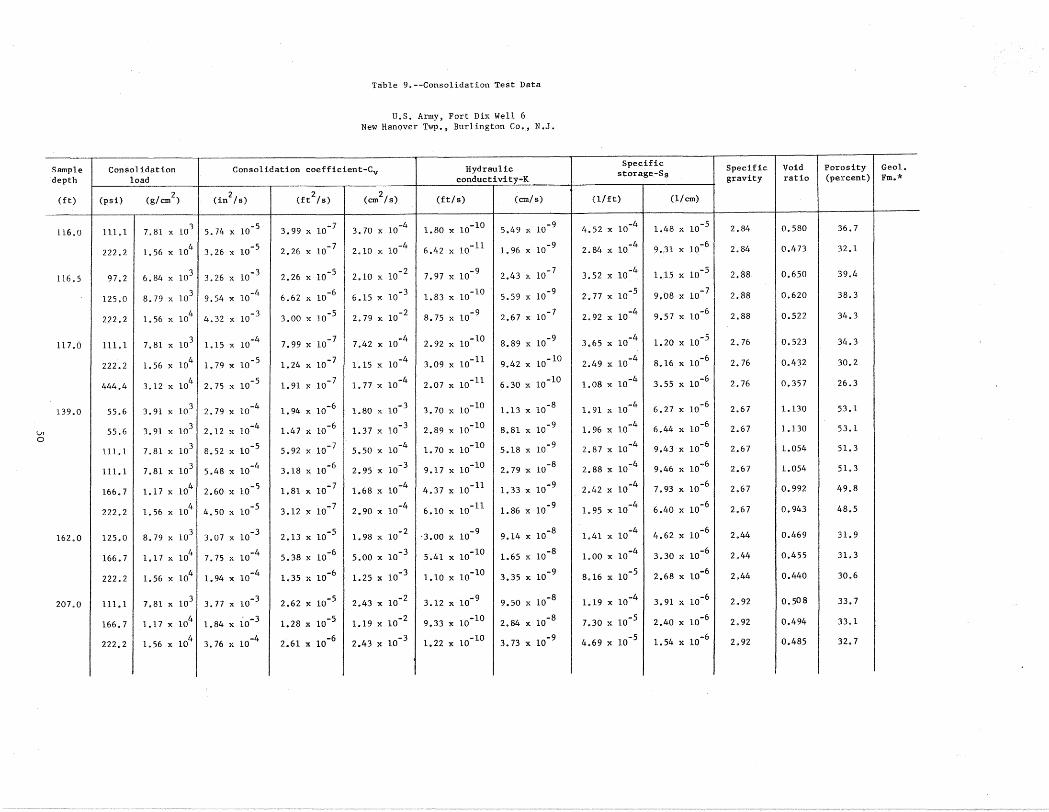
VI
Sample depth
(ft)
116.0
116.5
117.0
139.0
162.0
207.0
Consolidation load
(psi) (g/cm2)
lll.1 7,81 X 10³
222.2 1.56 X 10⁴
97.2 6,84 X 10³
125.0 8,79 X 10³
222.2 1.56 X 10⁴
1ll.1 7,81 X 10³
222.2 1.56 X 10⁴
444.4 3.12 X 10⁴
55.6 3,91 X 10³
55.6 3.91 X 10³
lll.l 7.81 X 10³
lll.1 7,81 X 10³
166.7 1.17 X 10⁴
222.2 1.56 X 10⁴
125.0 8.79 X 10³
166.7 1.17 X 10⁴
222.2 1.56 X 10⁴
111.1 7,81 X 10³
166.7 1.17 X 10⁴
222.2 1.56 X 10⁴
Table 9.--Consolidation Test Data
u.s. Army, Fort Dix Well 6 New Hanover Twp., Burlington Co., N.J.
Consolidation coefficient-Cv Hydraulic conductivity-K
(in2/s) (ft
2/s) (cm
2 /s) (ft/s) (cm/s)
-5 3.99 X 10⁻⁷ -4 1,80 X 10⁻¹⁰ -9 5.74x10 3,70 X 10 5,49 X 10
3,26 X 10⁻⁵ 2,26 X 10- 7 2,10 X 10 -4 6.42 X 10-ll 1. 96 X 10-9
3,26 X 10⁻³ -5 -2 7,97 X 10-g -7 2,26 X 10 2,10 X 10 2,43 X 10
9.54 X 10 -4 6,62 X 10 -6 6.15 X 10
-3 1.83 X 10-lO 5.59 X 10 -9
-3 -5 -2 -9 -7 4.32 X 10 3,00 X 10 2.79 X 10 8,75 X 10 2,67 X 10
1.15 X 10⁻⁴ 7,99 X 10⁻⁷ 7.42 X 10⁻⁴ 2. 92 X 10-10 8.89 X 10 -9
1. 79 X 10-5 1.24 X 10⁻⁷ 1,15 X 10 -4 3.09 X 10⁻¹¹ 9,42 X 10⁻¹⁰
2.75 X 10⁻⁵ 1.91 X 10- 7 1,77 X 10 -4 2.07 X 10⁻¹¹ 6.30 X 10⁻¹⁰
2.79 X 10⁻⁴ 1. 94 X 10-6 1.80 X 10 -3 3.70 X 10⁻¹⁰ 1.13 X 10 -8
2.12 X 10⁻⁴ 1.47 X 10⁻⁶ 1.37 X 10 -3 2.89 X 10⁻¹⁰ 8.81 X 10 -9
8.52 X 10⁻⁵ 5,92 X 10⁻⁷ 5.50 X 10 -4 1. 70 X 10-10 5,18 X 10 -9
5.48 X 10 -4 3.18 X 10⁻⁶ 2.95 X 10 -3 9.17 X 10⁻¹⁰ 2,79 X 10 -8
2,60 X 10⁻⁵ 1.81 X 10⁻⁷ 1.68 X 10 -4 4,37 X 10⁻¹¹ 1.33 X 10 -9
-5 3.12 X 10⁻⁷ -4 6,10 X 10⁻¹¹ -9 4,50 X 10 2.90 X 10 1.86 X 10
3.07 X 10 -3 2.13 X 10 -5 1.98 X 10 -2 ·3,00 X 10 -9 9,14 X 10 -8
7.75 X 10⁻⁴ 5.38 X 10⁻⁶ 5.00 X 10 -3 5,41 X 10⁻¹⁰ 1.65 X 10 -8
-4 1.35 X 10⁻⁶ -3 1.10 X 10⁻¹⁰ -9 1.94 X 10 1.25 X 10 3.35 X 10
3. 77 X 10-3 2.62 X 10⁻⁵ 2.43 X 10⁻² 3,12 X 10⁻⁹ 9,50 X 10 -8
. -3 1.84 X 10 1.28 X 10-S 1.19x10 -2 9,33 X 10⁻¹⁰ 2,84 X 10 -8
3, 76 X 10-4 2,61 X 10 -6 2,43 X 10 -3 1,22 X 10⁻¹⁰ 3,73 X 10 -9
Specific Specific Void Por()sity Geol. storage-Ss gravity ratio (pe1rcent) Fm.*
(1/ft) (1/ em)
4,52 X 10⁻⁴ 1.48 X 10⁻⁵ 2.84 0.580 36.7
2.84 X 10⁻⁴ 9.31 X 10⁻⁶ 2.84 0.473 32.1
3.52 X 10 -4 1.15 X 10⁻⁵ 2.88 0.650 39.4
2,77 X 10 -5 9,08 X 10⁻⁷ 2.88 0.620 38.3
2,92 X 10 -4 9.57 X 10⁻⁶ 2.88 0.522 34.3
3.65 X 10 -4 1.20 X 10 -5 2. 76 0.523 34.3
2.49 X 10 -4 8.16 X 10⁻⁶ 2. 76 0.432 30.2
1.08 X 10 -4 3.55 X 10 -6 2.76 0.357 26.3
1. 91 X 10-4 6.27 X 10⁻⁶ 2.67 1.130 53.1
1. 96 X 10 -4 6,44 X 10⁻⁶ 2.67 1.130 53.1
2,87 X 10⁻⁴ 9,43 X 10⁻⁶ 2.67 1.054 51.3
2,88 X 10 -4 9.46 X 10⁻⁶ 2.67 1.054 5'1.3
2,42 X 10 -4 7,93 X 10⁻⁶ 2.67 0.992 49.8
1. 95 X 10 -4 6.40 X 10⁻⁶ 2.67 0.943 48.5
1.41 X 10 -4 4.62 X 10 -6 2.44 0.469 31.9
1.00 X 10 -4 3.30 X 10⁻⁶ 2.44 0.455 31.3
8,16 X 10 -5 2,68 X 10⁻⁶ 2.44 0.440 30.6
1.19 X 10⁻⁴ 3.91 X 10⁻⁶ 2.92 0.508 33.7
7,30 X 10 -5 2.40 X 10⁻⁶ 2.92 0.494 33.1
4.69 X 10 -5 1.54 X 10⁻⁶ 2.92 0,485 32.7
0

U1 t-"
Sample depth
(ft)
390.0
456.0
523.0
546.0
569.0
625.0
Consolidation load
(psi) (g/cm2)
222.2 1.56 X 10⁴
444.4 3.12 X 10⁴
222.2 1.56 X 10⁴
361.1 2,54 X 10⁴
444.4 3,12 X 10⁴
111.1 7,81 X 10³
222.2 1.56 X 10⁴
402.8 2.83 X 10⁴
111.1 7.81 X 10³
222,2 1.56 X 10⁴
444.4 3,12 X 10⁴
888.9 6,25 X 10⁴
111.1 7,81 X 10³
222.2 1.56 X 10⁴
444.4 3.12 X 10⁴
888.9 6,25 X 10⁴
111.1 7,81 X 10³
222.2 1.56 X 10⁴
444.4 3.12 X 10⁴
888.9 6,25 X 10⁴
Table 9.--Consolidation Test Data--Continued
U.S. Army, Fort Dix Well 6--Continued New Hanover Twp., Burlington Co., N.J.
Consolidation coefficient-Cv Hydraulic Specific
storage-Ss conductivity-K
(in2/s) (ft
2/s) (cm
2 /s) (ft/s) (cm/s) (1/ft) (1/cm)
3,92 X 10 -3 2.72xl0 -5 2.53 X 10⁻² 3.00 X 10 -9 9,14 X 10⁻⁸ 1.10 X 10 -4 3.62 X 10 -6
2,88 X 10 -3 2,00 X 10 -5 1.86 X 10 -2 1.55 X 10 -9 4, 72 X 10-8 7,75 X 10 -5 2.54,x 10 -6
8,44 X 10 -4 5.86 X 10 -6 5.45 X 10 -3 6.87 X 10⁻¹⁰ 2.09 X 10 -8 1.17 X 10 -4 3.84 X 10 -6
9,53 X 10 -4 6.62 X 10 -6 6,15 X 10⁻³ 6.92 X 10⁻¹⁰ 2.11 X 10 -8 1.05 X 10 -4 3,43 X 10⁻⁶
8,90 X 10 -4 6,18 X 10 -6 5,74 X 10⁻³ 4,33 X 10⁻¹⁰ 1.32 X 10 -8 . -5 7,01 X 10 2,30 X 10 -6
1.15 X 10 -4 7,99 X 10 -7 7,42 X 10⁻⁴ 1.44 X 10⁻¹⁰ 4,39 X 10⁻⁹ 1.81 X 10 -4 5.92 X 10 -6
5.25 X 10 -5 3,65 X 10 -7 3.39 X 10 -4 8.83 X 10⁻¹¹ 2.69 X 10⁻⁹ 2,42 X 10 -4 7,95 X 10 -6
4.30 X 10⁻⁵ 2.99 X 10 -7 2. 77 X 10-4 1.39 X 10⁻¹⁰ 4.24 X 10⁻⁹ 4.66 X 10⁻⁴ 1.53 X 10⁻⁵
7,39 X 10 -5 5,13 X 10 -7 4. 77 X 10
-4 7.62 X 10⁻¹¹ 2.32 X 10⁻⁹ 1.48 X 10⁻⁴ 4.87 X 10 -6
9,04 X 10⁻⁵ 6.28 X 10 -7 5.83 X 10⁻⁴ 6.07 X 10⁻¹¹ 1,85 X 10⁻⁹ 9,68 X 10 -5 3,17 X 10 -6
6.59 X 10 -5 4,58 X 10 -7 4.25 X 10⁻⁴ 4.25 X 10⁻¹¹ 1.30 X 10⁻⁹ 9.29 X 10 -5 3.05 X 10 -6
2,46 X 10⁻⁵ 1. 71 X 10 -7 1.59 X 10⁻⁴ 3.20 X 10⁻¹¹ 9. 75 X 10-10 1.87 X 10 -4 6,15 X 10⁻⁶
2,48 X 10 -4 1. 72 X 10-6 1,60 X 10 -3 2.70 X 10⁻¹⁰ 8,23 X 10⁻⁹ 1.57 X 10 -4 5,14 X 10 -6
1. 70 X 10 -4 1.18 X 10 -6 1.10 X 10 -3 1.42 X 10 -10
4,32 X 10 -9 1.20 X 10 -4 3,94 X 10 -6
1.40 X 10 -4 9,72 X 10 -7 9,03 X 10 -4 9,33 X 10-ll 2.84 X 10 -9 9.60 X 10 -5 3,15 X 10 -6
1.50 X 10 -4 1.04 X 10 -6 9.68 X 10 -4 8,67 X 10⁻¹¹ 2,64 'x 10 -9 8,32 X 10 -5 2,73 X 10 -6
8,79 X 10⁻⁴ 6,10 X 10 -6 5,67 X 10⁻³ 1.22 X 10 -9 3, 71 X 10-8 1,99 X 10⁻⁴ 6.54 X 10⁻⁶
8,97 X 10 -4 6.23 X 10 -6 5.79 X 10⁻³ 6,39 X 10⁻¹⁰ 1. 95 X 10-8 1,03 X 10 -4 3,37 X 10 -6
7.61 X 10 -4 5.28 X 10 -6 4,91 X 10⁻³ 3.46 X 10⁻¹⁰ 1,05 X 10⁻⁸ 6.54 X 10⁻⁵ 2.15 X 10
-6
7,08 X 10 -4 4.92 X 10⁻⁶ 4,57 X 10 -3 1, 92 X 10-10 5.84 X 10⁻⁹ 3,90 X 10 -5 1.28 X 10⁻⁶
Specific Void Porosity Geol. gravity ratio (percent) Fro.*
2. 77 0.551 35.5 Kmt
2. 77 0.488 32.8
2.67 0.636 38.9 Kw
2.67 0.583 36.8
2.67 0.562 36.0
2.68 0.686 40.7 Kwb
2.68 0.588 37.0 Kmv
2.68 0.558 35.8
2.58 0.739 42.5 Kwb
2.58 0.697 41.1 Kmv
2.58 0.620 38.3
2.58 0.360 26.5
2. 77 0.640 39.0 Kmb
2. 77 0.591 37.1 Kmv
2. 77 0.517 34.1
2. 77 0.398 28.5
2.69 0.522 34.3 Kmv
2.69 0.483 32.6 '
2.69 0.435 30,3
2,69 0.380 27.5

lll N
Sample depth
(ft)
660.0
772.0
795.0
844.0
866.0
889.0
Consolidation load
(psi) (g/cm2)
55.6 ·3 3.91 X 10
111.1 7.81 X 10³
222.2 1,56 X 10⁴
444.4 3.12 X 10⁴
888.9 6.25 X 10⁴
111.1 7,81 X 10³
222.2 1.56 X 10⁴
444.4 3.12 X 10⁴
888.9 6,25 X 10⁴
111.1 7.81 X 10³
222.2 1.56 X 10⁴
444.4 3.12 X 10⁴
888.9 6.25 X 10⁴
111.1 7.81 X 10³
222.2 1.56 X 10⁴
444.4 3.12 X 10⁴
444.4 3.12 X 10⁴
111.1 7,81 X 10³
222.2 1,56 X 10⁴
444.4 3.12 X 10⁴
611.1 4,30 X 10⁴
Table 9.--Consolidation Test Data--Continued
u.s. Army, Fort Dix Well 6--Continued New Hanover Twp., Burlington Co., N.J.
Consolidation coefficient-Cv Hydraulic conductivity-K
(in2/s) (ft
2/s) (cm
2/s) (ft/s) (cm/s)
2,51 X 10⁻⁴ 1. 74 X 10 -6 1,62 X 10 -3 3.38 X 10⁻¹⁰ 1.03 X 10 -8
4.42 X 10⁻⁴ 3.07 X 10 -6 2.85 X 10 -3 6,78 X 10⁻¹⁰ 2.07 X 10 -8
3.55 X 10 -4 2.47 X 10 -6 2.29 X 10 -3 2.79 X 10⁻¹⁰ 8,51 X 10 -9
5.42 X 10 -4 3.76xl0 -6 3,50 X 10 -3 2,83 X 10⁻¹⁰ 8.64 X 10 -9
8,60 X 10⁻⁴ 5.97 X 10⁻⁶ 5.55 X 10 -3 3,09 X 10⁻¹⁰ 9.42 X 10⁻⁹
4.96 X 10 -4 3.44 X 10 -6 3,20 X 10 -3 6.97 X 10⁻¹⁰ 2.13 X 10 -8
5.33 X 10 -4 3,70 X 10 -6 3,44 X 10 -3 4,09 X 10⁻¹⁰ 1.25 X 10 -8
5.64 X 10⁻⁴ 3.92 X 10 -6 3.64 X 10 -3 2.58 X 10⁻¹⁰ 7.87 X 10 -9
4.99 X 10⁻⁴ 3,47 X 10⁻⁶ 3,22 X 10 -3 1.42 X 10⁻¹⁰ 4.32 X 10 -9
5.25 X 10⁻⁴ 3.65 X 10 -6 3.39 X 10 -3 8.05 X 10⁻¹⁰ 2.45 X 10
-8
5.76 X 10 -4
4.00 X 10 -6 3. 72 X 10 -3 5.17 X 10⁻¹⁰
1.57 X 10 -8
7.30 X 10⁻⁴ 5.07 X 10 -6 4. 71 X 10 -3 4.63 X 10⁻¹⁰ 1.41 X 10 -8
1.00 X 10 -3 6.94 X 10 -6 6.45 X 10 -3 3.28 X 10⁻¹⁰ 1.00 X 10 -8
1.27 X 10 -3 8,82 X 10 -6 8.19 X 10 -3 1.44 X 10⁻⁹ 4.39 X 10⁻⁸
2.18 X 10⁻³ 1.51 X 10 -5 1.41 X 10 -2 6.41 X 10-lQ 1.95 X 10 -8
2.13 X 10⁻³ 1.48 X 10-S 1,37 X 10 -2 4,41 X 10⁻¹⁰ 1.34 X 10⁻⁸
1.51 X 10-3 LOS x 10 -5 9.74 X 10 -3 5.67 X 10⁻¹⁰ 1. 73 X 10 -8
1. 73 X 10-3 1.20 X 10-S 1.12 X 10 -2 4,14 X 10 -9 1,26 X 10 -7
6, 72 X 10-3 4.67 X 10-S 4,34 X 10⁻² 3.92 X 10 -9 1.20 X 10 -7
7.61 X 10⁻³ 5.28 X 10-S 4. 91 X 10-z 2.61 X 10 -9 7,95 X 10⁻⁸
2.74 X 10⁻⁴ 1.90 X 10 -6 1.77 X 10⁻³ 4,89 X 10-ll 1.49 X 10 -9
Specific storage-Sa
(1/ft) (1/cm)
1.94 X 10⁻⁴ 6.37 X 10 -6
2.21 X 10⁻⁴ 7.25 X 10 .,-6
1.13 X 10 -4 3.72 X 10 -6
7.53 X 10 -5 2,47 X 10 -6
5.18 X 10⁻⁵ lo70 X 10-6
2.02 X 10 -4 6.64 X 10 -6
1,11 X 10⁻⁴ 3,63 X 10 -6
6,60 X 10 -5 2,16 X 10 -6
4.09 X 10-S 1.34 X 10 -6
2.21 X 10 -4 7.24 X 10 -6
1.29 X 10 -4 4.24 X 10 -6
9.14 X 10⁻⁵ 3.00 X 10 -6
4. 73 X 10 -5 1.55 X 10 -6
1.63 X 10⁻⁴ 5.36 X 10 -6
4.23 X 10 -5 1.39 X 10 -6
2,98 X 10 -5 9. 78 X 10 -7
5.41 X 10⁻⁵ 1.78 X 10 -6
3,45 X 10⁻⁴ 1.13 X 10 -5
8.41 X 10⁻⁵ 2.76 X 10 -6
4.94 X 10⁻⁵ 1.62 X 10 -6
2.57 X 10-S 8.43 X 10 -7
Spec if i.e Void Porosity Geol. gravity ratio (pE!rcent) Fm.*
2.67 0.356 26.3
2.67 0.312 23.8
2.67 0.274 21.5
2.67 0,159 13.7
2.67 0.159 13.7
2. 74 0.453 31.2
2. 74 0.413 29.2
2. 74 0.367 215.8
2.74 0.312 2:3.8
2.58 0.413 29.2
2.58 0.366 26.8
2.58 0.305 23.4
2.58 0.245 19.7
2. 72 0.389 28.0
2. 72 0.374 2J.2
2.72 0.352 26.0
2. 74 0.311 23.7
2.61 0.284 22.1
2.61 0.257 20.4
2 .• 61 0.226 18.4
2.61 0.214 H.6

Vl (.,.)
Sample depth
(ft)
---889.0
935.0
956.0
979.0
1000.0
225.0
255.0
Consolidation load
(psi) (g/cm2)
694.4 4.88 X 10⁴
833.3 5.86 X 10⁴
111.1 7,81 X 10³
222.2 1.56 X 10⁴
444.4 3,12 X 10⁴
888.9 6,25 X 10⁴
222.2 1.56 X 10⁴
444.4 3.12 X 10⁴
888.9 6,25 X 10⁴
222.2 1,56 X 10⁴
444.4 3,12 X 10⁴
888.9 6.25 X 10⁴
666.7 4,69 X 10⁴
888.9 6,25 X 10⁴
222.2 1.56 X 10⁴
81.0 5.69 X 10 3
222.2 1.56 X 10⁴
92.2 6,48 X 10³
Table 9.--Consolidation Test Data--Continued
u.s. Army, Fort Dix Well 6--Continued New Hanover Twp., Burlington Co., N.J.
Consolidation coefficient-Cv Hydraulic conductivity-K
(in2/s) (ft2/s) (cm
2/ s) (ft/s) (cm/s)
-3 -5 -3 2,62 X 10⁻¹⁰ -9 1,45 X 10 1.01 X 10 9.35 X 10 7,98 X 10
1.46 X 10 -3 1.01 X 10 -5 9,42 X 10⁻³ 1,05 X 10-lO 3,20 X 10⁻⁹
-4 -6 1.54 X 10⁻³ 2,78 X 10⁻¹⁰ -9 2,38 X 10 1.65 X 10 8,48 X 10
3,92 X 10 -4 2, 72 X 10 -6 2,53 X 10 -3 7 • 73 X 10-10 2,36 X 10 -8
5.84 X 10 -4 4.06 X 10 -6 3.77 X 10⁻³ 3,34 X 10⁻¹⁰ 1.02 X 10⁻⁸
6.44 X 10 -4 4.47 X 10 -6 4,15 X 10⁻³ 1.88 X 10-lO 5.74 X 10⁻⁹
4.17 X 10⁻⁴ 2.90 X 10 -6 2,69 X 10⁻³ 3.54 X 10⁻¹⁰ 1.08 X 10⁻⁸
3.23 X 10 -4 2,24 X 10 -6 2,08 X 10⁻³ 1. 90 X 10-lO 5,79 X 10 -9
-4 -6 2.54 X 10⁻³ 8, 75 X 10-11 -9 3,94 X 10 2,74 X 10 2.67 X 10
4,63 X 10⁻⁴ 3,22 X 10 -6 2,99 X 10⁻³ 2,18 X 10⁻¹⁰ 6,65 X 10⁻⁹
8.04 X 10 -4 5.58 X 10 -6 5,19 X 10⁻³ 2,28 X 10⁻¹⁰ 6,96 X 10⁻⁹
5.90 X 10 -4 4.10 X 10 -6 3.81 X 10⁻³ 1.02 X 10⁻¹⁰ . -9 3.10 X 10
3,51 X 10 -4 2.44 X 10 -6 2,26 X 10 -3 7,22 X 10⁻¹¹ 2,20 X 10 -9
2.51 X 10 -4 1,74 X 10 -6 1.62 X 10⁻³ 3,48 X 10⁻¹¹ 1.06 X 10 -9
Brad1ess Corp. Well Brick Township, Ocean County, N.J.
3,42 X 10 -3 2,37 X 10 -5 2,21 X 10⁻² 2,63 X 10⁻¹⁰ 8,03 X 10⁻⁹
4.17 X 10 -5 2.90 X 10 -7 2,69 X 10⁻⁴ 2,66 X 10-lO 8,10 X 10⁻⁹
1.60 X 10 -3 1.11 X 10 -5 1.03 X 10⁻² 1,68 X 10⁻⁷ 5.13 X 10⁻⁶
3.43 X 10 -3 2,38 X 10 -5 2,21 X 10⁻² 1. 70 X 10-8 5,18 X 10⁻⁷
Specific Specific Void Porosity storage-Ss Geol. gravity ratio (percent) Fm.*
(1/ft) 1(1/cm)
2,60 X 10 -5 8,53 X 10⁻⁷ 2.61 0.208 17.2
1.04 X 10 -5 3,40 X 10⁻⁷ 2.6ll 0.204 16~ 9'
1.68 X 10 -4 5.53 X 10 -6 2.66 0.299 23.0
2,84 X 10 -4 9,32 X 10 -6 2.66 0.211 17.4
8,24 X 10 -5 2.70 X 10⁻⁶ 2.66 0.162 13.9
4.21 X 10⁻⁵ 1.38 X 10⁻⁶ 2.66 0.114 10.2
1.22 X 10 -4 ' 4,01 X 10⁻⁶ 2. 73 0.281 21.9
8.47 X 10⁻⁵ I
-6 2.78 X 10 2.73 0.228 18.6
3,20 X 10 -5 1.05 X 10⁻⁶ 2.73 0.172 14.7
6,79 X 10 -5 2.23 X 10⁻⁶ 2.72 0.323 24.4
4,09 X 10⁻⁵ 1,31+ X 10-6 2.72 0.296 22.8
2,48 X 10⁻⁵ 8,11+ X 10-7 2.72 0.264 20.9
2.96 X 10 -5 9. 71 X 10-7 2.69 0.188 15.8
2,00 X 10 -5 6,56 X 10 -7 2.69 0.176 15.0
-5 3,64 X 10⁻⁷ 1.11 X 10 2.67 -- --
-4 3,01 X 10⁻⁵ 9,18 X 10 -- 0.930 48.2
-2 4,97 X 10⁻⁴ 1,51 X 10 2.60 -- ---4 2,34 X 10⁻⁵
7.14 X 10 -- o. 725 42.0
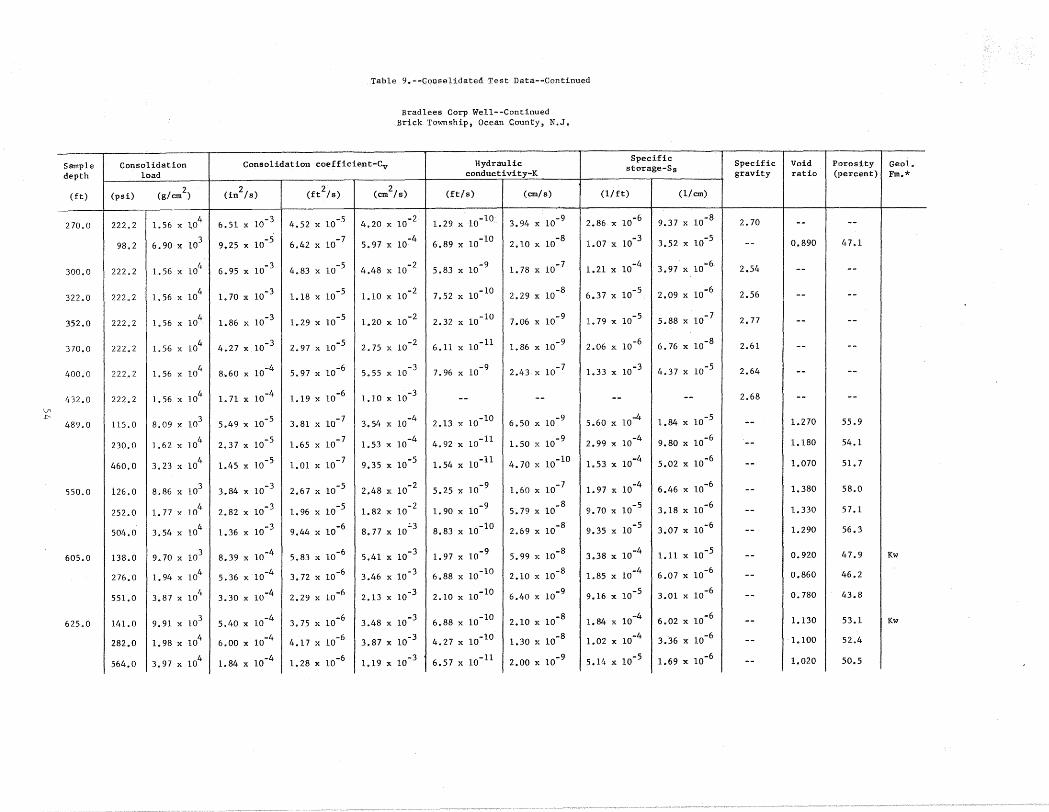
V1 ./::--
Sample depth
(ft)
270.0
300.0
322.0
352.0
370.0
400.0
432.0
489.0
550.0
605.0
625.0
Consolidation load
(psi) (g/cm2)
222.2 1.56 X 10⁴
98.2 6.90 X 10³
222.2 1.56 X 10⁴
222.2 1.56 X 10⁴
222.2 1.56 X 10⁴
222.2 1.56 X 10⁴
222.2 1.56 X 10⁴
222.2 1.56 X 10⁴
115.0 8,09 X 10³
230.0 1.62 X 10⁴
460.0 3.23 X 10⁴
126.0 8,86 X 10³
252.0 1. 77 X 104
504.0 3,54 X 10⁴
138.0 9.70 X 10³
276.0 1.94 X 10⁴
551.0 3,87 X 10⁴
141.0 9.91 X 10³
282.0 1.98 X 10⁴
564.0 3.97 X 10⁴
Table 9.--Couselidated Test Data--Continued
Bradlees Corp Well--Continued Brick Township, Ocean County, N.J.
Consolidation coefficient-Cv Hydraulic conductivity-K
(in2/s) (ft
2/s) (cm
2/s) (ft/s) (cm/s)
6.51 X 10 -3 4.52 X 10⁻⁵ 4,20 X 10 -2 1.29 X 10⁻¹⁰ 3,94 X 10⁻⁹
9.25 X 10 -5 6.42 X 10
-7 5,97 X 10 -4 6.89 X 10⁻¹⁰
2.10 X 10 -8
6.95 X 10 -3 4.83 X 10 -5 4.48 X 10 -2 5.83 X 10
-9 1. 78 X 10 -7
-3 -5 -2 7.52 X 10⁻¹⁰ -8 1.70 X 10 1.18 X 10 1.10 X 10 2,29 X 10
1.86 X 10 -3 1.29 X 10 -5 1,20 X 10 -2 2.32 X 10⁻¹⁰ 7.06 X 10 -9
4.27 X 10 -3 2.97 X 10 -5 2.75 X 10 -2 6.11 X 10⁻¹¹ 1.86 X 10⁻⁹
8,.6o x 10 -4 5,97 X 10 -6 5,55 X 10 -3 7.96 X 10 -9 2.43 X 10⁻⁷
-4 -6 -3 1,71 X 10 1.19 X 10 1.10 X 10 -- --5.49 X 10 -5 3,81 X 10 -7 3,54 X 10 -4 2.13 X 10⁻¹⁰ 6,50 X 10 -9
-5 -7 -4 4. 92 X 10-11 -9 2.37 X 10 1,65 X 10 1.53 X 10 1.50 X 10
1.45 X 10⁻⁵ 1.01 X 10 -7 9.35 X 10 -5 1.54 X 10-ll 4, 70 X 10-10
3,84 X 10⁻³ 2,67 X 10 -5 2.48 X 10 -2 5.25 X 10 -9 1.60 X 10⁻⁷
-3 -5 -2 -9 -8 2,82 X 10 1. 96 X 10 1,82 X 10 1. 90 X 10 5.79 X 10
1.36 X 10 -3 9,44 X 10 -6 8, 77 X 10 ;.3
8.83 X 10⁻¹⁰ 2.69 X 10 -8
8.39 X 10 -4 5.83 X 10 -6 5.41 X 10 -3 1. 97 X 10 -9 5.99 X 10⁻⁸
5,36 X 10 -4 3.72x10 -6 3,46 X 10 -3 6.88 X 10⁻¹⁰ 2.10 X 10⁻⁸
3.30 X 10 -4 2.29 X 10 -6 2,13 X 10 -3 2.10 X 10-lQ 6,40 X 10⁻⁹
5.40 X 10 -4 3,75 X 10 -6 3.48 X 10 -3 6,88 X 10⁻¹⁰ 2.10 X 10⁻⁸
6.00 X 10 -4 4.17 X 10⁻⁶ 3,87 X 10 -3 4.27 X 10⁻¹⁰ 1.30 X 10⁻⁸
1.84 X 10 -4 1.28 X 10⁻⁶ 1.19 X 10 -3 6.57 X 10⁻¹¹ 2,00 X 10⁻⁹
Specific storage-Sa
(1/ft) (1/cm)
2.86 X 10⁻⁶ 9.37 X 10 -8
1.07 X 10 -3 3,52 X 10 -5
1.21 X 10 -4 3.97 X 10 -6
6,37 X 10 -5 2,09 X 10 -6
l.79x10 -5 5.88 X 10 -7
2.06 X 10⁻⁶ 6,76 X 10 -8
1,33 X 10⁻³ 4.37 X 10⁻⁵
-- --
5.60 X 10⁻⁴ 1.84 X 10 -5
2.99 X 10⁻⁴ 9,80 X 10 -6
1.53 X 10 -4 5.02 X 10⁻⁶
1. 97 X 10-4 6.46 X 10⁻⁶
9.70 X 10 -5 3,18 X 10 -6
9.35 X 10 -5 3,07 X 10 -6
3,38 X 10⁻⁴ 1.11 X 10 -5
1.85 X 10⁻⁴ 6.07 X 10 -6
9,16 X 10 -5 3.01 X 10 -6
1,84 X 10 -4 6.02 X 10 -6
1.02 X 10 -4 3."36 X 10-6
5.14 X 10-S 1,69 X 10⁻⁶
Specific Void P1,rosity Geol. gravity ratio (percent) Fm.*
2.70 -- ---- 0.890 47.1
2.54 -- --2.56 -- --
2. 77 -- --
2.61 -- --
2.64 -- --
2.68 -- ---- 1.270 55.9
-- 1.180 54.1
-- 1.070 51.7
-- 1.380 58.0
-- 1.330 57.1
-- 1.290 56.3
-- 0.920 47.9 Kw
-- 0.860 46.2
-- 0.780 43.8
-- 1.130 53.1 Kw
-- 1.100 52.4
-- 1.020 so.s
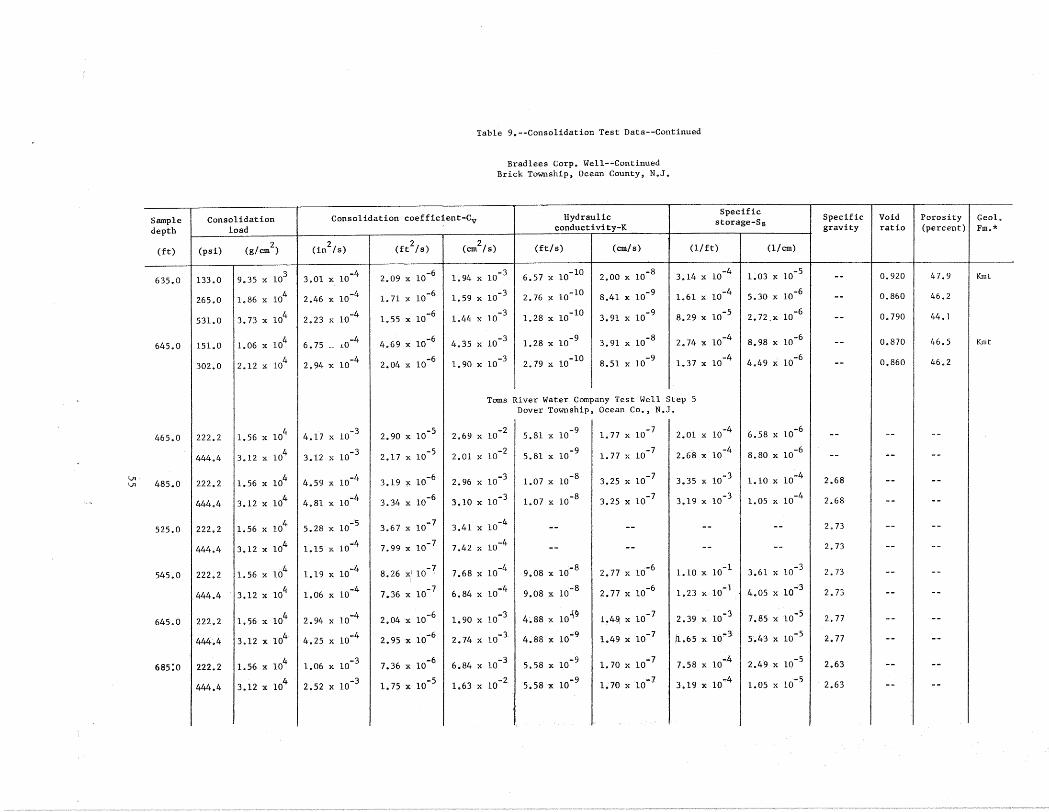
iJI iJI
Sample depth
(ft)
635.0
645.0
465.0
485.0
525.0
545.0
645.0
685:o
Consolidation load
(psi) (g/cm2)
133.0 9.35 X 10³
265.0 1.86 X 10⁴
531.0 3,73 X 10⁴
151.0 1.06 X 10⁴
302.0 2,12 X 10⁴
222.2 1.56 X 10⁴
444.4 3,12 X 10⁴
222.2 1.56 X 10⁴
444.4 3.12 X 10⁴
222.2 1.56 X 10⁴
444.4 3.12 X 10⁴
222.2 1.56 X 10⁴
444.4 3,12 X 10⁴
222.2 1.56 X 10⁴
444.4 3.12 X 10⁴
222.2 1.56 X 10⁴
444.4 3.12 X 10⁴
Table 9.--Consolidation Test Data--Continued
Bradlees Corp. Well--Continued Brick Township, Ocean County, N.J.
Consolidation coefficient-Cv Hydraulic Specific
storage-Sa, conductivity-K
(in2/s) (ft
2/s) (cm
2/s) (ft/s) (cm/s) (1/ft) (1/cm)
-4 -6 -3 6.57 X 10⁻¹⁰ -8 -4 -5 3.01 X 10 2,09 X 10 1,94 X 10 2.00 X 10 3,14 X 10 1.03 X 10
-4 -6 -3 2.76 X 10⁻¹⁰ -9 1.61 X 10⁻⁴ 5.3() X 10-6 2,46 X 10 1.71xl0 1.59 X 10 8.41 X 10
-4 -6 -3 1.28 X 10⁻¹⁰ -9 -5 2,72,x 10-6 2.23 X 10 1.55 X 10 1.44 X 10 3.91 X 10 8,29 X 10
-4 -6 -3 1,28 X 10⁻⁹ -8 -4 8,98 X 10⁻⁶ 6. 75 -- 1.0 4,69 X 10 4.35 X 10 3.91 X 10 2,74 X 10
-4 -6 -3 2,79 X 10⁻¹⁰ -9 -4 -6 2.94 X 10 2.04 X 10 1. 90 X 10 8,51 X 10 1.37 X 10 4.49 X 10
Toms River Water Company Test Well Step 5 Dover Township, Ocean Co,, N.J.
-3 -5 -2 -9 -7 -4 -6 4.17 X 10 2.90 X 10 2.69 X 10 5.81 X 10 1.77xl0 2.01 X 10 6,58 X 10
-3 -5 -2 -9 -7 -4 -6 3,12 X 10 2,17 X 10 2,01 X 10 5,81 X 10 1. 77 X 10 2,68 X 10 8,8() X 10
4.59 X 10⁻⁴ -6 2.96 X 10⁻³ -8 3.25 X 10⁻⁷ -3 -4 3.19 X 10 1,07 X 10 3,35 X 10 1.1() X 10
4,81 X 10⁻⁴ -6 -3 1,07 X 10⁻⁸ -7 -3 1.05 X 10⁻⁴ 3.34 X 10 3.10 X 10 3.25 X 10 3,19 X 10
-5 -7 -4 5.28 X 10 3,67 X 10 3.41 X 10 -- -- -- --
1.15 X 10 -4 7.99 X 10⁻⁷ 7.42 X 10⁻⁴ -- -- -- --
1.19 X 10 -4 8.26 xi 10-7 7,68 X 10 -4 9.08 X 10
-8 2, 77 X 10 -6 l.lOxlO -1 3.61 X 10 -3
-4 -7 6.84 X 10⁻⁴ 9.08 .X 10-8 -6 -1 4,05 X 10⁻³ 1.06 X 10 7.36 X 10 2.77x10 1.23 X 10
2.94 X 10⁻⁴ 2,04 X 10⁻⁶ 1,90 X 10 -3 4,88 X 10⁻¹⁹ 1.4~ X 10 -7 2.39 X 10 -3 7.8~) X 10-5
4.25 X 10⁻⁴ 2.95 X 10 -6 2,74 X 10⁻³ 4.88 X 10⁻⁹ 1.49 X 10 -7 /1.65 X 10-3 5.43 X 10⁻⁵
1.06 X 10 -3 7,36 X 10 -6 6.84 X 10 -3 5,58 X 10⁻⁹ 1. 70 X 10 -7 7,58 X 10 -4 2.49 X 10⁻⁵
2.52 X 10 -3 1. 75 X 10
-5 1.63 X 10 -2 5,58 X 10
-9 1. 70 X 10
-7 3.19 X 10
-4 1.05 X 10⁻⁵
Spedfic Void Porosity Geol. gravity ratio (percent) Fm.*
-·· 0.920 47.9 Kmt
-·· 0.860 46.2
-·· 0.790 44.1
-·- 0.870 46.5 Kmt
-·· 0.860 46.2
-- -- ---- -- --
2.68 -- --2.68 -- --
2. 73 -- --2.73 -- --
2. 73 -- --2.73 -- --
2. 77 -- --
2. 77 -- --
2.63 -- --2.63 -- --

V1
"'
Sample depth
(ft)
765.0
775.0
785.0
795.0
805.0
566.0
692.0
Consolidation load
(psi) (g/cm2)
222.2 1.56 X 10⁴
444.4 3.12 X 10⁴
222.2 1.56 X 10⁴
444.4 3.12 X 10⁴
222.2 1.56 X 10⁴
444.4 3.12 X 10⁴
222.2 1.56 X 10⁴
444.4 3.12 X 10⁴
222.2 1.56 X 10⁴
444.4 3.12 X 10⁴
100.0 7.03 X 10³
275.0 1.93 X 10⁴
435.0 3.06 X 10⁴
685.0 4.82 X 10⁴
100.0 7.03 X 10³
275.0 1.93 X 10⁴
435.0 3.06 X 10⁴
530.0 3.73 X 10⁴
Table 9.--Consolidation Test Data--Continued
Toms River Water Company Test Well Step 5--Continued Dover Township, Ocean Co., N.J.
Consolidation coefficient-Cv Hydraulic Specific storage-Sa conductivity-K
(in2/s) (ft2/s) (cm
2/s) (ft/s) (cm/s) (1/ft) (1/cm)
1.72xl0 -3 1.19 X 10 -5 1.11 X 10 -2 7.35 X 10⁻⁸ 2.24 X 10⁻⁶ 6.15 X 10⁻³ 2.02 X 10⁻⁴
1.61 X 10 -3 1.12 X 10⁻⁵ 1.04 X 10⁻² 7.35 X 10⁻⁸ 2.24 X 10⁻⁶ 6.57 X 10⁻³ 2.16 X 10 -4
5.79 X 10⁻⁴ 4.02 X 10⁻⁶ 3. 74 X 10-3 -- -- -- --1.02 X 10⁻⁴ 7.08 X 10⁻⁷ 6.58 X 10⁻⁴ -- -- -- --
-4 2.49 X 10⁻⁶ -3 3.59 X 10 2.32 X 10 -- -- -- --4.91 X 10⁻⁴ 3.41 X 10⁻⁶ 3.17 X 10⁻³ -- -- -- --
-4 -6 -3 2.11 X 10 1.47 X 10 1.36 X 10 -- -- -- ---4 -6 1.26 X 10⁻³ 1.95 X 10 1.35 X 10 -- -- -- --
1.41 X 10⁻³ 9. 79 X 10-6 9.10 X 10⁻³ 1. 73 X 10-9 5.28 X 10⁻⁸ 1. 77 X 10-4 5.81 X 10⁻⁶
7.92 X 10 -4 5.50 X 10⁻⁶ 5.ll X 10 -3 1.73 X 10⁻⁹ 5.28 X 10⁻⁸ 3.15 X 10 -4 1.03 X 10 -5
New Jersey Water Co. Well 10 Lakewood Township, Ocean County, N.J.
-- -- -- 1.29 X 10⁻⁸ 3.93 X 10⁻⁷ -- --1.33 X 10 -2
9.21 X 10 -5 8.56 X 10
-2 6.45 X 10 -9 1.96 X 10 -7
7.0 X 10⁻⁵ 2.29 X 10
-6
1.51 X 10 -2 1.05 X 10 -4 9.75 X 10 -2 5.69 X 10⁻⁹ 1. 73 X 10-7 5.4 X 10⁻⁵ 1. 77 X 10 -6
1.48 X 10⁻² 1.03 X 10⁻⁴ 9.57 X 10 -2 4.55 X 10⁻⁹ 1.39 X 10⁻⁷ 4.4 X 10-S 1.44 X 10 -6
1.02 X 10⁻⁴ 7.08 X 10⁻⁷ 6.58 X 10⁻⁴ 1.63 X 10⁻¹⁰ 4.96 X 10⁻⁹ 2.3 X 10⁻⁴ 7.55 X 10⁻⁶
6.72x10 -5 4.67 X 10⁻⁷ 4.34 X 10 -4 6.07 X 10⁻¹¹ 1.85 X 10⁻⁹
1.3 X 10⁻⁴ 4.27 X 10 -6
5.41 X 10 -5 3.76 X 10 -7 3.49 X 10⁻⁴ 3.42 X 10-ll 1.04 X 10⁻⁹ 9.1 X 10-S 2.99 X 10 -6
3.74 X 10 -5 2.60 X 10 -7 2.41 X 10 -4 2.24 X 10⁻¹¹ 6.83 X 10-lQ 8.6 X 10⁻⁵ 2.82 X 10 -6
Specific Void Porosity Geol. gravity ratio (percent) Fm.*
2.75 -- --2.75 -- --2.66 -- --2.66 -- --2. 73 -- --2.73 -- --
2.82 -- --2.82 -- --
2.66 -- --2.66 -- --
-- -- -- Kmt
-- -- ---- -- ---- -- --
-- -- -- Ket
-- -- ---- -- --
-- -- --

1..11 -....!
Table 9.--Consolidation Test Data--Continued
New Jersey Water Co. Well 10--Continued Lakewood Township, Ocean County, N.J.
Sample Consolidation Consolidation coefficient-Cv Hydraulic Specific storage-Ss
depth load conductivity-K
(ft) (psi) (g/cm2) (in2/s) (ft
2/s) (cm
2 /s) (ft/s) (em/ s) (1/ft) (1/ em)
795.0 100.0 7.03 X 10³ 7.89 X 10⁻⁴ 5.48 X 10⁻⁶ 5.09 X 10⁻³ 4.93 X 10⁻¹⁰ 1.50 X 10⁻⁹ 9.0 X 10⁻⁵ 2.95 X 10⁻⁶
610.0 4.29 X 10⁴ 8.37 X 10⁻⁵ 5.81 X 10⁻⁷ 5.40 X 10⁻⁴ 4.18 X 10⁻¹¹ 1.27 X 10 -9 7.2 X 10⁻⁵ 2.36 X 10 -6
1150.0 8.09 X 10⁴ 4.00 X 10 -5 2.78 X 10 -7 2.58 X 10⁻⁴ 1.67 X 10⁻¹¹ 5.09 X 10⁻¹⁰ 6.0 X 10 -5 1.97 X 10 -6
845.0 ll5.o 8.09 X 10⁴ 3.61 X 10 -3 2.51 X 10⁻⁵ 2.33 X 10⁻² 1.63 X 10⁻⁹ 4.97 X 10⁻⁸ 6.5 X 10 -5 2.13 X 10 -6
645.0 4.53 X 10⁴ 1.23 X 10 -4 8.58 X 10 -7 7.97 X 10⁻⁴ 5.32 X 10-ll 1.62 X 10⁻⁹ 6.2 X 10⁻⁵ 2.03 X 10⁻⁶
1190.0 8.37 X 10⁴ 2.10 X 10⁻⁵ 1.46 X 10⁻⁷ 1.35 X 10⁻⁴ 8.35 X 10-l2 2.54 X 10⁻¹⁰ 5.7 X 10⁻⁵ 1.87 X 10⁻⁶
896.0 145.0 1.02 X 10⁴ 6.47 X 10 -4 4.49 X 10 -6 4.17 X 10⁻³ 4.94 X 10-lQ 1.51 X 10 -9 1.1 X 10 -4 3.61 X 10 -6
690.0 4.85 X 10⁴ 1.32 X 10 -4 9.18 X 10 -7 8.53 X 10⁻⁴ 5.69 X 10-ll 1.73 X 10⁻⁹ 6.2 X 10⁻⁵ 2.03 X 10 -6
1225.0 8.61 X 10⁴
5.05 X 10 -5 3.51 X 10 -7 3.26 X 10 -4 1.44 X 10-ll 4.39 X 10-lO 4.1 X 10 -5 1.35 X 10⁻⁶ .
928.0 180.0 1.27 X 10⁴ -- -- -- 5.69 X 10⁻¹⁰ 1. 73 X 10-8 -- ··-
715.0 5.03 X 10⁴ -- -- -- 1.63 X 10⁻¹⁰ 4.97 X 10⁻⁹ -- -·-1245.0 8.75 X 10
4 -- -- -- 1.18 X 10⁻¹⁰ 3.59 X 10⁻⁹ -- -·-
*Ket - Englishtown Formation, clayey silt lithofacies
Kmt - Marshalltown Formation
Kmv - Merchantville Formation
Kw - Wenonah Formation
Kwb - Woodbury Clay
Specific Void Porosity Geol. gravity ratio (percent) Fm.*
-- -- -- Kwb
-- -- ---- -- ---- -- -- Kwb
-- -- ---- -- --
-- -- -- Kmv
-- -- ---- -- ---- -- -- Kmv
-- -- ---- -- --

2The approximate computed overburden pressure is 300 psi (21.1 kg/cm )
for the Marshalltown sample and ranges from 360 psi (25.3 kg/cm2) to 480 psi (33.8 kg/cm2) for the Merchantville-Woodbury samples. The hydraulic conductivity calculated for the MarshalltowTL for the load increment closest to overburden pressure is 3.0 x lo-9 ft/s (9.1 x lo-8 cm/s); the specific
1storage is 1.1 x lo-4 ft-1 (3.62 x lo-6 cm- ); and the hydraulic diffusivity is 2.72 x 10-S ft2/s (2.53 x 10⁻² cm2/s). Hydraulic conductivity values of the Merchantville-Woodbury samples computed for load increments nearest· the approximate overburden pressures range from 4.25 x lo-ll ft/s (1.29 x lo-9 cm/s) to 6.92 x lo-10 ft/s (2.11 x lo-8 cm/s). Specific storage values range from 6.54 X 10⁻⁵ ft-1 (2.14 X 10⁻⁶ cm-1) to 4.66 X l0-4 ft-1 (1.53 X
lo-5 cm-1) .. The hydraulic diffusivity of these samples varies from 2.97 x lo-7 ft2/s (2 .. 76 x l0-4 cm2/s) to 6 .. 59 x lo-6 ft2/s (6.12 x lo-3 cm2/s) (table 9).
Samples of the Marshalltown Format;i.on, the clayey silt lithofacies of the Englishtown Formation, and the Woodbury and Merchantville Formations were obtained from a well drilled by the New Jersey Water Company near Lakewood, N.J. The Marshalltown Formation sample, collected at a depth of 566ft (172m), is in the sand-silt-clay category of the Shepard classification. A sample of the clayey silt lithofacies of the Englishtown Formation was taken at a depth of 692 ft (211m) and is a silty clay in Shepard's classification system. Four samples of the Merchantville and Woodbury Formations were obtained between depths of 795 ft (242m) and 928 ft (283m). The sediments recovered fall in the clayey silt and sand-silt-clay categories of the Shepard classification system.
2The approximate computed overburden pressure is 440 psi (30.9 kg/cm ) 2for the Marshalltown sample, 540 psi (38 kg/cm ) for the clayey silt 2 lithofacies sample of the Englishtown, and ranges from 620 psi (43.6 kg/em )
to 710 psi (SO kg/cm2) for the Merchantville-Woodbury samples. The hydraulic conductivity calculated for the Marshalltown for the consolidation load closest to overburden pressure is 5.69 x l0-9 ft/s (1.73 x lo-7 cm/s) and
1 the specific storage is 5.45 x lo-S ft- (1.77 x 10⁻⁶ cm-1). The hydraulic conductivity calculated for the clayey silt lithofacies of the Englishtown Formation is 2.24 x lo-ll ft/s (6.83 x lo-10 cm/s), and the specific storage
1 is 8.6 x lo-S ft- (2.82 x lo-6 cm-1). Hydraulic conductivity values of the Merchantville and Woodbury Formation samples calculated for load increments nearest the approximate overburden pressures range from 4.18 x lo-ll ft/s (1.27 x l0-9 cm/s) to 1.63 x lo-10 ft/s (4.97 x l0-9 cm/s). Specific storage values range from 6.2 x lo-S ft-1 (2.03 x lo-6 cm-1) to 7.2 x lo-S ft-1 (2.36 x 10⁻⁶ cm-1). The hydraulic diffusivity of these samples varies from
2 25.81 x lo-7 ft /s (5.40 x lo-4 cm /s) to 9.18 x lo-7 ft2/s (8.53 x lo-4 cm2/s). The average and extreme values of the hydraulic conductivity of the confining layers of the Engtishtown aquifer system are given in table 4.
58

CONCLUSIONS
The geohydrologic data contained in this report are the basic requirements needed in the development of a computer simulation model of the most developed part of the Eng!ishtown aquifer in the northern Coastal Plain of New Jersey. The Englishtown aquifer, which has an average thickness of about 100 feet (30 m) throughout Monmouth and northern Ocean Counties, is sandwiched between overlying and underlying confining beds that have an average thickness of 40 ft (12 m) and 200 ft (61 m) respectively.
The transmissivity of the aquifer is relatively low, ranging from 2,400 ft2/d (223m2/d) to 650 ft2/d (60m2/d); the hydraulic conductivity averages about 15 ft/d (3.3 m/d); and the storage coefficient ranges from 8 x lo-5 to 3 x lo-4. The c~nfining beds_~gve vertical hydraulic conductivities on the order of 1 x 10-J ft/d (3 x 10 m/d) and specific storage of 8 x lo-5/ft (2.4 x l0-5/m).
The average rate of withdrawal from the Englishtown aquifer, within the area of study increased from 5.5 Mgal/d (.24 m3/s) in 1959 to about 9.5 Mgal/d (0.4 m3/s) in 1970. The effect of this withdrawal rate was a decline in head as of 1970 at a rate of 8 to 12 ft (2.4 to 3.6 m) per _year over large areas. As a consequence of this change in head, large quantities of water have apparently leaked from and through the confining layers into the Englishtown aquifer. The quantity of leakage and the effects of future stresses on the aquifer can best be estimated by simulation modeling.
REFERENCES CITED
Anderson, H. R., and Appel, C. A., 1969, Geology and ground-water resources of Ocean County, New Jersey: New Jersey Dept. Conserv. and Econ. Devel. Spec. Rept. 29, 93 p., 29 figs.
Barksdale, H. c., Greenman, D. W., Lang, S.M., Hilton, G. s., and Outlaw, D. E., 1958, Ground-water resources of the tri-state region adjacent to the lower Delaware River: New Jersey Dept. Conserv. and Econ. Devel. Spec. Rept. 13, 190 p., 1 pl., 24 figs.
Berry, E. W., 1906, The. flora of the Cliffwood clays: New Jersey Geol. Survey Ann. Rept., 1905, p. 135-172.
Domenico, P. A., and Mifflin, M. D., 1965, Water from, low-permeability sediments and land subsidence: Water Resources Research, vol. 1,- no. 4, p. 563-576.
Dansky, Ellis, 1963, Records of wells and ground-water quality in Camden Cou!,lty, New Jersey: New Jersey Dept. Conserv .. and Econ .. Devel. Water Resources Circ. 10, 70 p ..
59

Farlekas, G. M., Nemickas, Bronius, and Gill, H. E., 1976, Geology and ground-water resources of Camden County, New Jersey: u.s. Geol. Survey Water Resources Inv. 76--76, 146 p.
Hantush, M. s., 1960, Modification of the theory of leaky aquifers: Jour. Geophys .. Research, v. 65, no. 11, p. 3713-3725.
1964, Hydraulics of wells, in Chow, V. T., Advances in hydroscience, v. New York, Academic Press, p. 281-442.
Hardt, W. F., 1963, Public water supplies in Gloucester County, New Jersey: New Jersey Dept. Conserv. and Econ. Devel. Water Resources Circ. 9 ..
Hardt, W. F., and Hilton, G. s., 1969, Water Resources and geology of Gloucester County, New Jersey: New Jersey Dept. Conserv. and Econ. Devel. Spec. Rept. 30, 130 p., 17 figs.
Hurr, R. T., 1966, A new approach for estimating transmissibility from specific capacity: Water Resources Research, v. 2, no. 4, p. 657-664.
Jablonski, L. A., 1959, Records of wells and ground-water quality in Monmouth County, New Jersey: New Jersey Dept. Conserv. and Econ. Devel. Water Resources Circ. 2.
1960, Factual data for public-supply wells and selected irrigation s in Monmouth County, New Jersey: New Jersey Dept. Conserv. and
Econ. Devel. Water Resources Circ. 4.
1968, Ground-water resources of Monmouth County, New Jersey: New Jersey Dept. Conserv. and Econ. Devel. Spec. Rept. 23, 117 p., 27 figs.
Lambe, W. T., 1951, Soil testing for engineers: New York, John Wiley and Sons, Inc., 165 p.
Minard, J. P., 1964, Geology of the Roosevelt Quadrangle, New Jersey: u.s. Geol. Survey Geol. Quad. Map GQ-340.
---------- 1965, Geologic map of the Woodstown Quadrangle, Gloucester and Counties, New Jersey: u.s. Geol. Survey Geol. Quad. Map GQ-340.
1969, Geology of the Sandy Hook Quadrangle in Monmouth County, New Jersey: u.s. Geol. Survey Bull. 1276, 43 p.,2 pls., 14 figs.
Minard, J. P., Owens, J. P., and Nichols, T. c., 1964, Pre-Quaternary geology of the Mount Holly Quadrangle, New Jersey: u.s. Geol. Survey Geol. Quad. Map GQ-272.
60

Minard, J. P., Owens, J. P., Sohl, N. F., Gill, H. E., and Mello, J. F., 1969, Cretaceous-Tertiary boundary _in New Jersey, Delaware, and eastern Maryland: u.s. Geol .. Survey Bull. 1274-H, 33 p., 10 figs.
Owens, J. P. and Minard, J.P .. , 1966, Pre-Quaternary geology of the Allentown Quadrangle, New Jersey: U.S. Geol. Survey Geol. Quad .. Map GQ-566.
1970, Rock stratigraphic studies, in Owens, J. P., and others, Stratigraphy of the outcropping post-Magothy Upper Cretaceous fonnations in southern New Jersey and northern Delmarva Peninsula: u.s. Geol. Survey Prof. Paper 674, p. 5-10 •.
Owens, J.P., Minard, J.P., and Sohl, N. F., 1~6~, Cretaceous deltas in the northern New Jersey Coa·stal Plain, in Finks, R. L., ed., Guidebook to field excursions at the 40th Annual Meeting of the New York State Geologists Association: New York, Queens College of the City Univ., p. 33-48 ..
Owens, J. P., Minard, J.P., Sohl, N. F., and Mello, J. F., 1970, Stratigraphy of the outcropping post~Magothy Upper Cretaceous formations in southern New Jersey and northern Delmarva Peninsula, Delaware and Maryland: u.s. Geol. Survey Prof. Paper 674, 60 p., 25 figs.
Owens, J.P., and Sohl, N. F., 1969, Shelf and deltaic paleoenvironments in the Cretaceous-Tertiary formation of the New Jersey Coastal Plain, in Subitzky, Seymour, ed., Geology of selected areas in New Jersey and eastern Pennsylvania and guidebook of excursions: Geol. Soc. America and Associated Societies Ann. Mtg., Atlantic City, New Jersey, 1969, p. 235-278.
Parker, G. G., Rely, A. G., Keighton, W. D., Olmstead, F. H., and others, 1964, Water resources of the Delaware River Basin: u.s. Geol. Survey Prof. Paper 381, 200 p., 12 pls., 75 figs.
Rosenau, J. c., Lang, s. M., Hilton, G. s., and Rooney, J. G., 1969, Geology and ground-water resources of Salem County, New Jersey: New Jersey Dept. Conserv. and Econ. Devel. Spec. Rept. 33, 142 p., 21 figs.
Rush, F. E., 1968, Geology and ground-water resources of Burlington County, New Jersey: New Jersey Dept. Conserv. and Econ. Devel. Spec. Rept. 26, 65 p., 25 figs.
1962, Records of wells and ground-water quality in Burlington County, New Jersey: New Jersey Dept. Conserv. and Econ. Devel. Water Resources Circ. 7.
Seaber, P.R., 1965, Variations in chemical character of water in the Englishtown Formation, New Jersey: U.S. Geol. Survey Prof. Paper 498-B, 35 p., 9 figs.
61

Shepard, F. P., 1954, Nomenclature based on sand-silt-clay ratios: Jour. Sed. Petrology, v. 24, no. 3, p. 151-158.
Theis, C. V., 1935, The relation between the lowering of piezometric surface and the rate and duration of discharge of a well using ground-water storage: Trans. Am. Geophys. Union 16th Ann. Mtg., pt. 2.
Vecchioli, John and Palmer, M. M., 1962, Ground-water resources of Mercer County, New Jersey: New Jersey Dept. Conserv. and Econ. Devel. Spec. Rept. 19, 17 p., 13 figs.
62