Geohydrologic Data from Test Hole USW UZ-6s, Yucca ...
29
Geohydrologic Data from Test Hole USW UZ-6s, Yucca Mountain, Nye County, Nevada by Carole L. Loskot U.S. GEOLOGICAL SURVEY Open-File Report 93-60 Prepared in cooperation with the NEVADA FIELD OFFICE of the U.S. DEPARTMENT OF ENERGY under Interagency Agreement DE-AI08-78ET44802 Denver, Colorado 1993
Transcript of Geohydrologic Data from Test Hole USW UZ-6s, Yucca ...

Geohydrologic Data from Test Hole USW UZ-6s, Yucca Mountain, Nye County, Nevada
by Carole L. Loskot
U.S. GEOLOGICAL SURVEY
Open-File Report 93-60
Prepared in cooperation with the
NEVADA FIELD OFFICE of the
U.S. DEPARTMENT OF ENERGY under
Interagency Agreement DE-AI08-78ET44802
Denver, Colorado 1993

U.S. DEPARTMENT OF THE INTERIOR
BRUCE BABBITT, Secretary
U.S. GEOLOGICAL SURVEY
Robert M. Hirsch, Acting Director
The use of trade, product, industry, or firm names is for descriptive purposes only and does not imply endorsement by the U.S. Government.
For additional information write to: Copies of this report can be purchased from:
Chief, Hydrologic Investigations Program U.S. Geological SurveyYucca Mountain Project Branch Earth Science Information CenterU.S. Geological Survey Open-File Reports SectionBox 25046, MS 421 Box 25286, MS 517Denver Federal Center Denver Federal CenterDenver, CO 80225 Denver, CO 80225

CONTENTS
Abstract..............................................................................................................^^ 1mtroduction............................................................................................^ 1
Purpose and scope..................................................................................................................................................... 1Location and geohydrologic setting.......................................................................................................................... 3
Drilling and casing methods ................................................................................................................................................. 3Coring methods...........................................................................................................................................................^ 4Geology and lithology........................................................................................................................................................... 4Sample collection and handling............................................................................................................................................ 6
Drill cuttings.............................................................................................................................................................. 6Rotary core ..........................................................................................................................^^ 6
Sample testing procedures and results.................................................................................................................................. 7Gravimetric water-content measurements................................................................................................................. 7Water-potential measurements................................................................................................................................... 7Bulk- and grain-density measurements..................................................................................................................... 21
Summary...........................................................................................................................^^ 25Selected references..................................................................................................................................^ 25
FIGURES
1. Map showing location of test holes USW UZ-6s and USW UZ-6........................................................................ 22. Schematic diagram showing drilling system used for test hole USW UZ-6s....................................................... 3
3-6. Graphs showing:3. Rotary coring drill rate and degree of welding at test hole USW UZ-6s..................................................... 54. Gravimetric water-content measurements from coarse-size fraction drill cuttings and
composite core from test hole USW UZ-6s............................................................................................ 185. Water-potential measurements from coarse-size fraction drill cuttings and
composite core from test hole USW UZ-6s............................................................................................ 206. Bulk- and grain-density measurements of rotary core from test hole USW UZ-6s..................................... 24
TABLES
1. Stratigraphic units penetrated by test hole USW UZ-6s ....................................................................................... 42. Rotary-core record for test hole USW UZ-6s........................................................................................................ 83. Results of laboratory analyses for gravimetric water content and water potential of coarse drill
cuttings from test hole USW UZ-6s................................................................................................................. 104. Results of laboratory analyses for gravimetric water content and water potential of composite
core samples from test hole USW UZ-6s ......................................................................................................... 165. Summary of relation of gravimetric water-content measurements of composite core from
test hole USW UZ-6s to lithology and degree of welding................................................................................ 196. Summary of relation of water-potential measurements of composite core from test hole USW UZ-6s
to lithology and degree of welding................................................................................................................... 217. Results of laboratory analyses for bulk- and grain-density measurements of rotary-core samples from
test hole USW UZ-6s........................................................................................................................................ 228. Summary of relation of bulk- and grain-density measurements of composite core from
test hole USW UZ-6s to lithology and degree of welding................................................................................ 23
CONTENTS III
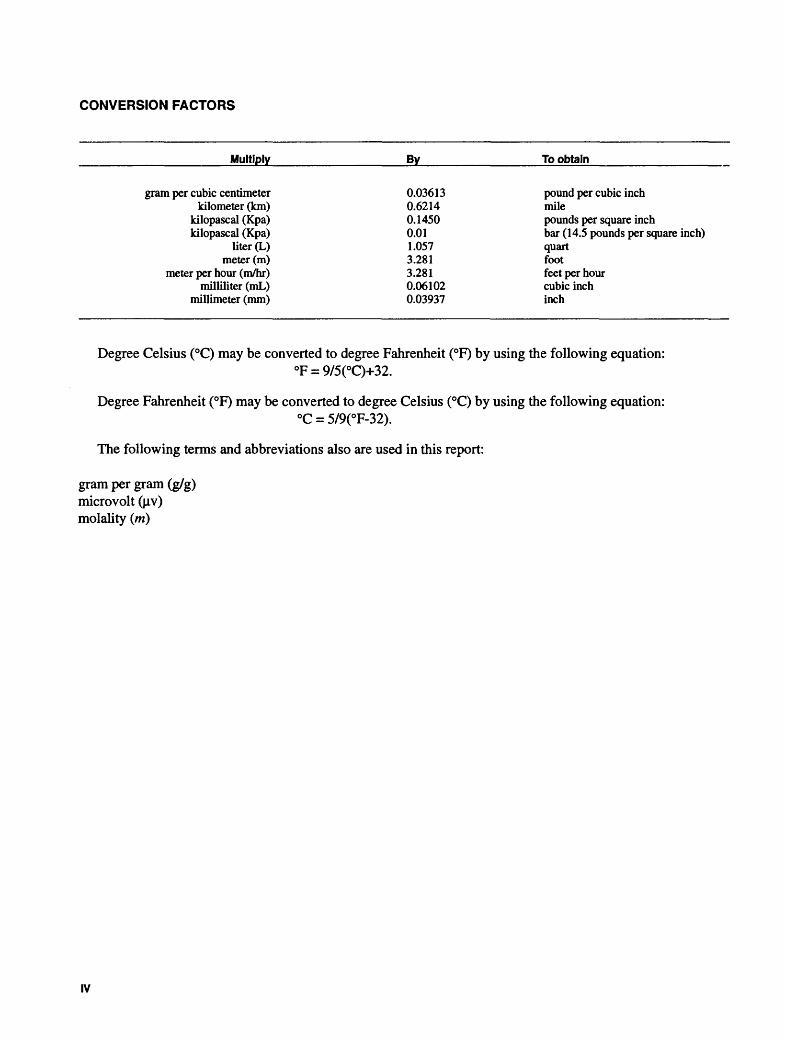
CONVERSION FACTORS
Multiply
gram per cubic centimeterkilometer (km)
kilopascal (Kpa)kilopascal (Kpa)
liter (L)meter (m)
meter per hour (m/hr)milliliter (mL)
millimeter (mm)
By
0.036130.62140.14500.011.0573.2813.2810.061020.03937
To obtain
pound per cubic inchmilepounds per square inchbar (14.5 pounds per square inch)quartfootfeet per hourcubic inchinch
Degree Celsius (°C) may be converted to degree Fahrenheit (°F) by using the following equation:°F = 9/5(°C)+32.
Degree Fahrenheit (°F) may be converted to degree Celsius (°C) by using the following equation:°C = 5/9(°F-32).
The following terms and abbreviations also are used in this report:
gram per gram (g/g) microvolt (uv) molality (m)
IV

Geohydrologic Data from Test Hole USW UZ-6s, Yucca Mountain, Nye County, Nevada
ByCarole L Loskot
Abstract
As part of the investigation of Yucca Moun tain, Nevada, as a potential site for storing high- level radioactive wastes in an underground mined geologic repository, the U.S. Geological Survey, in cooperation with the U.S. Department of Energy, in 1982, began drilling a series of test holes in and near the southwestern part of the Nevada Test Site to determine the geologic and hydrologic characteristics of the area. Test hole USW UZ-6s is part of that series of test holes, and this report presents data obtained from test hole USW UZ-6s. The data include those from drilling operations, lithology, coring, and laboratory anal yses of hydrologic properties, which include gravimetric water content, water potential, and bulk- and grain-density values.
The gravimetric water content of the densely welded section of the Tiva Canyon Mem ber of the Paintbrush Tuff averages 0.027 gram per gram for test hole USW UZ-6s; water potential averages -7,200 kilo-pascals; gravimetric water content of the moderately to densely welded tuffs range from 0.054 gram per gram for the Tiva Can yon Member of the Paintbrush Tuff to 0.027 gram per gram for the Topopah Spring Member of the Paintbrush Tuff; and water potentials range from -6,700 to -3,400 kilopascals. Gravimetric water content for the partially welded to unnamed bed ded tuffs average 0.123,0.106, and 0.085 gram per gram for the Tiva Canyon Member, the unnamed bedded tuffs, and the Topopah Spring Member in test hole USW UZ-6s; average water potentials for these unitsare -1,700,-480, and-820kilopascals.
INTRODUCTION
Yucca Mountain in southwestern Nevada (fig. 1) is being studied as a potential site for storing high-level radioactive wastes in an underground mined geologic repository. In 1982, the U.S. Geological Survey, in
cooperation with the U.S. Department of Energy under interagency agreement DE-AI08-78ET44802, began a series of investigations to provide information about the geology and hydrology of the area. These investi gations are a part of the Yucca Mountain Project (YMP), formerly known as Nevada Nuclear Waste Storage Investigations, (NNWSI).
The principal method of investigation has been test drilling. A series of relatively shallow (160 m or less) and deep (160 to 770 m) unsaturated-zone test holes have been (or are projected to be) drilled at Yucca Mountain in rocks of volcanic and volcanic-clastic ori gin. The main objectives of this unsaturated-zone test- hole program are: (1) To determine the flux of water moving through the units of the nonwelded and bedded tuff in the unsaturated rock; (2) to determine the verti cal distribution of water content, water potential, and other geohydrologic characteristics in the rock units penetrated; and (3) to monitor changes in test-hole characteristics with time.
Test hole USW UZ-6s (hereinafter referred to as UZ-6s) is the sixth test hole in the series of unsaturated- zone test holes. Test hole UZ-6s was primarily drilled to provide an uncased zone for instrumentation because the upper 80.8 m of a nearby deeper test hole (USW UZ-6) had to be cased off during drilling. This zone was in the highly fractured, densely welded Hva Canyon Member of the Paintbrush Tuff (Whitfield and others, 1992).
Purpose and Scope
This report presents geologic and hydrologic data collected from UZ-6s in 1985 during the drilling and coring of this test hole. These data were used to partially fulfill the second objective of the shallow, unsaturated-zone test-hole program. The report also presents data for methods for drilling, coring, sample collection and handling, and testing. The laboratory results of tests on the drill cuttings and cores obtained are included. Work done in UZ-6s was in accordance with procedures established by the YMP Quality Assurance Program.
Abstract

36°45'
Amargosa Valley (formerly Lathrop Wells)
Base from U.S. Geological Survey 1:250,000, Death Valley, California: Nevada, 1970 Q 10 KILOMETERS
0 5
Figure 1. Location of test holes USW UZ-6s and USW UZ-6.
10 MILES
2 Geohydrologic Data from Test Hole USW UZ-6s, Yucca Mountain, Nye County, Nevada

Location and Geohydrologic Setting
Test hole UZ-6s is located in Nye County, Nevada, approximately 145 km northwest of Las Vegas near the Nevada Test Site. Coordinates of the well site are based on the Nevada State Coordinate System, Nevada Central Zone. The coordinates of UZ-6s are N 231,609.1 and E 170,085.5 m. Test hole UZ-6s is located on the crest of Yucca Mountain at an altitude of 1,508.52 m, approximately 95 m west of test hole USW-UZ-6. Drilling and coring of UZ-6s started on April 23,1985, and was completed June 19, 1985. Work was suspended from June 21 to August 26,1985. From August 30, 1985, to September 6,1985, the test hole was cleaned out and the casing removed.
Test hole UZ-6s is drilled into the Paintbrush Tuff of Miocene age to a depth of 158.2 m. The mem bers of the Paintbrush Tuff penetrated, in descending order, are the Tiva Canyon Member, an unnamed bed ded tuff, and the Topopah Spring Member.
DRILLING AND CASING METHODS
Drilling, coring, and casing methods used in UZ-6s are described in detail by Hammermeister and others (1985); therefore, these methods are only briefly described in this report. These authors also have reported that these methods minimally disturb the water content of the formation rock, core, and, in some places, drill cuttings.
Drilling and casing of UZ-6s was conducted using the Odex 165 drilling system, which uses air as the drilling fluid. The method involves percussion- hammer drilling and casing driving that are conducted simultaneously downhole. A pilot bit and an eccentric reamer are used to drill a hole slightly larger than the outside diameter (O.D.) of the casing. The percussion hammer impacts on the casing through a casing shoe attached to the bottom joint of the casing (fig. 2). Thus, the casing is advanced as the hole is drilled deeper. Drill cuttings are returned to the surface through the inside of the casing, thereby minimizing disturbance to the test-hole walls. Compressed air is injected into the casing through the drill pipe to aid in removal of drill cuttings.
A sulfur hexafluoride tracer (SF6) was injected into test hole UZ-6s during drilling and coring from the surface to a depth of 88.4 m, and bromochlorofluoro- methane (CBrClF2) was injected from 88.4 m to the total depth of the borehole at 158.2 m. Subsequent gas sampling in the borehole will determine the presence or absence of atmospheric contamination caused by the drilling and coring.
55?
Guide sleeve
Percussion hammer
Guide
Reamer
JDL
Drill pipe
- Outlet for cuttings
Impact energy transmitted here to the casing tubes
Casing shoe
Pilot bit
Figure 2. Drilling system used for test hole USW UZ-6s (from Hammermeister and others, 1985, p. 512).
DRILLING AND CASING METHODS
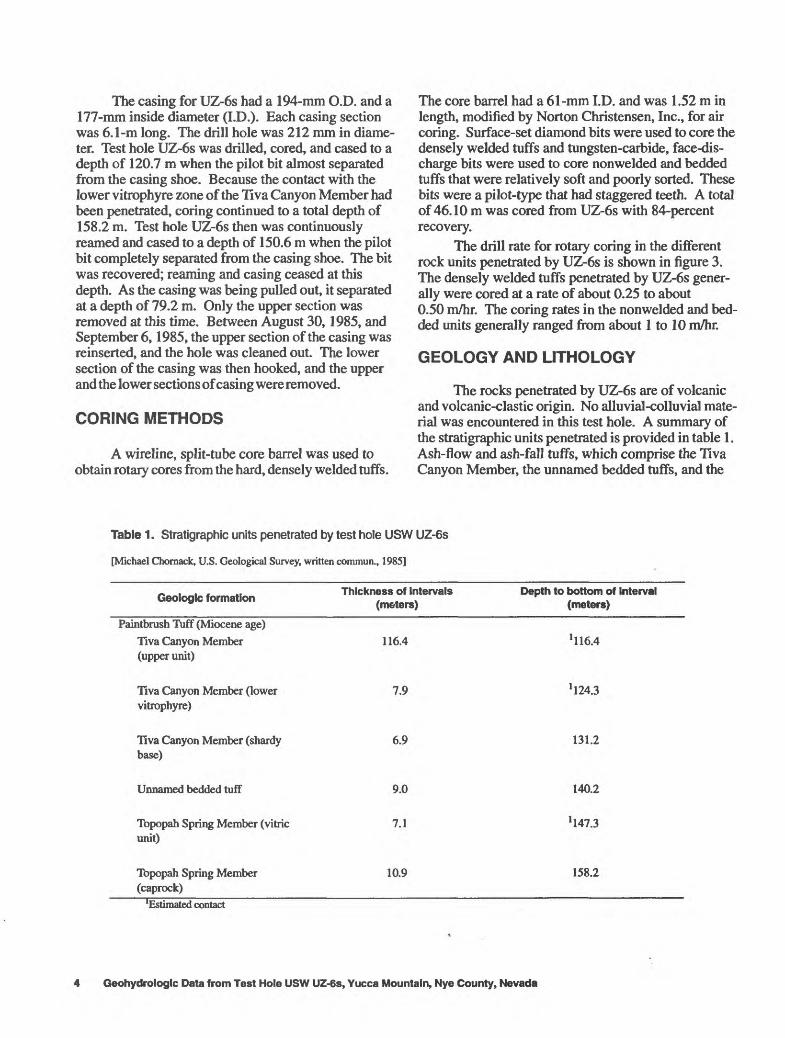
The casing for UZ-6s had a 194-mm O.D. and a 177-mm inside diameter (I.D.). Each casing section was 6.1-m long. The drill hole was 212 mm in diame ter. Test hole UZ-6s was drilled, cored, and cased to a depth of 120.7 m when the pilot bit almost separated from the casing shoe. Because the contact with the lower vitrophyre zone of the Tiva Canyon Member had been penetrated, coring continued to a total depth of 158.2 m. Test hole UZ-6s then was continuously reamed and cased to a depth of 150.6 m when the pilot bit completely separated from the casing shoe. The bit was recovered; reaming and casing ceased at this depth. As the casing was being pulled out, it separated at a depth of 79.2 m. Only the upper section was removed at this time. Between August 30,1985, and September 6,1985, the upper section of the casing was reinserted, and the hole was cleaned out. The lower section of the casing was then hooked, and the upper and the lower sections of casing were removed.
CORING METHODS
A wireline, split-tube core barrel was used to obtain rotary cores from the hard, densely welded tuffs.
The core barrel had a 61-mm I.D. and was 1.52 m in length, modified by Norton Christensen, Inc., for air coring. Surface-set diamond bits were used to core the densely welded tuffs and tungsten-carbide, face-dis charge bits were used to core nonwelded and bedded tuffs that were relatively soft and poorly sorted. These bits were a pilot-type that had staggered teeth. A total of 46.10 m was cored from UZ-6s with 84-percent recovery.
The drill rate for rotary coring in the different rock units penetrated by UZ-6s is shown in figure 3. The densely welded tuffs penetrated by UZ-6s gener ally were cored at a rate of about 0.25 to about 0.50 m/hr. The coring rates in the nonwelded and bed ded units generally ranged from about 1 to 10 m/hr.
GEOLOGY AND LITHOLOGY
The rocks penetrated by UZ-6s are of volcanic and volcanic-clastic origin. No alluvial-colluvial mate rial was encountered in this test hole. A summary of the stratigraphic units penetrated is provided in table 1. Ash-flow and ash-fall tuffs, which comprise the Tlva Canyon Member, the unnamed bedded tuffs, and the
Table 1. Stratigraphic units penetrated by test hole USW UZ-6s
[Michael Chornack, U.S. Geological Survey, written commun., 1985]
Geologic formationThickness off Intervals
(meters)Depth to bottom off Interval
(meters)
Paintbrush Tuff (Miocene age) Tiva Canyon Member (upper unit)
116.4 '116.4
Hva Canyon Member (lower vitrophyre)
7.9 1 124.3
Tlva Canyon Member (shardy base)
6.9 131.2
Unnamed bedded tuff
Topopah Spring Member (vitric unit)
9.0
7.1
140.2
'147.3
Topopah Spring Member (caprock)
10.9 158.2
'Estimated contact
Geohydrologlc Data from Test Hole USW UZ-6s, Yucca Mountain, Nye County, Nevada

s Aooiomn QNV Aooioao
CO
3OJ
DO O5T
3Q.
0) 02
Q. Q. 0>
(Q
iQ. 3*
(Q (-)
a o11o Oc OCO 5 5 | c i H 30
DEPTH, IN METERS
Oo
0°o
mCO
m CD m30
m30
OC 30
1
n
3 ^aEt*>- y-^ >- -< -<
5.TJ oiQ
IS°<
o s~ =:o =2 £sm om ^ro <2 s:
03 -n
°-^
|lQ.O
PAINTBRUSH TUFF FORMATION
I I I I I I I I I I I I I I I I I I I I I I I I I I I I I I I I I I I I

Topopah Spring Member of the Paintbrush T\iff For mation of Miocene age, are the predominant rock types in this section. The tuffs exhibit various degrees of welding, ranging from nonwelded to densely welded. The upper unit of the Tlva Canyon Member of the Paintbrush Tuff consists of a devitrified tuff that is densely welded and underlain by a lower vitrophyre zone that is moderately to densely welded, which grades into a shardy base that is partially welded to nonwelded. The portion of the Topopah Spring Mem ber of the Paintbrush Tuff penetrated in UZ-6s consists of a thin, partially welded upper vitric unit, which is underlain by a caprock that is moderately to densely welded.
SAMPLE COLLECTION AND HANDLING
Sample collection and handling followed approved YMP quality-assurance procedures. All pro cedures were designed to minimize the disturbance of the water content of the samples from the time the sam ples were removed from the test hole until gravimetric water-content and water-potential measurements were made.
glove box. Coarse-particle-size fraction of drill cut tings from UZ-6s were used for water-content and water-potential measurements. If an insufficient vol ume of coarse cuttings was collected for water-content measurements and for water-potential measurements, fine- or composite-particle-size cuttings were used for the water-content measurements. Coarse samples were defined as those cuttings that would not pass through a screen that had about 1.6-mm openings, whereas fine samples were defined as those cuttings that would pass through this size opening. Samples taken directly from the jars were designated as composite samples. Coarse cuttings were always collected for water-potential mea surements because only a small sample was necessary for testing. Samples for gravimetric water content were placed in preweighed 420-mL moisture cans and immediately weighed. Samples for water-potential measurements were placed in small glass jars (approx imately 120 mL or less), capped, taped, labeled, sealed in wax, and stored at room temperature (about 20 to 25 °C) until the measurements could be made.
Rotary Core
Drill Cuttings
Drill cuttings were collected for the determina tion of a lithologic record as well as hydrologic proper ties. Cuttings returned to the surface through the casing during drilling were diverted through a flexible hose to a dry cyclone separator located nearby. After a pre scribed interval of the test hole had been drilled, the gate valve on the bottom of the separator was opened, and the cuttings fell into the collection containers. The cyclone separator was emptied at each collection inter val to avoid any mixing of samples. If the cuttings were moist, a hammer was used to loosen the cuttings off the inside walls of the separator. Drilling generally did not stop during sample collection.
A 0.5-L sample of cuttings was collected for lithologic description at the same time that 1 or 2 L of cuttings were collected at each sampling interval for laboratory measurements of water content and water potential. If the cuttings consisted mainly of fine grained material, 2 L were collected. The cuttings were placed in 1-L glass mason jars. These jars were capped immediately with air-tight lids, taken into the onsite laboratory as soon as possible, and placed inside a humidified glove box.
Drill cuttings from UZ-6s were collected at 0.6-m intervals from a depth of 2.1 to 150.3 m. The drill cuttings were processed inside the humidified
Test hole UZ-6s was continuously cored from 120.7 to 158.2 m before the hole was reamed and the casing set at a depth of 150.6 m. A 0.61-m core gener ally was collected from every 6.1-m interval drilled in the moderately to densely welded tuffs in UZ-6s, beginning at a depth of 23.16 to 120.70 m. After obtaining the 0.61-m core, the hole was reamed and the 6.1-m-long casing inserted. In highly fractured zones of the densely welded tuff, shorter cores or no cores were occasionally collected due to poor recovery.
Cores from the partially welded, nonwelded, and bedded tuff units beginning at 120.70 to 158.19 m were obtained using a 1.52-m-long HWD4 core barrel with a split inner tube. The top one-half of the split inner tube was removed in the humidified glove box. The natural fractures of the core were described, and a preliminary lithologic description was made. For each 1.52-m-long core, a 91-mm-long segment of core from near the bot tom and another from near the midsection of the core generally were removed for gravimetric water-content and water-potential measurements. If the core was highly fragmented, more samples were obtained for gravimetric water-content and water-potential mea surements that did not require solid pieces of core; solid pieces of core were required, however, for other hydrologic testing. Whenever possible, one 1.52-m-long core segment that was relatively unfrag- mented was taken from each one-half of the core for matric-potential measurements, and one additional
6 Geohydrologic Data from Test Hole USW UZ-6s, Yucca Mountain, Nye County, Nevada

91-mm-long core segment that was relatively unfrag- mented was taken for permeability-related tests. Finally, a 91-mm-long section of core was selected from most core runs for the extraction and geochemical analysis of pore water (Mower and others, 1990). All core segments, except for those used for gravimetric water-content and water-potential measurements, were placed in split polyvinyl (PVC) liners, capped, taped, labeled, waxed, and stored at about 20 to 25°C for future hydrologic testing.
Core that was designated for gravimetric water- content measurements was put in a preweighed mois ture can. Core to be used for water-potential measure ments was broken into small fragments inside a humidified glove box, placed in a 120-mL, or smaller, container, capped, taped, labeled, and waxed for later measurements. All cored intervals and recovered cores for UZ-6s are listed in table 2.
SAMPLE TESTING PROCEDURES AND RESULTS
Gravimetric Water-Content Measurements
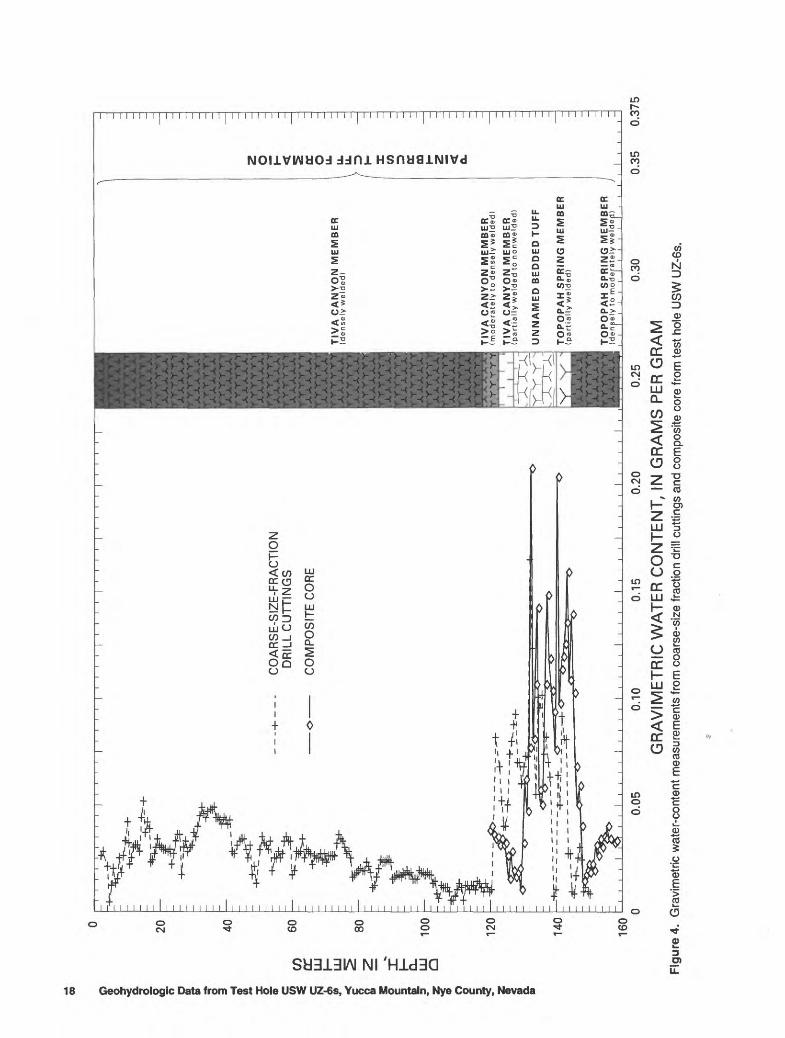
Gravimetric water-content measurements were done onsite at the U.S. Geological Survey field labora tory, using standard gravimetric oven-drying methods (Gardner, 1965) following approved YMP quality- assurance procedures. Moisture cans of known weight were filled with drill cuttings or core and immediately weighed. These moisture cans were weighed again after baking in an oven at 105°C for a minimum of 18 hours. Gravimetric water content, in gram per gram, equals the water lost through drying, divided by the weight of the dried sample. Results of laboratory analyses for gravimetric water content for UZ-6s cut tings and core are listed in tables 3 and 4. The depths of cuttings listed in table 3 represent the midpoints, or average depths, of the sample-collection intervals of the drill cuttings. Gravimetric water-content measure ments of composite core samples and coarse-size frac tions of drill cuttings for UZ-6s are shown in figure 4.
The gravimetric water content of the volcanic tuffs are related to the degree of welding. A summary of gravimetric water-content measurements of com posite core samples related to geologic formation and degree of welding is listed in table 5. Only the core data for UZ-6s are tabulated because the cores are less disturbed than the drill cuttings and, therefore, are assumed to be more representative of in-situ hydro- logic conditions. The densely welded part of the Tiva Canyon Member of the Paintbrush Tuff averaged
0.027 g/g for gravimetric water content, and the mod erately to densely welded part averaged 0.054 g/g.
The partially to nonwelded part of the Tiva Can yon Member of the Paintbrush Tuff averaged 0.123 g/g. The unnamed bedded tuff unit had an aver age gravimetric water content of 0.106 g/g. The Topopah Spring Member of the Paintbrush Tuff is the deepest tuff unit penetrated; the gravimetric water con tent of the partially welded vitric subunit of this unit averaged 0.085 g/g, then decreased to an average of 0.027 g/g in the densely to moderately welded caprock.
Test hole UZ-6s was continuously cored from the interval of 120.7 to 158.2 m before the hole was reamed. The gravimetric water content of cuttings from this interval averaged 0.058 g/g, which is lower than the gravimetric water content of core, which aver aged 0.087 g/g.
After determination of the gravimetric water content, the dried core samples were placed in paper cartons and labeled. These samples were later tested by Holmes & Narver Materials Testing Laboratory, Inc., at Mercury, Nev., for measurements of bulk density and grain density.
Water-Potential Measurements
Water potential is defined as the sum of matric and osmotic potentials. Water potentials were mea sured using a Richards' SC-10 thermocouple psy- chrometer and an NT-3 nanovoltmeter. The SC-10 psychrometer is a stationary device that has ten rotating chambers into which sample cups are placed. The Richards' method (Richards and Ogata, 1958) is based on dipping a ceramic bead attached at the thermocouple junction into distilled water, then letting it reach vapor equilibrium while positioned over a sample. The ceramic bead is located inside the SC-10 psychrometer. The rate of evaporation of distilled water on the ceramic bead is measured as voltage-output readings, generally for 10 minutes, on the nanovoltmeter while vapor equilibrium occurs. Drier samples of more than approximately -25 bars generally reach equilibrium in less than 10 minutes; moister samples of approximately -25 bars or less generally require 10 minutes. Voltage outputs are recorded at 1-minute intervals.
Two SC-10 psychrometers were used for mea suring water potentials of rock samples. Sample cups were placed in the ten rotating chambers of the SC-10 psychrometer. Three of the ten sample cups (cups 1 through 3) were lined with filter paper and wetted with three of six calibration standards of known molality; six of the sample cups (cups 4 through 9) were filled with cuttings or core samples; the last sample cup
SAMPLE TESTING PROCEDURES AND RESULTS 7

Table 2. Rotary-core record for test hole USW UZ-6s
[A, gravimetric water-content, water-potential, bulk-density, and grain-density measurements; B, matric-potential measurements; C, D, E, permeability-related and miscellaneous measurements; , no data. The core intervals and lengths were measured to the nearest 0.1 foot, or approximately plus or minus 0.015 meter; core intervals are listed to plus or minus 0.005 meter for convenience and as a result of conversion from inch-pound units.]
Core run number1
123456789
1011121314151617181920212223242526272829303132333435363738394041
Cored Interval (meters)
23.16-23.7729.26-29.8735.36-35.9641.45-42.0647.55-48.1653.64-53.9559.74-60.3565.83-66.4478.02-78.6384.12-84.7390.22-90.5290.52-90.5896.31-96.92
102.41-103.02108.50-109.11114.60-115.21120.69-122.22122.22-123.74123.74-125.27125.27-126.79126.79-128.31128.31-129.84129.84-130.75130.75-131.97131.97-133.50133.50-134.72134.72-136.24136.24-137.76137.76-139.29139.29-140.81140.81-142.03142.03-143.55143.55-144.77144.77-146.30146.30-146.60146.60-147.21147.21-148.43148.43-149.19149.19-149.50149.50-150.87150.87-152.39
Cored length (meters)
0.610.610.600.610.610.310.610.610.610.610.300.060.610.610.610.611.531.521.531.521.521.530.911.221.531.221.521.521.531.521.221.521.221.530.300.611.220.760.311.371.52
Core recovered (meters)
0.490.610.610.610.610.300.610.610.610.610.270.000.580.550.430.531.521.521.521.521.521.220.611.521.221.520.760.551.281.070.980.640.460.000.060.611.040.640.351.371.52
Laboratory tests
ADEACE
ACDEADE
ACDEACDEADE
ABCDEACDEACDEACD
ACDEACDEADEADE
ABCDEABCDEABCDEABCDEABCDE
AEABCD
ABCDEABCDEABCDEABDEABDEACDE
ABCDEABDE
ABCDEADE
AABDE
ABCDEABDEADE
ABCDEABCDE
8 Geohydrologlc Data from Test Hole USW UZ-6s, Yucca Mountain, Nye County, Nevada

Table 2. Rotary-core record for test hole USW UZ-6s«Continued
Core run number1
42434445
Cored Interval (meters)
152.39-153.92153.92-155.14155.14-156.66156.66-158.18
Cored length (meters)
1.531.221.521.52
Core recovered (meters)
1.071.521.521.52
Laboratory tests
ABCDEABCDEABCDEABCDE
Core runs 1-16 were drilled in the upper unit of the Tiva Canyon Member, a densely welded unit; cores were selectively collected from this unit
(cup 10) was filled with distilled water. The calibration standards were measured concurrently with the cut tings or core samples to compensate for the zero drift of the nanovoltmeter amplifier due to change in tempera ture. The calibration standards used, and their approx imate kilopascal equivalents, were: 0.02 m (molality),-100 Kpa; 0.05 m, -230 Kpa; 0.1 m, -460 kPa; 0.4 m,-1,800 kPa; 0.8 m, -3,700 kPa; and 1.5 m, -7,200 kPa.
The same calibration standards were not used for all cuttings and core samples. As much as possible, samples that had similar water contents, based on gravimetric water-content measurements, were pro cessed together. Three calibration standards then were selected within a range that spanned the expected pos sible water-potential range of the six cuttings or core samples in the SC-10 psychrometer.
The SC-10 psychrometer sample cups are loaded with calibration standards and rock samples in a humidified glove box to minimize evaporation. The ten sample cups then are placed into the ten sample chambers of the SC-10 psychrometer. Samples in the SC-10 psychrometer are allowed to equilibrate for a minimum of 30 minutes before any measurements are made. All measurements were made inside the humid ified glove box, at a relatively constant room temper ature, generally at 20 to 25°C.
The procedure for taking water-potential mea surements begins by first taking a temperature reading from the nanovoltmeter of the calibration standard in the first chamber (cup 1). The NT-3 nanovoltmeter, by Decagon Devices, is designed to measure both resis tance and temperature. The sample cups in the cham bers are rotated, and the ceramic bead of the thermocouple is wetted in the distilled water (cup 10). The samples are rotated back until the thermocouple is located again over the first chamber (cup 1). As long as
10 minutes are allowed for vapor equilibrium to occur; voltage outputs are recorded at 1-minute intervals. Another temperature reading is then taken. The cali bration chambers are rotated, and the ceramic bead is wetted again in the distilled water (cup 10). The cali bration chambers are then rotated until the thermocou ple is located over the second chamber (cup 2). Voltage-output readings are again taken at 1-minute intervals for as long as 10 minutes. This continues until voltage-output readings have been recorded for all the calibration standards and the rock samples (cups 1 through 9).
At the end of 10 minutes of recording the voltage outputs, an averaged representative voltage-output reading is selected based on the evidence of a plateau. This plateau in voltage-output readings occurs when the system is in equilibrium, and little change is evident in the voltage-output readings. Once sufficient evapo ration has occurred, the meniscus of the water on the ceramic bead loses its cohesiveness, evaporation pro ceeds more quickly, and the voltage-output readings begin dropping off rapidly. For moister samples of more than -2,000 kPa, the plateaus tend to be more evi dent during the last 5 minutes of the voltage-output readings and tend to last longer; for very moist samples of more than -400 kPa, the plateau drop-off may not be noted in the 10 minutes of voltage-output readings. For drier samples of less than -5,000 kPa, the plateaus tend to occur during the first 5 minutes of voltage-output readings and may only last for a couple of minutes before the readings begin dropping off rapidly. Very dry samples with readings of less than -10,000 kPa generally level off sufficiently fast that the voltage-out put reading recorded at 1 minute is considered to be the plateau.
SAMPLE TESTING PROCEDURES AND RESULTS 9

Table 3. Results of laboratory analyses for gravimetric water content and water potential of coarse drill cuttings from test hole USW UZ-6s
[--, no data]
Depth of midpoint of sample (meters)
2.12.73.44.04.65.25.86.4
7.07.68.28.89.4
10.110.510.8
11.311.912.513.113.7
14.314.915.516.2
16.817.217.718.318.7
19.219.820.421.0
21.622.322.923.524.124.725.325.9
Gravimetric water content (gram per gram)
0.0260.028
-
0.0210.0040.0120.0200.0130.0150.0250.0180.026
0.0330.0420.0320.022
0.0250.0300.0310.0310.0280.0440.0520.0370.042
0.0390.0230.0240.0270.0300.0340.0310.0300.029
0.0290.028
0.0290.0220.0270.0330.0360.036
Water potential (kllopascals)
-790-630
~-670
-25,000-8,200-2,400-4,700-2,600-1,100-2,700-2,100
-940-420-750
-2,600
-1,600-740-710-520-390-390-570
-1,300-790
-8,300-2,900-3,400-3,000-2,100
-1,300-2,400-2,600-2,700
-2,300-3,800-2,800-5,800-2,500-1,400
-950
-1,500
10 Geohydrologlc Data from Test Hole USW UZ-6s, Yucca Mountain, Nye County, Nevada

Table 3. Results of laboratory analyses for gravimetric water content and water potential of coarse drill cuttings from test hole USW UZ-6s-Continued
Depth of midpoint of sample (meters)
26.527.127.728.329.029.630.230.831.432.032.633.233.834.435.135.736.336.937.538.138.739.339.940.541.141.842.443.344.244.845.446.046.647.247.948.549.149.650.250.951.552.152.7
Gravimetric water content (gram per gram)
0.0170.0300.0330.0280.0300.0310.0370.0350.0400.0450.0490.0460.0440.0470.0480.0480.0490.0440.0440.0430.0410.0440.0430.0410.0430.0280.0270.0310.0330.0340.0340.0290.0250.0310.0170.0210.013
-
0.0290.0350.0320.0310.029
Water potential (kllopescals)
-780
-1,000-1,300-1,600-1,200-2,900-1,100-1,600
-820-950-720-760-900-980-650-660-630-740-710-800-810-650-710-790-610
-3,000-3,900-1,800-1,100-1,200-1,300-2,900-4,100-1,900-6,700-2,300
-15,000-8,400-7,500-1,300-1,600-2,600-3,100
SAMPLE TESTING PROCEDURES AND RESULTS 11

Table 3. Results of laboratory analyses for gravimetric water content and water potential of coarse drill cuttings from test hole USW UZ-6s~Continued
Depth of midpoint of sample (meters)
53.353.954.655.255.856.457.057.658.258.859.460.060.761.361.962.563.163.764.364.965.566.166.867.468.068.669.269.870.471.071.672.272.873.574.174.775.375.976.577.177.778.378.9
Gravimetric water content (gram per gram)
0.0330.0190.0250.0250.0280.0250.0270.0330.0350.0330.0330.0170.0190.0280.0270.0280.0340.0250.0290.0280.0270.0220.0260.0250.0250.0270.0240.0270.0230.0260.0260.0260.0260.0320.0360.0340.0330.0300.0270.0280.0250.0160.017
Water potential (kilopascais)
-1,400-5,700-4,300-4,100-2,800-3,600-3,100-2,000-1,900-2,900-2,300-5,900-5,200-3,900-4,500-4,200-2,000-5,800-4,700-4,400-2,800-6,500-3,200-3,800-3,600-2,900-3,400-2,900-9,000-4,400-3,200-4,000-3,700-1,300
-670-830
-1,200-1,300-2,500-2,000-4,100-8,200-9,200
12 Geohydrologlc Data from Test Hole USW UZ-6s, Yucca Mountain, Nye County, Nevada

Table 3. Results of laboratory analyses for gravimetric water content and water potential of coarse drill cuttings from test hole USW UZ-6s-Continued
Depth of midpoint of sample (meters)
79.680.280.881.482.082.683.283.884.485.085.686.386.987.588.188.789.389.990.591.191.792.493.093.694.294.895.496.096.697.297.898.599.199.7
100.3100.9101.5102.1102.7103.3103.9104.5105.2
Gravimetric water content (gram per gram)
0.0180.0190.0200.0190.0190.0230.0210.0180.0110.0120.0160.0200.0240.0230.0230.0240.0240.0230.0150.0160.0170.0170.0160.0180.0170.0190.0170.0180.0150.0150.0150.0190.0180.0180.0170.0180.0170.0170.0130.0140.0080.0060.012
Water potential (kilopascals)
-10,000-9,800-8,500-6,600-9,600-6,100-8,200-9,700
-16,000-9,500-8,900-5,100-3,800-5,400-6,700-4,700-5,600-6,900-9,900-9,100-6,900-8,300-9,500-5,000-6,700-8,100-6,800-5,300-7,900
-11,000-14,000-12,000-12,000-12,000-12,000-9,100
-11,000-12,000-21,000-15,000-24,000-30,000-18,000
SAMPLE TESTING PROCEDURES AND RESULTS 13
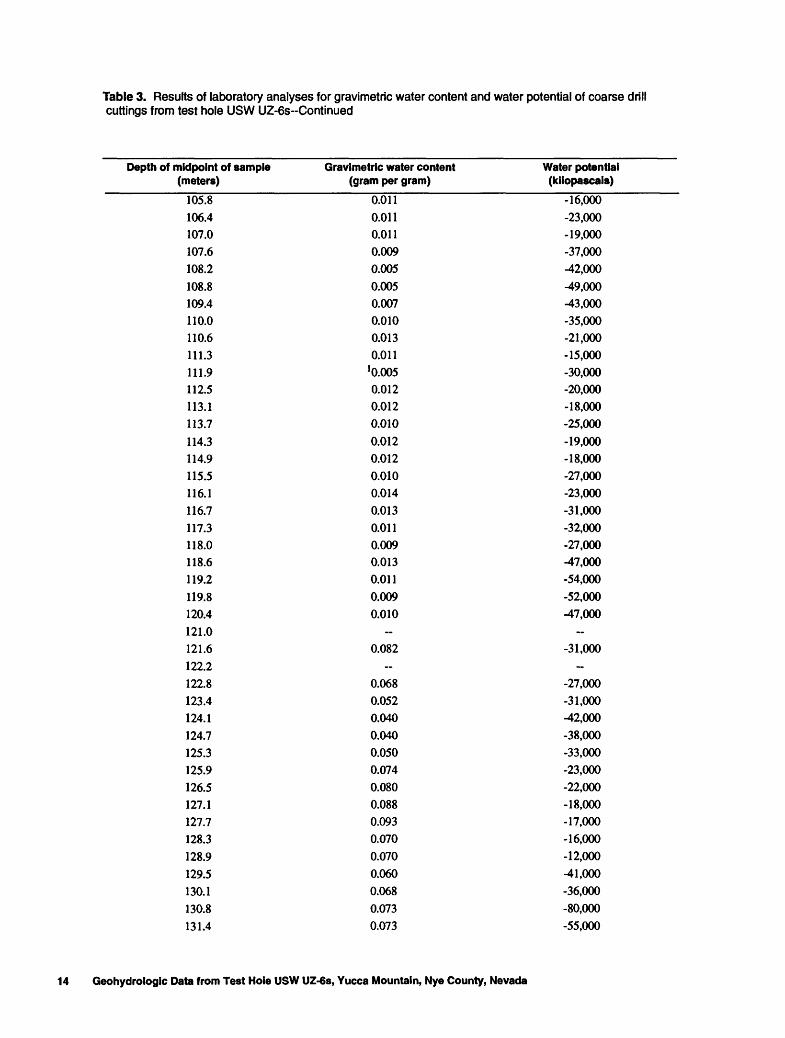
Table 3. Results of laboratory analyses for gravimetric water content and water potential of coarse drill cuttings from test hole USW UZ-6s-Continued
Depth of midpoint of sample (meters)
105.8106.4107.0107.6108.2108.8109.4110.0110.6111.3111.9112.5113.1113.7114.3114.9115.5116.1116.7117.3118.0118.6119.2119.8120.4121.0121.6122.2122.8123.4124.1124.7125.3125.9126.5127.1127.7128.3128.9129.5130.1130.8131.4
Gravimetric water content (gram per gram)
0.0110.0110.0110.0090.0050.0050.0070.0100.0130.011
'0.0050.0120.0120.0100.0120.0120.0100.0140.0130.0110.0090.0130.0110.0090.010
-
0.082
0.0680.0520.0400.0400.0500.0740.0800.0880.0930.0700.0700.0600.0680.0730.073
Water potential (kiiopascals)
-16,000-23,000-19,000-37,000-42,000-49,000-43,000-35,000-21,000-15,000-30,000-20,000-18,000-25,000-19,000-18,000-27,000-23,000-31,000-32,000-27,000-47,000-54,000-52,000-47,000
~
-31,000-
-27,000-31,000-42,000-38,000-33,000-23,000-22,000-18,000-17,000-16,000-12,000-41,000-36,000-80,000-55,000
14 Geohydrologlc Data from Test Hole USW UZ-6s, Yucca Mountain, Nye County, Nevada

Table 3. Results of laboratory analyses for gravimetric water content and water potential of coarse drill cuttings from test hole USW UZ-6s--Continued
Depth of midpoint of sample (meters)
132.0132.6133.2133.8134.4135.0135.6136.2136.9137.5138.1138.7 139.3139.9140.5141.1141.7142.3143.0143.6144.2144.8145.4146.0146.6147.2147.8148.4
2149.0149.7150.3
Gravimetric water content (gram per gram)
0.1660.1240.0820.0550.1010.0960.1020.0740.0820.0700.063
20.0070.0100.0640.0500.0920.0810.0810.0270.0270.0090.0080.0170.0250.0300.0240.009 0.0110.0090.008
Water potential (kilopascals)
-5,600-9,100-7,000-5,600
-16,000-3,900-1,300-8,500
-23,000-14,000-59,000-91,000 -45,000-64,000-57,000-44,000-22,000-24,000-13,000-39,000-57,000-68,000-80,000-66,000-69,000-73,000-40,000-54,000 -51,000-57,000-54,000
Fine drill cuttings 2 Composite drill cuttings
SAMPLE TESTING PROCEDURES AND RESULTS 15

Table 4. Results of laboratory analyses for gravimetric water content and water potential of composite core samples from test hole USW UZ-6s
[--, indicates no data]
Depth interval (meters)
23.26-23.3223.32-23.4129.41-29.5035.36-35.9641.45-41.5741.97-42.0648.01-48.1653.77-53.8460.26-60.3566.08-66.1778.02-78.1484.12-84.7390.22-90.4996.71-96.90
102.82-102.96108.72-108.81114.60-114.73120.93-121.10122.53-122.62122.93-122.99123.84-123.93124.45-124.54125.27-125.39126.13-126.22127.10-127.19127.86-127.96128.32-128.44128.93-129.02129.84-130.12130.58-130.67131.37-131.46131.98-132.10132.47-132.59133.29-133.41133.84-133.96134.84-134.97135.39-135.48136.61-136.79137.95-138.07138.47-138.59139.39-139.48139.78-139.90
Gravimetric water content (gram per gram)
0.0330.0320.0340.0400.0340.0350.0300.0340.0260.0310.0190.0220.0180.0220.0190.0170.0140.0400.0590.0500.0680.1030.1400.1090.1600.1360.1260.1200.1140.0980.2050.0760.0940.1040.1190.1490.1070.0580.0500.0570.1430.107
Water potential (kilopascals)
-1,500-1,500-1,000-1,100-3,100-3,800-4,900-5,400-3,500-5,200-7,700-6,100
-13,000-11,000-18,000-16,000-20,000
-7,900-3,600-9,300-5,900-7,800
-710
-3,000-720-580-580-580-550-500-530-480-480-600-410-360-320-310-280-280-780-960
16 Geohydrologic Data from Test Hole USW UZ-6s, Yucca Mountain, Nye County, Nevada
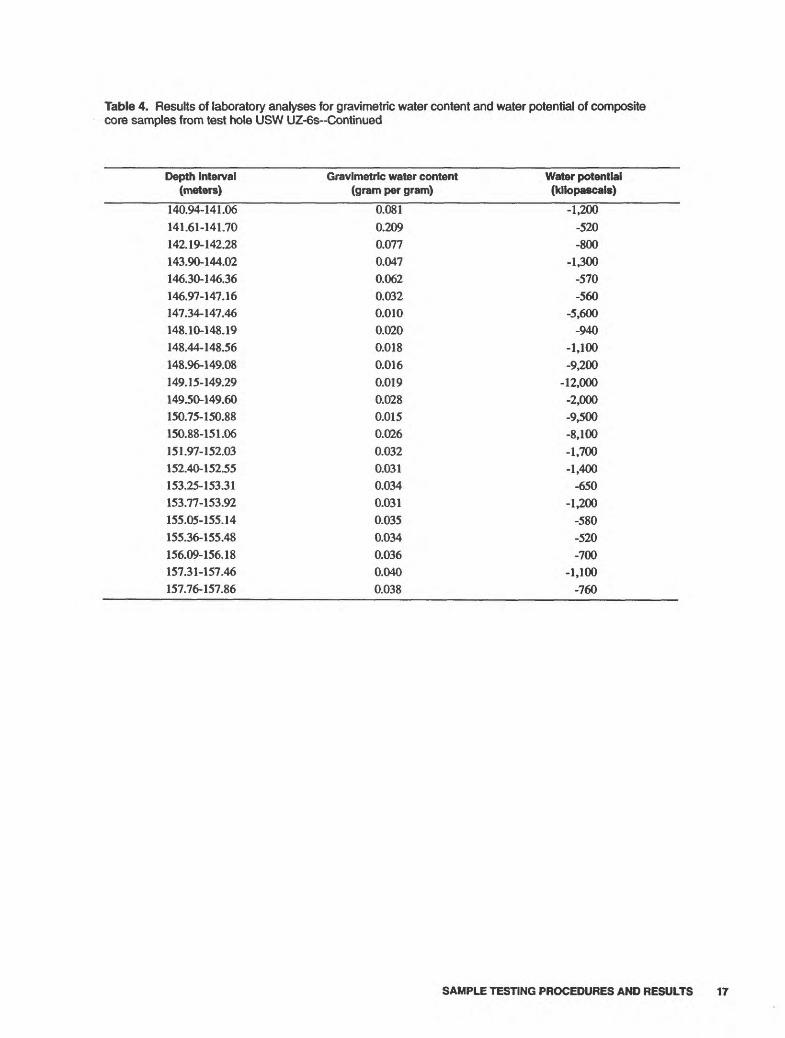
Table 4. Results of laboratory analyses for gravimetric water content and water potential of composite core samples from test hole USW UZ-6s-Continued
Depth interval (meters)
140.94-141.06141.61-141.70142.19-142.28143.90-144.02146.30-146.36146.97-147.16147.34-147.46148.10-148.19148.44-148.56148.96-149.08149.15-149.29149.50-149.60150.75-150.88150.88-151.06151.97-152.03152.40-152.55153.25-153.31153.77-153.92155.05-155.14155.36-155.48156.09-156.18157.31-157.46157.76-157.86
Gravimetric water content (gram per gram)
0.0810.2090.0770.0470.0620.0320.0100.0200.0180.0160.0190.0280.0150.0260.0320.0310.0340.0310.0350.0340.0360.0400.038
Water potential (kfiopascals)
-1,200-520-800
-1,300-570-560
-5,600-940
-1,100-9,200
-12,000-2,000-9,500-8,100-1,700-1,400
-650
-1,200-580-520-700
-1,100-760
SAMPLE TESTING PROCEDURES AND RESULTS 17
o <§ o » o I
C/D CC.
LU LLJ
8 2 i
CO
AR
SE
-SIZ
E-F
RA
CT
ION
D
RIL
L C
UT
TIN
GS
CO
MP
OS
ITE
CO
RE
Y Y
Y Y
Y
. k A
A A
A,
Sk
AA
AA
. /Y
YY
YY
jA
A A
A A
J?. Y
Y Y
Y Y
JX
AA
AA
j ^r Y
Y Y
Y
TIV
A C
AN
YO
N M
EM
BE
RA
AA
AA
J
(de
nse
ly w
eld
ed)
^Y
,YT
.Y.
JY
YY
Y'
JAA
AA
A
KY
YY
Y'
.A A
A A
.'Y
YY
Y'.
A A
AA
.
TIV
A C
AN
YO
N M
EM
BE
R(m
odera
tely
to d
en
se
ly w
eld
ed
)
TIV
A C
AN
YO
N M
EM
BE
R(p
art
ially
we
lde
d t
o n
onw
eld
ed)
UN
NA
ME
D B
ED
DE
D T
UF
F
TO
PO
PA
H S
PR
ING
ME
MB
ER
(pa
rtia
lly w
eld
ed)
TO
PO
PA
H S
PR
ING
ME
MB
ER
(de
nse
ly t
o m
odera
tely
we
lde
d)
i i
I i
i i
i I
i i
i i I
i i
z o DC
O D
CC
DO H
Z <
Q.
0.05
0.30
0.10
0.
15
0.20
0.
25
GR
AV
IME
TR
IC W
AT
ER
CO
NT
EN
T,
IN G
RA
MS
PE
R G
RA
M
Figu
re 4
. G
ravi
met
ric w
ater
-con
tent
mea
sure
men
ts fr
om c
oars
e-si
ze fr
actio
n dr
ill cu
tting
s an
d co
mpo
site
cor
e fro
m te
st h
ole
USW
UZ-
6s.
0.35
0.
375
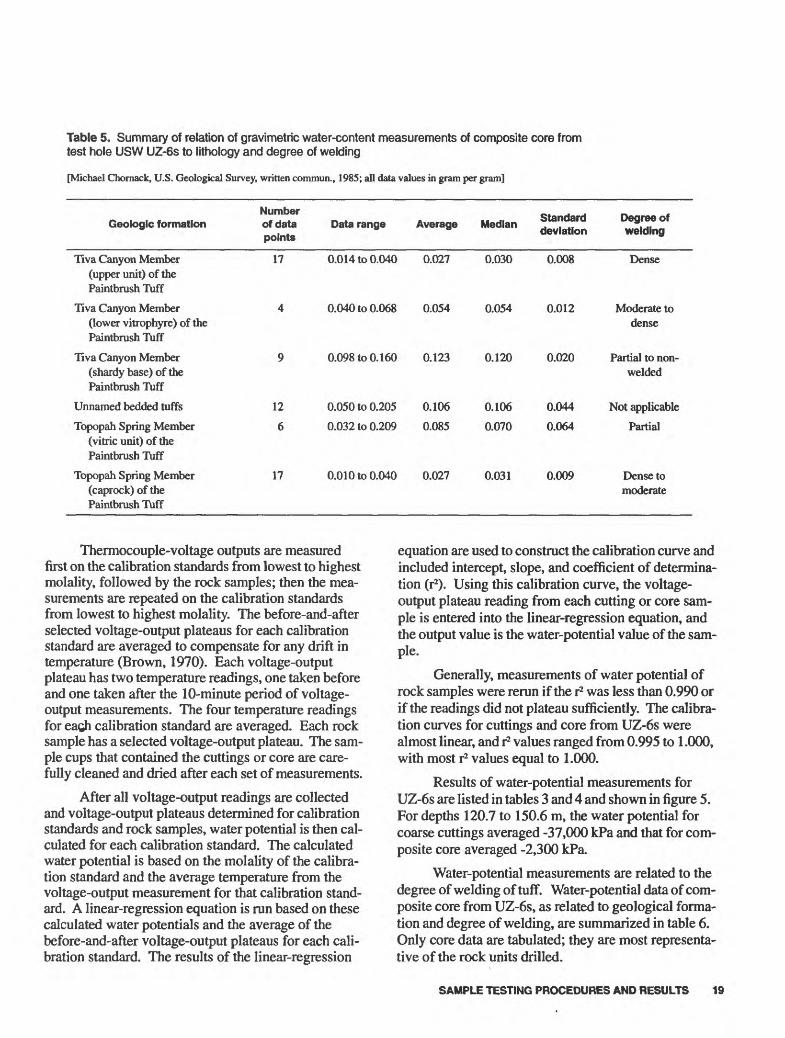
Table 5. Summary of relation of gravimetric water-content measurements of composite core from test hole USW UZ-6s to lithology and degree of welding
[Michael Chornack, U.S. Geological Survey, written commun., 1985; all data values in gram per gram]
NumberGeologic formation
Tiva Canyon Member (upper unit) of the Paintbrush Tuff
Tiva Canyon Member (lower vitrophyre) of the Paintbrush Tuff
Tiva Canyon Member (shardy base) of the Paintbrush Tuff
Unnamed bedded tuffs
Topopah Spring Member (vitric unit) of the Paintbrush Tuff
Topopah Spring Member (caprock)ofthe Paintbrush Tuff
17 0.014 to 0.040 0.027 0.030 0.008
12
6
17
0.040 to 0.068 0.054
0.098 to 0.160 0.123
0.050 to 0.205
0.032 to 0.209
0.106
0.085
0.054
0.120
0.106
0.070
0.012
0.020
0.044
0.064
0.010 to 0.040 0.027 0.031 0.009
Dense
Moderate to dense
Partial to non- welded
Not applicable
Partial
Dense to moderate
Thermocouple-voltage outputs are measured first on the calibration standards from lowest to highest molality, followed by the rock samples; then the mea surements are repeated on the calibration standards from lowest to highest molality. The before-and-after selected voltage-output plateaus for each calibration standard are averaged to compensate for any drift in temperature (Brown, 1970). Each voltage-output plateau has two temperature readings, one taken before and one taken after the 10-minute period of voltage- output measurements. The four temperature readings for eagh calibration standard are averaged. Each rock sample has a selected voltage-output plateau. The sam ple cups that contained the cuttings or core are care fully cleaned and dried after each set of measurements.
After all voltage-output readings are collected and voltage-output plateaus determined for calibration standards and rock samples, water potential is then cal culated for each calibration standard. The calculated water potential is based on the molality of the calibra tion standard and the average temperature from the voltage-output measurement for that calibration stand ard. A linear-regression equation is run based on these calculated water potentials and the average of the before-and-after voltage-output plateaus for each cali bration standard. The results of the linear-regression
equation are used to construct the calibration curve and included intercept, slope, and coefficient of determina tion (r2). Using this calibration curve, the voltage- output plateau reading from each cutting or core sam ple is entered into the linear-regression equation, and the output value is the water-potential value of the sam ple.
Generally, measurements of water potential of rock samples were rerun if the r2 was less than 0.990 or if the readings did not plateau sufficiently. The calibra tion curves for cuttings and core from UZ-6s were almost linear, and r2 values ranged from 0.995 to 1.000, with most r2 values equal to 1.000.
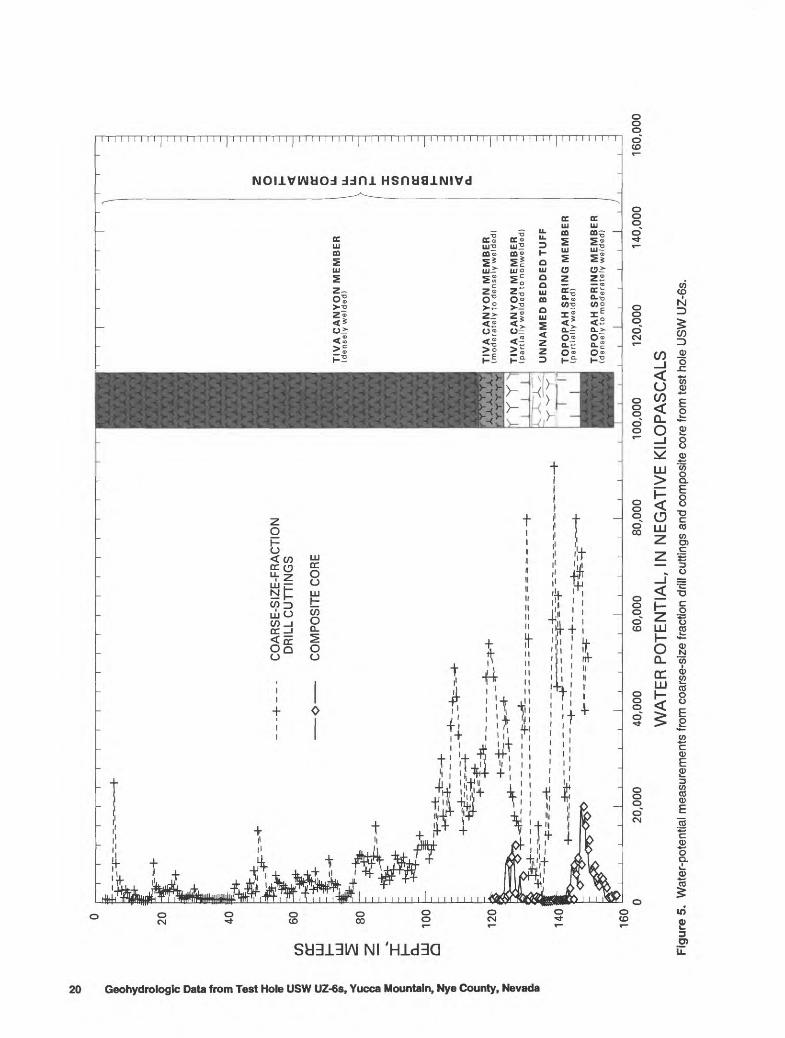
Results of water-potential measurements for UZ-6s are listed in tables 3 and 4 and shown in figure 5. For depths 120.7 to 150.6 m, the water potential for coarse cuttings averaged -37,000 kPa and that for com posite core averaged -2,300 kPa.
Water-potential measurements are related to the degree of welding of tuff. Water-potential data of com posite core from UZ-6s, as related to geological forma tion and degree of welding, are summarized in table 6. Only core data are tabulated; they are most representa tive of the rock units drilled.
10 o O I 5 s o I g 8 I 3 f ? I
CO
AR
SE
-SIZ
E-F
RA
CT
ION
D
RIL
L C
UT
TIN
GS
CO
MP
OS
ITE
CO
RE
r r r
TIV
A C
AN
YO
N M
EM
BE
R(d
ense
ly w
eld
ed
)
TIV
A C
AN
YO
N M
EM
BE
R(m
od
era
tely
to
de
nse
ly w
eld
ed
)
TIV
A C
AN
YO
N M
EM
BE
R(p
art
ially
we
lde
d t
o n
on
we
lde
d)
UN
NA
ME
D B
ED
DE
DT
UF
F
TO
PO
PA
H S
PR
ING
ME
MB
ER
(part
ially
we
lde
d)
TO
PO
PA
H S
PR
ING
ME
MB
ER
(de
nse
ly t
o m
odera
tely
we
lde
d)
20,0
00
40,0
00
60,0
00
80,0
00
100,
000
120,
000
WA
TE
R P
OT
EN
TIA
U I
N N
EG
AT
IVE
KIL
OP
AS
CA
LS
Fig
ure
5. W
ater
-pot
entia
l mea
sure
men
ts fr
om c
oars
e-si
ze fr
actio
n dr
ill c
uttin
gs a
nd c
ompo
site
cor
e fro
m te
st h
ole
USW
UZ-
6s.
140,
000
oc
o D
I- D
OC
00 < O.
160,
000

Table 6. Summary of relation of water-potential measurements of composite core from test hole USW UZ-6s to lithology and degree of welding
[Michael Chomack, U.S. Geological Survey, written commun., 1985; all data values in kilopascals]
Geologic formation
liva Canyon Member (upper unit) of the Paintbrush Tuff
Tiva Canyon Member (lower vitrophyre) of the Paintbrush Tuff
Tiva Canyon Member (shardy base) of the Paintbrush Tuff
Unnamed bedded tuffs
Topopah Spring Member (vitric unit) of the Paintbrush Tuff
Topopah Spring Member (caprock) of the Paintbrush Tuff
Number of data points
17
4
9
12
6
17
Data range
-1,000 to -20,000
-3,600to-9,300
-500to-7,800
-280to-960
-520 to -1,300
-520to-12,000
Average
-7,200
-6,700
-1,700
-480
-820
-3,400
Median
-5,200
-4,800
-580
-440
-680
-1,200
Standard deviation
-6,100
-2,500
-2,400
-210
-340
-3,900
Degree of welding
Dense
Moderate to dense
Partial to nonwelded
Not applica ble
Partial
Dense to moderate
Bulk- and Grain-Density Measurements
The bulk- and grain-density measurements of core samples from UZ-6s were determined by Holmes & Narver Materials Testing Laboratory, Inc., at Mercury, Nev., in accordance with ASTM Procedure D-1188 (American Society for Testing and Materials, 1980a). Bulk density was calculated from bulk spe cific gravity.
After the bulk-density measurement was deter mined, each sample was pulverized to pass through a
200-mesh sieve, was oven-dried, and was tested in accordance with ASTM Procedure D-854 (American Society for Testing and Materials, 1980b), and grain density was calculated. Grain density refers to the weight of a substance compared with the weight of an equal volume of pure water at 4"C. Results of labora tory analyses for bulk- and grain-density measure ments for UZ-6s are listed in table 7 and are summarized in table 8. The bulk- and grain-density measurements of UZ-6s are shown in figure 6.
SAMPLE TESTING PROCEDURES AND RESULTS 21

Table 7. Results of laboratory analyses for bulk- and grain-density measurements of rotary-core samples from test hole USW UZ-6s
[Analyses by Holmes & Narver Materials Testing Laboratory, Inc., Mercury, Nev.; --, no data]
Depth interval of sample (meters)
23.26-23.3223.41-23.4729.41-29.50
35.36-35.9741.45-41.5741.97-42.0648.01-48.1660.26-60.3578.03-78.1484.12-84.7390.22-90.5096.71-96.90
102.82-102.96108.72-108.81114.60-114.73120.93-121.10122.53-122.62122.93-123.02123.84-123.93124.45-124.54
125.27-125.39126.13-126.22127.10-127.19127.86-127.96128.32-128.44128.93-129.02
129.84-130.12130.58-130.67131.37-131.46131.98-132.10132.47-132.59133.29-133.41133.84-133.96134.84-134.97135.39-135.48136.61-136.79137.95-138.07
138.47-138.59139.39-139.48139.78-139.90140.94-141.06
Density (grams per cubic centimeter)
Bulk
2.232.212.172.192.222.232.252.212.332.212.342.312.342.322.341.692.022.021.851.751.701.811.571.501.461.401.40
1.361.271.281.571.481.501.121.38
1.501.611.651.311.741.58
Grain
2.482.472.452.472.502.492.502.512.512.492.492.542.492.492.442.482.412.392.392.432.472.432.412.352.382.382.352.352.452.402.402.442.502.422.46
2.382.382.412.502.502.50
22 Geohydrologic Data from Test Hole USW UZ-6s, Yucca Mountain, Nye County, Nevada
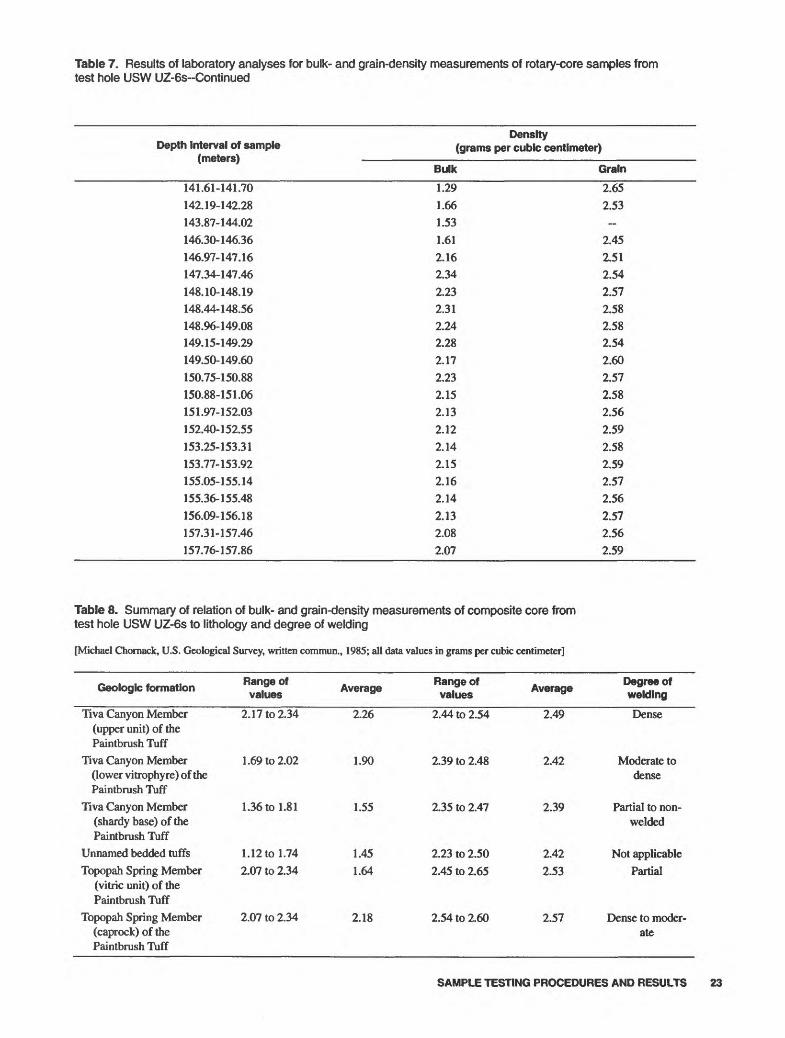
Table 7. Results of laboratory analyses for bulk- and grain-density measurements of rotary-core samples from test hole USW UZ-6s--Continued
Depth Interval off sample (meters)
141.61-141.70142.19-142.28143.87-144.02146.30-146.36146.97-147.16147.34-147.46148.10-148.19148.44-148.56148.96-149.08149.15-149.29149.50-149.60150.75-150.88150.88-151.06151.97-152.03152.40-152.55153.25-153.31153.77-153.92155.05-155.14155.36-155.48156.09-156.18157.31-157.46157.76-157.86
Density (grams per cubic centimeter)
Bulk Grain
1.291.661.531.612.162.342.232.312.242.282.172.232.152.132.122.142.152.162.142.132.082.07
2.652.53
2.452.512.542.572.582.582.542.602.572.582.562.592.582.592.572.562.572.562.59
Table 8. Summary of relation of bulk- and grain-density measurements of composite core from test hole USW UZ-6s to lithology and degree of welding
[Michael Chornack, U.S. Geological Survey, written commun., 1985; all data values in grams per cubic centimeter]
Geologic formation
Tiva Canyon Member (upper unit) of the Paintbrush Tuff
Tiva Canyon Member (lower vitrophyre) of the Paintbrush Tuff
Tiva Canyon Member (shardybase)ofthe Paintbrush Tuff
Unnamed bedded tuffs Topopah Spring Member
(vitric unit) of the Paintbrush Tuff
Topopah Spring Member (caprock) of the Paintbrush Tuff
Range off values
2.17 to 2.34
1.69 to 2.02
1.36 to 1.81
1.12 to 1.74 2.07 to 2.34
2.07 to 2.34
Average
2.26
1.90
1.55
1.45 1.64
2.18
Range off values
2.44 to 2.54
2.39 to 2.48
2.35 to 2.47
2.23 to 2.50 2.45 to 2.65
2.54 to 2.60
Average
2.49
2.42
2.39
2.42 2.53
2.57
Degree off welding
Dense
Moderate to dense
Partial to non- welded
Not applicable Partial
Dense to moder ate
SAMPLE TESTING PROCEDURES AND RESULTS 23

u0
1 Q. 3 o
««
en
20rt I 3
40
i o (D ^ §
w
60
a §
O)
1^
(0
| |
|
<
^8
z
soeo
^
S i
X§
Hff
Q_-=
S
100
z
Q"o ^ o 1 *
120
i CO
140
160
i i
i i
I i
i i
i I
i i
i i
I i
i i
i I
i i
i i
I i
i i
i I
i i
i i
I i
i i
i i
i i
i |T
B^9
HI^
^V^
'
' '
1 '
' '
' 1
' '
' '
1 '
' '
'X
X.
^r
Y Y
\
XX
.r Y
YX
JL
-
Y Y
T
^_
-. X
X.
m
YY
Y:
- -
o- -
BU
LK D
EN
SIT
Y
/ f
=
GR
AIN
DE
NS
ITY
^
1
" \
f:
On
/-
._
/-
q
iiI
\ I
\
T Y
Y Y
'
T Y
Y Y
'
X A
A A
r
Y Y
Y '
^AYAYAYAYA
Yf
X X
A X
A X
A A
A A
A X
0YX
YAYX
YAX
YY
YY
'v
A A
A A
_ \
'Y
YY
Y»
TIV
A C
AN
YO
N M
EM
BE
R(d
en
se
ly w
eld
ed)
- _ _
1
2
IO
-
~ \*
_§
~
I
DC
- 0
I
Li.
-1
1 ~
~
: 5
, ^-^
^
' \
E
~i~
/ r
- 'XYX
XYXJ
> D ~
(^
i '''i
'^'i'^"ii
/I
\
T
"1 ^T
, A
A A
lO
i. ^J-
AX
JI
\
' T
YY
Y1
x.
^^
-. A
A A
X
\ /
. .TA
x A
x<I
<p
[' Y
l'Y
Yl
JL
-L
O
t
\ /
~
_ Q
^
___-
"
" "
Y~
~
Q ^=
"
___ Q
^S
""^
1 ,30-
o -q
&£~
-5*
""
©-"
w
O
^t
= °^
^"^ ̂
^^ --^
JK
*C
?-=
--=
--=
^tL
.^o" ̂
W
=-«
7' Y
Y Y
1X
X X
X1
r Y
Y "l
" Y
*J-
x A
A A
A,
^^Y
^Y
Y^
f Y
Y Y
Y Y
'
T'T
YY
Y
"Y"
^T"
^T
"- ^ ̂
"^
L A
A"
TIV
A C
AN
YO
N M
EM
BE
R(m
odera
tely
to d
en
se
ly w
eld
ed
)
TIV
A C
AN
YO
N M
EM
BE
R(p
art
ially
we
lde
d t
o n
onw
eld
ed)
UN
NA
ME
D B
ED
DE
D T
UF
F
TO
PO
PA
H S
PR
ING
ME
MB
ER
~
Q^
^/^^
(part
ially
we
lde
d)
- tf&
S^
"^i
IK?
??
AX>
3^
^R
rYY
Y^
~ i
i
i i
1 i
i i
i 1
i i
i i
1 i
i i
i 1
i i
i i
1 i
i i
i 1
0^1
i i
1 i
i i
i 1%
i
i ^T
*^
fc;*u
L
TO
PO
PA
H S
PR
ING
ME
MB
ER
(dense
ly t
o m
od
era
tely
we
lde
d)
I
ICO
-
D
-CT
00
_I
1-
-2
I^
a.
- - - - - - - -
, ,
, 1
, ,
, ,
1 ,
, ,
, 1
ii,-
0.50
1.
00
1.50
2.
00
2.50
3.
00
3.50
4.
DE
NS
ITY
, IN
GR
AM
S P
ER
CU
BIC
CE
NT
IME
TE
R
Figu
re 6
. Bu
lk-
and
grai
n-de
nsity
mea
sure
men
ts o
f rot
ary
core
from
test
hol
e U
SW
UZ-
6s.

SUMMARY
Test hole UZ-6s located on the crest of Yucca Mountain was drilled to a depth of 158.2 m. Cutting and core samples were collected to determine gravi metric water-content, water-potential, bulk-density and grain-density measurements. Geologic formations penetrated are the Tiva Canyon Member, unnamed bedded tuff, and Topopah Spring Member of the Paintbrush Tuff.
SELECTED REFERENCES
American Society for Testing and Materials, 1980a, Stan dard test method for bulk specific-gravity of compacted bituminous mixtures using paraffin-coated specimens: Philadelphia, Pa., Annual Book of ASTM Standards, v. 19, ANSI-ASTM D 1188-71 (reapproved in 1976), p. 247-248. (NNA.900622.0435)
__1980b, Standard test method for specific gravity of soils: Philadelphia, Pa., Annual Book of ASTM Stan dards, v. 19, ANSI ASTM D 854-58 (reapproved in 1979), p. 211-213. (NNA.900622.0434)
Brown, R.W., 1970, Measurement of water potential with thermocouple psychrometers Construction and appli cations: U.S. Forest Service Research Paper INT-80, 27 p. (NNA.900208.0001)
Gardner, W.H., 1965, Water content, Black, C.A., ed., Meth ods of soil analyses Pt. 1, Physical and mineralogical properties, including statistics of measurement and sampling: Madison, Wis., American Society of Agron omy, Agronomy Monograph 9, p. 82-127. (NNA.900208.0007)
Guzowski, R.V., Nimick, F.B, Siegel, M.D, and Finley, N.C., 1983, Repository site data report for tuff, Yucca Moun tain, Nevada: Albuquerque, N.Mex., Sandia National Laboratories, Report NUREG/CR-2937; SAND- 82 2105, 327 p. (NNA.870519.0037)
Hammermeister, D.P., Blout, D.O. and McDaniel, J.C., 1985, Drilling and coring methods that minimize the disturbance of cuttings, core, and rock formation in the unsaturated zone, Yucca Mountain, Nevada, in National Water Well Association Conference on Characteriza tion and Monitoring of the Vadose (Unsaturated) Zone, Denver, 1985, Proceedings: Worthington, Ohio, National Water Well Association, p. 507-541. (HQS.880517.2696)
Kume, Jack and Hammermeister, Dale P., 1990, Geohydro- logic data from test hole USW UZ-7, Yucca Mountain area, Nye County, Nevada: U.S. Geological Survey Open-File Report 88-465, 37 p. (NNA.900312.0300)
__1991, Geohydrologic data from drill-bit cuttings and rotary cores from test hole USW UZ-13, Yucca Moun tain area, Nye County, Nevada: U.S. Geological Sur vey Open-File Report 90-362, 30 p. (NNA.901015.0196)
Loskot, C.L. and Hammermeister, D.P, 1986, Geohydro logic data from test holes UE-25 UZ #4 and UE-25 UZ #5, Nevada Test Site, Nye County, Nevada: U.S. Geological Survey Open-File Report 90-369, 57 p. (NNA.911219.0001)
Montazer, Parviz, and Wilson, WE., 1984, Conceptual hydrologic model of flow in the unsaturated zone, Yucca Mountain, Nevada: U.S. Geological Survey Water-Resources Investigations Report 84-4345, 55 p. (NNA.870519.0109)
Mower, T.E., Higgins, J.D., and Yang, I.C., 1990, Triaxial and uniaxial compression testing methods developed for extraction of pore water from unsaturated tuff, Yucca Mountain, Nevada, in FOCUS '89 Nuclear waste isolation in the unsaturated zone, Proceedings: LaGrange Park, 111, American Nuclear Society, p. 426-433. (NNA.901214.0002)
Richard, L.A., 1942, Soil moisture tensiometer materials and construction: Soil Science, v. 53, January-June, p. 241-248. (NNA.900208.0080)
Richards, L.A., and Ogata, G., 1958, Thermocouple for vapor pressure measurements in biological and soil sys tems at high humidity: Science, v. 128, no. 3331, p. 1089-1090. (HQS.880517.2837)
Whitfield, M.S., Cope C.M., and Loskot, C.L., 1992, Bore hole and geohydrologic data for test hole USW UZ-6, Yucca Mountain, Nye County, Nevada: U.S. Geologi cal Survey Open-File Report 92-28, 36 p. (NNA.920123.0088)
SUMMARY 25
U.S. GOVERNMENT PRINTING OFFICE: 1993 573-191 / 80012 REGION NO. 8