Geochemical evaluation of low salinity hot water injection ...heavy oil recovery from carbonate...
16
ORIGINAL PAPER Geochemical evaluation of low salinity hot water injection to enhance heavy oil recovery from carbonate reservoirs Ji Ho Lee 1 • Kun Sang Lee 1 Received: 3 February 2018 / Published online: 19 November 2018 Ó The Author(s) 2018 Abstract Although low salinity water injection (LSWI) has recovered residual oil after the conventional waterflood, highly viscous oil has remained in heavy oil reservoirs. Hot water injection is an economic and practical method to improve oil mobility for viscous oil reservoirs. It potentially controls temperature-dependent geochemical reactions underlying the LSWI mechanism and oil viscosity. Therefore, this study has modeled and evaluated a hybrid process of low salinity hot water injection (hot LSWI) to quantify synergistic effects in heavy oil reservoirs. In comparison to seawater injection (SWI) and LSWI, hot LSWI results in more cation ion-exchange (Ca 2? and Mg 2? ) and more wettability modification. Hot LSWI also reduces oil viscosity. In core-scaled systems, it increases oil recovery by 21% and 6% over SWI and LSWI. In a pilot- scaled reservoir, it produces additional oil by 6% and 3% over SWI and LSWI. Probabilistic forecasting with uncertainty assessment further evaluates the feasibility of hot LSWI to consider uncertainty in the pilot-scaled reservoir and observes enhanced heavy oil production. This study confirms the viability of hot LSWI due to synergistic effects including enhanced wettability modification and oil viscosity reduction effects. Keywords Low salinity water injection Hot water injection Wettability modification Geochemical reaction Viscosity reduction 1 Introduction Conventional waterflood has been widely deployed to maintain pressure of reservoirs and pressurize depleted reservoirs. While it typically recovers 35% of original oil in place (OOIP) from conventional reservoirs, heterogeneity, unfavorable mobility, and wettability limitations serve to retain the remaining oil in the reservoir (Lake et al. 2014). Enhanced oil recovery (EOR) methods have been developed to overcome unfavorable conditions. Low salinity water injection (LSWI), which is based on tuning the ionic com- position of brine, has emerged as a substitute for expensive EOR. Many experiments have observed that wettability modification is a primary contribution to the LSWI effect (Austad et al. 2005; Zhang et al. 2006, 2007; Lager et al. 2008; Yousef et al. 2011). The studies have observed car- boxylic acid in crude oil is the main factor for oil-wetness of chalk. They have found an influence of complex geochem- ical reactions on the carboxylic acid modifying wetness of chalk. The EOR research group at University of Stavanger (Austad et al. 2005; Zhang et al. 2006, 2007) has carried out chromatographic wettability tests, spontaneous imbibition tests, and coreflood experiments. They used various oil-wet chalk cores, evaluated with the chromatographic wettability test. A chromatographic wettability test tracked the non-ad- sorbing tracer and injected ions and determined a wettability index of the chalk cores. They injected various compositions of brines into the oil-wet chalk cores and evaluated oil recovery. Using the observations, they have proposed a mechanism that adsorption of SO 4 2- and co-adsorption of Ca 2? and Mg 2? are responsible for wettability modification of chalk cores. The study also concluded that the mechanism is sensitive to temperature and a high temperature (above 70 °C) is a favorable condition to observe the mechanism. Yousef et al. (2011) conducted various experiments of IFT (interfacial tension), NMR (nuclear magnetic resonance) measurement, and coreflood. The study observed an IFT Edited by Yan-Hua Sun & Kun Sang Lee [email protected] 1 Department of Earth Resources and Environmental Engineering, Hanyang University, Seoul 04763, South Korea 123 Petroleum Science (2019) 16:366–381 https://doi.org/10.1007/s12182-018-0274-6
Transcript of Geochemical evaluation of low salinity hot water injection ...heavy oil recovery from carbonate...

ORIGINAL PAPER
Geochemical evaluation of low salinity hot water injection to enhanceheavy oil recovery from carbonate reservoirs
Ji Ho Lee1 • Kun Sang Lee1
Received: 3 February 2018 / Published online: 19 November 2018� The Author(s) 2018
AbstractAlthough low salinity water injection (LSWI) has recovered residual oil after the conventional waterflood, highly viscous
oil has remained in heavy oil reservoirs. Hot water injection is an economic and practical method to improve oil mobility
for viscous oil reservoirs. It potentially controls temperature-dependent geochemical reactions underlying the LSWI
mechanism and oil viscosity. Therefore, this study has modeled and evaluated a hybrid process of low salinity hot water
injection (hot LSWI) to quantify synergistic effects in heavy oil reservoirs. In comparison to seawater injection (SWI) and
LSWI, hot LSWI results in more cation ion-exchange (Ca2? and Mg2?) and more wettability modification. Hot LSWI also
reduces oil viscosity. In core-scaled systems, it increases oil recovery by 21% and 6% over SWI and LSWI. In a pilot-
scaled reservoir, it produces additional oil by 6% and 3% over SWI and LSWI. Probabilistic forecasting with uncertainty
assessment further evaluates the feasibility of hot LSWI to consider uncertainty in the pilot-scaled reservoir and observes
enhanced heavy oil production. This study confirms the viability of hot LSWI due to synergistic effects including enhanced
wettability modification and oil viscosity reduction effects.
Keywords Low salinity water injection � Hot water injection � Wettability modification � Geochemical reaction �Viscosity reduction
1 Introduction
Conventional waterflood has been widely deployed to
maintain pressure of reservoirs and pressurize depleted
reservoirs. While it typically recovers 35% of original oil in
place (OOIP) from conventional reservoirs, heterogeneity,
unfavorable mobility, and wettability limitations serve to
retain the remaining oil in the reservoir (Lake et al. 2014).
Enhanced oil recovery (EOR) methods have been developed
to overcome unfavorable conditions. Low salinity water
injection (LSWI), which is based on tuning the ionic com-
position of brine, has emerged as a substitute for expensive
EOR. Many experiments have observed that wettability
modification is a primary contribution to the LSWI effect
(Austad et al. 2005; Zhang et al. 2006, 2007; Lager et al.
2008; Yousef et al. 2011). The studies have observed car-
boxylic acid in crude oil is the main factor for oil-wetness of
chalk. They have found an influence of complex geochem-
ical reactions on the carboxylic acid modifying wetness of
chalk. The EOR research group at University of Stavanger
(Austad et al. 2005; Zhang et al. 2006, 2007) has carried out
chromatographic wettability tests, spontaneous imbibition
tests, and coreflood experiments. They used various oil-wet
chalk cores, evaluated with the chromatographic wettability
test. A chromatographic wettability test tracked the non-ad-
sorbing tracer and injected ions and determined a wettability
index of the chalk cores. They injected various compositions
of brines into the oil-wet chalk cores and evaluated oil
recovery. Using the observations, they have proposed a
mechanism that adsorption of SO42- and co-adsorption of
Ca2? and Mg2? are responsible for wettability modification
of chalk cores. The study also concluded that the mechanism
is sensitive to temperature and a high temperature (above
70 �C) is a favorable condition to observe the mechanism.
Yousef et al. (2011) conducted various experiments of IFT
(interfacial tension), NMR (nuclear magnetic resonance)
measurement, and coreflood. The study observed an IFT
Edited by Yan-Hua Sun
& Kun Sang Lee
1 Department of Earth Resources and Environmental
Engineering, Hanyang University, Seoul 04763, South Korea
123
Petroleum Science (2019) 16:366–381https://doi.org/10.1007/s12182-018-0274-6(0123456789().,-volV)(0123456789().,-volV)

reduction when low salinity water is injected. From the
NMR measurement, change of pore distribution was
observed and attributed to mineral dissolution. Based on the
experiments, the study concluded there is a wettability
modification effect to enhance oil recovery and proposed that
an alteration of surfaces of carbonate rock alters reservoir
wettability. Further work of Ayirala et al. (2018) constructed
a coreflooding system with zeta potential measurement and
measured zeta potential when different diluted brines were
injected into cores. They also simulated the experiments at
different temperatures (25, 60 �C) to reveal the relationship
between temperature and zeta potential. Hiorth et al. (2010)
proposed another mechanism with rock dissolution, rather
than rock surface charge, is responsible for the wettability
modification effect. Yutkin et al. (2018) examined the pro-
posed mechanisms of LSWI by calculating surface charge
potential using experimental results. Their findings of rapid
dissolution of carbonate rock, pH buffering by rock disso-
lution, diffuse double layer collapse, and instantaneous
equilibrium between aqueous species and mineral dissolution
are at variance with the proposed mechanisms except for
MIE (multicomponent ionic exchange) theory (Lager et al.
2008) and ligand-ion-exchange oil release. While the exact
mechanism is still unclear, it is obvious that LSWI con-
tributes to wettability modification and geochemical reac-
tions are responsible for the LSWI effect.
A few studies have constructed a numerical LSWI model
by implementing its mechanism (Qiao et al. 2015; Awolayo
et al. 2017). Qiao et al. (2015) proposed a mechanism
modeling approach using the surface complexation model
and the electrical diffuse layer calculation in carbonate core
systems. The surface complexation model describes surface
reactions that adhere aqueous ions and carboxylic groups to
the surface of calcite in aqueous, oleic, and solid phases. An
additional extensive experimental database of carbonate
reservoirs is required for the approach. The experimental
difficulties associated with the acquisition and interpretation
of electro-kinetic measurements and surface titration data as
well as complex surface chemistry of carbonate minerals are
barriers to the approach (Wolthers et al. 2008). In addition,
this approach is not practical in pilot-scaled modeling
because of the various unclear parameters. Another numer-
ical study by Awolayo et al. (2017) developed a LSWI
model coupled with aqueous reactions, mineral reactions,
ion-exchange reactions of Ca2? and Mg2?, and adsorption
reaction of SO42-. It modeled the underlying mechanism of
LSWI using the concept of MIE (multicomponent ionic
exchange) theory (Lager et al. 2008). Therefore, this study
adapted the approach of Awolayo et al. (2017) to formulate
LSWI mechanism.
Gachuz-Muro and Sohrabi (2013, 2014) investigated
this promising LSWI for heavy oil recovery. Normally,
crude oil is classified as light (higher than 31.1� API),
medium (from 31.1� API to 22.3� API), heavy (less than
22.3� API), and extra heavy (less than 10� API). The
experiments used heavy oil (14.12� API, 53,484 cP at
20 �C). The heavy crude oil production has several tech-
nical issues of wettability, highly viscous oil, asphaltene
precipitation, etc. (Gachuz-Muro and Sohrabi 2014; Guo
et al. 2016). Gachuz-Muro and Sohrabi (2013, 2014)
described the properties of oil and brines used in the
coreflooding experiments. Ionic composition of SW is
equivalent to the brine composition from the Gulf of
Mexico. Compositions of formation water (FW), seawater
(SW), and low salinity water (LSW) are indicated in
Table 1. The heavy crude oil viscosity decreases as tem-
perature increases from 20 to 115 �C, as shown in Fig. 1.
Table 1 Properties and compositions of brines
Brine Composition, mg/L pH Ionic strength, molality
Na? Ca2? Mg2? K? Ba2? Sr2? Cl- SO42- HCO3
-
FW 9614.97 320.36 218.94 – – – 15,117.25 550.63 1135.90 8.01 0.46
SW 11,429.38 429.60 1361.60 351.10 0.01 8.37 20,040.00 3500.00 47.58 7.80 0.66
LSW 1142.93 42.96 136.16 35.11 – 0.83 2004.00 350.00 4.75 7.20 0.07
20 40 60 80 100 12010
100
1,000
10,000
100,000
Oil
visc
osity
, cP
Temperature, ºC
Calculated
Measured
Fig. 1 Temperature-dependent oil viscosity
Petroleum Science (2019) 16:366–381 367
123
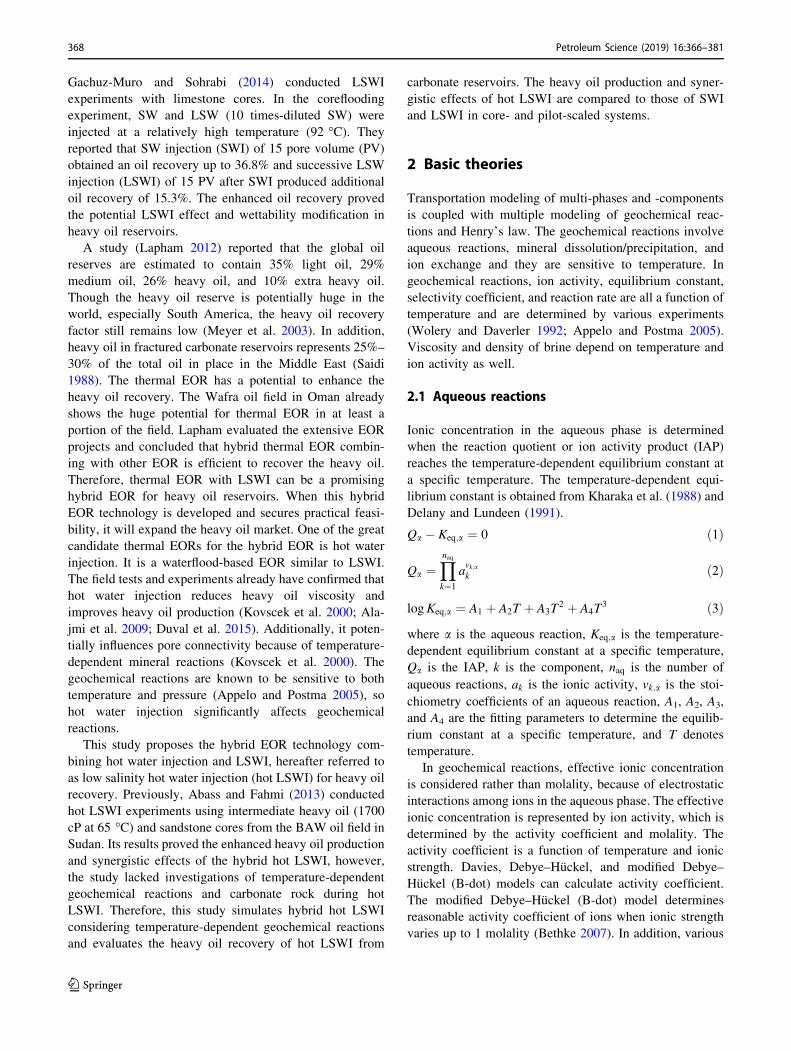
Gachuz-Muro and Sohrabi (2014) conducted LSWI
experiments with limestone cores. In the coreflooding
experiment, SW and LSW (10 times-diluted SW) were
injected at a relatively high temperature (92 �C). They
reported that SW injection (SWI) of 15 pore volume (PV)
obtained an oil recovery up to 36.8% and successive LSW
injection (LSWI) of 15 PV after SWI produced additional
oil recovery of 15.3%. The enhanced oil recovery proved
the potential LSWI effect and wettability modification in
heavy oil reservoirs.
A study (Lapham 2012) reported that the global oil
reserves are estimated to contain 35% light oil, 29%
medium oil, 26% heavy oil, and 10% extra heavy oil.
Though the heavy oil reserve is potentially huge in the
world, especially South America, the heavy oil recovery
factor still remains low (Meyer et al. 2003). In addition,
heavy oil in fractured carbonate reservoirs represents 25%–
30% of the total oil in place in the Middle East (Saidi
1988). The thermal EOR has a potential to enhance the
heavy oil recovery. The Wafra oil field in Oman already
shows the huge potential for thermal EOR in at least a
portion of the field. Lapham evaluated the extensive EOR
projects and concluded that hybrid thermal EOR combin-
ing with other EOR is efficient to recover the heavy oil.
Therefore, thermal EOR with LSWI can be a promising
hybrid EOR for heavy oil reservoirs. When this hybrid
EOR technology is developed and secures practical feasi-
bility, it will expand the heavy oil market. One of the great
candidate thermal EORs for the hybrid EOR is hot water
injection. It is a waterflood-based EOR similar to LSWI.
The field tests and experiments already have confirmed that
hot water injection reduces heavy oil viscosity and
improves heavy oil production (Kovscek et al. 2000; Ala-
jmi et al. 2009; Duval et al. 2015). Additionally, it poten-
tially influences pore connectivity because of temperature-
dependent mineral reactions (Kovscek et al. 2000). The
geochemical reactions are known to be sensitive to both
temperature and pressure (Appelo and Postma 2005), so
hot water injection significantly affects geochemical
reactions.
This study proposes the hybrid EOR technology com-
bining hot water injection and LSWI, hereafter referred to
as low salinity hot water injection (hot LSWI) for heavy oil
recovery. Previously, Abass and Fahmi (2013) conducted
hot LSWI experiments using intermediate heavy oil (1700
cP at 65 �C) and sandstone cores from the BAW oil field in
Sudan. Its results proved the enhanced heavy oil production
and synergistic effects of the hybrid hot LSWI, however,
the study lacked investigations of temperature-dependent
geochemical reactions and carbonate rock during hot
LSWI. Therefore, this study simulates hybrid hot LSWI
considering temperature-dependent geochemical reactions
and evaluates the heavy oil recovery of hot LSWI from
carbonate reservoirs. The heavy oil production and syner-
gistic effects of hot LSWI are compared to those of SWI
and LSWI in core- and pilot-scaled systems.
2 Basic theories
Transportation modeling of multi-phases and -components
is coupled with multiple modeling of geochemical reac-
tions and Henry’s law. The geochemical reactions involve
aqueous reactions, mineral dissolution/precipitation, and
ion exchange and they are sensitive to temperature. In
geochemical reactions, ion activity, equilibrium constant,
selectivity coefficient, and reaction rate are all a function of
temperature and are determined by various experiments
(Wolery and Daverler 1992; Appelo and Postma 2005).
Viscosity and density of brine depend on temperature and
ion activity as well.
2.1 Aqueous reactions
Ionic concentration in the aqueous phase is determined
when the reaction quotient or ion activity product (IAP)
reaches the temperature-dependent equilibrium constant at
a specific temperature. The temperature-dependent equi-
librium constant is obtained from Kharaka et al. (1988) and
Delany and Lundeen (1991).
Qa � Keq;a ¼ 0 ð1Þ
Qa ¼Ynaq
k¼1
avk;ak ð2Þ
logKeq;a ¼ A1 þ A2T þ A3T2 þ A4T
3 ð3Þ
where a is the aqueous reaction, Keq;a is the temperature-
dependent equilibrium constant at a specific temperature,
Qa is the IAP, k is the component, naq is the number of
aqueous reactions, ak is the ionic activity, vk;a is the stoi-
chiometry coefficients of an aqueous reaction, A1, A2, A3,
and A4 are the fitting parameters to determine the equilib-
rium constant at a specific temperature, and T denotes
temperature.
In geochemical reactions, effective ionic concentration
is considered rather than molality, because of electrostatic
interactions among ions in the aqueous phase. The effective
ionic concentration is represented by ion activity, which is
determined by the activity coefficient and molality. The
activity coefficient is a function of temperature and ionic
strength. Davies, Debye–Huckel, and modified Debye–
Huckel (B-dot) models can calculate activity coefficient.
The modified Debye–Huckel (B-dot) model determines
reasonable activity coefficient of ions when ionic strength
varies up to 1 molality (Bethke 2007). In addition, various
368 Petroleum Science (2019) 16:366–381
123

geochemical software EQ3/EQ6, CHILLER, SOLMINEQ,
and SPECE8 and REACT use the model. Therefore, this
study uses the modified Debye–Huckel model to calculate
temperature-dependent activity coefficient of ions. In this
study, Bethke (2007) is used to calculate them.
ak ¼ ckmk ð4Þ
log ck ¼ � Acz2k
ffiffiI
p
1þ _akBc
ffiffiI
p þ _BI ð5Þ
I ¼ 1
2
Xnaq
k¼1
mkz2k ð6Þ
where ck defines the activity coefficient, mk is the molality,
Ac and Bc are temperature-dependent coefficients, and _B is
the temperature-dependent coefficients (m-1), I is the ionic
strength, _ak is the ion-size parameter (m), and zk is the
charge number of ions.
2.2 Mineral dissolution/precipitation
In this study, calcite (CaCO3) and dolomite (CaMg(CO3)2)
are assumed to be the main minerals. The dissolution or
precipitation of minerals is characterized by heterogeneous,
non-equilibrium, and slow reactions. The mineral dissolu-
tion or precipitation is a kinetic reaction and the rate of the
mineral reaction is affected by mineral type, ionic com-
position, temperature, and, pH (Bethke 2007; Morse and
Arvidson 2002; Soulaine et al. 2017). This study simulates
the rate-dependent kinetic reaction following the rate law
(Bethke 2007) and the rate law does not take account of the
effect of pH directly. Kharaka et al. (1988) and Delany and
Lundeen (1991) simulated the mineral reactions of calcite
and dolomite.
CaCO3 þ Hþ $ Ca2þ þ HCO�3 ð7Þ
CaMg(CO3Þ2 þ 2Hþ $ Ca2þ þ 2HCO�3 þMg2þ ð8Þ
rb ¼ Abkb 1� Qb
Keq;b
� �ð9Þ
Qb ¼Ynaq
k¼1
avk;bk ð10Þ
where b indicates mineral type, calcite or dolomite, rb is
the reaction rate (mol m-3 s-1), kb is the reaction rate
constant, Ab is the reactive surface area of a mineral (m-1),
Keq;b is the solubility product constant at a specific tem-
perature, Qb is the IAP, and vk;b is the stoichiometric
coefficients of a mineral reaction.
Dissolution/precipitation of minerals provides/consumes
aqueous ionic species in brine. The rate of
Table 2 Properties of limestone core in the experiment (Gachuz-Muro and Sohrabi 2014) and simulation
Pore volume, m3 Porosity Permeability, mD Water saturation Temperature, �C
15.55 0.2064 19.4 0.32 92
Table 3 Geochemical reactionsPhase Reaction
Aqueous reactions H? ? OH- $ H2O
CO2 (aq) ? H2O $ H? ? HCO3-
CaHCO3? $ Ca2? ? HCO3
-
MgHCO3? $ HCO3
- ? Mg2?
NaHCO3 $ HCO3- ? Na?
CaCO3(H?) $ Ca2? ? HCO3
-
(H?)(MgCO3) $ HCO3- ? Mg2?
(H?)(NaCO3-) $ HCO3
- ? Na?
(H?)(MgOH?) $ H2O ? Mg2?
(H?)(NaOH) $ H2O ? Na?
CaSO4 $ Ca2? ? SO42-
Na2SO4 $ 2(Na?) ? SO42-
MgSO4 $ Mg2? ? SO42-
Mineral dissolution/precipitation CaCO3 ? H? $ Ca2? ? HCO3-
CaMg(CO3)2 ? 2H? $ Ca2? ? 2HCO3- ? Mg2?
Ion-exchange Na? ? 0.5Ca-X2 $ Na-X ? 0.5Ca2?
Na? ? 0.5 Mg-X2 $ Na-X ? 0.5 Mg2?
H? ? Na-X $ H–X ? Na?
Petroleum Science (2019) 16:366–381 369
123

generation/consumption is closely related to the rate of
mineral change. Reaction rate and stoichiometric coeffi-
cients of mineral dissolution/precipitation determine the
rate of mineral generation/consumption in brine.
ck;b ¼ vk;brb ð11Þ
where ck;b indicates the reaction rate (consumption/pro-
duction) of ionic aqueous components (mol m-3 s-1).
Temperature influences the solubility product constant,
activity, and kinetic reaction rate in mineral reactions. The
solubility product constant is determined by the empirical
polynomial formulation.
logKeq;b ¼ B0 þ B1T1 þ B2T2 þ B3T
3 þ B4T4 ð12Þ
where B0, B1, B2, B3, and B4 represent fitting parameters.
The temperature-dependent activity coefficient has been
explained in Eqs. (4)–(6). Lastly, the kinetic reaction rate
is adjusted at an elevated temperature in terms of the
Arrhenius equation.
kb ¼ kob exp �Eab
R
1
T� 1
To
� �� �ð13Þ
where kob indicates reaction rate constant at the reference
temperature (mol m-2 s-1), Eab is the activation energy
2016-01-02
General solutions
Field history
Optimal solution
Base case
2016-01-010.0e+0
4.0e-6
6.0e-6
8.0e-6
Cum
ulat
ive
oil p
rodu
ctio
n, m
3
Time
1.0e-5
2.0e-6
2016-01-03 2016-01-04
Fig. 2 History matching result for successive SWI-LSWI in terms of oil production (m3)
0 10 20
Experiment
Simulation
Pore volume injected
Effl
uent
pH
300
3
6
9
Fig. 3 Comparison of effluent pH between experiment and simulation
1.5647e-5
1.5644e-5
1.5641e-5
1.5638e-5-1.0e-4
-8.0e-5
-6.0e-5
-4.0e-5
-2.0e-5
0.0e-0
Pore volumeMineral
3020100
Pore volume injected
Min
eral
dis
solu
tion/
prec
ipita
tion,
mol
e
Por
e vo
lum
e, m
3
Fig. 4 History of mineral dissolution/precipitation (mole) and pore
volume (m3) for successive SWI-LSWI
370 Petroleum Science (2019) 16:366–381
123

(8.314 J/(mol K)), R is the universal gas constant, and To is
the reference temperature (K).
2.3 Ion-exchange
Following the approach of Awolayo et al. (2017), this
study models wettability modification due to ion-exchange
reactions. The ion-exchangeable cations (H?, Na?, Ca2?,
and Mg2?) interact with the rock surface. This ion-ex-
change is a reversible reaction. The state of adsorbed
cations and ion-exchanged cation is determined when the
IAP becomes the selectivity coefficient. The activities of
the exchangeable species follow the Gaines-Thomas con-
vention. The number of ion-exchanged ions is generally
expressed with an equivalent fraction. The amount of
positive charge that adheres to a mineral surface is defined
with cation exchange capacity (CEC).
Hþ þ Na� X $ H� Xð Þ þ Naþ ð14Þ
Naþ þ 1
2Ca� X2ð Þ $ Na� Xð Þ þ 1
2Ca2þ ð15Þ
Naþ þ 1
2Mg� X2ð Þ $ Na� Xð Þ þ 1
2Mg2þ ð16Þ
KH=Na ¼a Naþð Þ½ �a H� Xð Þa Hþð Þ a Na� Xð Þ½ � ð17Þ
KNa=Ca ¼a Ca2þ� � 0:5
a Na� Xð Þa Naþð Þ a Ca� X2ð Þ½ �0:5
ð18Þ
KNa=Mg ¼a Mg2þ� � 0:5
a Na� Xð Þa Naþð Þ a Mg� X2ð Þ½ �0:5
ð19Þ
bH�X ¼ NH�X
NNa�X þ 2NCa�X2þ 2NMg�X2
þ NH�X
ð20Þ
bNa�X ¼ NNa�X
NNa�X þ 2NCa�X2þ 2NMg�X2
þ NH�X
ð21Þ
bCa�X2¼ NCa�X2
NNa�X þ 2NCa�X2þ 2NMg�X2
þ NH�X
ð22Þ
bMg�X2¼ NMg�X2
NNa�X þ 2NCa�X2þ 2NMg�X2
þ NH�X
ð23Þ
CEC ¼ NNa�X þ 2NCa�X2þ 2NMg�X2
uð24Þ
where X indicates the surface of carbonate rock, KH=Na,
KNa=Ca, and KNa=Mg are the selectivity coefficients, bH�X,
bNa�X, bCa�X2and bMg�X2
are the equivalent fractions,
0 0.2
Water saturation
Rel
ativ
e pe
rmea
bilit
y
Rel
ativ
e pe
rmea
bilit
y
Water saturation
0.4 0.6 0.8 1.00
0.2
0.4
0.6
0.8
1.0(a)
0 0.2 0.4 0.6 0.8 1.00
0.2
0.4
0.6
0.8
1.0krw
kro
(b)krw
kro
Fig. 5 Relative permeability curves before (a) and after (b) wettability modification
00
40
80
5
SWILSWIHot LSWI
10
Pore volume injected
Oil
reco
very
, %
Fig. 6 History of oil recovery (%) for SWI, LSWI, and hot LSWI
Petroleum Science (2019) 16:366–381 371
123
NH�X, NNa�X, NCa�X2, and NMg�X2
are the number of moles
of ion-exchanged H?, Na?, Ca2?, and Mg2?, CEC is the
cation exchange capacity (meq/kg rock).
In the thermodynamic system, the van’t Hoff equation
introduces a temperature effect on the selectivity coeffi-
cient of ion-exchange reactions (SenGupta 2017). The
temperature-dependent selectivity coefficient is calculated
with a standard enthalpy change and reference selectivity
coefficient. The data of standard enthalpy change and
reference selectivity coefficient is provided from the
PHREEQC (pH Redox Equilibrium) software database
(Appelo and Postma 2005).
logKNa=Ca;T1 ¼ logKNa=Ca;T2 �DHo
r
2:303R
1
T1� 1
T2
� �ð25Þ
logKNa=Mg;T1 ¼ logKNa=Mg;T2 �DHo
r
2:303R
1
T1� 1
T2
� �ð26Þ
where KNa=Ca;T and KNa=Mg;T indicate the selectivity coef-
ficients at a specific temperature, and DHor is the reaction
enthalpy of the system (kJ mol-1).
3 Numerical simulation
Numerical modeling of hot LSWI is developed using a
series of LSWI experiments (Gachuz-Muro and Sohrabi
2013, 2014) targeting heavy oil reservoirs. Using these
experiments, LSWI coreflooding coupled with geochemi-
cal modeling is simulated with GEM developed from
CMG. The software is a fully-coupled geochemical and
compositional simulator (Nghiem et al. 2004). It is a
multiphase and multicomponent flow simulator with phase
and chemical equilibrium and rate-dependent mineral dis-
solution/precipitation. Using the adaptive implicit method,
a few grid blocks are solved fully implicitly and the other
blocks are solved explicitly according to the blocks’
implicitness. In terms of the stability criterion, Courant-
Friedrichs-Lewy (CFL) is used to determine the degree of
implicitness and the criterion can be used for switching
both from explicit to implicit and from implicit to explicit
discretizations of a block. In addition, this simulator offers
Newton’s method to solve the nonlinear systems of reser-
voir simulation. This study selects the recommended con-
vergence criteria for Newton’s method and the tolerances
of the criteria follow: pressure change with 3.55 kPa;
temperature change with 0.001 �C; relative change of
hydrocarbon component molar density with 0.01; and rel-
ative change of water component molar density with 0.01.
In terms of the phase and geochemical equilibrium calcu-
lations, the tolerance of the criterion is the sum of square
residual with 1 9 10-10.
The 1-D numerical core model representing a carbonate
core is composed of 20 grid blocks. The properties of the
core model are summarized in Table 2. The brine com-
positions of FW, SW, and LSW (10 times-diluted SW) to
be modelled are indicated in Table 1. The ionic strengths
of the brines are calculated using PHREEQC software and
also described in Table 1. The temperature-dependent oil
viscosity (Gachuz-Muro and Sohrabi 2013) is modeled
with modified Pedersen’s equation (Pedersen and Fre-
denslund 1987) and depicted in Fig. 1. When temperatures
Ca2+: LSWI
(a)
(b)
(c)
Ca2+: hot LSWI
7.0
3.5
00 5 10
Pore volume injected
Mg2+: LSWIMg2+: hot LSWI
1.5
1.0
0.5
00 5 10
Pore volume injected
Rel
ativ
e co
ncen
tratio
nR
elat
ive
conc
entra
tion
Rel
ativ
e co
ncen
tratio
n
Cl‒: LSWICl‒: hot LSWI
8
4
00 5 10
Pore volume injected
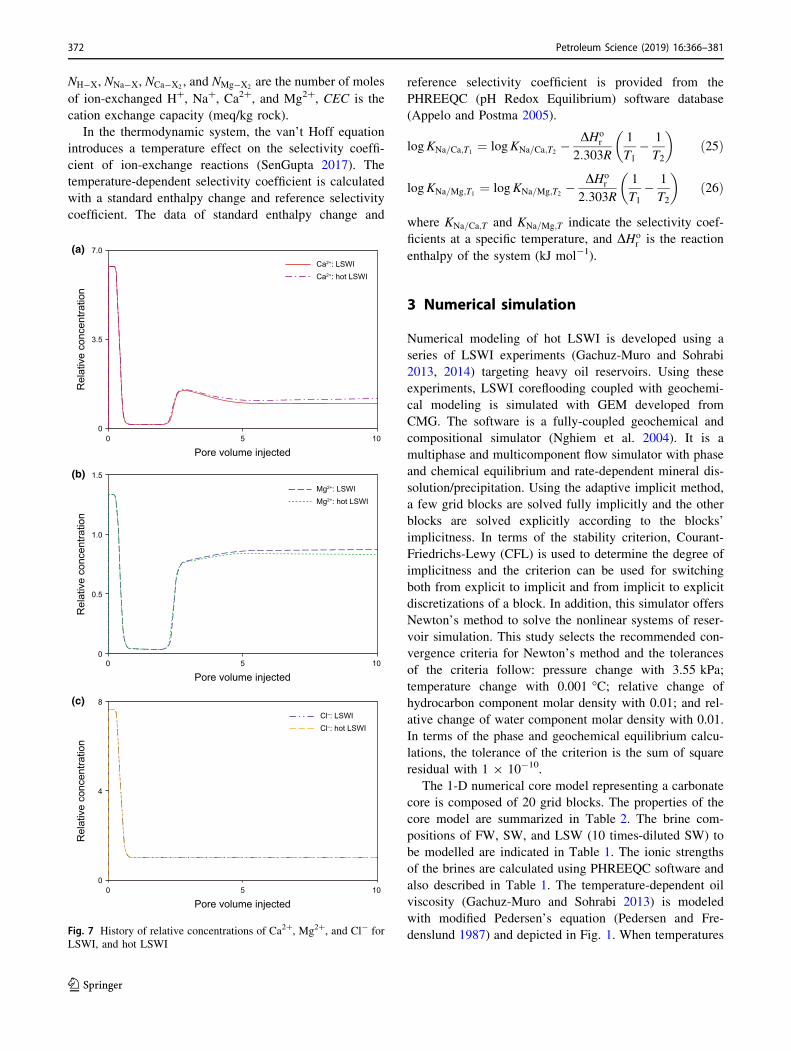
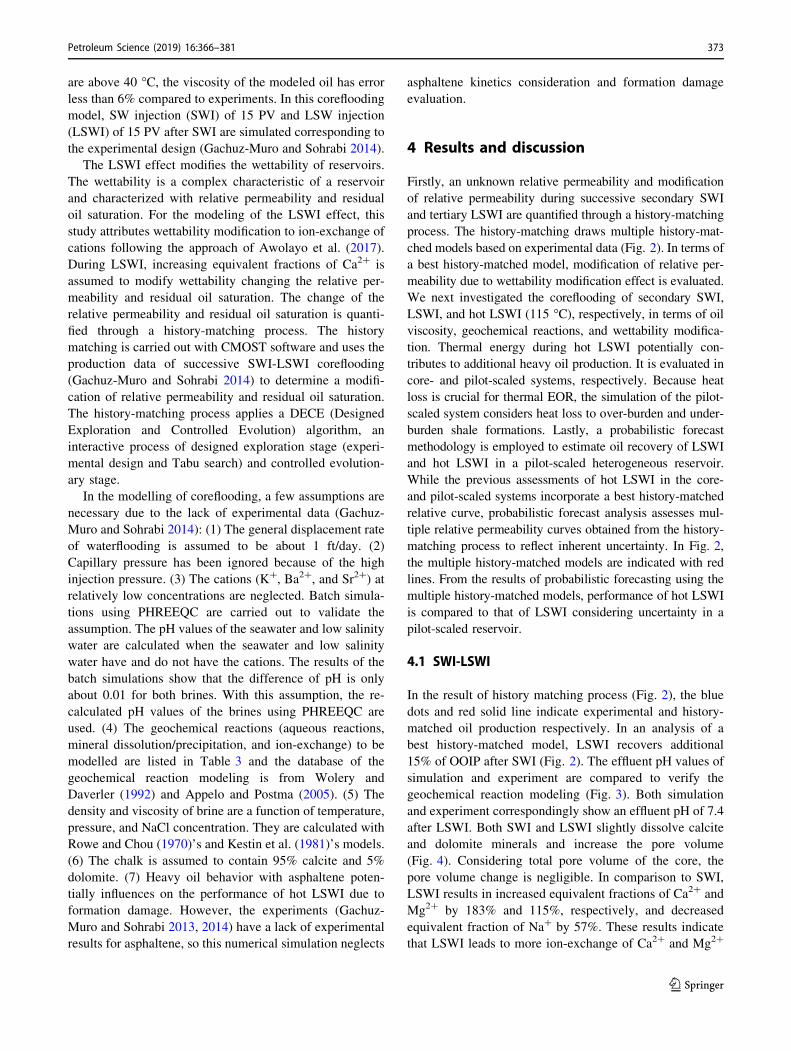
Fig. 7 History of relative concentrations of Ca2?, Mg2?, and Cl- for
LSWI, and hot LSWI
372 Petroleum Science (2019) 16:366–381
123
are above 40 �C, the viscosity of the modeled oil has error
less than 6% compared to experiments. In this coreflooding
model, SW injection (SWI) of 15 PV and LSW injection
(LSWI) of 15 PV after SWI are simulated corresponding to
the experimental design (Gachuz-Muro and Sohrabi 2014).
The LSWI effect modifies the wettability of reservoirs.
The wettability is a complex characteristic of a reservoir
and characterized with relative permeability and residual
oil saturation. For the modeling of the LSWI effect, this
study attributes wettability modification to ion-exchange of
cations following the approach of Awolayo et al. (2017).
During LSWI, increasing equivalent fractions of Ca2? is
assumed to modify wettability changing the relative per-
meability and residual oil saturation. The change of the
relative permeability and residual oil saturation is quanti-
fied through a history-matching process. The history
matching is carried out with CMOST software and uses the
production data of successive SWI-LSWI coreflooding
(Gachuz-Muro and Sohrabi 2014) to determine a modifi-
cation of relative permeability and residual oil saturation.
The history-matching process applies a DECE (Designed
Exploration and Controlled Evolution) algorithm, an
interactive process of designed exploration stage (experi-
mental design and Tabu search) and controlled evolution-
ary stage.
In the modelling of coreflooding, a few assumptions are
necessary due to the lack of experimental data (Gachuz-
Muro and Sohrabi 2014): (1) The general displacement rate
of waterflooding is assumed to be about 1 ft/day. (2)
Capillary pressure has been ignored because of the high
injection pressure. (3) The cations (K?, Ba2?, and Sr2?) at
relatively low concentrations are neglected. Batch simula-
tions using PHREEQC are carried out to validate the
assumption. The pH values of the seawater and low salinity
water are calculated when the seawater and low salinity
water have and do not have the cations. The results of the
batch simulations show that the difference of pH is only
about 0.01 for both brines. With this assumption, the re-
calculated pH values of the brines using PHREEQC are
used. (4) The geochemical reactions (aqueous reactions,
mineral dissolution/precipitation, and ion-exchange) to be
modelled are listed in Table 3 and the database of the
geochemical reaction modeling is from Wolery and
Daverler (1992) and Appelo and Postma (2005). (5) The
density and viscosity of brine are a function of temperature,
pressure, and NaCl concentration. They are calculated with
Rowe and Chou (1970)’s and Kestin et al. (1981)’s models.
(6) The chalk is assumed to contain 95% calcite and 5%
dolomite. (7) Heavy oil behavior with asphaltene poten-
tially influences on the performance of hot LSWI due to
formation damage. However, the experiments (Gachuz-
Muro and Sohrabi 2013, 2014) have a lack of experimental
results for asphaltene, so this numerical simulation neglects
asphaltene kinetics consideration and formation damage
evaluation.
4 Results and discussion
Firstly, an unknown relative permeability and modification
of relative permeability during successive secondary SWI
and tertiary LSWI are quantified through a history-matching
process. The history-matching draws multiple history-mat-
ched models based on experimental data (Fig. 2). In terms of
a best history-matched model, modification of relative per-
meability due to wettability modification effect is evaluated.
We next investigated the coreflooding of secondary SWI,
LSWI, and hot LSWI (115 �C), respectively, in terms of oil
viscosity, geochemical reactions, and wettability modifica-
tion. Thermal energy during hot LSWI potentially con-
tributes to additional heavy oil production. It is evaluated in
core- and pilot-scaled systems, respectively. Because heat
loss is crucial for thermal EOR, the simulation of the pilot-
scaled system considers heat loss to over-burden and under-
burden shale formations. Lastly, a probabilistic forecast
methodology is employed to estimate oil recovery of LSWI
and hot LSWI in a pilot-scaled heterogeneous reservoir.
While the previous assessments of hot LSWI in the core-
and pilot-scaled systems incorporate a best history-matched
relative curve, probabilistic forecast analysis assesses mul-
tiple relative permeability curves obtained from the history-
matching process to reflect inherent uncertainty. In Fig. 2,
the multiple history-matched models are indicated with red
lines. From the results of probabilistic forecasting using the
multiple history-matched models, performance of hot LSWI
is compared to that of LSWI considering uncertainty in a
pilot-scaled reservoir.
4.1 SWI-LSWI
In the result of history matching process (Fig. 2), the blue
dots and red solid line indicate experimental and history-
matched oil production respectively. In an analysis of a
best history-matched model, LSWI recovers additional
15% of OOIP after SWI (Fig. 2). The effluent pH values of
simulation and experiment are compared to verify the
geochemical reaction modeling (Fig. 3). Both simulation
and experiment correspondingly show an effluent pH of 7.4
after LSWI. Both SWI and LSWI slightly dissolve calcite
and dolomite minerals and increase the pore volume
(Fig. 4). Considering total pore volume of the core, the
pore volume change is negligible. In comparison to SWI,
LSWI results in increased equivalent fractions of Ca2? and
Mg2? by 183% and 115%, respectively, and decreased
equivalent fraction of Na? by 57%. These results indicate
that LSWI leads to more ion-exchange of Ca2? and Mg2?
Petroleum Science (2019) 16:366–381 373
123

rather than that of Na?. As described in Fig. 5, LSWI
increasing ion-exchange of Ca2? and Mg2 improves
wettability modifying relative permeability. LSWI reduces
residual oil saturation by 0.12 units. It also increases the
end point relative permeability of oil by 58% and decreases
the end point relative permeability of water by 41%,
respectively.
0-7.0e-5
-3.0e-5
1.0e-5
5
SWILSWIHot LSWI
10
Pore volume injected
Min
eral
dis
solu
tion/
prec
ipita
tion,
mol
e
01.5636e-5
1.5640e-5
1.5644e-5
5
SWILSWIHot LSWI
10
Pore volume injected
Por
e vo
lum
e, m
3
(a) (b)
Fig. 8 History of mineral dissolution/precipitation (mole) and pore volume (m3) for SWI, LSWI, and hot LSWI
0
1.0e-3
1.0e-4
1.0e-5
1.0e-6
1.0e-75
LSWI: Ca-X
Hot LSWI: Ca-X
LSWI: Mg-X
10
Pore volume injected
Am
ount
of c
hem
ical
com
poun
d, m
ole
Hot LSWI: Mg-X
Fig. 9 History of the amount (mole) of chemical compounds of Ca-X
(CaHCO3?, CaCO3, CaSO4) and Mg-X (MgHCO3
?, MgCO3,
MgOH?, MgSO4) during LSWI and hot LSWI
0
6.0e-5
3.0e-5
0.0e+05
LSWI: Ca2+
Hot LSWI: Ca2+
LSWI: Mg2+
10
Pore volume injected
Am
ount
of d
ival
ent c
atio
n, m
ole
Hot LSWI: Mg2+
Fig. 10 History of the amount (mole) of Ca2? and Mg2? during
LSWI and hot LSWI
Table 4 Reservoir properties
Properties Value
Pore volume, m3 1.682 9 104
Original oil in place, m3 1.142 9 104
Average permeability, mD 200
Vertical to horizontal permeability ratio 0.1
Temperature, �C 92
Heat capacity, J/(kg K)
Carbonate reservoir 969
Shale 1214
Thermal conductivity, J/(m s K)
Carbonate reservoir 2.40
Shale 0.88
0
1.0e-3
1.0e-4
1.0e-5
1.0e-6
1.0e-7
1.0e-85
1.0
0.5
0
LSWI: CO2 (aq)Hot LSWI: CO2 (aq)LSWI: gas
10Pore volume injected
Am
ount
of C
O2 (
aq),
mol
e
Gas
sat
urat
ion
Hot LSWI: gas
Fig. 11 History of the amount of CO2 (aq) (mole) and gas saturation
during LSWI and hot LSWI
374 Petroleum Science (2019) 16:366–381
123

4.2 Core-scaled system: hot LSWI
Using the history-matched coreflooding model, secondary
modes of SWI, LSWI, and hot LSWI are simulated for 10
PV and the results are compared. Figure 6 describes heavy
oil productions for SWI, LSWI, and hot SWI, respectively.
Secondary SWI recovers only 35% of OOIP after 10 PV
injection. LSWI and hot LSWI produce additional heavy
oil with 15% and 21% over SWI.
In comparison with SWI, LSWI increases the equivalent
fractions of Ca2? and Mg2? by 182% and 116%, respec-
tively. The change of effluent concentration of Ca2? also
confirms increasing the cation-exchange of Ca2?. Figure 7
depicts the concentration of ions (Ca2?, Mg2?, and Cl-) in
effluent divided by their concentration in the injection
fluid, i.e. the relative concentration of the ions. The Cl-
hardly participates in geochemical reactions, so the Cl- is
assumed to be a tracer. After breakthrough with 1 PV
injection, delay of Ca2?, not Cl-, is observed and it is the
result of cation-exchange of Ca2?. In addition, the relative
concentration of Ca2? becomes higher than 1 after a 2.5 PV
injection. This observation is attributed to substitution of
Ca2? by Mg2? in terms of cation-exchange. The increasing
equivalent fraction of Ca2? is responsible for wettability
modification effect following LSWI. As a result, LSWI
produces as much as 15% more heavy oil than SWI due to
wettability modification effects (Fig. 6). In terms of
292
279
265
252
238
225
211
198
184
171
157
PROD
INJ
Permeability, mD
Fig. 12 Permeability (mD) distribution of pilot-scaled reservoir
115.0
112.7
110.4
108.1
105.8
103.4
101.1
98.8
96.5
94.2
91.9
149
140
131
122
113
104
95
86
77
68
59
Temperature Oil viscosity(a) (b)Temperature, °C Oil viscosity, cPPROD
INJ
PROD
INJ
Fig. 13 Distribution of temperature (�C) and oil viscosity (cP) for hot LSWI
0
0.0e+0
-1.0e+5
-2.0e+50.5 1.0
LSWIHot LSWISWI
1.5
Pore volume injected
Cal
cite
dis
solu
tion/
prec
ipita
tion,
mol
e
0
2.0e+4
1.0e+4
0.0e+00.5 1.0
SWILSWIHot LSWI
1.5
Pore volume injected
Dol
omite
dis
solu
tion/
prec
ipita
tion,
mol
e
(a) (b)
Fig. 14 Mineral dissolution/precipitation (mole) for LSWI and hot LSWI
Petroleum Science (2019) 16:366–381 375
123

mineral reaction, LSWI dissolves more mineral by 16%
over SWI (Fig. 8a). The mineral dissolution slightly
increases porosity and pore volume (Fig. 8b).
When hybrid hot LSWI is simulated into the core-scaled
system, hot water injection influences geochemical reac-
tions and reduces oil viscosity. Hot LSWI accelerates
mineral dissolution by 235% over SWI and increases pore
volume (Fig. 8). The increased porosity by mineral disso-
lution increases permeability, but the increments of
porosity and permeability in the core-scaled system are
negligible. In addition, hot LSWI causes a significant
cation ion-exchange. In comparison to SWI, hot LSWI
increases average equivalent fractions of Ca2? and Mg2?
by a factor of three and two, respectively. The relative
concentration of Ca2? is also investigated to confirm the
cation-exchange (Fig. 7). There is a delay of Ca2? at
breakthrough due to cation-exchange and a higher relative
concentration of Ca2? than 1 at 2.5 PV injection is
observed due to cation-exchange of Mg2?. The increased
equivalent fraction of Ca2? results in wettability modifi-
cation. Therefore, hot LSWI could preserve the wettability
modification effect. The next compares hot LSWI and
LSWI. While both hot LSWI and LSWI inject equivalent
ionic composition of brine, almost double the amount of
dolomite and calcite are dissolved and pore volume
increases more in hot LSWI (Fig. 8). The dolomite disso-
lution generates both Ca2? and Mg2? and calcite dissolu-
tion produces only Ca2?. The hot LSWI produces more
chemical compounds of Ca2? and Mg2? (CaHCO3?,
CaCO3, CaSO4, MgHCO3?, MgCO3, MgOH?, MgSO4)
consuming Ca2? and Mg2? (Fig. 9). These results lead to a
slightly increased amount of Ca2? and a decreased amount
of Mg2? for hot LSWI (Fig. 10). They are also confirmed
through the relative concentration of ions. The relative
concentration of Ca2? of hot LSWI shows slightly higher
value than that of LSWI (Fig. 7). Consequently, hot LSWI
slightly increases the average equivalent fraction of Ca2?
by 9% and decreases the average equivalent fraction of
Mg2? by 3% compared to LSWI. The increased equivalent
fraction of Ca2? indicates that the wettability modification
effect is enhanced during hot LSWI. The mineral dissolu-
tion produces HCO3- as well as cations. The HCO3
- also
generates CO2 and the CO2 remains as CO2 (aq), not CO2
(gas), due to solubility (Fig. 11). Additionally, hot LSWI
reduces the viscosity of heavy oil from 111 cP to 41 cP, as
indicated in Fig. 1. As a result, hot LSWI introduces syn-
ergistic effects of wettability modification and oil viscosity
reduction and increases oil recovery up to 56% (Fig. 6).
4.3 Pilot-scaled system: hot LSWI
Next, we evaluated the performance of hot LSWI in a
heterogeneous permeable reservoir. The reservoir proper-
ties are described in Table 4. The reservoir system has a
permeability distribution as depicted in Fig. 12. Another
necessary factor to consider in thermal EOR is the heat loss
to the over-burden and under-burden shale formations.
Table 4 also describes the heat capacity and thermal con-
ductivity of the shale and carbonate formations. The ana-
lytical model developed by Vinsome and Westerveld
(1980) calculates heat loss from reservoir to over-burden
and under-burden formations. Injection of brine is designed
with 150 m3/day and total 1.5 PV is injected. Hot LSWI
heated to 115 �C before injection is deployed into this
reservoir and the production from hot LSWI is compared to
that of LSWI.
The quarter of five-spot system with one injector and
one producer is considered (Fig. 13). When hot LSWI is
applied to a pilot-scaled system, the temperature of the
reservoir increases up to 114 �C (Fig. 13a) despite of heat
loss to over-burden and under-burden formations. It results
in a reduction in oil viscosity down to 59 cP improving the
mobility ratio (Fig. 13b). The hot LSWI is compared to
SWI and LSWI in terms of geochemical reactions and
0
1.0e+6
1.0e+5
1.0e+41.00.5
SWILSWIHot LSWI
1.5
Pore volume injected
Am
ount
of C
a2+, m
ole
1.0e+6
1.0e+5
1.0e+4
SWILSWIHot LSWI
Pore volume injected
Am
ount
of M
g2+, m
ole
0 1.00.5 1.5
(a) (b)
Fig. 15 The amount (mole) of Ca2? (a) and Mg2? (b) for SWI, LSWI, hot LSWI
376 Petroleum Science (2019) 16:366–381
123

wettability modification effect. Dissolution and precipita-
tion of calcite and dolomite minerals are investigated
(Fig. 14). The dissolution/precipitation of minerals change
amount of cation in the pilot-scaled reservoir (Fig. 15). In
comparison to SWI, LSWI dissolves more calcite minerals
by 230%. Hot LSWI dissolves more calcite mineral by
15% over LSWI because geochemical reaction is sensitive
to temperature. In comparison to LSWI, more calcite dis-
solution during hot LSWI leads to an increased amount of
Ca2? by 5%. In terms of dolomite mineral reaction, both
LSWI and hot LSWI result in precipitation. The precipi-
tation of dolomite during hot LSWI is higher than that
during LSWI. The higher dolomite precipitation by 88%
decreases the amount of Mg2? in the reservoir by 8%. For
both LSWI and hot LSWI, the dissolution of calcite is
much higher than the precipitation of dolomite so that
overall mineral dissolution rather than precipitation is
dominant.
Next, we evaluated the ion-exchange of Ca2? con-
tributing to wettability modification during SWI, LSWI,
and hot LSWI (Fig. 16). The equivalent fraction of Ca2?
increases up to 0.16 after SWI of 1.5 PV. LSWI and hot
LSWI lead to more ion-exchange of Ca2? increasing the
equivalent fractions up to 0.39 and 0.43, respectively. In
comparison to SWI, the equivalent fraction during LSWI
increases by 240%. In addition, the hot LSWI has a 10%
higher average equivalent fraction of Ca2? over LSWI. It
means the wettability modification effect is enhanced
during hot LSWI compared to LSWI. As a result, LSWI
and hot LSWI produce 3% and 6% additional oil over SWI,
respectively (Fig. 17). The increased oil recovery during
hot LSWI is attributed to synergistic effects of oil viscosity
reduction and enhanced wettability modification.
0.43
0.39
0.36
0.32
0.29
0.25
0.21
0.18
0.14
0.11
0.07
(a)
0.43
0.39
0.36
0.32
0.29
0.25
0.21
0.18
0.14
0.11
0.07
(b)
0.43
0.39
0.36
0.32
0.29
0.25
0.21
0.18
0.14
0.11
0.07
(c)
SWI
LSWI
Hot LSWI
PROD
INJ
PROD
INJ
PROD
INJ
Fig. 16 Equivalent fraction of Ca2? after SWI (a), LSWI (b), and hot
LSWI (c)
0
40
20
00.5 1.0
SWILSWIHot LSWI
1.5
Pore volume injected
Oil
reco
very
, %
Fig. 17 History of oil recovery (%) for SWI, LSWI, and hot LSWI
Petroleum Science (2019) 16:366–381 377
123

4.4 Probabilistic forecast of hot LSWI
To assess inherent uncertainties in the history matching
process, a probabilistic forecast method is employed for
LSWI and hot LSWI simulations in a pilot-scaled reservoir.
Multiple relative permeability curves from 58 history-
matched models containing less than 1.5% matching errors
(Fig. 2) are subjected to the assessment of probabilistic
forecast. Oil recoveries are calculated from the simulations
of LSWI and hot LSWI, respectively (Fig. 18). LSWI
produces oil recovery from 30% to 40% and hot LSWI
produces oil recovery from 33% to 42%. Uncertainty
assessments based on the simulations are carried out using
a radial basis function neural network modeling and
Monte-Carlo simulation. The assessment has estimated
P90, P50, and P10 in cumulative distribution function of oil
recovery. The P90, P50, and P10 are defined as the oil
recovery corresponding to percentile of 90, 50, and 10,
respectively. Figure 19 denotes the results of Monte-Carlo
simulation for LSWI and hot LSWI. In LSWI, the P10,
P50, and P90 of oil recovery are about 29%, 32%, and
38%, respectively. Estimated P10 and P90 of oil recovery
indicate conservative and optimistic oil recoveries. There is
approximately 11% of difference between P90 and P10.
For hot LSWI, P10, P50, and P90 of oil recovery are 32%,
35%, and 40%, respectively. The optimistic oil recovery
has 8% higher than conservative oil recovery in hot LSWI.
Despite the uncertainty to predict oil production, hot LSWI
enhances heavy oil production by synergistic effects.
2016-03 2016-04
General solutionsBase case
2016-01 2016-02
15
0
30
Oil
reco
very
, %
45
2016-05 2016-06 2016-07
Time
2016-03 2016-04
General solutionsBase case
2016-01 2016-02
15
0
30
Oil
reco
very
, %
45
2016-05 2016-06 2016-07
Time
(a)
(b)
LSWI
Hot LSWI
Fig. 18 Oil recovery (%) of history-matched models for LSWI (a) and hot LSWI (b)
378 Petroleum Science (2019) 16:366–381
123

5 Conclusions
This study models hot LSWI process and evaluates syn-
ergistic effects of hot LSWI to enhance heavy oil produc-
tion. The synergistic effects of oil viscosity reduction and
wettability modification are evaluated during hot LSWI.
The wettability modification is investigated in terms of
geochemical reactions. This study tests the viability of the
hot LSWI in core- and pilot-scaled systems. The following
conclusions are drawn from this study.
In comparison to LSWI, the thermal energy of hot LSWI
influences geochemical reactions and oil viscosity. In a
core-scaled system, both LSWI and hot LSWI lead to ion-
exchange of Ca2? and Mg2? modifying wettability. In
comparison to SWI, LSWI and hot LSWI increase the
equivalent fraction of Ca2? by 182% and 209% as a result
of ion-exchange. In comparison to LSWI, the hot LSWI
dissolves more mineral and produces Ca2? in the system.
The mineral dissolution slightly increases the equivalent
fraction enhancing wettability modification for hot LSWI.
In an assessment of the pilot-scaled system, LSWI and hot
LSWI provide 240% and 268% higher equivalent fraction
over SWI and improve wettability. In comparison to LSWI,
hot LSWI produces higher equivalent fraction by 10%
because of more calcite dissolution. This result also implies
the enhanced wettability modification effect during hot
LSWI. Another key factor to determine oil recovery is the
oil viscosity. While LSWI has favorable wetness to recover
oil, the oil recovery increase is 3%. Hot LSWI reduces oil
viscosity by 63%. Therefore, 3% more movable oil can be
recovered in the hot LSWI process. Finally, a probabilistic
forecast with uncertainty assessment evaluates the feasi-
bility of hot LSWI by comparing LSWI. It confirms that
hot LSWI enables the production of additional heavy oil
Cum
ulat
ive
prob
abili
ty fu
nctio
n
Pro
babi
lity
dens
ity
Oil recovery, %
(a)
24 30 36 42 48
1.0
0.9
0.8
0.7
0.6
0.5
0.4
0.3
0.2
0.1
0
0.050
0.045
0.040
0.035
0.030
0.025
0.020
0.015
0.010
0.005
0
P10
= 2
9.23
02
P90
= 3
7.68
91
Oil_recovery_factor probability distribution (MC simulation size = 65000)
Cum
ulat
ive
prob
abili
ty fu
nctio
n
Pro
babi
lity
dens
ity
Oil recovery, %
(b)
24 30 36 42 48
1.0
0.9
0.8
0.7
0.6
0.5
0.4
0.3
0.2
0.1
0
0.050
0.045
0.040
0.035
0.030
0.025
0.020
0.015
0.010
0.005
0
P10
= 3
1.56
23
P90
= 3
9.71
34
Oil_recovery_factor probability distribution (MC simulation size = 65000)
Cumulative probabilityProbability density
Cumulative probabilityProbability density
P50
= 3
2.41
22
P50
= 3
4.60
43
Fig. 19 Monte-Carlo simulations of LSWI and hot LSWI in terms of oil recovery (%)
Petroleum Science (2019) 16:366–381 379
123
due to enhanced wettability modification and oil viscosity
reduction effects.
Acknowledgements This work was financially supported by the
Energy Efficiency and Resources of the Korea Institute of Energy
Technology Evaluation and Planning (KETEP) Grant funded by the
Korea government Ministry of Knowledge Economy (No.
20172510102290).
Open Access This article is distributed under the terms of the Creative
Commons Attribution 4.0 International License (http://creative
commons.org/licenses/by/4.0/), which permits unrestricted use, dis-
tribution, and reproduction in any medium, provided you give
appropriate credit to the original author(s) and the source, provide a
link to the Creative Commons license, and indicate if changes were
made.
References
Abass E, Fahmi A. Experimental investigation of low salinity hot
water injection to enhance the recovery of heavy oil reservoirs.
In: North Africa technical conference and exhibition, 15–17
April, Cairo, Egypt; 2013. http://dx.doi.org/10.2118/164768-MS.
Alajmi AFF, Algharaib MK, Gharbi RC. 2009. Experimental
evaluation of heavy oil recovery by hot water injection in a
Middle Eastern reservoir. In: SPE middle east oil and gas show
and conference, 15–18 March, Manama, Bahrain; 2009. http://
dx.doi.org/10.2118/120089-MS.
Appelo CAJ, Postma D. Geochemistry, groundwater and pollution.
2nd ed. Leiden: Balkema AA; 2005.
Austad T, Strand S, Høgnesen EJ, Zhang P. Seawater as IOR fluid in
fractured chalk. In: SPE international symposium on oilfield
chemistry, 2–4 February, The Woodlands, Texas; 2005. http://
dx.doi.org/10.2118/93000-MS.
Awolayo AN, Sarma HK, Nghiem LX. A Comprehensive geochem-
ical-based approach at modeling and interpreting brine dilution
in carbonate reservoirs. In: SPE reservoir simulation conference,
20–22 February, Montgomery, Texas; 2017. http://dx.doi.org/10.
2118/182626-MS.
Ayirala S, Al-Saleh SH, Enezi S, Yousef A. Effect of salinity and
water ions on electrokinetic interactions in carbonate reservoir
cores at elevated temperatures. SPE Res Eval Eng.
2018;21(3):733–46. https://doi.org/10.2118/189444-PA.
Bethke CM. Geochemical and biogeochemical reaction modeling.
2nd ed. New York: Cambridge University Press; 2007.
Delany JM, Lundeen SR. The LLNL thermochemical data base-
revised data and file format for the EQ3/6 package: UCID-
21658. Livermore: Lawrence Livermore National Laboratory;
1991.
Duval K, Gutierrez D, Petrakos D, Ollier P, Johannson D. Successful
application of hot-water circulation in the Pelican Lake field:
results and analyses of the E29 hot-water-injection pilot. J Can
Pet Technol. 2015;54(6):361–71. https://doi.org/10.2118/
174491-PA.
Gachuz-Muro H, Sohrabi M. Effects of brine on crude oil viscosity at
different temperature and brine composition-heavy oil/water
interaction. In: EAGE annual conference & exhibition incorpo-
rating SPE Europec, 10–13 June, London, UK; 2013. http://dx.
doi.org/10.2118/164910-MS.
Gachuz-Muro H, Sohrabi M. Smart water injection for heavy oil
recovery from naturally fractured reservoirs. In: SPE heavy and
extra heavy oil conference, 24–26 Sept, Latin America; 2014.
http://dx.doi.org/10.2118/171120-MS.
Guo K, Li H, Yu Z. In-situ heavy and extra-heavy oil recovery: a
review. Fuel. 2016;185:886–902. https://doi.org/10.1016/j.fuel.
2016.08.047.
Hiorth A, Cathles LM, Madland MV. The impact of pore water
chemistry on carbonate surface charge and oil wettability.
Transp Porous Media. 2010;85(1):1–21. https://doi.org/10.1007/
s11242-010-9543-6.
Kharaka YK, Gunter WD, Aggarwal PK, Perkins EH, DeBraal JD.
SOLMINEQ.88, A computer program for geochemical modeling
of water–rock interactions. water resources investigation report
88–4227, US Geological Survey, Menlo Park, California, 1988.
Kestin J, Khalifa HE, Correia RJ. Tables of the dynamic and
kinematic viscosity of aqueous NaCl solutions in the temperature
range 20–150�C and the pressure range 0.1–35 MPa. J Phys
Chem Ref Data. 1981;10(1):71. https://doi.org/10.1063/1.
555641.
Kovscek AR, Diabira I, Castanier LM. An experimental investigation
of permeability and porosity alteration in diatomite during hot
fluid injection. In: SPE/AAPG western regional meeting, Long
Beach, California, 19–22 June, 2000. http://dx.doi.org/10.2118/
62558-MS.
Lager A, Webb KJ, Black CJJ, Singleton M, Sorbie KS. Low salinity
oil recovery-an experimental investigation 1. Petrophys.
2008;49(1):28–35.
Lake LW, Johns RT, Rossen WR, Pope GA. Fundamentals of
enhanced oil recovery. Texas: Society of Petroleum Engineers;
2014.
Lapham N. Enhanced oil recovery. 2nd ed. Rockvill, Maryland: SBI
Energy; 2012.
Meyer RF, Attanasi ED, Freeman PA. Heavy oil and natural bitumen:
Strategic petroleum resources. United States Geological Survey.
2003.
Morse JW, Arvidson RS. The dissolution kinetics of major sedimen-
tary carbonate minerals. Earth Sci Rev. 2002;58(1–2):51–84.
https://doi.org/10.1016/S0012-8252(01)00083-6.
Nghiem L, Sammon P, Grabenstetter J, Ohkuma H. Modeling CO2
storage in aquifers with a fully-coupled geochemical EOS
compositional simulator. In: SPE/DOE symposium on improved
oil recovery, 17–21 April, Tulsa, Oklahoma; 2004. https://doi.
org/10.2118/89474-MS.
Pedersen KS, Fredenslund A. An improved corresponding states
model for the prediction of oil and gas viscosities and thermal
conductivities. Chem Eng Sci. 1987;42(1):182–6. https://doi.org/
10.1016/0009-2509(87)80225-7.
Qiao C, Johns R, Li L, Xu J. Modeling low salinity waterflooding in
mineralogically different carbonates. In: SPE annual technical
conference and exhibition, 28–30 September, Houston, Texas;
2015. http://dx.doi.org/10.2118/175018-MS.
Rowe AM, Chou JCS. Pressure-volume-temperature-concentration
relation of aqueous sodium chloride solutions. J Chem Eng Data.
1970;15(1):61–6. https://doi.org/10.1021/je60044a016.
Saidi AM. Reservoir engineering of fractured reservoirs: fundamental
and practical aspects. Total ed. Paris: Press; 1988.
SenGupta AK. Ion exchange in environmental processes: fundamen-
tals, application and sustainable technology. Hoboken: Wiley;
2017.
Soulaine C, Roman S, Kovscek A, Tchelepi HA. Mineral dissolution
and wormholing from a pore-scale perspective. J Fluid Mech.
2017;827:457–83. https://doi.org/10.1017/jfm.2017.499.
Vinsome PKW, Westerveld J. A simple method for predicting cap
and base rock heat losses in thermal reservoir simulators. J Can
Pet Technol. 1980;9(3):87–90. https://doi.org/10.2118/80-03-04.
Wolery TJ. EQ3NR, a computer program for geochemical aqueous
speciation-solubility calculations: theoretical manual, user’s
guide, and related documentation (Version 7.0). Laboratory
Report No. UCRL-MA-110662 (3), Livermore, Lawrence
380 Petroleum Science (2019) 16:366–381
123

Livermore Laboratory, University of California, California.
1992.
Wolthers M, Charlet L, Cappellen PV. The surface chemistry of
divalent metal carbonate minerals; a critical assessment of
surface charge and potential data using the charge distribution
multi-site ion complexation model. Am J Sci.
2008;308(8):905–41. https://doi.org/10.2475/08.2008.02.
Yousef AA, Al-Saleh SH, Al-Kaabi A, Al-Jawfi MS. Laboratory
investigation of the impact of injection-water salinity and ionic
content on oil recovery from carbonate reservoirs. SPE Res Eval
Eng. 2011;14(5):578–93. https://doi.org/10.2118/137634-PA.
Yutkin MP, Mishra H, Patzek TW, Lee J, Radke CJ. Bulk and surface
aqueous speciation of calcite: implications for low-salinity
waterflooding of carbonate reservoirs. SPE J.
2018;3(01):84–101. https://doi.org/10.2118/182829-PA.
Zhang P, Tweheyo MT, Austad T. Wettability alteration and
improved oil recovery in chalk: the effect of calcium in the
presence of sulfate. Energy Fuels. 2006;20(5):2056–62. https://
doi.org/10.1021/ef0600816.
Zhang P, Tweheyo MT, Austad T. Wettability alteration and
improved oil recovery by spontaneous imbibition of seawater
into chalk: impact of the potential determining ions: Ca2?,
Mg2?, and SO42-. Colloids Surf A Physicochem Eng Asp.
2007;301(1–3):199–208. https://doi.org/10.1016/j.colsurfa.2006.
12.058.
Petroleum Science (2019) 16:366–381 381
123