Geo script opengeo spring 2013
22
Ilya Rosenfeld | OpenGeo | Spring 2013 GeoScript
-
Upload
ilya-rosenfeld -
Category
Documents
-
view
866 -
download
5
Transcript of Geo script opengeo spring 2013

Ilya Rosenfeld | OpenGeo | Spring 2013
GeoScript

A library for processing of spatial data
Several implementations for scripting environments
Currently in Python, Groovy, JavaScript, Scala, Ruby
GeoTools under the hood
The Big Idea

Easy to learn
Simple to use
Familiar spatial metaphors
Choice of a scripting language
Versatile products
Evolving, free and open source
Why GeoScript

"Succinctness is Power."
- Paul Graham Author or "Hackers and Painters"

GeometryFeature
WorkspaceFilterLayer
Spatial Metaphors and API
StyleMap
ProjectionFunctionProcess
http://www. geoscript.org

# import librariesfrom geoscript.layer import Shapefile from geoscript.render import drawfrom geoscript.style import *
# load datasolar = Shapefile("solar_dni_polygons_fla.shp")
# style and display itsolar.style = Stroke("blue")draw(solar)
Load, style and display data ...

... output
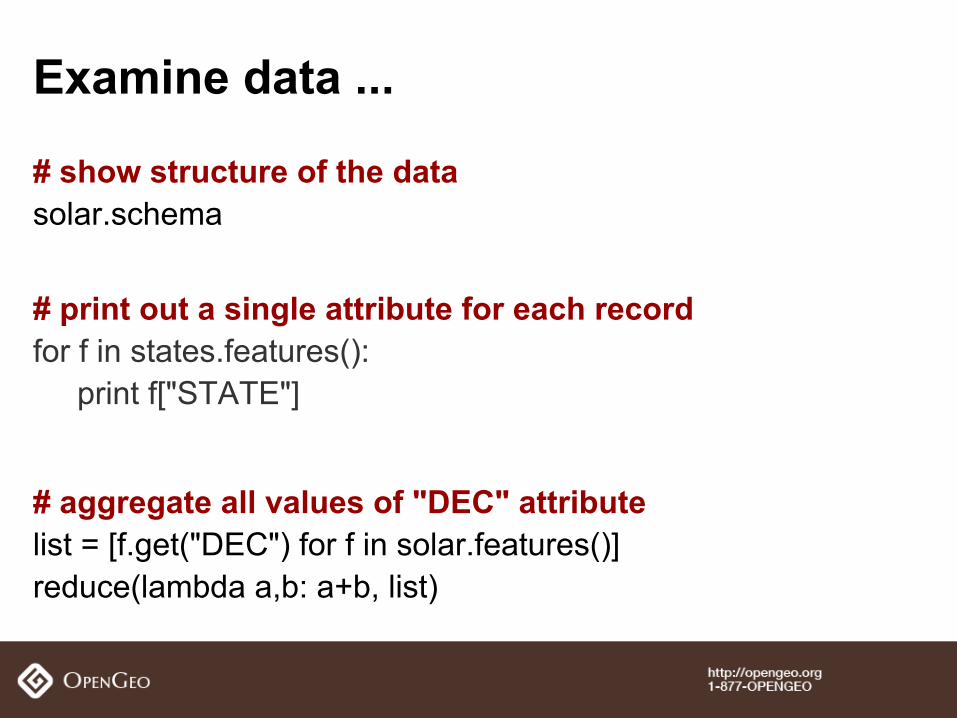
# show structure of the datasolar.schema
# print out a single attribute for each recordfor f in states.features(): print f["STATE"]
# aggregate all values of "DEC" attribute list = [f.get("DEC") for f in solar.features()]reduce(lambda a,b: a+b, list)
Examine data ...

... output
shapefile's schema:solar_dni_polygons_fla [the_geom: MultiPolygon, ID: long, GRIDCODE: float, ANN_DNI: float, JAN: float, FEB: float, MAR: float, APR: float, MAY: float, JUN: float, JUL: float, AUG: float, SEP: float, OCT: float, NOV: float, DEC: float]
"DEC" attribute values:[4.268077957, 4.268077957, 4.268077957, 4.268077957...
aggregate value of "DEC":6791.922061828683

# importfrom geoscript.plot import bar
# populate data for X axisx = [1,2,3,4,5,6,7,8,9,10]
# populate data for Y axisy = [i * i for i in x]
# draw histogrambar.xy(zip(x,y)).show()
Build a Histogram ...
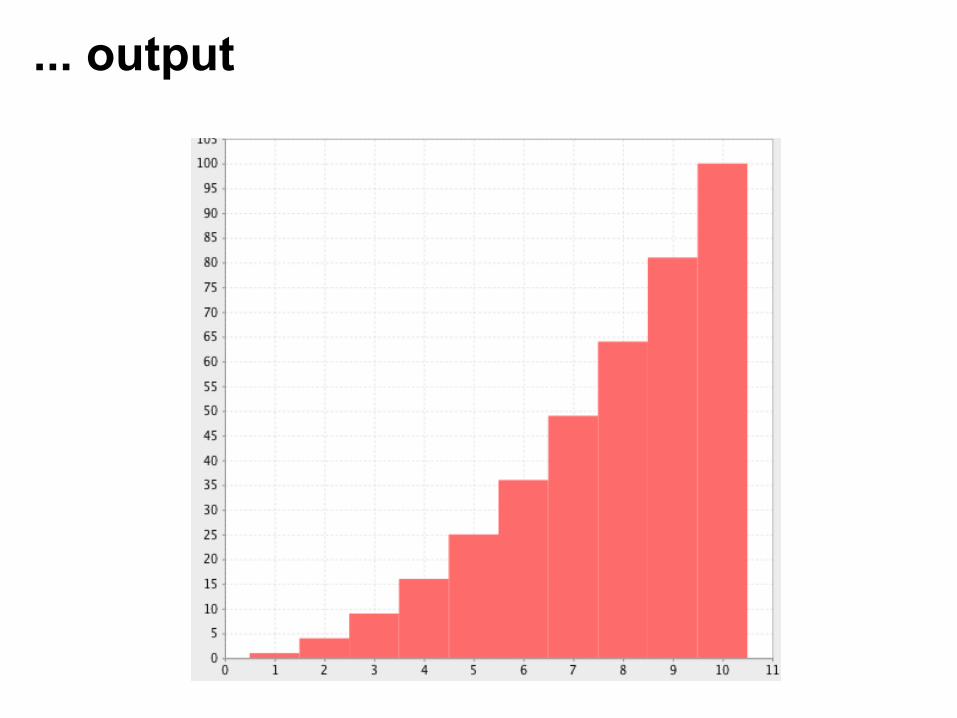
... output
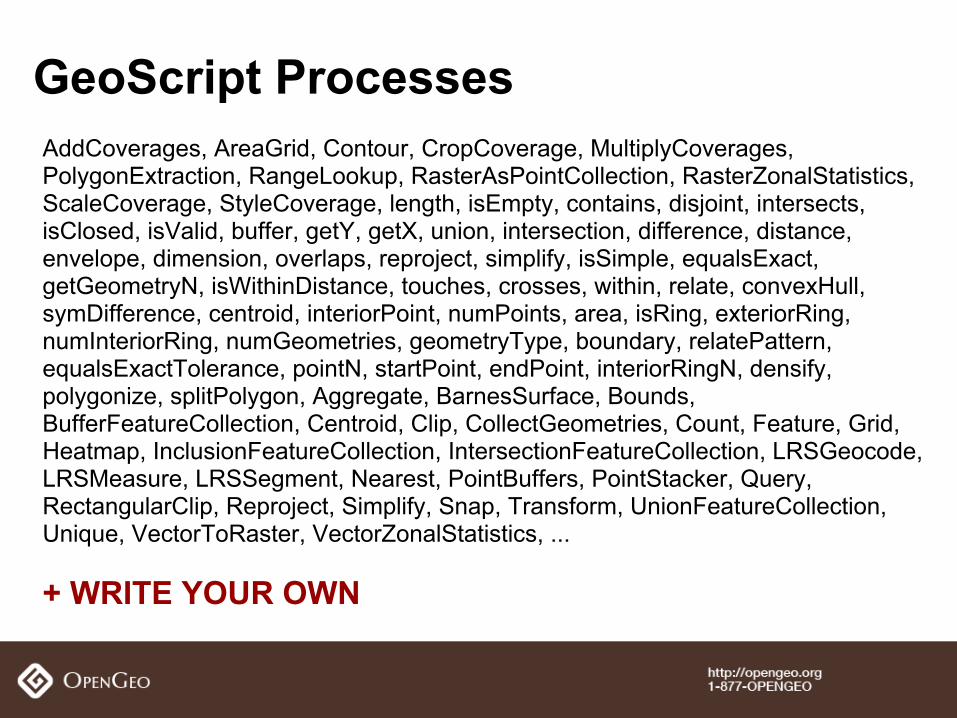
GeoScript ProcessesAddCoverages, AreaGrid, Contour, CropCoverage, MultiplyCoverages, PolygonExtraction, RangeLookup, RasterAsPointCollection, RasterZonalStatistics, ScaleCoverage, StyleCoverage, length, isEmpty, contains, disjoint, intersects, isClosed, isValid, buffer, getY, getX, union, intersection, difference, distance, envelope, dimension, overlaps, reproject, simplify, isSimple, equalsExact, getGeometryN, isWithinDistance, touches, crosses, within, relate, convexHull, symDifference, centroid, interiorPoint, numPoints, area, isRing, exteriorRing, numInteriorRing, numGeometries, geometryType, boundary, relatePattern, equalsExactTolerance, pointN, startPoint, endPoint, interiorRingN, densify, polygonize, splitPolygon, Aggregate, BarnesSurface, Bounds, BufferFeatureCollection, Centroid, Clip, CollectGeometries, Count, Feature, Grid, Heatmap, InclusionFeatureCollection, IntersectionFeatureCollection, LRSGeocode, LRSMeasure, LRSSegment, Nearest, PointBuffers, PointStacker, Query, RectangularClip, Reproject, Simplify, Snap, Transform, UnionFeatureCollection, Unique, VectorToRaster, VectorZonalStatistics, ...
+ WRITE YOUR OWN
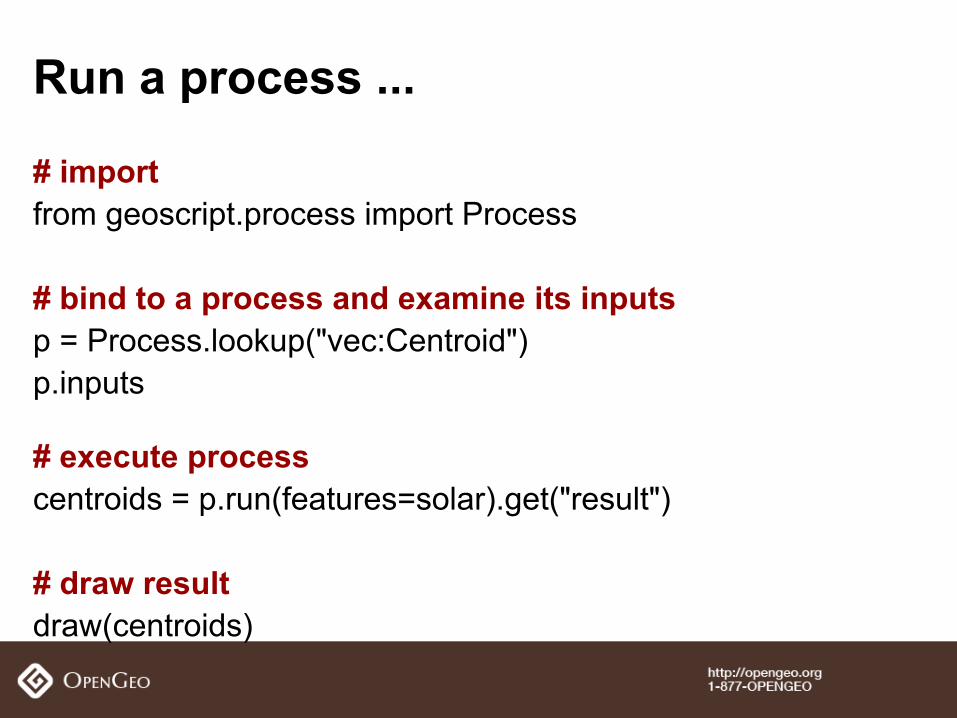
# importfrom geoscript.process import Process
# bind to a process and examine its inputsp = Process.lookup("vec:Centroid")p.inputs
# execute process centroids = p.run(features=solar).get("result")
# draw result draw(centroids)
Run a process ...

... output

>> Establishing Internet Connection ...
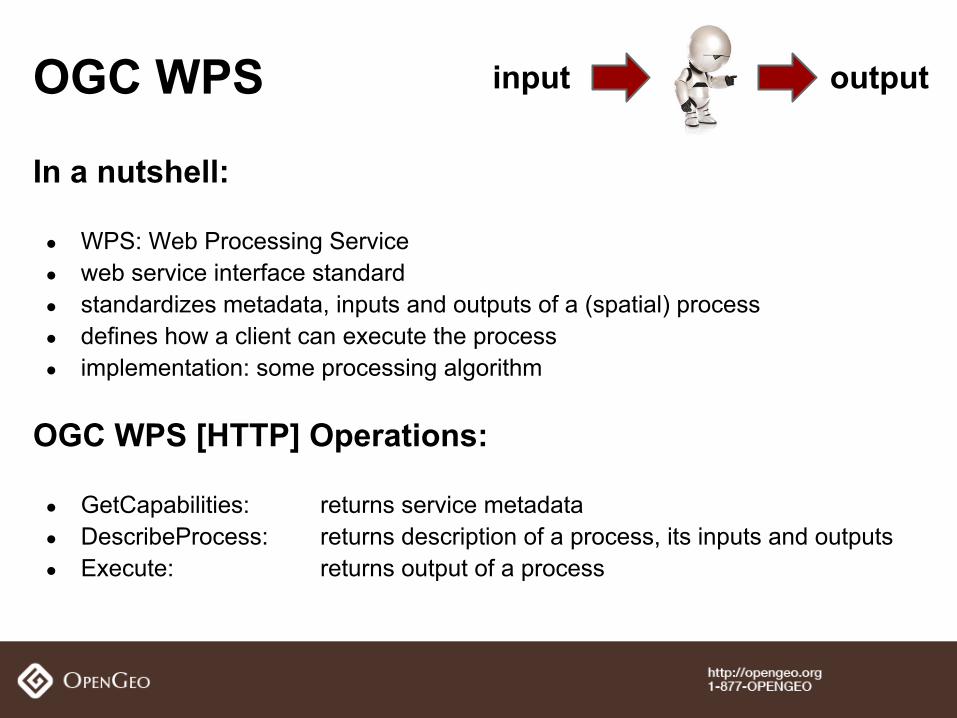
In a nutshell:
● WPS: Web Processing Service● web service interface standard● standardizes metadata, inputs and outputs of a (spatial) process● defines how a client can execute the process● implementation: some processing algorithm
OGC WPS [HTTP] Operations:
● GetCapabilities: returns service metadata● DescribeProcess: returns description of a process, its inputs and outputs● Execute: returns output of a process
OGC WPS input output

Step 1: Hack GeoScript from command line. Step 2: Wrap your code in a Process.Step 3: Copy to GeoServer.
It lives, it runs!
WPS How-to

WPS Example
origin
http://suite.opengeo.org/docs/processing/scripting/processcreate.html

inputs● GML● WKT● HTTP reference● subprocess● feature collection
○ WFS collection○ JSON○ Shapefile ZIP○ HTTP request○ GeoServer VECTOR_LAYER○ subprocess
Process Inputs and Outputs
outputs● WKT● GML● Shapefile ZIP● ...
inputs● TIFF● ArcGrid● HTTP reference● GeoServer RASTER_LAYER● subprocess
outputs● TIFF● ArcGrid● ...
vector
raster
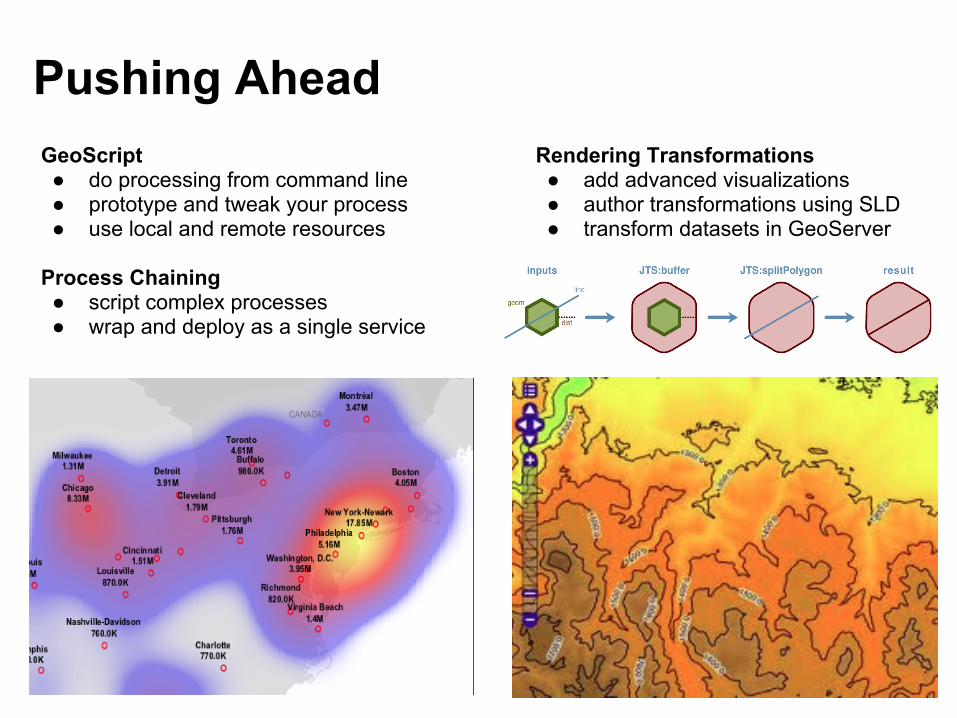
Pushing AheadGeoScript ● do processing from command line● prototype and tweak your process● use local and remote resources
Process Chaining● script complex processes● wrap and deploy as a single service
Rendering Transformations● add advanced visualizations● author transformations using SLD● transform datasets in GeoServer

Pushing AheadIntegration● invoke WPS from another system● embed interactive maps into other apps
Web Mapping App Development● use OpenGeo Suite SDK● create a starter app automatically● customize, test and deploy

blog.opengeo.orgkeyword: "solar"