Gentrification and the suburbanization of poverty ... · Hedin et al., 2012). The global financial...
30
UvA-DARE is a service provided by the library of the University of Amsterdam (http://dare.uva.nl) UvA-DARE (Digital Academic Repository) Gentrification and the suburbanization of poverty: changing urban geographies through boom and bust periods Hochstenbach, C.; Musterd, S. Published in: Urban Geography DOI: 10.1080/02723638.2016.1276718 Link to publication Citation for published version (APA): Hochstenbach, C., & Musterd, S. (2018). Gentrification and the suburbanization of poverty: changing urban geographies through boom and bust periods. Urban Geography, 39(1), 26-53. https://doi.org/10.1080/02723638.2016.1276718 General rights It is not permitted to download or to forward/distribute the text or part of it without the consent of the author(s) and/or copyright holder(s), other than for strictly personal, individual use, unless the work is under an open content license (like Creative Commons). Disclaimer/Complaints regulations If you believe that digital publication of certain material infringes any of your rights or (privacy) interests, please let the Library know, stating your reasons. In case of a legitimate complaint, the Library will make the material inaccessible and/or remove it from the website. Please Ask the Library: https://uba.uva.nl/en/contact, or a letter to: Library of the University of Amsterdam, Secretariat, Singel 425, 1012 WP Amsterdam, The Netherlands. You will be contacted as soon as possible. Download date: 31 Dec 2019
Transcript of Gentrification and the suburbanization of poverty ... · Hedin et al., 2012). The global financial...

UvA-DARE is a service provided by the library of the University of Amsterdam (http://dare.uva.nl)
UvA-DARE (Digital Academic Repository)
Gentrification and the suburbanization of poverty: changing urban geographies through boomand bust periods
Hochstenbach, C.; Musterd, S.
Published in:Urban Geography
DOI:10.1080/02723638.2016.1276718
Link to publication
Citation for published version (APA):Hochstenbach, C., & Musterd, S. (2018). Gentrification and the suburbanization of poverty: changing urbangeographies through boom and bust periods. Urban Geography, 39(1), 26-53.https://doi.org/10.1080/02723638.2016.1276718
General rightsIt is not permitted to download or to forward/distribute the text or part of it without the consent of the author(s) and/or copyright holder(s),other than for strictly personal, individual use, unless the work is under an open content license (like Creative Commons).
Disclaimer/Complaints regulationsIf you believe that digital publication of certain material infringes any of your rights or (privacy) interests, please let the Library know, statingyour reasons. In case of a legitimate complaint, the Library will make the material inaccessible and/or remove it from the website. Please Askthe Library: https://uba.uva.nl/en/contact, or a letter to: Library of the University of Amsterdam, Secretariat, Singel 425, 1012 WP Amsterdam,The Netherlands. You will be contacted as soon as possible.
Download date: 31 Dec 2019

Full Terms & Conditions of access and use can be found athttp://www.tandfonline.com/action/journalInformation?journalCode=rurb20
Urban Geography
ISSN: 0272-3638 (Print) 1938-2847 (Online) Journal homepage: http://www.tandfonline.com/loi/rurb20
Gentrification and the suburbanization of poverty:changing urban geographies through boom andbust periods
Cody Hochstenbach & Sako Musterd
To cite this article: Cody Hochstenbach & Sako Musterd (2018) Gentrification and thesuburbanization of poverty: changing urban geographies through boom and bust periods, UrbanGeography, 39:1, 26-53, DOI: 10.1080/02723638.2016.1276718
To link to this article: https://doi.org/10.1080/02723638.2016.1276718
© The Author(s). Published by Informa UKLimited, trading as Taylor & Francis Group
Published online: 17 Jan 2017.
Submit your article to this journal
Article views: 2832
View related articles
View Crossmark data
Citing articles: 4 View citing articles

Gentrification and the suburbanization of poverty: changingurban geographies through boom and bust periodsCody Hochstenbach and Sako Musterd
Amsterdam Institute for Social Science Research, Centre for Urban Studies, Universiteit van Amsterdam,Amsterdam, Netherlands
ABSTRACTMany postindustrial cities across Europe and other contexts aremarked by growing social–spatial inequalities, housing liberaliza-tion, and gentrification, which limit the housing options of low-income households. We investigated changes in the residentialmoves of different low-income households (working poor, low-to-middle income, and unemployed) in the Amsterdam andRotterdam urban regions for the time period 2004–2013. Wefound an overarching trend for the suburbanization of povertytoward the urban peripheries and surrounding regions. While thistrend appears to be relatively crisis resistant in the tightAmsterdam housing context, it is more cyclical in Rotterdam andhas slowed following the global financial crisis. Low-to-middleincome and unemployed households are increasingly moving tothe urban regions surrounding cities, particularly to higher densitysatellite towns. Nevertheless, a growing number of working poorhouseholds remain highly urbanized, employing various copingstrategies to acquire housing. This paper reveals how the subur-banization of poverty is both a direct process of poor householdsmoving from city to suburb, and a broader indirect process causedby exclusionary mechanisms such as the decreasing accessibilityand affordability of inner-urban neighborhoods, which reflectbroader changes in the geography and socioeconomic patterningof urban regions.
ARTICLE HISTORYReceived 19 January 2016Accepted 5 December 2016
KEYWORDSGentrification;suburbanization of poverty;displacement; globalfinancial crisis; housing
Introduction
Over the course of the past few decades, many cities have experienced profoundchanges regarding the class composition of the population. Overall, major postindus-trial cities have become not only more middle class—“professionalized” (Butler,Hamnett, & Ramsden, 2008; Hamnett, 1994)—but also more divided along socioeco-nomic and class lines (“polarized”), as is reflected, for example, in rising levels ofsocioeconomic segregation in many European capital cities (Tammaru, Marcinczak,Van Ham, & Musterd, 2016). As cities’ class maps are redrawn, urban poverty alsoshifts; it may, for example, move away from the inner city milieu and “suburbanize” or“decentralize” (Cooke & Denton, 2015; Hedin, Clark, Lundholm, & Malmberg, 2012;
CONTACT Cody Hochstenbach [email protected]
URBAN GEOGRAPHY, 2018VOL. 39, NO. 1, 26–53https://doi.org/10.1080/02723638.2016.1276718
© The Author(s). Published by Informa UK Limited, trading as Taylor & Francis GroupThis is an Open Access article distributed under the terms of the Creative Commons Attribution-NonCommercial-NoDerivatives License(http://creativecommons.org/licenses/by-nc-nd/4.0/), which permits non-commercial re-use, distribution, and reproduction in anymedium, provided the original work is properly cited, and is not altered, transformed, or built upon in any way.

Hulchanski, 2010; Kavanagh, Lee, & Pryce, 2016; Randolph & Tice, 2014). Althoughthese changing divisions are the product of various drivers, welfare state retrenchmentand accompanying economic liberalization play an important role. These policy shiftsare inter alia reflected in the sale of social rental housing and the gradual reduction inrent controls and tenant protections, ultimately making economic resources moreimportant in determining housing and neighborhood outcomes. In many cases,expanding gentrification and the associated (direct or exclusionary) displacement oflow-income residents are the spatial expressions of these tendencies toward liberal-ization. Indeed, state-led gentrification has become emblematic of neoliberal urban andhousing policies that seek to remake the city according to the preferences of the middleclass and capital (Harvey, 1989; Peck & Tickell, 2002; Smith, 2002).
In this paper, we investigate changes in the social–spatial layout of cities by focusingon one crucial element: the spatial dimensions of (urban) poverty. We examine thechanges in Amsterdam and Rotterdam (the Netherlands) during the period 2004–2013.Rather than elaborating on more static existing poverty concentrations, we target theresidential moves of low-income residents and the changes therein. We considerresidential moves particularly important because this is where displacement, exclusion,and issues of housing accessibility or affordability become most apparent. Furthermore,what “happens” to urban poverty and where it goes are especially pertinent questions inthe face of gentrification becoming the modus operandi in many (inner) cities.
We illuminate these issues by addressing the extent to which structural urbanconditions as well as cyclical conditions impact urban social processes. We start withthe question of what the overarching trends are in terms of the residential mobility oflow-income residents (RQ1). In the face of ongoing urban gentrification, we expect thata focus on residential moves will reveal the growing suburbanization of poverty; a trendthat may still appear to be only a minor undercurrent when looking at the totalpopulation, where trends among movers might be obscured by those amongnon-movers. Importantly, we argue that the suburbanization of poverty is not onlyproduced by low-income households directly moving from the central city to thesuburbs, but also by exclusionary mechanisms that prevent low-income householdsfrom moving into central urban areas.
RQ1: How and to what extent are the moving patterns of (different groups of) lowincome residents subject to changes over time?
The onset of the 2008 global financial crisis was a crucial event that has played a keyrole in rearticulating existing inequalities and forging new ones. Yet, it is so far unclearhow this has played out in urban space, specifically in relation to urban poverty.Various patterns are possible. The boom and bust periods—both preceding and follow-ing the onset of the crisis—may be marked by substantial shifts in urban poverty; thesechanges may, however, either be accelerating or slowing down. Alternatively, trendsoccurring during the boom period may see a reversal or annihilation during the bustperiod. More specifically, the boom period preceding the crisis was in the Dutch context—as in many other settings—marked by substantial housing liberalization and theformation of a housing bubble, which had already placed constraints on housingaffordability and accessibility, producing increasingly divided social–spatial outcomes
URBAN GEOGRAPHY 27
(Musterd & Van Gent 2016). During boom periods, gentrification generally progressesthe most vigorously, while the process slows during busts (Hackworth & Smith, 2001;Hedin et al., 2012). The global financial crisis exacerbated inequalities and had aprofoundly negative effect on the housing position of various population groups,particularly the growing group of those hit by unemployment, precarious employmentsituations, and growing household debt. This group faces decreasing access to home-ownership (Forrest & Hirayama, 2015) and depends on a shrinking affordable socialrental sector.
At the level of the neighborhood, this may have several consequences. The mostaffordable neighborhoods in an urban-regional system may increasingly serve relativelylow-income residents, thus amplifying already existing trajectories of neighborhooddecline (Zwiers, Bolt, Van Ham, & Van Kempen, 2016a). Neighborhood upgrading mayalso be reversed, contributing to de-gentrification (Lees & Bondi, 1995) as overallpoverty levels increase during crises. We expect these consequences to depend onhousing and urban context. We formulated the following sub-question regardingcyclical economic trends:
RQ2: How do (changes in) patterns of low income residential moves differ betweenboom and bust periods, both preceding and following the onset of the globalfinancial crisis?
Amsterdam and Rotterdam represent two cities with rather different historicalpathways that have contributed to their different economic profiles. WhileAmsterdam represents a city that has successfully made the transition to a postindus-trial economy, Rotterdam is still struggling to leave its industrial legacy behind (Burgers& Musterd, 2002). Rotterdam’s housing market is considerably more relaxed than thetight and expensive situation in Amsterdam, and gentrification remains a more mar-ginal and scattered phenomenon in Rotterdam (Hochstenbach & Van Gent, 2015). As aresult, we would expect there to be more stability regarding low-income residents’moving patterns in Rotterdam, while changes are likely to be more prominent inAmsterdam. Yet, despite substantial differences regarding housing demand and prices,the housing tenure composition is roughly the same in both cities, with almost halfbelonging to the social rental stock. We address the differences between the cities withthe following sub-question:
RQ3: How do (changes in) patterns of low income residential moves differ between arelatively successful and a relatively struggling city?
In short, this paper aims to investigate how low-income residential moving patterns inurban space have changed over time—through different boom and bust periods—andhow these patterns and changes differ between structurally different cities.
Spatial dimensions to urban inequality
To gauge how and to what extent low-income residential moving patterns change overtime, it is imperative to situate these changes within broader debates regarding the
28 C. HOCHSTENBACH AND S. MUSTERD

economic structure and global connectedness of cities, as well as debates regardingshifting social–spatial urban inequalities.
It has been influentially argued that global economic restructuring has a profoundeffect on the socioeconomic population composition of major cities (Sassen, 1991). Asfinance and highly specialized service industries concentrate in these cities, so do theirhighly paid managers and workers. Concomitant to this shift, Sassen posits, is anincrease in the number of low skilled and low paid jobs, often in industries serving ahigher income clientele (e.g. domestic workers and jobs related to leisure and con-sumption). The outcome is a polarization of the social and economic structure of acity’s population, as both the high-end and low-end jobs increase. Alternatively,Hamnett (1994) has argued that the occupational structure of major cities is professio-nalizing rather than polarizing, which entails that these cities are becoming moremiddle class overall through a gradual replacement of the traditional working classesby an expanding middle class (Butler et al., 2008; Hamnett, 2003). Professionalization isan outcome of the shift toward a postindustrial society, which leads to many traditional(semiskilled or unskilled) working class occupations becoming less important or obso-lete, and contributes to the growth of middle class professions. Professionalization iscoupled with an overarching trend of replacement of one class by another, for examplefollowing the ageing of the traditional working classes.
Others have argued that this is a rather static perspective regarding class structuresand inequalities, equating a decline in traditional working class occupations to anoverall replacement of the working class by middle-class fractions (Davidson & Wyly,2012, 2015; Watt, 2008). The overall shift toward more middle-class occupations may,however, ignore the emergence of new inequalities and class oppositions. One trend isthe growth in precariously employed workers in sectors that are traditionally consideredmiddle class. Furthermore, new social–spatial dividing lines are being forged, forexample through the intergenerational transmission of wealth (Hochstenbach &Boterman, 2015). Recent evidence suggests that major cities such as Amsterdam arecurrently experiencing a trend toward greater socioeconomic polarization (Maloutas,2007; Musterd & Van Gent 2016; Van der Waal, 2010).
On top of these structure-related changes, the 2008 global financial crisis andhousing market downturn have had a disruptive impact on the housing trajectories ofmany population groups. Notably, the financial crisis and consequent institutionalreforms have made access to owner occupancy more uneven and restricted (Forrest& Hirayama, 2015), and the overall number of sales and sale prices have plummeted inthe postcrisis years (Ronald & Dol, 2011; Van der Heijden, Dol, & Oxley, 2011).Particularly for low-income households, those in a precarious employment situation,and younger age cohorts, access to homeownership has dwindled and rent burdens inrental sectors have increased. Yet, many of these trends toward increasing inequalitiesregarding housing position were already in place before the financial crisis set in andshould be seen as a consequence of the commodification and financialization of housingand real estate, and the flexibilization of employment (Dewilde & De Decker, 2016;Forrest & Hirayama, 2015).
Structural processes such as social polarization and professionalization, as well as thedisruptive impact of the global financial crisis, have a profound impact on the socio-economic composition of cities, and as such also have a spatial expression. A recent
URBAN GEOGRAPHY 29

study of various European capital cities shows that as inequalities are on the rise in the earlytwenty-first century, most cities are also showing growing segregation levels, further fueledby government retrenchment in specific domains and liberalization (Tammaru et al., 2016).Despite an overall positive correlation between socioeconomic disparities and social–spatialdivisions, the actual spatial outcomes differ between contexts. Increasing polarization andinequalities may also coexist with decreasing levels of segregation or social–spatial divisions(Hamnett, 2001; Maloutas, 2007). Through, among other things, neighborhood gentrifica-tion and the introduction of more expensive owner-occupied housing in previously lowstatus areas, actual segregation levels may (initially) decrease. This can create more fine-grained maps of class fractions and class inequalities. While this temporarily suppressesspatial divisions, it does exert a negative influence on housing options and affordability forlower income residents, for example through rent increases or the sale of social rentalhousing. It is to be expected that the relationship between socioeconomic and spatialdivisions is more robust in more liberal societal and housing contexts (Reardon &Bischoff, 2011), while stronger welfare state arrangements suppress spatial inequalities toa greater extent through a range of policies, including tenure mixing at low spatial scales(Musterd & Ostendorf, 1998).
Gentrification, displacement, and the suburbanization of poverty
One of the main ways through which socioeconomic inequalities are expressed in urbanspace is gentrification, even if this is not directly visible in greater social–spatial divisions.While individual neighborhoods may become or remain more mixed due to gentrifica-tion, the aggregate effects at a higher scale may instead be the opposite. As gentrificationhas morphed into a mainstream process that extends far from the urban core intoneighborhoods previously deemed unlikely candidates for gentrification (Hackworth &Smith, 2001), low-income residents are increasingly confined to, and concentrate in, thoseareas left untouched by such processes (Musterd & Van Gent 2016).
An important way in which gentrification contributes to deepening social–spatialdivisions is displacement. Yet, the extent to which displacement occurs as a conse-quence of gentrification has been subject to substantial academic debate in recent years.Proponents of the professionalization thesis argue that neighborhood gentrification isprimarily the result of class replacement, suggesting that displacement—though it maystill occur—is not the dominant phenomenon (Butler et al., 2008; Hamnett, 2003).Other academic debates have been primarily concerned with the distinction betweendirect and indirect forms of displacement. While gentrification may not necessarily leadto heightened levels of out migration among low-income households (a proxy fordisplacement) (Freeman & Braconi, 2004; Freeman, Cassola, & Cai, 2016), it does stillexclude low-income newcomers from moving in (Newman & Wyly, 2006; Slater, 2009).Low-income households may overcome affordability and accessibility barriers by takingon higher rent burdens or employing different coping strategies when moving in orderto find affordable housing, for instance, by doubling up with relatives, friends, or others(Wiemers, 2014) or by accepting precarious housing arrangements (Huisman, 2016).While this might lend access to neighborhoods that would otherwise be unattainable—for example due to gentrification—it could in turn be used as evidence for a lack of(exclusionary) displacement despite the potentially destabilizing impacts of precarious
30 C. HOCHSTENBACH AND S. MUSTERD

housing arrangements on housing and life course trajectories (cf. Davidson, 2009;Newman & Wyly, 2006).
In Rotterdam and Amsterdam, as a consequence of the large social rental stock,extensive tenant protection, and rent regulation (e.g. sitting residents’ rents can only beincreased incrementally and within limits set by the state), direct displacement is limited.On the other hand, indirect exclusionary displacement is relatively common due to thestate orchestrated sale and liberalization of social rental dwellings and steep priceincreases in the private rental and owner-occupied sectors (Van Gent, 2013). Whileinsiders enjoy security of tenure and are able to retain relatively low housing costs,outsiders face decreasing options and rising rent burdens (Kadi & Musterd, 2015).
The outward expansion of gentrification away from the inner city into other neighbor-hoods may be accompanied by parallel outward shifts of poverty into the suburbs of theurban periphery. The suburbanization of poverty (Cooke & Denton, 2015; Hulchanski,2010; Randolph & Holloway, 2005; Randolph & Tice, 2014) represents a significant breakfrom previous periods, where poverty was first and foremost an inner city feature andreflects the growing cleavage between a gentrifying urban core and a disadvantaged“filtering” periphery (Hedin et al., 2012; Skaburskis & Nelson, 2014). These shifts aregenerally gradual and take place over a longer period of time, as many areas are alsomarked by high levels of stability (Zwiers, Kleinhans, & Van Ham, 2016b) due to non-moving residents and selective mobility patterns that tend to reproduce neighborhoodstatus (Hedman, Van Ham, & Manley, 2011; Musterd, Van Gent, Das, & Latten, 2016).Yet when looking specifically at low-income residents’ moves, we expect a starker picturebecause here issues of affordability and accessibility are at the forefront.
Welfare state restructuring, housing liberalization, and state-ledgentrification
Welfare state arrangements exert a considerable influence on residential mobility patterns,particularly through housing. Housing policies concerning tenure mix, access to home-ownership, and acceptable rent levels can play a key role in determining the magnitude ofsocial–spatial divisions. Strong welfare regimes like that of the Netherlands have typicallyinvested heavily in housing policies to reduce the socioeconomic disparities produced bymarket forces and to minimize social–spatial divisions through the provision of regulatedsocial rental housing (Musterd & Ostendorf, 1998). Yet, in many contexts, such policieshave in the last few decades made way for policies promoting homeownership as part of anideological project privileging private property and private accumulation (Aalbers &Christophers, 2014; Forrest & Hirayama, 2015; Ronald, 2008). This has enabled a growingnumber of households, including those on a lower income, to buy. However, strong statesupport, financial subsidies for homeownership (e.g. mortgage tax deductibility), andexpanding mortgage credit all contributed to house prices increasing sharply. As a con-sequence, access to owner occupancy once again became increasingly confined to finan-cially well-off and secure households able to overcome the barrier of high prices (Forrest &Hirayama, 2015). The global financial crisis and the subsequent response to tightenmortgage lending criteria have amplified this trend. Less privileged households are increas-ingly unable to enter an owner-occupied sector that has vastly expanded over the pastdecades, while the social rental sector has declined due to these same policies.
URBAN GEOGRAPHY 31

The dominant logic of promoting homeownership has, in many contexts, notableurban dimensions. Cities are the sites where house price increases have generally beensteepest and affordable rental housing has disappeared at the fastest rate. In Westernurban contexts, the ideology of homeownership materializes particularly in urban policiesthat expand homeownership to alter the population composition in an attempt toimprove the livability, safety, manageability, and overall quality of neighborhoods(Uitermark, 2003). These policies are built on the assumption that homeownershipcreates responsible citizens, or at the very least leads to manageable neighborhoods bydissolving urban problems. Because these housing policies work toward creating moremiddle-class neighborhoods, gentrification is essentially their intended spatial outcome(Uitermark, Duyvendak, & Kleinhans, 2007). Through tenure conversions from rent toowner occupation and large urban renewal projects, such policies also result in a directloss of affordable social rental housing. Although state-led gentrification commonlyincludes a range of policies that focus on, among other things, policing, public space,and commercial property (Atkinson, 2003; Uitermark et al., 2007; Zukin et al., 2009),housing policies are a core component because they influence the population compositionin the most direct way. This is always an integral part of state-led gentrification, whetherit is to manage and control neighborhoods (Uitermark et al., 2007) or to attract capitalinvestment and the middle classes (Hackworth & Smith, 2001; Peck, 2005; Smith, 2002)as part of more entrepreneurial state strategies (Harvey, 1989; Peck & Tickell, 2002).
Data and methods
This paper focuses on (changing) patterns of low-income moves and economic boom–bust patterns in two structurally different cities. We use long-term secondary data onboth cities’ housing markets in combination with highly detailed longitudinal registerdata from the Social Statistics Database (provided by Statistics Netherlands). Registerdata allow us to define different low-income groups in a very precise way and tomonitor their moving patterns for the 2004–2013 period. We define a move as a changein address that takes place during a given year and we focus on the post-movedestination as of the 1 January of the following year.1 Although we investigated allindividual years, we focus specifically on the neighborhood outcomes for 2004, 2008,and 2013, which are, respectively, the earliest time point in our data, the last precrisisyear with peaking house prices, and the most recent time point, still a crisis year.
In our study, we distinguish between three types of low-income households:unemployed households, working poor households, and low-to-middle incomehouseholds. Because a household may consist of employed and unemployed mem-bers, we define household employment status on the basis of the most importantsource of income (in Euros). We term employed households with a total grossannual income below €19,095 as “working poor” and those with an income between€19,095 and €34,085 as “low-to-middle income”.2 We use gross income and thesespecific classifications to reflect existing policies: the €34,085 threshold correspondsto the maximum income for eligibility for social rental housing.3 The €19,095threshold corresponds to 110% of the minimum wage for full-time employment.4
We only include the population aged 25–65, in order to focus on the working agepopulation (thus excluding retired households and young people whose income may
32 C. HOCHSTENBACH AND S. MUSTERD

not reflect their socioeconomic status). Households are only included when the oldestmember falls within this age bracket and is not a student. Because household composi-tion changes over time, we define a household as moving when at least one of itsworking age members has moved. Institutional households and households moving toan address where more than 10 households are registered are excluded, as these groupsgenerally reflect special household types.
Regarding the destination area, we focus on Amsterdam, Rotterdam, and both citiesurban regions. We construe a broad typology based on the geographical distinctionbetween the urban center, the urban periphery, and the surrounding region. ForAmsterdam, the border between central and peripheral neighborhoods roughly corre-sponds to the city’s ring road and IJ river. In Rotterdam, the central neighborhoods aremostly bounded by the New Meuse river (although parts of the south bank are alsoincluded), the ring motorway to the north and east, and the municipal border to thewest. For both cities, the municipal border marks the distinction between the urbanperiphery and the surrounding region. This broad definition suffices to chart generalshifts in low-income households’ moving patterns.
The center–periphery divide closely approximates an upgrading–downgradingdivide in both cities, as most gentrification neighborhoods can be found in the cities’inner rings (Hochstenbach & Van Gent, 2015). Such a crude typology will, however,necessarily obscure more fine-grained spatial variations. Therefore, this paper alsomaps the (percentage point) changes in moving patterns between 2004 and 2013.5 Wecalculate per year the share of moving6 households belonging to one of the threeabovementioned low-income groups. We also investigate the tenure outcomes of thedifferent low-income groups per neighborhood type. We not only distinguish betweensocial rent, private rent, and owner occupancy, but also use “home sharing” as anadditional category, which entails multiple households registered at one address.Although this is not a form of tenure in itself—sharing occurs in all tenures—wesuggest that identifying sharing as a coping strategy provides greater insight thanmeasuring the underlying tenure. Due to data availability, we can only investigatetenure outcomes for the most recent years; we therefore focus on the tenure outcomesfor 2013. In both cities, for about 6% of the addresses, no information on tenure isavailable, and this percentage is higher in inner city neighborhoods where the olderhousing stock is less well registered (around 10%).
Results
Urban housing policies and boom–bust patterns
It is important to situate low-income households’ moving patterns within their specificurban and regional housing contexts. Both Amsterdam and Rotterdam are currentlyfocusing on expanding homeownership, a policy focus that has gained traction since themid-1990s and that stands in sharp contrast to both cities’ longstanding legacy of providingaffordable social rental housing (Aalbers, 2004; Uitermark, 2009). The expansion of home-ownership is integral tomunicipal gentrification strategies as an attempt to attract and keephold of middle and higher income residents (Doucet, 2013; Van den Berg, 2012; Van Gent,2013) and has led to a substantial change in tenure composition.7 At the turn of the century,
URBAN GEOGRAPHY 33

owner occupancy made up 15% of the Amsterdam housing stock, while by 2013, this sharehad increased to 28% (Table 1). During the same period, homeownership increased from22% to 35% in Rotterdam. On the other hand, the social rental sector in both cities hasgradually decreased in size through tenure conversions and urban renewal projects whererental dwellings are demolished to make way for owner-occupied dwellings. The size of thesocial rental sector is being reduced in order to cut spending, but it also serves as a strategyto change the population mix of specific neighborhoods. Since access to social housing islimited to lower income residents, conversion to free market housing is considered aprerequisite to align the housing stock with the actual as well as desired middle-classpopulation (Van Gent, 2013).
Despite these trends, social rental housing remains the largest tenure in both cities(Table 1). Yet, the decreasing accessibility of this form of tenure may be better judged bylooking at allocations by housing associations. In Amsterdam, the number of social housingallocations via the official allocation system decreased by more than 36% between 2007 and2014 (Hochstenbach, 2016)8 as a consequence of social housing sales, rent liberalization,and tenants staying put. Looking at spatial patterns and trends, we see that in bothAmsterdam and Rotterdam, the share of social rental dwellings has decreased in bothcentral and peripheral areas. This reflects governmental strategies to facilitate gentrificationprocesses through tenure conversions in central neighborhoods in order to accommodatethe new middle classes, as well as the simultaneous aim of establishing a new social mix indisadvantaged neighborhoods through urban restructuring (Teernstra, 2015; Uitermark &Bosker, 2014). Table 1 only covers both cities. When looking at the surroundingAmsterdam region, the owner-occupied sector represents 57% of the regional stock (in2013), while social rental and private rental housing makes up 30% and 13%, respectively.
Table 1. Tenure composition of Amsterdam and Rotterdam 2000–2013.City Area Year Social rental Private rental Owner occupied
Amsterdam Total 2000 54.4 30.7 14.82004 53.4 26.9 19.72008 50.2 23.9 25.92013 46.2 25.6 28.1
Central 2000 45.4 41.4 13.22004 45.1 36.5 18.72008 42.8 32.4 24.82013 39.9 33.3 26.9
Peripheral 2000 69.4 13.2 17.42004 68.3 11.0 21.32008 62.6 9.9 27.52013 56.6 13.4 30.0
Rotterdam Total 2000 57.3 21.2 21.52004 54.6 20.8 24.62008 49.9 18.9 31.12013 46.9 18.5 34.7
Central 2000 57.8 26.8 15.42004 55.1 26.5 18.42008 51.1 23.6 25.32013 48.3 23.7 27.9
Peripheral 2000 57.2 17.8 25.02004 54.3 17.4 28.32008 49.1 16.2 34.62013 46.6 15.2 38.2
Source: Data provided by OIS Amsterdam and OBI Rotterdam; own adaptation, available upon request.
34 C. HOCHSTENBACH AND S. MUSTERD

In the region surrounding Rotterdam, the share of owner-occupied dwellings stands at55%, with social and private rent at 35% and 10%, respectively (CBS 2013). Social rent thusremains a relatively large share of the housing stock in both cities when compared to thesurrounding regions, but liberalization trends are strong in both urban contexts.
Amsterdam housing associations sold a total of 23,824 dwellings between 1998, when theystarted selling, and 2015. After a slow start, yearly sales increased substantially during thisperiod, reaching a peak in 2014 with a total of 2,682 sales. These sales increasingly concentratein Amsterdam’s central neighborhoods, accelerating gentrification in already burgeoningareas (Hochstenbach, 2016). In Rotterdam, the sale of social housing dwellings has followed asomewhat different trend, as it stood at around 1,400 sales per year during the precrisis years,but since the crisis the number of sales has decreased in line with an overall stagnation inhousing sales to around 1,000 social housing sales during 2013 (Pellenbarg, Tillema,Brugman, & Van Marwijk, 2014). In addition, in both cities, especially since the crisis,housing associations and local states have turned to rent liberalization, which entails formerlyrent-regulated social rental dwellings being moved into the free market sector in an attemptto expand the housing opportunities of middle income groups and upwardly mobile younghouseholds.
As an increasing share of both cities’ housing stock is being commodified, thehousing stock in general becomes more susceptible to economic patterns of boomand bust. Figure 1 charts the longer term average sale prices in Amsterdam andRotterdam, showing remarkable boom–bust patterns in Amsterdam and more stability
Q3 2016:
€249593
Q3 2016:
€376166
Q3 2016:
€207935
0
50000
100000
150000
200000
250000
300000
350000
400000
19
95
19
96
19
97
19
98
19
99
20
00
20
01
20
02
20
03
20
04
20
05
20
06
20
07
20
08
20
09
20
10
20
11
20
12
20
13
20
14
20
15
20
16
Av
era
ge
pric
e i
n E
uro
s
The Netherlands
Amsterdam
Rotterdam
Figure 1. Average sale price of dwellings per quarter 1995–2016 (up to third quarter of 2016) inAmsterdam, Rotterdam (cities), and the Netherlands. Source: Statistics Netherlands, CBS Statline(2016); own adaptation.
URBAN GEOGRAPHY 35

in Rotterdam. Between 2004 and 2008, average sale prices rose by 33% in Amsterdam,from €237,000 to a high of €314,000. During the same period, average sale prices inRotterdam increased some 20%, from €160,000 to €193,000. Price increases during thisperiod were the product of relatively favorable mortgage lending conditions, includinghigh loan-to-value ratios and low interest rates, and the structural tax deductibility ofmortgage interest as part of a wider governmental strategy to push homeownership (seeAalbers, 2011). High prices in Amsterdam reflect the city’s increasingly tight housingcontext due to considerable population growth, and demand from middle classesmoving to the city for employment or remaining after graduation (Boterman,Karsten, & Musterd, 2010). Yet, in the wake of the global financial crisis, house pricesdropped steeply: by 18% in Amsterdam and 14% in Rotterdam between the firstquarters of 2008 and 2013, though they have subsequently increased again.
It is important to consider the extent to which housing sales and sale prices influence theresidential moving patterns of low-income households. Particularly in central Amsterdam,prices are generally high, thus pricing out low and middle income residents from the owner-occupied sector. Yet, it should also be taken into consideration that in both cities, large groupsof lower income residents cannot andwill not enter homeownership, also due to the existenceof a large social rental stock in urban areas. In postcrisis times, price drops may enable somehouseholds to buy, but the dominant development is that decreasing sales andmore restrictedmortgage lending practices that privilege “prime” households (see Forrest &Hirayama, 2015)are reducing postcrisis access to homeownership.
Changing population compositions
So how have low-income households’ residential moving patterns changed during thepre- and postcrisis periods in Amsterdam and Rotterdam? Before turning to residentialmoves, Table 2 shows the three different low-income categories as a percentage of thetotal population living in the central city, urban periphery, and surrounding region. Thetable shows that both cities host a larger percentage of low-income households than theregions, although this percentage decreased between 2004 and 2013—with only workingpoor households increasing their share. In contrast, the shares of all low-incomecategories increased in the cities’ surrounding regions.
Differences between Amsterdam and Rotterdam, and differences between the citiesand their regions, can be linked to the occupational structure of the local populations.Not only are unemployment levels structurally higher in Rotterdam, but a larger shareof the employed population is active in lower skilled sectors (CBS, 2015).9 These arespecifically the sectors where employees have been most hit by the crisis: during the2008–2013 period, the number of residents in lower skilled jobs decreased by roughly15,000 in Rotterdam (25,000 in the surrounding Rotterdam region) and by 7,000 inAmsterdam (and 19,000 in the surrounding Amsterdam region). In contrast, in bothcities, the number of residents in high skilled jobs is high and grew consistently duringthe 2004–2013 period despite the crisis, although this occurred at a faster rate inAmsterdam. These general employment data highlight how Amsterdam’s occupationalstructure is to a larger extent professionalized and continues to professionalize andgrow, while Rotterdam has been hit by the decreasing demand for lower skilled jobs,which contributes to greater increases in unemployment.
36 C. HOCHSTENBACH AND S. MUSTERD

Low-income households’ changing moving patterns
Changes become most visible when we shift our focus toward residential moves, whenhouseholds are directly faced with housing constraints. At this point, it is important tonote that while these figures show the share of different low-income groups among thetotal number of movers, increasing or decreasing shares are in almost all cases matchedby similar increases or decreases in absolute numbers. Figure 2 shows what percentageof all movers to or within different destination areas (central Amsterdam, peripheralAmsterdam, and surrounding region) belongs to any of the low-income householdcategories. This is done per year for the 2004–2013 period.10 All shares and percentagesdiscussed in this section thus pertain to the share of low-income households amongmovers to or within the different areas of destination.
In a general sense, these data highlight the importance of analyzing these differentlow-income groups separately, rather than as one broad low-income category. It showsthat working poor households (earning less than 110% of the minimum full-time wage)mainly move to/within the city, as opposed to the region. In the precrisis period, theirshare among movers slightly decreased in central Amsterdam, contrasting trends in theurban periphery and surrounding region where this share slightly increased. After theonset of the crisis, however, the share of working poor residents among moversincreased in all areas, though most substantially in the urban periphery (from 6.4% in2008 to 10.6% in 2013). Notably, also in central Amsterdam, their share increasedduring the postcrisis period (from 7.6% to 10%). It should be taken into account thatthe working poor is a rather diverse group, encompassing those who are structurallylow paid as well as self-employed people and recent labor market entrants. The financialcrisis and related austerity measures have contributed to an increase in persons intemporary and precarious employment, particularly among younger cohorts (Aassve,Cottini, & Vitali, 2013).
Table 2. The three low-income population groups as percentage of the total population (and theiraggregated total share) per area for 2004 and 2013 and percentage point change.Area Year Working poor Low-to-middle Unemployed Total low
Central Amsterdam 2004 7.0 12.4 15.8 35.22013 7.9 11.0 13.5 32.4Change (pp) +0.9 −1.4 −2.3 −2.7
Peripheral Amsterdam 2004 3.7 11.0 18.1 32.82013 5.5 11.0 17.2 33.7Change (pp) +1.8 −0.1 −0.9 +0.9
Surrounding Amsterdam region 2004 2.2 7.0 6.5 15.72013 3.1 7.7 7.1 18.0Change (pp) +0.9 +0.8 +0.5 +2.2
Central Rotterdam 2004 4.4 12.4 22.1 38.92013 5.8 11.1 19.9 36.7Change (pp) +1.4 −1.3 −2.2 −2.1
Peripheral Rotterdam 2004 2.6 10.0 17.5 30.12013 3.8 10.2 17.3 31.4Change (pp) +1.2 +0.3 −0.2 +1.3
Surrounding Rotterdam region 2004 1.9 6.9 7.8 16.62013 2.6 7.7 8.5 18.9Change (pp) +0.7 +0.8 +0.8 +2.3
Data: Social Statistics Database, own adaptation.
URBAN GEOGRAPHY 37

The other low-income working households—those earning more than 110% of theminimum full-time wage, but less than the social rental cap—show different movingpatterns. In the boom period, their share among movers decreased most substantially incentral Amsterdam (from 13.3% to 11.4%) and also decreased somewhat in the per-iphery (from 13.5% to 12.9%). In contrast, already during the boom period, their shareamong movers increased in the region—although this increase accelerated after thebeginning of the crisis—while remaining relatively stable in the city’s central andperipheral neighborhoods. Consequently, as of 2013, the share of low-to-middle incomeemployed households among movers is higher in the surrounding region than incentral Amsterdam.
The share of unemployed households among movers is by far the largest for theurban periphery, reaching 16.6% in 2005. Yet, also due to large scale restructuring, therewas a steep decrease in unemployed households in the periphery during the boomperiod, as well as in the first 2 years after the financial crisis began. Interestingly, duringthe bust period, the share of unemployed households among movers showed a strongincrease in the region, and from 2009 also in the urban periphery. In contrast to cyclicaltrends, their share among movers more or less stabilized in central Amsterdam, beforeagain decreasing between 2012 and 2013.
Overall, these data highlight a gradual shift of poverty away from the city, particularly thecenter, toward the regions. An overarching suburbanization of poverty comes to the fore,which is progressing despite being influenced by boom–bust rhythms. In central Amsterdam,
0
2
4
6
8
10
12
14
16
18
20
22
20
04
20
05
20
06
20
07
20
08
20
09
20
10
20
11
20
12
20
13
20
04
20
05
20
06
20
07
20
08
20
09
20
10
20
11
20
12
20
13
20
04
20
05
20
06
20
07
20
08
20
09
20
10
20
11
20
12
20
13
Working poor Low-to-middle Unemployed
Central Amsterdam Peripheral Amsterdam
Surrounding urban region Total Amsterdam + region
Figure 2. Share of low-income residents as percentage of total movers per destination area2004–2013 in the Amsterdam region. Source: Social Statistics Database, own adaptation.
38 C. HOCHSTENBACH AND S. MUSTERD

the share of all low-income categories among movers decreased during the precrisis boomperiod. Particularly, the number of unemployed households moving to central Amsterdamdecreased, likely due to the diminishing accessibility and availability of social rental housing.The subsequent economic downturn did not lead to a postcrisis increase in lower incomehouseholds, except for the growing group of working poor households. The suburbanizingtrend itself is multi-faceted, with the region experiencing the strongest relative increase inlow-income households. Furthermore, already in precrisis times, the region experiencedincreases in working poor and low-to-middle income households moving in, while thedecrease in unemployed movers was below average. In contrast, Amsterdam’s urban periph-ery showsmore variegated patterns, depending on the time period and particular low-incomegroup. Interestingly, the share of moving low-to-middle income households increasedespecially in the urban region, while in the urban periphery, the share of working poorhouseholds grew disproportionally, signaling a different residential orientation among thesedifferent groups.
In Rotterdam, we see similar patterns regarding the direction of changes, althoughthey are not as marked as in Amsterdam (Figure 3). Here, the share of working poorhouseholds among the total number of movers stayed relatively stable during the precrisisperiod, before increasing for all areas after the crisis began: in central Rotterdam, thisshare increased from 6.5% in 2008 to 8.6% in 2013. In the other areas, the percentagepoint increases were more or less similar. Consequently, throughout the 2004–2013period, the share of working poor households remained highest in central Rotterdam.Regarding the other low-to-middle income households, there was a slight move awayfrom central Rotterdam, which mainly occurred during the precrisis boom period andremained stable throughout the postcrisis period. In 2013, the share of low-to-middleincome households moving to central Rotterdam dropped below the regional average.The biggest increase of low-to-middle income households was in the region, from 10.7%in 2004 to 12.3% in 2013, bringing it up to almost match the share among movers to orwithin the central city. Interestingly, this increase mainly occurred during the postcrisisbust period, contrasting a trend of relative stability during the precrisis period. Inperipheral Rotterdam, the share of lower income employed households moving thereremained rather stable over time, with boom and bust trends more or less cancelling eachother out. As a consequence, already during the boom period, the share of low-to-middleincome households among movers in Rotterdam’s peripheral neighborhoods surpassedthe share in the central city due to decreases in the center.
The share of unemployed residents among movers is structurally higher inRotterdam and its surrounding region than in Amsterdam. While this share quicklydecreased during the precrisis boom, the postcrisis years saw a return to 2004 levels,although variation between areas exists: the region experienced an increase between2004 and 2013 from 9.4% to 11.9%, while the central city saw an overall decreasefrom 16.4% to 15.4%. These different trajectories mainly formed during the boomperiod, when unemployment shares decreased most substantially in the central city(−4.7 percentage points between 2004 and 2008) and least in the region (−1.3). Inthe postcrisis period, all three areas show highly similar increases of 3.7–3.9 percen-tage points. This suggests that the precrisis upgrading patterns in the central cityhave not been as robust as in Amsterdam and are to a greater extent subject tocyclical trends.
URBAN GEOGRAPHY 39

Generally speaking, for both Amsterdam and Rotterdam, these analyses highlight asuburbanization of poverty toward the surrounding regions. Compared to the totalpopulation, the low-income groups are overrepresented among movers to/within theregion for the 2004–2013 period, and increasingly so (compare Figures 2 and 3 withTable 2).11 Both cities’ surrounding regions still host relatively few low-incomeresidents, with a large body of non-moving middle-class residents obscuring theemerging patterns of change. The share of unemployed residents among movers inparticular has remained relatively low among the total population of both regions buthas been relatively high among movers.
Mapping changing patterns
These trends have been mapped onto both urban regions to further highlight spatialvariations and nuances between postcode tracts (Figure 4a–f). For each of the threelow-income groups, these maps compare their share among movers in 2013 withtheir share among movers in 2004—showing percentage point changes. The mapsilluminate how patterns of change differ across neighborhoods, but most specificallyhow they differ between working poor, low-to-middle income, and unemployedhouseholds. By comparing 2004 and 2013, these maps combine precrisis and post-crisis trends.
0
2
4
6
8
10
12
14
16
18
20
22
20
04
20
05
20
06
20
07
20
08
20
09
20
10
20
11
20
12
20
13
20
04
20
05
20
06
20
07
20
08
20
09
20
10
20
11
20
12
20
13
20
04
20
05
20
06
20
07
20
08
20
09
20
10
20
11
20
12
20
13
Working poor Low-to-middle Unemployed
Central Rotterdam Peripheral Rotterdam
Surrounding urban region Total Rotterdam + region
Figure 3. Share of low-income residents as percentage of total movers per destination area2004–2013 in the Rotterdam region. Source: Social Statistics Database, own adaptation.
40 C. HOCHSTENBACH AND S. MUSTERD

a
b
Figure 4. (a–f) Percentage point (pp) change in the share of working poor (a and d), low-to-middle(b and e), and unemployed (c and f) households among (in-)movers per postcode tract between2004 and 2013. Data: Social Statistics Database, own adaptation; base map: IRIS international.
URBAN GEOGRAPHY 41

c
d
Figure 4. (Continued).
42 C. HOCHSTENBACH AND S. MUSTERD

e
f
Figure 4. (Continued).
URBAN GEOGRAPHY 43

For the Amsterdam urban region, it clearly shows that in all tracts in the urbanperiphery, the share of working poor households among movers increased(Figure 4a). In addition, in the inner-ring neighborhoods various tracts also saw anincrease, particularly in the (often gentrifying) nineteenth and early-twentieth centurybelts surrounding the city center. Even in the region, the share of working poorhouseholds among movers increased for most tracts, although often at a slower paceand mostly in higher density satellite towns such as Almere, Zaandam, andHaarlemmermeer. In contrast, the share of low-to-middle income householdsamong the movers decreased in most tracts in Amsterdam’s central city, with trendsin the urban periphery variegated across different tracts (Figure 4b). While increasesalso occurred in the satellite towns, there was a more general increase in the region,including lower density suburban tracts and Amstelveen, a relatively middle-class citybordering Amsterdam. The starkest shifts were, however, among the unemployedhouseholds (Figure 4c), as their share among movers decreased across Amsterdam,barring some exceptions. Instead, particularly the new town of Almere, as well asPurmerend and Wormerland, has seen a strong increase in unemployed householdsamong movers. While such satellite towns were for a long time typical (lower)middle-class milieus, these maps show that they are increasingly catering to differentlow-income groups.
In the Rotterdam region, the working poor can be seen as strongly urbanized:Figure 4d shows that the actual number of working poor households moving to tractsoutside the city was often very low (<10 per year). An exception is Schiedam, a citydirectly bordering Rotterdam to the west that saw substantial increases in working poorresidents, especially in prewar neighborhoods with a large percentage of often low-quality private rental dwellings. Within Rotterdam, increases generally concentrated inneighborhoods in the west (Delfshaven), where the housing stock is dominated bycheap rental dwellings. Strong increases were also found in low status neighborhoodson the city’s south bank, particularly in those neighborhoods where the controversial“Rotterdam Act” has been in force since 2006. This act forbids unemployed newcomersfrom settling in these neighborhoods. Consequently, the cheap rental stock mainlyattracts households that are employed but have a (very) low income. Regarding themoving patterns of low-to-middle income households, we can see generally decreasingshares among movers in Rotterdam’s central city and gentrification hotspots(Katendrecht), as well as its higher status peripheral tracts (Hillegersberg). Increasescan be found in filtering peripheral tracts of the city (e.g. Prins Alexander) andbordering higher density areas (e.g. Capelle aan den IJssel). For unemployed house-holds, we see similar patterns, with the strongest increases in Prins Alexander as well asin tracts in the surrounding region (e.g. Hellevoetsluis, Lansingerland).
Direct and indirect suburbanization of poverty
To gain a better grip on the overarching trend of poverty suburbanization, and how itcomes about, it is imperative to look at where these moves originated from. Table 3shows the percentage point change in the share of the different low-income householdtypes among movers between 2004 and 2013, differentiating according to area of origin(i.e. address in the previous year). For Amsterdam, we find a clear direct
44 C. HOCHSTENBACH AND S. MUSTERD
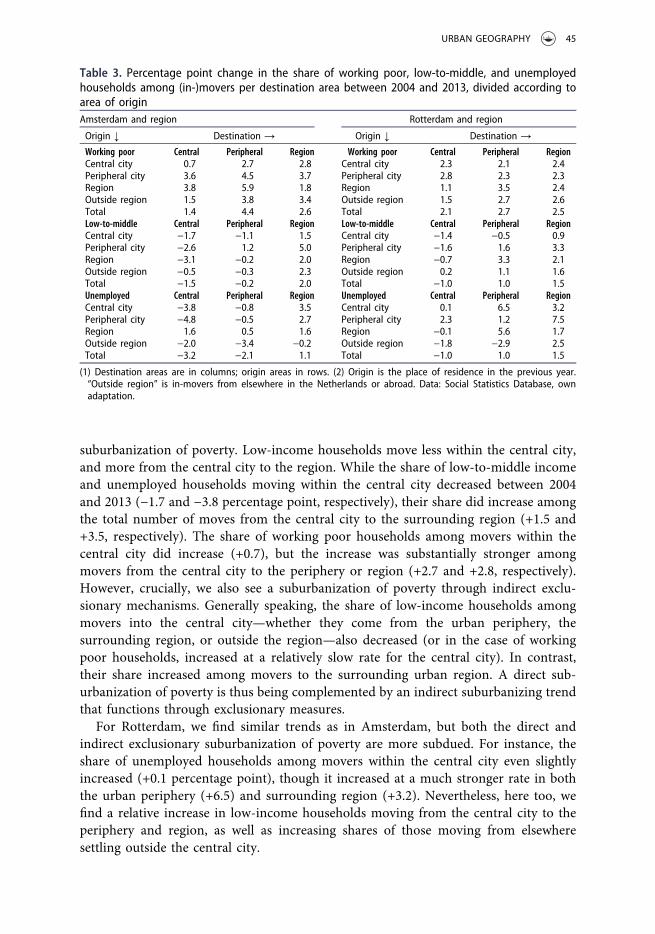
suburbanization of poverty. Low-income households move less within the central city,and more from the central city to the region. While the share of low-to-middle incomeand unemployed households moving within the central city decreased between 2004and 2013 (−1.7 and −3.8 percentage point, respectively), their share did increase amongthe total number of moves from the central city to the surrounding region (+1.5 and+3.5, respectively). The share of working poor households among movers within thecentral city did increase (+0.7), but the increase was substantially stronger amongmovers from the central city to the periphery or region (+2.7 and +2.8, respectively).However, crucially, we also see a suburbanization of poverty through indirect exclu-sionary mechanisms. Generally speaking, the share of low-income households amongmovers into the central city—whether they come from the urban periphery, thesurrounding region, or outside the region—also decreased (or in the case of workingpoor households, increased at a relatively slow rate for the central city). In contrast,their share increased among movers to the surrounding urban region. A direct sub-urbanization of poverty is thus being complemented by an indirect suburbanizing trendthat functions through exclusionary measures.
For Rotterdam, we find similar trends as in Amsterdam, but both the direct andindirect exclusionary suburbanization of poverty are more subdued. For instance, theshare of unemployed households among movers within the central city even slightlyincreased (+0.1 percentage point), though it increased at a much stronger rate in boththe urban periphery (+6.5) and surrounding region (+3.2). Nevertheless, here too, wefind a relative increase in low-income households moving from the central city to theperiphery and region, as well as increasing shares of those moving from elsewheresettling outside the central city.
Table 3. Percentage point change in the share of working poor, low-to-middle, and unemployedhouseholds among (in-)movers per destination area between 2004 and 2013, divided according toarea of originAmsterdam and region Rotterdam and region
Origin ↓ Destination → Origin ↓ Destination →
Working poor Central Peripheral Region Working poor Central Peripheral RegionCentral city 0.7 2.7 2.8 Central city 2.3 2.1 2.4Peripheral city 3.6 4.5 3.7 Peripheral city 2.8 2.3 2.3Region 3.8 5.9 1.8 Region 1.1 3.5 2.4Outside region 1.5 3.8 3.4 Outside region 1.5 2.7 2.6Total 1.4 4.4 2.6 Total 2.1 2.7 2.5Low-to-middle Central Peripheral Region Low-to-middle Central Peripheral RegionCentral city −1.7 −1.1 1.5 Central city −1.4 −0.5 0.9Peripheral city −2.6 1.2 5.0 Peripheral city −1.6 1.6 3.3Region −3.1 −0.2 2.0 Region −0.7 3.3 2.1Outside region −0.5 −0.3 2.3 Outside region 0.2 1.1 1.6Total −1.5 −0.2 2.0 Total −1.0 1.0 1.5Unemployed Central Peripheral Region Unemployed Central Peripheral RegionCentral city −3.8 −0.8 3.5 Central city 0.1 6.5 3.2Peripheral city −4.8 −0.5 2.7 Peripheral city 2.3 1.2 7.5Region 1.6 0.5 1.6 Region −0.1 5.6 1.7Outside region −2.0 −3.4 −0.2 Outside region −1.8 −2.9 2.5Total −3.2 −2.1 1.1 Total −1.0 1.0 1.5
(1) Destination areas are in columns; origin areas in rows. (2) Origin is the place of residence in the previous year.“Outside region” is in-movers from elsewhere in the Netherlands or abroad. Data: Social Statistics Database, ownadaptation.
URBAN GEOGRAPHY 45

Housing outcomes
Despite clear overall trends of a suburbanization of poverty and the decreasing acces-sibility and affordability of inner city environments, the findings also highlight impor-tant differences regarding the moving patterns of the three different low-income groups,for example regarding destination housing tenure (Figure 5). Tenure mixing and theprovision of social housing can lend an important counterweight to the structural andcyclical trends that are impacting housing affordability and can sustain housing acces-sibility for lower incomes despite gentrification. Tenure outcomes are the result of thespatially variegated housing market structure but also reflect households’ housingposition, opportunities, preferences, and constraints.
In both cities, but more so in Amsterdam, working poor households move compara-tively more often to dwellings that they share with at least one other household. For theAmsterdam periphery, this is as high as 61%. This is likely the consequence of copingstrategies that allow such households to find housing and also forms a tentativeexplanation as to why a relatively large share of working poor households is able tomove into gentrifying inner city neighborhoods. A considerable portion of the low-to-middle income households is moving into owner occupation—although this share isrelatively low in central Amsterdam (9%), reflecting generally high house prices. Themore affordable owner-occupied stock in Amsterdam’s surrounding region and inRotterdam overall continues to offer a larger group of low-to-middle income house-holds the opportunity to buy. Unemployed households generally depend on socialrental housing and only very rarely move into homeownership (2% or 3% per area).The fact that they are heavily overrepresented in the social rental sector indicates that
6 510 9
13
20
2 2 36
10 1116 18 19
23 2
20 22
2725
31
35 71 7266
26
31
36
36
40
46
71
75 7527
12
1928
14
18
114
7
25
26
22
22
23
187
10 9
47
61
44
3742
26
1622 23
43
32 3126
19 1720
12 14
0%
10%
20%
30%
40%
50%
60%
70%
80%
90%
100%
Ce
ntra
l
Pe
rip
he
ra
l
Re
gio
n
Ce
ntra
l
Pe
rip
he
ra
l
Re
gio
n
Ce
ntra
l
Pe
rip
he
ra
l
Re
gio
n
Ce
ntra
l
Pe
rip
he
ra
l
Re
gio
n
Ce
ntra
l
Pe
rip
he
ra
l
Re
gio
n
Ce
ntra
l
Pe
rip
he
ra
l
Re
gio
n
Working poor Low-to-middle Unemployed Working poor Low-to-middle Unemployed
Amsterdam Rotterdam
Owner occupied Social rental Private rental Home sharing
Figure 5. Tenure outcomes per low-income group per area in Amsterdam and Rotterdam, in 2013.Data: Social Statistics Database, own adaptation.
46 C. HOCHSTENBACH AND S. MUSTERD

these households may generally be in a more structurally low-income position com-pared to the other groups that may be more socially mobile.
Although these data do not give insight into preferences, they do generally point tothe importance of social rental housing in allowing low-income households to continueto move to areas that would otherwise be unaffordable. Sharing as a coping strategy toovercome issues of affordability and accessibility also plays an important role infacilitating low-income households’ access to housing and neighborhoods. Long averagewaiting times for social rental housing in Amsterdam (over nine years, but longer inpopular areas) make such coping strategies important for outsiders (cf. Kadi & Musterd,2015). Comparing the two cities, it is interesting to note that a larger share of low-income households moves into owner occupancy or social rental housing in Rotterdam.This reflects Rotterdam’s lower house prices in the owner-occupied sector and shorterwaiting times for social rental housing (average 3.5 years).
Discussion and conclusion
Many major cities across Europe and other contexts are being marked by growingsocial–spatial inequalities as a consequence of, among other things, economic restruc-turing, policies of housing commodification, and governmental strategies pushinggentrification. The onset of the global financial crisis and related austerity measureshave further amplified already existing trends toward greater inequalities (Tammaruet al., 2016). This paper investigated a key aspect of changing social–spatial inequalities,namely the residential moving patterns of low-income households, focusing specificallyon gentrification and the suburbanization of poverty. It is important to note that ourfindings do not point to one uniform trend in both cities and in both precrisis andpostcrisis times, nor is there one uniform trend for the different types of low-incomehouseholds. This conclusion will therefore not answer the main research questions onmoving patterns (RQ1), boom–bust differences (RQ2), and between-city differences(RQ3) separately but will rather integrate the answers into a cohesive overview.
Gentrification and the suburbanization of poverty in many ways represent a long-term reversal of fortunes for inner city areas, and these patterns have survived severaleconomic boom and bust cycles. Although this paper only investigated one boom andone bust period, it may be expected that as housing is liberalized and social rentaldwellings converted into owner occupancy, the impacts of financial crises and housingmarket fluctuations will become greater. It is important to consider the changing role ofurban politics in relation to these housing market shifts. As more market-orientedurban policies are rolled out, not least state-led gentrification (Peck & Tickell, 2002;Smith, 2002), older policies aimed at mitigating socioeconomic divisions are beinggradually eroded. Urban policies cast inner cities as the “natural” location to accom-modate the actual and desired growth of new middle-class residents flocking to the city(Uitermark, 2009; Van Gent, 2013). Central neighborhoods are selectively targeted forstate-led gentrification, for example through tenure conversions from rent to owneroccupancy (Hochstenbach, 2016). Lower income households are increasingly confinedto a shrinking social rental sector or affordable segments of the owner-occupied sector,and to low status or declining neighborhoods. As these policies progress, the suburba-nization of poverty is likely to take on ever more prominent forms.
URBAN GEOGRAPHY 47

Although in both cities, gentrification constitutes an essential tool in the policy-makers’ toolkit (see Uitermark, 2009; Uitermark et al., 2007; Van den Berg, 2012;Van Gent, 2013), the process itself is much more pervasive in Amsterdam than inRotterdam. Amsterdam is more integrated in global capital circuits and labormarkets (Engelen & Musterd, 2010; Tammaru et al., 2016). In combination withthe presence of multiple large universities and polytechnics, this ensures the city ofa yearly batch of students moving to the city and graduates starting a career in it,pushing demand for housing in an already tight housing context. This also goesfor Rotterdam, but to a lesser extent.
A key finding of this paper is that when specifically focusing on low-incomeresidential moves, the stronger pervasiveness of gentrification in Amsterdam hasmuch to do with its structural character in Amsterdam compared to its more cyclicaltrending in Rotterdam. While we can see that the 2008 crisis influenced gentrificationprocesses in both cities, it did not simply lead to de-gentrification (cf. Hackworth &Smith, 2001; Hedin et al., 2012; Lees & Bondi, 1995). Gentrification is more prone tocyclical trends in Rotterdam: during the boom period, gentrification led to substantialdecreases in the influx of low-income households (similar to Amsterdam), but thesewere almost cancelled out during the subsequent bust. In Rotterdam’s more relaxedhousing context, gentrification processes tend to wax and wane during boom and busttimes. In Amsterdam, the share of all low-income household types decreased substan-tially in the central city during boom times, and this did not increase again during thepostcrisis period, running counter to overarching trends of increasing poverty andunemployment. Thus, during boom periods, gentrification can be seen to progress inboth cities, but bust periods in particular lay bare the extent to which gentrificationactually has a firm foothold in the city, and to which the process is structurallyembedded in the city’s economic development.
Focusing on the moving patterns of different types of low-income households, wesee different patterns. In general, the existing social rental sector continues to mitigatethe exclusionary effects of gentrification. Notably, although the cities’ inner urbanzones have become more gentrified and housing less affordable and accessible, we alsonote an increase in urban working poor households. These findings suggest that alarge and growing group of working poor residents remain integral to the two cities’economic structures, despite overarching patterns of professionalization (Hamnett,1994; Sassen, 1991). Although their incomes are very low, these households appearable to negotiate access to otherwise unaffordable or inaccessible housing throughdifferent coping strategies. Multiple households sharing one dwelling may be animportant strategy that has received little attention in gentrification research. Itdoes not represent direct or exclusionary displacement but should rather be seen asa struggle to stay put, to gain access to housing, or to remain in certain neighborhoods(also Newman & Wyly, 2006). Among working poor households are included pre-cariously (self-)employed—often relatively young—households. This could hint atnew inequalities that cut through traditional class boundaries as a consequence ofcurrent labor market restructuring, but also of intergenerational disparities and thegrowing importance of intergenerational support in acquiring housing (Forrest &Hirayama, 2015), especially in tight housing contexts and upmarket neighborhoods(Hochstenbach & Boterman, 2015).
48 C. HOCHSTENBACH AND S. MUSTERD

A particularly large difference between Amsterdam and Rotterdam exists regardingunemployed movers. While postcrisis trends in Amsterdam show relative stability andeven a further decrease in unemployed in-movers in the central neighborhoods,Rotterdam’s crisis trends show substantial increases across the board. These differencesneed to be viewed in the light of both cities’ different economic structures (Burgers &Musterd, 2002). Employment in lower skilled manual labor shows long-term decreasesin both Amsterdam and Rotterdam, but in Rotterdam, these jobs remain relativelymore important. Such jobs are, however, facing structural decline through workforceprofessionalization (Butler et al., 2008; Hamnett, 1994) and are also heavily impacted byeconomic cycles, which contributes to further decreases during periods of recession.
Inner city gentrification is mirrored by a parallel suburbanization of poverty in bothinvestigated city regions. The question of where displaced groups move to has been acentral concern—but difficult to answer question—in gentrification research (Slater,2009). We find that the changing residential moving patterns of low-income groups arevariegated. Apart from employing coping strategies, they are also increasingly movingto both the urban peripheries (the working poor) and the surrounding regions (the low-to-middle income and unemployed). Particularly those areas that already showedrelatively negative trends before the crisis were the ones hardest hit by its onset. Thehigher density satellite and new towns originally built for the middle classes in parti-cular have become the destinations for lower income households (also Tzaninis &Boterman, 2014). Thus, we see a rather “bundled” suburbanization of poverty, aslower incomes concentrate in these areas.
Research on gentrification generally acknowledges the existence of different forms ofdirect and indirect (exclusionary) displacement (Slater, 2009). Similarly, this paper stressesthat the suburbanization of poverty is not only the product of low-income residents beingdisplaced from the central city, but can also be the result of low-income residents movinginto suburban locations from elsewhere because they are no longer able to acquire housingin the city center. As such, gentrification also has a marked influence on residential moveswithin or to urban regions through exclusionary effects. In fact, it may be expected that ascentral cities continue to gentrify, the well of potential low-income residents who couldmove directly from city to suburb will gradually dry up, making the suburbanization ofpoverty through exclusionary displacement all the more prominent. This paper has foundboth a direct suburbanization of poor households moving from city to suburb, and abroader suburbanization of poverty caused not only by direct moves but also by broaderindirect and exclusionary processes attributable to the increasing unaffordability andinaccessibility of central city locations. This broader process reflects the changing geogra-phy of urban regions marked by shifting socioeconomic divides.
Finally, in this paper, we primarily focused on changing residential moving patternsrather than overall population change. Although residential moves do not necessarily driveneighborhood change (see Hochstenbach & Van Gent, 2015), they do form the nexuswhere issues of displacement, exclusion, housing affordability, and housing accessibilitycome to the fore and have their biggest impact. This is especially the case in contexts like theNetherlands, where tenant rights are relatively strong, protecting tenants in situ andproviding an incentive to stay put. The focus on residential moves illuminates growingand important undercurrents that would otherwise have remained obscured or appearedrelatively minor. Particularly trends that mark a reversal in the direction of development for
URBAN GEOGRAPHY 49

neighborhoods or areas are obscured by the large body of non-moving residents. Whenfocusing on residential moves, it becomes apparent that gentrification and the suburbani-zation of poverty are forceful processes that both drive and reflect changes in the geographyof urban regions.
Acknowledgments
This paper draws on nonpublic microdata from the System of Social Statistical Datasets of StatisticsNetherlands. The authors thank Wouter van Gent, Justus Uitermark, Rowan Arundel and thereviewers of Urban Geography for their useful comments on previous drafts of this paper.
Disclosure statement
No potential conflict of interest was reported by the author.
Notes
1. To give an example, movers’ neighborhood outcomes for 2004 are the outcome of aresidential move taking place anytime during 2003. It is possible that households moveseveral times, in which case we only measure the last outcome/destination.
2. All incomes are corrected for inflation to the 2013 level.3. Since 2011, 90% of rent-regulated social rental housing has to be allocated to households
with an income below the official threshold. For some household types, this thresholdstands at approximately €38,000 (subject to yearly fluctuation), but for the sake of clarity,we stick to a single threshold.
4. We also ran additional analyses using different income classifications, for example equiv-alized household income. These analyses returned similar results to those presented here(and are available from the corresponding author upon request).
5. We use stable four-digit postcode tracts to map changes. The average number of includedhouseholds per postcode area is roughly 2,400. Postcode areas with less than 10 observa-tions for a specific income category are excluded from these specific analyses to meetprivacy requirements.
6. We define moving as changing address, which may also occur within a neighborhood.7. In this paper, we distinguish between social and private rent. Social rental dwellings are
owned by housing associations, while private rental dwellings are owned by privatelandlords. This in itself does not imply that a dwelling is either rent-controlled (with amonthly rent below €700, subject to yearly changes) or liberalized. Dwellings owned byhousing associations are mostly rent-controlled, although a small but increasing share hasbeen liberalized. Similarly, a large share of the private rental stock is rent-controlled,although this share is shrinking fast.
8. These are allocations of “affordable” dwellings eligible for tenant subsidies. Although theallocation system is the dominant way through which social rental dwellings are allocated,some dwellings are allocated in other ways (e.g. directly by the housing association).
9. Statistics Netherlands groups job types into four categories regarding skill level (ISCOclassification). We colloquially refer to the lowest two sectors as lower skilled jobs (seeCBS, 2015).
10. Note that the year represents the address on the 1 January in the year following the move.11. All analyses have also been conducted for the total as well as non-moving population. The
direction of changes among these groups is highly similar to the changes among moversbut is not as marked. These analyses are therefore not presented but are available from thecorresponding author upon request.
50 C. HOCHSTENBACH AND S. MUSTERD

ORCID
Sako Musterd http://orcid.org/0000-0003-2578-9098
References
Aalbers, Manuel B. (2004). Promoting home ownership in a social-rented city: Policies, practicesand pitfalls. Housing Studies, 19(3), 483–495.
Aalbers, Manuel B. (2011). Place, exclusion and mortgage markets. Oxford: John Wiley & Sons.Aalbers, Manuel B., & Christophers, Brett. (2014). Centering housing in political economy.
Housing, Theory and Society, 31(4), 373–394.Aassve, Arnstein, Cottini, Elena, & Vitali, Agnesa. (2013). Youth prospects in a time of economic
recession. Demographic Research, 29(36), 949–962.Atkinson, Rowland. (2003). Domestication by cappuccino or a revenge on urban space? Control
and empowerment in the management of public spaces. Urban Studies, 40(9), 1829–1843.Boterman, Willem. R., Karsten, Lia, & Musterd, Sako. (2010). Gentrifiers settling down? Patterns
and trends of residential location of middle-class families in Amsterdam. Housing Studies, 25(5), 693–714.
Burgers, Jack, & Musterd, Sako. (2002). Understanding urban inequality: A model based onexisting theories and an empirical illustration. International Journal of Urban and RegionalResearch, 26(2), 403–413.
Butler, Tim, Hamnett, Chris, & Ramsden, Mark. (2008). Inward and upward: Marking out socialclass change in London, 1981—2001. Urban Studies, 45(1), 67–88.
CBS. (2013). Woningvoorraad naar eigendom; regio, 2006–2012. Den Haag: CBS Statline.CBS. (2015). Arbeidsdeelname; regionale indeling 2014. Den Haag: CBS Statline.Cooke, Thomas, & Denton, Curtis. (2015). The suburbanization of poverty? An alternative
perspective. Urban Geography, 36(2), 300–313.Davidson, Mark. (2009). Displacement, space and dwelling: Placing gentrification debate. Ethics
Place and Environment, 12(2), 219–234.Davidson, Mark, & Wyly, Elvin. (2012). Class-ifying London: Questioning social division and
space claims in the post-industrial metropolis. City, 16(4), 395–421.Davidson, Mark, & Wyly, Elvin. (2015). Same, but different: Within London’s ‘static’class
structure and the missing antagonism. City, 19(2–3), 247–257.Dewilde, Caroline, & De Decker, Pascal. (2016). Changing inequalities in housing outcomes
across Western Europe. Housing, Theory and Society, 33(2), 121–161.Doucet, Brian. (2013). Variations of the entrepreneurial city: Goals, roles and visions in
Rotterdam’s Kop van Zuid and the Glasgow harbour megaprojects. International Journal ofUrban and Regional Research, 37(6), 2035–2051.
Engelen, Ewald, & Musterd, Sako. (2010). Amsterdam in crisis: How the (local) state buffers andsuffers. International Journal of Urban and Regional Research, 34(3), 701–708.
Forrest, Ray, & Hirayama, Yosuke. (2015). The financialisation of the social project: Embeddedliberalism, neoliberalism and home ownership. Urban Studies, 52(2), 233–244.
Freeman, Lance, & Braconi, Frank. (2004). Gentrification and displacement New York City inthe 1990s. Journal of the American Planning Association, 70(1), 39–52.
Freeman, Lance, Cassola, Adele, & Cai, Tiacheng. (2016). Displacement and gentrification inEngland and Wales: A quasi-experimental approach. Urban Studies, 53(13), 2797–2814.
Hackworth, Jason, & Smith, Neil. (2001). The changing state of gentrification. Tijdschrift VoorEconomische En Sociale Geografie, 92(4), 464–477.
Hamnett, Chris. (1994). Social polarisation in global cities: Theory and evidence. Urban Studies,31(3), 401–424.
Hamnett, Chris. (2001). Social segregation and social polarization. In Paddison, Ronan (Ed)Handbook of Urban Studies (pp.143-161). London: SAGE publications.
URBAN GEOGRAPHY 51

Hamnett, Chris. (2003). Gentrification and the middle-class remaking of inner London,1961-2001. Urban Studies, 40(12), 2401–2426.
Harvey, David. (1989). From managerialism to entrepreneurialism: The transformation in urbangovernance in late capitalism. Geografiska Annaler. Series B. Human Geography, 71, 3–17.
Hedin, Karin, Clark, Eric, Lundholm, Emma, & Malmberg, Gunnar. (2012). Neoliberalization ofhousing in Sweden: Gentrification, filtering, and social polarization. Annals of the Associationof American Geographers, 102(2), 443–463.
Hedman, Lina, Van Ham, Maarten, & Manley, David. (2011). Neighborhood choice and neigh-borhood reproduction. Environment and Planning A, 43, 1381–1399.
Hochstenbach, Cody. (2016). State-led gentrification and the changing geography of market-oriented housing policies. Housing, Theory and Society. doi: 10.1080/14036096.2016.1271825
Hochstenbach, Cody, & Boterman, Willem R. (2015). Intergenerational support shaping residentialtrajectories: Young people leaving home in a gentrifying city. Urban Studies. doi: 10.1177/0042098015613254.
Hochstenbach, Cody, & Van Gent, Wouter P.C. (2015). An anatomy of gentrification processes:Variegating causes of neighbourhood change. Environment and Planning A, 47(7), 1480–1501.
Huisman, C J.. (2016). A silent shift? the precarisation of the dutch rental housing market. Journalof Housing and the Built Environment, 31(1), 93-106. doi:10.1007/s10901-015-9446-5
Hulchanski, David. (2010).The three cities within Toronto: Income polarization among Toronto’sneighborhoods, 1970-2005. Toronto: Cities Centre, University of Toronto.
Kadi, Justin, & Musterd, Sako. (2015). Housing for the poor in a neo-liberalising just city: Stillaffordable, but increasingly inaccessible. Tijdschrift Voor Economische En Sociale Geografie,106(3), 246–262.
Kavanagh, Leo, Lee, Duncan, & Pryce, Gwilym. (2016). Is poverty decentralizing? Quantifyinguncertainty in the decentralization of urban poverty. Annals of the American Association ofGeographers, 106(6), 1286–1298.
Lees, Loretta, & Bondi, Liz. (1995). De-gentrification and economic recession: The case of NewYork City. Urban Geography, 16(3), 234–253.
Maloutas, Thomas. (2007). Segregation, social polarization and immigration in Athens duringthe 1990s: Theoretical expectations and contextual difference. International Journal of Urbanand Regional Research, 31(4), 733–758.
Musterd, Sako, & Ostendorf, Wim. (1998). Urban segregation and the welfare state: Inequalityand exclusion in western cities, (Eds.). New York: Routledge.
Musterd, Sako, & Van Gent, Wouter P.C. (2016). Changing welfare context and incomesegregation in Amsterdam and its metropolitan area. In Tiit Tammaru, Szymon Marcinczak,Maarten Van Ham, & Sako Musterd (Eds), Socio-economic segregation in European capitalcities: East meets west (pp. 55–79). New York/London: Routledge.
Musterd, Sako, Van Gent, Wouter P.C., Das, Marjolijn, & Latten, Jan. (2016). Adaptive beha-viour in urban space: Residential mobility in response to social distance. Urban Studies, 53(2),227–246.
Newman, Kathe, & Wyly, Elvin. (2006). The right to stay put, revisited: Gentrification andresistance to displacement in New York City. Urban Studies, 43(1), 23–57.
Peck, Jamie. (2005). Struggling with the creative class. International Journal of Urban andRegional Research, 29(4), 740–770.
Peck, Jamie, & Tickell, Adam. (2002). Neoliberalizing space. Antipode, 34(3), 380–404.Pellenbarg, Michiel, Tillema, Martin, Brugman, Lars, & Van Marwijk, Ramona. (2014). Verkopen
van corporatiewoningen. Onderzoek naar de marktverhoudingen in 4 steden. Amsterdam:Kadaster.
Randolph, Bill, & Holloway, Darren. (2005). The suburbanization of disadvantage in Sydney:New problems, new policies. Opolis, 1(1), 173-201.
Randolph, Bill, & Tice, Andy. (2014). Suburbanizing disadvantage in Australian cities:Sociospatial change in an era of neoliberalism. Journal of Urban Affairs, 36(s1), 384–399.
Reardon, Sean F., & Bischoff, Kendra. (2011). Income inequality and income segregation1.American Journal of Sociology, 116(4), 1092–1153.
52 C. HOCHSTENBACH AND S. MUSTERD

Ronald, Richard. (2008). The ideology of home ownership: Homeowner societies and the role ofhousing. New York: Palgrave Macmillan.
Ronald, Richard, & Dol, Kees. (2011). Housing in the Netherlands before and after the globalfinancial crisis. In Ray Forrest & Ngai Ming Yip (Eds.), Housing markets and the globalfinancial crisis: The uneven impact on households (pp. 93–112). Cheltenham: Edward Elgar.
Sassen, Saskia. (1991). The global city: New York, London, Tokyo. Princeton: Princeton UniversityPress.
Skaburskis, Andrejs, & Nelson, Kenneth. (2014). Filtering and gentrifying in Toronto:Neighbourhood transitions in and out from the lowest income decile between 1981 and2006. Environment and Planning A, 46(4), 885–900.
Slater, Tom. (2009). Missing Marcuse: On gentrification and displacement. City, 13(2–3), 292–311.
Smith, Neil. (2002). New globalism, new urbanism: Gentrification as global urban strategy.Antipode, 34(3), 427–450.
Teernstra, Annalies B. (2015). Contextualizing state-led gentrification: Goals of governing actorsin generating neighbourhood upgrading. Environment and Planning A, 47(7), 1460–1479.
Tammaru, Tiit, Marcinczak, Szymon, Van Ham, Maarten, & Musterd, Sako (Eds.). (2016). Socio-economic segregation in European capital cities: East meets west. New York/London: Routledge.
Tzaninis, Yannis, & Boterman, Willem R. (2014). Beyond the urban suburban dichotomy:Shifting mobilities to and from Almere, Holland. Centre for Urban Studies Working PapersSeries No.8.
Uitermark, Justus. (2003). ‘Social Mixing’ and the management of disadvantaged neighborhoods:The Dutch policy of urban restructuring revisited. Urban Studies, 40(3), 531–549.
Uitermark, Justus. (2009). An in memoriam for the just city of Amsterdam. City, 13(2–3), 347–361.Uitermark, Justus, & Bosker, Tjerk. (2014). Wither the ‘undivided city’? An assessment of state-
sponsored gentrification in Amsterdam. Tijdschrift Voor Economische En Sociale Geografie,105(2), 221–230.
Uitermark, Justus, Duyvendak, Jan Willem, & Kleinhans, Reinout. (2007). Gentrification as agovernmental strategy: Social control and social cohesion in Hoogvliet, Rotterdam.Environment and Planning A, 39(1), 125–141.
Van der Heijden, Harry, Dol, Kees, & Oxley, Michael. (2011). Western European housingsystems and the impact of the international financial crisis. Journal of Housing and the BuiltEnvironment, 26(3), 295–313.
Van der Waal, Jeroen (2010). Unravelling the global city debate: economic inequality andethnocentrism in contemporary Dutch cities. Rotterdam: PhD dissertation Erasmus University.
Van den Berg, Marguerite. (2012). Femininity as a city marketing strategy gender bendingRotterdam. Urban Studies, 49(1), 153–168.
Van Gent, Wouter P.C. (2013). Neoliberalization, housing institutions and variegated gentrifica-tion: How the ‘third wave’ broke in Amsterdam. International Journal of Urban and RegionalResearch, 37(2), 503–522.
Watt, Paul. (2008). The only class in town? Gentrification and the middle-class colonization ofthe city and the urban imagination. International Journal of Urban and Regional Research, 32(1), 206–211.
Wiemers, Emily E. (2014). The effect of unemployment on household composition and doublingup. Demography, 51(6), 2155–2178.
Zukin, Sharon, Trujillo, Valerie, Frase, Peter, Jackson, Danielle, Recuber, Tim, & Walker,Abraham. (2009). New retail capital and neighborhood change: Boutiques and gentrificationin New York City. City & Community, 8(1), 47–64.
Zwiers, Merle, Bolt, Gideon, Van Ham, Maarten, & Van Kempen, Ronald. (2016a). The globalfinancial crisis and neighborhood decline. Urban Geography, 37(5), 664–684.
Zwiers, Merle, Kleinhans, Reinout J., & Van Ham, Maarten. (2016b). The path-dependency oflow-income neighborhood trajectories: An approach for analysing neighborhood change.Applied Spatial Analysis and Policiy, Online First. doi:10.1007/s12061-016-9189-z
URBAN GEOGRAPHY 53