Corporategovernanceandfirmvalue:evidence ... JFE_cor governance.pdf · During the 1997 Korean...
49
Journal of Financial Economics 71 (2004) 265–313 Corporate governance and firm value: evidence from the Korean financial crisis $ Jae-Seung Baek a , Jun-Koo Kang b, *, Kyung Suh Park c a College of Economics and Business, Hankuk University of Foreign Studies, KyungGi-Do, South Korea b Department of Finance, Eli Broad College of Business, Michigan State University, East Lansing, MI 48824, USA c College of Business Administration, Korea University, Seoul, South Korea Received 1 October 2001; accepted 5 November 2002 Abstract During the 1997 Korean financial crisis, firms with higher ownership concentration by unaffiliated foreign investors experienced a smaller reduction in their share value. Firms that had higher disclosure quality and alternative sources of external financing also suffered less. In contrast, chaebol firms with concentrated ownership by controlling family shareholders experienced a larger drop in the value of their equity. Firms in which the controlling shareholders’ voting rights exceeded cash flow rights and those who borrowed more from the main banks also had lower returns. Our results suggest that change in firm value during a crisis is a function of firm-level differences in corporate governance measures. r 2003 Elsevier B.V. All rights reserved. JEL classification: G15; G21; G32; G33; G34 Keywords: Corporate governance; Firm value; Chaebol; Controlling shareholder; Main bank 1. Introduction Current research demonstrates the importance of corporate governance in the development of financial markets. La Porta, Lopez-de-Silanes, Shleifer, and Vishny ARTICLE IN PRESS $ We are grateful for comments from David Brown, Stijn Claessens, Mark Flannery, Wei-Lin Liu, Miles Livingston, Andy Naranjo, Jay Ritter, Mike Ryngaert, Michael Shih, an anonymous referee, participants at seminars at the University of Florida, the Korea University, the 2002 Asian Corporate Governance Conference, and the 2002 PACAP Finance Conference. *Corresponding author. Tel.: +l-517-353-3065; fax: +1-517-432-1080. E-mail address: [email protected] (J.-K. Kang). 0304-405X/$ - see front matter r 2003 Elsevier B.V. All rights reserved. doi:10.1016/S0304-405X(03)00167-3
Transcript of Corporategovernanceandfirmvalue:evidence ... JFE_cor governance.pdf · During the 1997 Korean...

Journal of Financial Economics 71 (2004) 265–313
Corporate governance and firm value: evidencefrom the Korean financial crisis$
Jae-Seung Baeka, Jun-Koo Kangb,*, Kyung Suh Parkc
aCollege of Economics and Business, Hankuk University of Foreign Studies, KyungGi-Do, South KoreabDepartment of Finance, Eli Broad College of Business, Michigan State University, East Lansing,
MI 48824, USAcCollege of Business Administration, Korea University, Seoul, South Korea
Received 1 October 2001; accepted 5 November 2002
Abstract
During the 1997 Korean financial crisis, firms with higher ownership concentration by
unaffiliated foreign investors experienced a smaller reduction in their share value. Firms that
had higher disclosure quality and alternative sources of external financing also suffered less. In
contrast, chaebol firms with concentrated ownership by controlling family shareholders
experienced a larger drop in the value of their equity. Firms in which the controlling
shareholders’ voting rights exceeded cash flow rights and those who borrowed more from the
main banks also had lower returns. Our results suggest that change in firm value during a crisis
is a function of firm-level differences in corporate governance measures.
r 2003 Elsevier B.V. All rights reserved.
JEL classification: G15; G21; G32; G33; G34
Keywords: Corporate governance; Firm value; Chaebol; Controlling shareholder; Main bank
1. Introduction
Current research demonstrates the importance of corporate governance in thedevelopment of financial markets. La Porta, Lopez-de-Silanes, Shleifer, and Vishny
ARTICLE IN PRESS
$We are grateful for comments from David Brown, Stijn Claessens, Mark Flannery, Wei-Lin Liu, Miles
Livingston, Andy Naranjo, Jay Ritter, Mike Ryngaert, Michael Shih, an anonymous referee, participants
at seminars at the University of Florida, the Korea University, the 2002 Asian Corporate Governance
Conference, and the 2002 PACAP Finance Conference.
*Corresponding author. Tel.: +l-517-353-3065; fax: +1-517-432-1080.
E-mail address: [email protected] (J.-K. Kang).
0304-405X/$ - see front matter r 2003 Elsevier B.V. All rights reserved.
doi:10.1016/S0304-405X(03)00167-3

(1997, 1998, 1999, 2000), hereafter referred to as LLSV, argue that differences amongcountries in the structure of laws and their enforcement explain the differences infinancial market development and also show that such development is promoted bybetter protection of investors. Moreover, several studies establish a link betweencorporate governance and corporate valuation. For example, using a sample offirms from nine East Asian countries, Claessens et al. (2002) show that higher cashflow rights of the controlling shareholder are associated with higher marketvaluation, but higher voting rights correspond to lower market valuation. Johnson,Boone, Breach, and Friedman (2000), hereafter referred to as JBBF, find that theeffectiveness of protection for minority shareholders in 25 emerging markets explainsmore of the variation in exchange rates and stock market performance during theAsian crisis. In a similar vein, LLSV (2002) show that firms in countries with bettershareholder protection have higher Tobin’s q than those where such protection isweaker.Although the studies listed above have used cross-country analysis to demonstrate
the first-order importance of corporate governance characteristics in determiningfirm value, few researchers investigate individual countries in depth. One notableexception is Mitton (2002). He uses firm-level data from five East Asian countries toshow that several firm-specific measures of corporate governance had a significanteffect on performance during the Asian crisis. He argues that corporate governancebecomes more critical in explaining cross-firm differences in performance during afinancial crisis for two reasons. First, as also argued in JBBF (2000), expropriation ofminority shareholders could increase since the incentive for controlling shareholdersto do so tends to go up as the expected return on investment falls. Second, therelationship-based financial system in East Asia worked well during the boom periodsince outside investors did not have full information on whether or not their fundswere being deployed appropriately, and the crisis triggered greater investorawareness of weaknesses in corporate governance in the region and led to thempull out (Rajan and Zingales, 1998). Consistent with these arguments, Mitton (2002)finds that firms with higher disclosure quality, greater transparency, higher outsideownership concentration, and corporate focus experienced better stock priceperformance during the crisis. Lemmon and Lins (2001) also show that during thecrisis, firms in which controlling owner-managers owned more of the control rights,but fewer cash flow rights, suffered more loss of share values.In this study, we test the view of Mitton (2002) that firm-specific measures of
corporate governance affect firm performance during a crisis, looking only atKorean companies. Focusing on a single nation in this way allows us to examinecorporate governance measures at a level of detail that would be hard to aggregateacross countries. In this context, our paper is similar to the work of Joh (2003) whoshows that weaker corporate governance in Korean firms is associated with worseaccounting performance. However, Joh investigates the relation between corporategovernance and firm performance before rather than during the crisis of 1997. Theadvantage of focusing on the crisis period is that it allows us to examineunambiguously the effect of corporate governance on firm value. In other words,since we use a given set of measures for corporate governance immediately before the
ARTICLE IN PRESSJ.-S. Baek et al. / Journal of Financial Economics 71 (2004) 265–313266

external shock to explain changes in firm value, we can largely eliminate anyspurious causality caused by the endogeneity problem.Korean data have a number of other characteristics that make them particularly
suited to our investigation. First of all, many Korean firms belong to business groupsknown as chaebols. Although a great deal of theoretical and empirical research isdevoted to understanding the role of business groups in a range of countries, it is notentirely clear whether such entities always perform a valuable function for theirshareholders. On the positive side, Khanna and Palepu (2000) compare theprofitability of Indian firms belonging to industrial groups to that of independentIndian firms, and find that diversified business groups do add value. Anotherimportant finding is that of Shin and Park (1999) who show that because of theirinternal capital markets, Korean firms belonging to the top 30 business groups aresubject to fewer financing constraints than other Korean firms. Hoshi et al. (1991)also examine the sensitivity of Japanese firms’ investment expenditures to liquidityand find that it is lower for firms within bank-oriented keiretsu.On the negative side, however, Johnson, La Porta, Lopez-de-Silanes, and Shleifer
(2000) show that controlling shareholders in European business groups have strongincentives to siphon resources out of member firms to increase their individualwealth. Furthermore, according to Bae, Kang, and Kim (2002), although minorityshareholders of firms within the top 30 Korean chaebols (hereafter referred to as thechaebol) typically lose out from their acquisitions, the controlling shareholders gainfrom the same deals. Using a sample of 18,600 Indian firms during the period 1989–1999, Bertrand et al. (2002) also find that the ultimate owners of the Indian pyramidshave strong incentives to divert resources from firms low down in the pyramidtowards ones high up in the pyramid.From our perspective, one notable feature of the chaebol is that ownership is
heavily concentrated, inasmuch as one individual has almost complete control overall firms within the group. Such a structure gives the owner-managers involvedstrong incentives to diversify their wealth and human capital (Amihud and Lev,1981) and to expand their chaebol into several different industries. Despitethe significant contribution chaebols have made to the rapid growth of theKorean economy during the last 40 years, critics claim that much of their businessexpansion has resulted from excessive borrowing and that owner-managers haveexpropriated other investors by investing the firm’s resources to maximize their ownor the group’s welfare. At the end of 1998, the top 30 chaebols accounted for 11.97%of total GNP, 47.79% of total corporate assets, and 46.54% of total corporaterevenues.1 During the period 1993–1998, the average debt to total assets ratio oflisted firms in the top 30 chaebols amounted to 77.18%. In contrast, the ratio of debtto total assets for listed non-chaebol firms was 65.62%. Given that the Koreanfinancial crisis in 1997 led to a loss of investor confidence and the fall in expectedreturns on investment led to increased expropriation by controlling shareholders(JBBF, 2000), it will be interesting to see whether or not the tendency towards
ARTICLE IN PRESS
1See Bae, Kang, and Kim (2002) for a detailed discussion of the importance of the top 30 chaebols in
Korea.
J.-S. Baek et al. / Journal of Financial Economics 71 (2004) 265–313 267

concentration of ownership in chaebol firms has an adverse effect on firm valueduring the crisis period.Furthermore, as shown in Claessens et al. (2000), controlling shareholders of
chaebols have power over firms that exceeds their cash flow rights. This discrepancyin cash flow rights and voting rights can create severe agency problems betweencontrolling and minority shareholders, since it gives the former group substantialpower over important strategic decisions while enabling them to avoid the full cost ofany negative outcomes. For the crisis period, we examine whether measures ofdivergence between cash flow rights and voting rights, as used in LLSV (1999),Claessens et al. (2000), Lemmon and Lins (2001), Mitton (2002), and Joh (2003), areassociated with lower market value.Another important characteristic of ownership structure in Korea is that in many
firms institutional investors hold a large proportion of voting rights. Such investorsare sometimes affiliated with firms and serve as trading partners, meaning that theirstake in the firms is similar to the holding of debt. Although large shareholders whoare not affiliated firms (e.g., foreign investors) have strong financial incentives tomonitor managerial behavior (Shleifer and Vishny, 1986), affiliated investors mighthave different monitoring incentives. For example, Barclay and Holderness (1989)and Barclay et al. (1993) argue that large shareholders can extract private benefitsthat are not available to diffuse stockholders. Furthermore, cross-shareholdingpractices among firms within the same chaebol can prevent affiliated shareholdersfrom monitoring the member firms effectively, since the controlling shareholders tendto use equity ownership by affiliated firms as a means to secure control of othermember firms. We explore the role of different types of investors by separating equityownership by institutional investors into affiliated and nonaffiliated shareholdings.Finally, Korean firms have traditionally placed greater reliance on bank financing
than companies elsewhere. Although the importance of bank financing in Korea hasrecently decreased due to financial deregulation and capital market liberalization,Korean firms still rely strongly on bank financing and maintain close financial tieswith their main banks (Kang, 1998). A bank-centered corporate governance systemis often viewed as having advantages over the capital-market-centered system (Aoki,1990; Hoshi, et al., 1991; Kaplan, 1994; Kaplan and Minton, 1994; Kang andShivdasani, 1995). In a bank-centered system, a firm obtains most of its externalfinancing from the main banks, which not only provides both short- and long-termfinancing but plays the role of a manager of a loan consortium in obtaining financingfor its client firms. The main bank also sometimes provides advice to managementand intervenes when the firm’s profitability is poor. These arguments suggest that thestrength of a firm’s ties to a main bank will have a positive effect on firm value.However, bank relations are unlikely to be valuable in circumstances when the
banking sector is itself experiencing severe external shocks. If banks are forced tocurtail lending because of their own difficulties and firms have no alternative sourcesof funding, firms have to cut back on investment even when they could investprofitably. An unexpected deterioration in bank durability, therefore, inevitablyimposes costs on client firms. According to these arguments, firm value is more likelyto fall when a firm has a close relationship with its main bank. Slovin et al. (1993),
ARTICLE IN PRESSJ.-S. Baek et al. / Journal of Financial Economics 71 (2004) 265–313268
Gibson (1995), Kang and Stulz (2000), and Bae, Kang, and Lim (2002) show thatwhen a bank suffers from a decreased ability to lend to a borrower, the client firm isadversely affected.We find that the economic crisis in Korea has a significant and negative effect on
the market value of firms, but with a large cross-sectional variation. Firms with largerequity ownership by foreign investors experience a smaller drop in share value. Firmswith higher disclosure quality and those with access to alternative sources of externalfinancing also suffer less from the shock. In contrast, chaebol firms with concentratedownership by owner-managers and those with concentrated ownership by affiliatedfirms experience a larger drop in equity value. Firms in which the controllingshareholder’s voting rights exceed cash flow rights and those who borrow more fromthe main banks both have significantly lower returns. We find similar effects forhighly diversified firms, those with high leverage, and small and risky firms. Weperform several robustness checks on the data, using an alternative estimation periodfor the change in firm value and alternative definitions of ‘‘chaebol’’ and ‘‘mainbank,’’ and find that the results are qualitatively unchanged. These findings suggestthat firm-level differences in corporate governance measures play an important rolein determining changes in firm value during the financial crisis in Korea.Overall, our results support the findings of Mitton (2002) that corporate
governance has a significant influence on firm-level performance in a crisis andfurther suggest that the negative impact is greater on firms in which controllingshareholders have stronger incentives and means to expropriate resources.This paper proceeds as follows. Section 2 discusses how changes in firm value
caused by economic shock relate to measures of corporate governance. Section 3describes data and sample characteristics. In Section 4, we show the results of ourempirical analysis. Section 5 summarizes and concludes the paper.
2. Corporate governance and firm value: hypotheses
The hypothesis we want to test is that certain corporate governance characteristicsplay an important role in determining changes in firm value caused by an economicshock. In this section, we discuss several corporate governance measures and otherexplanatory variables that may be related to such changes.
2.1. Corporate governance variables
Chaebol. In Korea, a large business group is often referred to as a chaebol. TheKorea Fair Trade Commission (KFTC) defines a business group as ‘‘a group ofcompanies of which more than 30% of shares are owned by the group’s controllingshareholder and its affiliated companies.’’ Chaebol firms operate in many differentindustries, are bound together by a nexus of explicit and implicit contracts, andmaintain substantial business ties with other firms in their group. They are alsocharacterized by an extensive arrangement of pyramidal or multi-layered share-holding agreements and the existence of cross-debt guarantees among member firms.
ARTICLE IN PRESSJ.-S. Baek et al. / Journal of Financial Economics 71 (2004) 265–313 269
Even though the chaebol’s owner-managers put up a relatively small portion of thetotal stake in the group, they have full control over all member firms, due to theprevalence of reciprocal shareholding agreements and the scarcity of mechanisms tocontrol their discretionary power. Thus, owner-managers can easily expropriateminority investors in the chaebol by investing the firm’s resources to maximize theirown or the group’s wealth, even when such investments do not maximize the value ofthe individual firm.A priori, the effect of chaebol affiliation on firm value during an economic crisis is
unclear. If it facilitates investment policies that delay the exit of a distressed memberfirm during the shock period, it could have a detrimental effect on the value of otheraffiliated firms within the same group but a positive effect on the value of the firm inquestion. Joh (2003) shows that chaebol firms underperformed relative to independentfirms before the crisis. In contrast, if risk-sharing among chaebol firms and theoperation of an internal capital market within chaebols allows its members to survivethe external shock, the structure of diversified business groups can have a positiveeffect on the value of their members. To explore this issue, we use a dummy variablethat equals one if a firm belongs to one of the 30 largest business groups. Since the top30 is an arbitrary category created by the Korean government for its own purposesand other smaller chaebols are organized the similar way as the top 30 chaebols, weuse the top 50 and the top 70 as alternative definitions of chaebol to test the results.
Ownership structure. Ownership structure is an important factor in determiningfirm value (Demsetz and Lehn, 1985). According to Jensen and Meckling (1976),concentrated ownership by owner-managers minimizes the agency problem thatarises from the separation of ownership and control. Joh (2003) finds that during the1993–1997 period, Korean firms whose controlling family shareholders had moreownership outperformed those where the family members had less. Mitton (2002)also shows that higher block ownership by the largest shareholder is associated withhigher crisis-period stock returns.However, the effect of ownership concentration on firm value differs between
chaebol and non-chaebol firms. For example, substantial discretionary power heldby controlling shareholders in chaebol firms can allow them to receive privatebenefits that do not accrue to other shareholders (Barclay and Holderness, 1989;Johnson, La Porta, Lopez-de-Silanes, and Shleifer, 2000; Bae, Kang, and Kim,2002). Then such power can have a negative effect on firm value and weaken firms’ability to respond effectively to economic crisis. Furthermore, since chaebol firmsoften buy and sell goods and services from one another, and because they areconnected by an extensive arrangement of reciprocal shareholding agreements,owner-managers of chaebol firms can be more concerned with maximizing group sizeand/or value than with the situation of an individual member firm. These argumentssuggest that chaebol firms where owner-managers own a large concentration ofshares will have a more severe agency problem and thus are more likely adverselyaffected during the crisis. To examine the effect of ownership structure on firm value,we consider three measures of ownership concentration. The first is block holdingsby the largest shareholder owning 5% or more of issued shares. The second is thesum of block holdings by all shareholders owning 5% or more of issued shares. The
ARTICLE IN PRESSJ.-S. Baek et al. / Journal of Financial Economics 71 (2004) 265–313270

third is the total ownership by all controlling shareholders, not just blockholders,which is measured by the sum of equity ownership by the owner-manager, equityownership by his family members, and equity ownership by affiliated firms. Tofurther understand the role of different types of shareholders in determining firmvalue, we also disaggregate the first two measures of ownership concentration intoownership blocks held by owner-managers and their family members, blocks held byaffiliated firms, and blocks held by others. Following Mitton (2002), we alsodifferentiate between ownership blocks held by owners involved with managementand blocks held by others.In addition, we explore in detail the role of nonaffiliated shareholders during the
crisis. Korean domestic institutions and foreign investors hold a large proportion ofvoting rights in many firms. According to Shleifer and Vishny (1986), such outsideownership can provide incentives for shareholders to monitor managerialperformance and take actions that enhance firm value. Mitton (2002) shows thatfirms with higher outside ownership concentration experience significantly betterstock price performance. Using data from India, Khanna and Palepu (1999) find thatas emerging markets integrate with the global economy, foreign investors serve avaluable monitoring function. To the extent that nonaffiliated domestic and foreigninvestors play this role, we would expect firms with high ownership by such investorsto suffer less in times of crisis. We use equity ownership by domestic and foreigninstitutions to examine the role of nonaffiliated shareholders.
Disparity between cash flow rights and voting rights. Claessens et al. (2000) show alarge divergence between cash flow rights and control rights for many East Asianfirms. They show that the widespread use of pyramid ownership structures and cross-holdings among firms allows controlling shareholders to exercise full control over afirm despite holding a relatively small portion of its cash flow rights. Claessens et al.(2002), Lemmon and Lins (2001), Mitton (2002), and LLSV (2002) find that firmvalue is negatively related to the separation of the cash flow and control rights of thecontrolling shareholders. Following Claessens et al. (2000), Lemmon and Lins(2001), and Mitton (2002), we measure the cash flow rights of the controllingshareholder as the sum of the direct equity ownership and the product of theownership stakes obtained indirectly along the chain in a pyramid structure (bytracing up to two layers of control chains). Control rights are taken as the sum ofdirect equity ownership and the minimum value of ownership in the chain of votingrights. However, unlike previous studies that use data on block holdings to estimatethese rights, we use data on both block and total holdings. Data on total holdingsallow us to measure the controlling shareholders’ rights more accurately. Thedivergence between cash flow rights and control rights is computed as the ratio ofcontrol rights to cash flow rights.This approach, however, tends to underestimate the actual voting power of
controlling shareholders in Korean firms since member firms within chaebols areconnected by extensive reciprocal shareholding agreements. It is widely recognizedthat owner-managers of chaebol firms exercise substantial control over cross-ownership among affiliated firms. Therefore, we use equity ownership by affiliatedfirms as an additional measure of the divergence between cash flow and control
ARTICLE IN PRESSJ.-S. Baek et al. / Journal of Financial Economics 71 (2004) 265–313 271

rights for the controlling shareholder. If owner-managers use equity ownership byaffiliated firms to strengthen their control rights with little regard to the wealth ofother shareholders, we would expect equity ownership by affiliated firms to have anegative impact on firm value.
Main bank ties. Korean firms have traditionally relied heavily on bank financing,maintaining close and long-term ties with their main banks. The main bank isparticularly knowledgeable about the firm’s prospects and performs the role of aninsurer, because implicit long-term contracts with the firm can create incentives toprovide necessary assistance when its client firms are in financial trouble. Therefore,we would expect firms with a close relationship with their main banks to receivestrong support when the economy as a whole experiences difficulties. This argumentsuggests that the strength of a firm’s ties to a main bank has a positive effecton firm value. We use the ratio of main bank debt to total debt to measure thestrength of a firm’s ties to the main bank. We obtain the name of each client-firm’smain bank from the Annual Statistics published by the Korean Listed CompaniesAssociation. Although a firm can borrow from several banks, the Annual
Statistics lists only one bank as the main bank that provides the main (but notnecessary the largest) shares of the firm’s debt financing. Alternatively, we define themain bank as the firm’s largest lender and obtain this information from annual auditreports. As a broad measure for the bank tie, we also consider the fraction of bankdebt to total debt.However, given that an economic shock adversely affects banks as well as firms,
one would expect a more negative effect on firms that maintain close ties to the bank.If banks are forced to curtail lending due to an exogenous shock, their borrowers willhave to turn to more expensive sources of external financing and thus lose thebenefits of the bank relationship for the future. Kang and Stulz (2000) show thatJapanese firms that borrowed more from banks suffered larger reductions in stockprices and cut investments back more substantially from 1990 to 1993, during whichthe whole banking sector in Japan was experiencing difficulties. Further, Bae, Kang,and Lim (2002) show that Korean firms with high bank loan ratios experience a largedrop in the value of their equity when their main banks experience negative events.They also find that firms with fewer alternative means of external financing suffermore from the adverse shocks to banks.According to this argument, firm value is more likely to fall when a firm borrows
more from banks. It also suggests that firms that can raise capital from externalmarkets will experience a smaller drop in share value, since these firms have access toalternative sources of financing when their main banks are in financial distress. Toexamine the possible substitution effect of bank financing, we use a dummy variablethat takes the value of one if the firm has an American Depositary Receipt (ADR)listed in the United States. LLSV (1998) and JBBF (2000) argue that the accountingstandard is an important element of corporate governance and Mitton (2002)suggests that firms with a listed ADR have higher disclosure quality. Reese andWeisbach (2002) also argue that one reason why non-US firms choose to cross-list inthe US is the protection of minority shareholder rights associated with Securities andExchange Commission (SEC) registration. Therefore, another reason for using an
ARTICLE IN PRESSJ.-S. Baek et al. / Journal of Financial Economics 71 (2004) 265–313272

ADR dummy in our analysis is to examine whether or not increasing transparencyleads to better stock price performance during the crisis.
Corporate diversification. Mitton (2002) argues that diversified firms suffer more lossof value during a crisis than focused firms since expropriation of minority shareholdersis likely to be more severe. Lins and Servaes (2002) also argue that the severe marketimperfections found in emerging markets increase the potential agency costsassociated with diversification and that greater asymmetric information allowsmanagement and large shareholders to exploit minority shareholders more easily.Consistent with these arguments, Lins and Servaes find that diversified firms from EastAsian markets trade at a discount of approximately 7% compared to single-segmentfirms. Fauver et al. (2003), however, show that the value of diversification is negativelyrelated to the level of capital market development and international integration.Following Mitton (2002), we use three measures of diversification in this paper.
The first variable is a dummy variable that is equal to zero if 90% or more of a firm’ssales come from one three-digit SIC.2 The second variable is the number of industriesin which the firm operates. The third variable is the diversity of investmentopportunities, similar to that used in Rajan et al. (2000). We identify competingundiversified firms for each segment of diversified firms at a four-digit SIC level andmeasure the standard deviation of the Tobin’s q (book value of debt plus marketvalue of equity/total assets) of matched undiversified firms for all segments of adiversified firm. When there are multiple matched undiversified firms for eachsegment of a diversified firm, we use the average of their Tobin’s q as a measure forthe segment’s Tobin’s q:Diversified firms with standard deviations above (below) themedian for all diversified firms are defined as having high (low) variation ofinvestment opportunities.
2.2. Other control variables
Financial investments in affiliated and non-affiliated-firms. Johnson, La Porta,Lopez-de-Silanes, and Shleifer (2000) argue that business groups provide con-trolling shareholders with an opportunity to transfer wealth to themselves from thefirm. Using data from financial investments in affiliated and nonaffiliated firms, Joh(2003) finds that financial investment in nonaffiliated firms raises firm profitabilitybefore the crisis, but financial investment in affiliated firms lowers its profitability.These results suggest inefficiency in resource allocation among member firms withinthe same chaebol and support the tunneling view of Johnson, La Porta, Lopez-de-Silanes, and Shleifer (2000). We measure financial investments in affiliated(nonaffiliated) firms as the ratio of financial securities invested in affiliated(nonaffiliated) firms to the firm’s total assets.
Leverage and foreign debt. Lang and Stulz (1992) and Opler and Titman (1994)find that firms that maintain a high leverage ratio and have specialized business linestend to experience more difficulties during economic downturns. Since highly
ARTICLE IN PRESS
2When we use two-digit SIC as in Mitton (2002), we find hardly any diversified firms in our sample.
J.-S. Baek et al. / Journal of Financial Economics 71 (2004) 265–313 273

leveraged firms would have more difficulty obtaining external financing during acrisis, we would expect such firms to experience a larger drop in equity value.The financial crisis of Korea in November 1997 can be characterized by a large
drop in the value of its currency. The exchange rate at the end of October 1997,approximately one month before Korea sought a rescue package from theInternational Monetary Fund (IMF), was 902 won per US dollar. By the end ofDecember 1997, the rate had gone up to 1,836 won per dollar, effectively devaluingthe won by more than 100%. This sharp fall in the currency price means that firmswith a higher fraction of foreign debt in their capital structures suffered more. Wecalculate the foreign debt ratio as the ratio of borrowings from foreign financialinstitutions and foreign firms to the total debt.3 The currency crisis in Korea alsosuggests that the ability of firms to secure foreign capital should have a positive effecton their market value. We use the ratio of exports to sales to measure this ability.
Liquidity. When firms experience a large economic shock, they can turn to externalcapital markets and/or internally generated cash flows as well as curtailing newinvestments. Less financially constrained firms or firms with internal sources offinancing should therefore suffer fewer difficulties. As a measure of liquidity, we usethe ratio of cash flow to total assets and the ratio of liquid assets to total assets. Wecompute cash flow as the sum of operating income and depreciation. Liquid assetsconstitute cash plus marketable securities.
Size. Large firms generally find it easier to secure external finance, are less likely torely mostly on bank borrowing for their financing, will have smaller informationalasymmetries, and are more established than smaller firms. They also tend to have alarge asset base that can be used as collateral. All these factors suggest that largefirms are less vulnerable to external shock. We measure firm size as the logarithm oftotal assets.
Risk and performance. Risky firms generally have a high default risk and aretherefore more vulnerable to external shock. Similarly, firms with poor pastperformance are highly likely to suffer from financial difficulties during a crisis andthus are more likely to lose out on growth opportunities in the future. Thesearguments imply a negative relationship between risk and firm value and a positiveassociation between past performance and value. Risk is measured by beta, which isestimated by the slope of the market model regression. We use one-year daily stockreturns during the 1996 period to estimate beta. Past performance is measured byTobin’s q:Finally, we control for other factors such as a firm’s market share and the ratio of
advertising expenses to total assets.
3. Sample selection and data
Our sample consists of 644 nonfinancial firms listed on the Korean StockExchange (KSE) between November 1997 and December 1998. We focus on the
ARTICLE IN PRESS
3 JBBF (2000) find that the indebtedness of Asian countries is not related to exchange rate depreciation
during the crisis of 1997–1998.
J.-S. Baek et al. / Journal of Financial Economics 71 (2004) 265–313274

period November 1997–1998 for several reasons. Firstly, the Korean governmentabandoned the defense of the currency on November 18, 1997 to control thefinancial crisis and sought a rescue package from the IMF on November 22, 1997.Secondly, the stock market index plummeted from 520 just prior to the shock to itslowest point, just above 300, by the end of December 1997. Finally, many Koreanfirms announced and implemented various restructuring activities intended tocombat the crisis during this period.We obtain the stock price data for the firms from the daily return files of the Korea
Investors Service-Stock Market Analysis Tool (KIS-SMAT) and Stock Database ofthe Korea Securities Research Institute (KSRI), both of which include all firms listedon the KSE. Financial data are obtained from the Listed Company Database of theKorean Listed Companies Association. We identify each firm’s chaebol affiliationusing the KFTC’s Annual Statistics.In Table 1, we present the summary statistics for the entire sample of 644 firms at
the end of the fiscal year 1996, which immediately precedes the financial crisis. PanelA of Table 1 summarizes the descriptive statistics for ownership structure and othergovernance characteristics of the sample firms. We divide the sample firms intochaebol and non-chaebol firms, where chaebol firms are those that belong to any ofthe top 30 business groups as of the end of fiscal year 1996. Chaebols account for23% of sampled firms.The largest blockholder concentration, as measured by the block holdings
of the largest shareholder owning 5% or more of issued shares, has a lower meanand median value for chaebol firms than for non-chaebol firms. The furtherbreakdown of the largest blockholder concentration shows that affiliated firms holda substantial portion of block ownership in chaebol firms, but owner-managers andtheir families hold a substantial portion of block ownership in non-chaebol firms.The average largest block ownership by owner-managers and their family membersin chaebol firms is only 3.9% as opposed to 13.8% in non-chaebol firms. The test ofthe difference in mean ownership across the two subsamples rejects the nullhypotheses of equal ownership. The relatively small block ownership by owner-managers and their family members in chaebol firms is supplemented by therelatively large contribution of affiliated firms. The largest affiliated blockholdershold an average of 12.4% of outstanding equity in chaebol firms. In contrast, theseblockholders hold only 4.9% of outstanding equity in non-chaebol firms. Theseresults suggest that cross-shareholding is more prevalent among chaebol than non-chaebol firms. The mean largest blockholder concentration by unaffiliated investorsis also larger for chaebol than non-chaebol firms. The medians show a similarpattern.The finding that the largest blockholders in chaebol firms are not usually owner-
managers and their family members is confirmed by the descriptive statistics for thelargest managerial blockholder concentration, block holdings by owners involvedwith management. The average largest managerial blockholder concentration is4.6% for chaebol firms and 13.2% for non-chaebol firms. This difference isstatistically significant at the 0.01 level. In contrast, the largest nonmanagerialblockholder concentration (block holdings by largest shareholders who are not
ARTICLE IN PRESSJ.-S. Baek et al. / Journal of Financial Economics 71 (2004) 265–313 275

ARTIC
LEIN
PRES
S
Table 1
Descriptive statistics of firm characteristics
The sample includes 644 nonfinancial firms listed on the Korean Stock Exchange (KSE) between November 1997 and December 1998. Bank loan data are
obtained from firms’ annual audit reports and other financial data from the Listed Company Database of the Korean Listed Companies Association. The stock
price data are from the daily return files of the Korea Investors Service-Stock Market Analysis Tool and Stock Database of the Korea Securities Research
Institute. The summary statistics are the values at the end of fiscal year 1996 except for beta, which is estimated by the slope of the market model regression
using one-year daily returns during 1996. Chaebol firms are those belonging to one of the 30 largest business groups in Korea. Largest blockholder
concentration denotes block holdings by the largest shareholder who owns 5% or more of issued shares. Largest managerial blockholder concentration refers to
block holdings by owners involved with management and largest nonmanagerial blockholder concentration to block holdings by other largest shareholders.
Summed blockholder concentration is the sum of block holdings by all shareholders owning 5% or more of issued shares. Total equity ownership by all
controlling shareholders is the sum of equity ownerships by controlling families and affiliated firms. Equity ownership by domestic institutional investors
denotes ownership by domestic financial institutions and other corporations who are not affiliated with the firm. Cash flow rights of controlling shareholders are
the sum of direct equity ownership and the product of the ownership stakes obtained indirectly along the chain of a pyramid structure for controlling
shareholders. Voting rights of controlling shareholders are the sum of direct equity ownership and the minimum of the level of ownership in the pyramid
structure. The list of main banks is obtained from the Annual Statistics published by the Korean Listed Companies Association. Although a firm can borrow
from several banks, the Annual Statistics lists only one as the main bank that provides the major (but not necessary the largest) segment of the firm’s financing.
Firms are classified as undiversified if 90% or more of sales come from one three-digit SIC. Financial investment in affiliated (nonaffiliated) firms means
financial securities invested in affiliated (nonaffiliated) firms. Numbers in brackets denote the medians.
By chaebol affiliationTotal
Chaebolfirms
Non-chaebolfirms
Test ofdifference
(N=644) (N=148) (N=496) (p-value)
t-test Wilcoxonz-test
Panel A: Ownership structure and other governance characteristicsPercentage of firms belonging to top 30 chaebols 22.98 100.00 — — —
Largest blockholder concentration (%) 18.945 17.811 19.272 0.149 0.078[16.92] [15.84] [17.13]
By owner-managers and their family members 11.657 3.937 13.817 0.000 0.000[10.73] [0.00] [13.07]
By affiliated firms 6.551 12.362 4.875 0.000 0.000[0.00] [9.34] [0.00]
By unaffiliated investors 0.787 1.512 0.579 0.011 0.000[0.00] [0.00] [0.00]
Largest managerial blockholder concentration (%) 11.195 4.564 13.175 0.004 0.000
J.-S
.B
aek
eta
l./
Jo
urn
al
of
Fin
an
cial
Eco
no
mics
71
(2
00
4)
26
5–
31
3276

ARTIC
LEIN
PRES
S[9.44] [0.00] [11.88]
Largest nonmanagerial blockholder concentration (%) 11.422 15.511 10.258 0.000 0.000[8.70] [12.56] [7.78]
Summed blockholder concentration (%) 30.940 29.482 31.366 0.227 0.093[29.58] [28.71] [29.66]
By owner-managers and their family members 17.401 7.010 20.370 0.000 0.000[15.98] [0.00] [18.68]
By affiliated firms 9.532 17.082 7.375 0.000 0.000[0.00] [15.12] [0.00]
By unaffiliated investors 4.054 5.389 3.620 0.001 0.003[0.00] [0.00] [0.00]
Total equity ownership by all controlling shareholders (%) 29.244 26.556 30.024 0.017 0.006[28.09] [24.67] [28.78]
By owner-managers and their family members 20.241 9.034 23.497 0.000 0.000[20.02] [4.92] [23.83]
By affiliated firms 9.002 17.522 6.527 0.000 0.000[0.00] [15.60] [0.00]
Total equity ownership by all unaffiliated investors (%) 32.070 51.374 26.302 0.000 0.000[29.66] [52.80] [24.80]
By domestic institutional investors 27.250 44.167 22.195 0.000 0.000[25.06] [45.30] [20.75]
By foreigners 4.820 7.206 4.106 0.000 0.000[1.49] [4.08] [1.03]
Cash flow rights of controlling shareholders: using data on equity ownership by all shareholders (%) 21.797 11.245 25.152 0.000 0.000[21.77] [6.84] [25.28]
Voting rights of controlling shareholders: using data on equity ownership by all shareholders (%) 24.833 17.805 26.695 0.000 0.000[24.51] [16.77] [26.66]
Voting rights/cash flow rights of controlling shareholders: using data on equity ownership by all 3.853 5.831 1.277 0.000 0.000shareholders (%) [1.00] [1.55] [1.00]Cash flow rights of controlling shareholders: using data on equity ownership by blockholders (%) 21.023 9.726 24.345 0.000 0.000
[21.23] [4.98] [24.89]Voting rights of controlling shareholders: using data on equity ownership by blockholders (%) 21.696 10.757 24.922 0.000 0.000
[21.76] [4.98] [25.37]Voting rights/cash flow rights of controlling shareholders: using data on equity ownership by 1.057 1.222 1.025 0.000 0.026blockholders (%) [1.00] [1.00] [1.00]Bank loans/total assets 0.334 0.314 0.340 0.059 0.165
[0.32] [0.32] [0.32]Loans from main bank/total assets 0.094 0.047 0.109 0.093 0.000
[0.05] [0.02] [0.06]Percentage of firms with an ADR 2.33 8.11 0.60 0.001 —Percentage of diversified firms 32.66 36.17 31.57 0.319 —
J.-S
.B
aek
eta
l./
Jo
urn
al
of
Fin
an
cial
Eco
no
mics
71
(2
00
4)
26
5–
31
3277

ARTIC
LEIN
PRES
S
Panel B: Financial characteristicsTotal asset (billion won) 610.834 1642.303 303.056 0.000 0.000
[156.781] [776.088] [113.379]Total market value of equity (billion won) 149.002 315.014 99.668 0.000 0.000
[48.153] [131.200] [36.872]Total debt/total assets 0.721 0.774 0.705 0.000 0.000
[0.699] [0.784] [0.661]Bond debt/total assets 0.206 0.223 0.201 0.137 0.037
[0.183] [0.199] [0.178]Foreign debt/total assets 0.074 0.092 0.068 0.027 0.000
[0.034] [0.058] [0.025]Cash flow (operating income+depreciation)/total assets 0.052 0.054 0.051 0.450 0.768
[0.054] [0.055] [0.053]Net income/total assets 0.000 0.001 �0.001 0.542 0.003
[0.009] [0.005] [0.010]Liquid assets (cash+marketable securities)/total assets 0.095 0.055 0.107 0.000 0.768
[0.069] [0.034] [0.084]Tobin’s q 1.099 1.023 1.121 0.005 0.000
[0.997] [0.961] [1.020]Beta 0.8521 0.919 0.830 0.002 0.003
[0.915] [0.971] [0.896]Exports/sales 0.224 0.258 0.237 0.356 0.267
[0.176] [0.213] [0.163]Advertising expenses/sales 0.012 0.008 0.013 0.007 0.027
[0.002] [0.003] [0.001]Financial investment to affiliated firms/total assets 0.089 0.095 0.087 0.487 0.161
[0.047] [0.059] [0.044]Financial investment to unaffiliated firms/total asset 0.034 0.030 0.043 0.998 0.208
[0.000] [0.000] [0.000]Market share in 4-digit industry 0.094 0.179 0.067 0.000 0.000
[0.034] [0.089] [0.023]
Table 1. (Continued )
By chaebol affiliation
TotalChaebol
firms
Non-chaebol
firms
Test of
difference
(N=644) (N=148) (N=496) (p-value)
t-test Wilcoxon
z-test
J.-S
.B
aek
eta
l./
Jo
urn
al
of
Fin
an
cial
Eco
no
mics
71
(2
00
4)
26
5–
31
3278

associated with management) averages at 15.5% for chaebol firms and 10.3% fornon-chaebol firms. This difference is also significant at the 0.01 level.When we measure the ownership concentration by the sum of block holdings by
all shareholders who own 5% or more of issued shares (summed blockholderconcentration), we again find the results that are similar to those using the largestblockholder concentration. These differences in ownership concentration betweenchaebol and non-chaebol firms become much stronger when we look at total equityownership by all controlling shareholders, not just blockholders.The average total equity ownership by domestic institutional investors not
affiliated with the firm is 27.3% for the sample as a whole, being larger for chaebolthan non-chaebol firms. Equity ownership by foreign investors across the totalsample averages 4.8%. Again, this is larger for chaebol than non-chaebol firms.When we include data on equity ownership by all shareholders, not just
blockholders, the average cash flow rights and voting rights of controllingshareholders for the sample as a whole are 21.8% and 24.8% respectively. Asexpected, the average ratio of voting rights to cash flow rights is significantly higherfor chaebol than non-chaebol firms (5.8 versus 1.3). The fact that the discrepancy islarger in chaebol firms suggests that their controlling shareholders find it easier toengage in expropriation and that such firms have a particularly serious agencyproblem between controlling and minority shareholders. Cash flow rights and votingrights of controlling shareholders measured using block holdings data show a similarpattern.For the total sample, the average ratio of bank debt to total assets is 33.4% and
the average ratio of main bank debt to total assets is 9.5%. The average ratio ofloans from the main bank to total assets for chaebol firms is 4.7% and for non-chaebols is 10.9%. The differences in mean and median ratios are statisticallysignificant, indicating that non-chaebol firms tend to borrow more from their mainbanks than their chaebol counterparts and that such loans are an important sourceof their financing.Sixteen firms in our sample (2.3%) had an ADR listed in the US, of which a
disproportionate fraction is chaebol firms. Diversified firms account for 32.7% of thetotal sample. There is no significant difference in the proportion of diversified firmsbetween the group of chaebol and non-chaebol firms.Panel B of Table 1 summarizes the financial characteristics of our sample firms. It
can be seen that chaebol firms are substantially larger than non-chaebol firms whenmeasured in terms of total asset. The average total asset size of chaebol firms is morethan five times that of non-chaebol firms. This difference in firm size is statisticallysignificant at the 0.01 level. The medians show a similar pattern.Leverage, which we measure by the ratio of total debt to total assets, is also
significantly different between the two groups. The mean leverage ratios for chaeboland non-chaebol firms are 77.4% and 70.5%, respectively. For the total sample, theaverage ratio of bond debt to total assets is 20.6%. The average Korean firmborrows about 7.4% of its total assets from foreign financial institutions andcompanies. Comparing chaebol to non-chaebol firms, we find that the chaebols usemore bond and foreign debt.
ARTICLE IN PRESSJ.-S. Baek et al. / Journal of Financial Economics 71 (2004) 265–313 279

The ratios of cash flow (operating income+depreciation) to total assets forchaebol and non-chaebol firms are on average 5.4% and 5.1% and those of netincome to total assets 0.1% and �0.1%, respectively. The average ratios of liquidassets to total asset for chaebol and non-chaebol firms are 5.5% and 10.7%,respectively. Although the mean differences in cash flow and net income ratiosbetween chaebol and non-chaebol firms are not statistically significant, those inliquidity ratios are significant at the 0.01 level.The performance variable measured by Tobin’s q is significantly higher for non-
chaebol than chaebol firms. This indicates that on average, non-chaebol firms wereoutperforming chaebol firms immediately before the financial crisis. The comparisonof risk variables reveals that beta is significantly higher for chaebol firms.The average ratio of exports to sales is 25.8% for chaebol firms and 23.7% for
non-chaebols. These differences in export ratios between chaebol and non-chaebolfirms are not significant. It is noteworthy that the ratio of exports to sales and theratio of foreign debt to total assets are positively correlated (r=0.3344), indicatingthat firms that export more tend to borrow more from overseas financial marketsand vice versa.Across the whole sample, the average level of investment in affiliated firms’ financial
securities is 8.9% (3.4% for unaffiliated firms’ securities). There are no statisticallysignificant differences between chaebol and non-chaebol firms in these two measures.
4. Empirical results
4.1. The effect of external shock on firm value
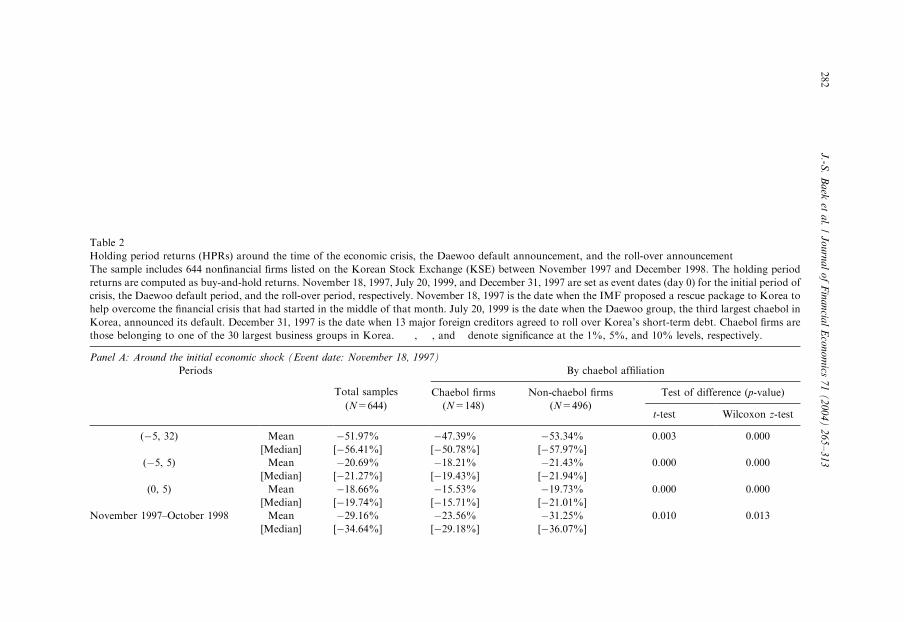
We use buy-and-hold returns around the event date to gauge the magnitude of theeconomic shock borne by firms. We set November 18, 1997 as an initial event date,the day on which the IMF proposed the rescue package to Korea to help thefinancial crisis that had started with a sharp decline of the Korean won against theUS dollar earlier that month. We then measure the effect of the shock on firm valueby computing the holding period return (HPR) from five days before the event date(November 12, 1997) to 32 days after the event date (December 28, 1997).Specifically, we compute the HPR (�5, 32) as
HPRið�5; 32Þ ¼ ð1þ Ri;�5Þð1þ Ri;�4Þð1þ Ri;�3Þ
ð1þ Ri;�2Þ?ð1þ Ri;32Þ � 1 ð1Þ
where Ri;t is the daily return of firm i at time t: Different HPRs such as HPR (�5, 5),HPR (0, 5), and HPR (November 1997, October 1998) are also calculated.We expect that the measurement period of (�5, 32) is long enough to reflect the
impact of the external shock on firm value. For example, during this initial shockperiod, negative events concerning the Korean economy emerged on an almosteveryday basis, which had an adverse effect on the value of firms. (See Appendix Afor a list of the major events from November 1997 to December 1997.) The Koreanwon plunged to its lowest level on December 24, 1997, and several financial
ARTICLE IN PRESSJ.-S. Baek et al. / Journal of Financial Economics 71 (2004) 265–313280

institutions and firms went bankrupt during our measurement period, so the effect ofadverse shocks was fully incorporated into firms’ stock price performance.Therefore, the selected period is likely to provide robust enough information forthe assessment of the impact of the crisis on firm value.We also consider two additional event dates, December 31, 1997 and July 20,
1999. The former is the date when 13 major foreign creditors agreed to roll overKorea’s short-term debt and the latter the date on which the Daewoo group, thethird largest chaebol in Korea, announced it was defaulting.Table 2 summarizes the HPRs of our sample of 644 firms around each event date.
Panel A of Table 2 shows the HPRs around the initial shock period. The mean andmedian HPRs ð�5; 32Þ are �52.0% and�56.4%, respectively, both of which aresignificant at the 0.01 level. The subsample results show that the mean and medianHPRs ð�5; 32Þ for chaebol firms are �47.4% and �50.8%, and those for non-chaebol firms �53.3% and �58.0%. Tests for differences in the mean and medianHPRs ð�5; 32Þ between chaebol and non-chaebol firms are strongly rejected at the0.01 level. The mean and median HPRs for other intervals show similar patterns.Our results therefore suggest that chaebol affiliation makes a firm less sensitive tofinancial crisis.Panel B of Table 2 shows the HPRs around the time of the default announcement
from the Daewoo group. It can be seen that this has a greater adverse effect on themarket value of chaebol than non-chaebol firms during short event windows such asð�5; 5Þ and ð0; 5Þ; but that there is no discernible difference during the long eventwindow. The mean and median HPRs ð�5; 5Þ for chaebol firms are �11.2% and�13.1%, and those for non-chaebol firms �5.6% and �10.7%. The differencesbetween the two subgroups are statistically significant. In contrast, the mean andmedian HPRs ð�5; 30Þ for chaebol firms are �9.9% and �13.5%, showing nosignificant difference from non-chaebol firms (�10.9% and �17.0%).Panel C of Table 2 shows the HPRs around the time of the roll-over
announcement of Korea’s debt. The mean and median HPRs ð�5; 30Þ for the totalsample are 33.3% and 28.2%, both of which are significant at the 0.01 level. Forchaebol firms, the mean HPR is 24.1%, with a median of 18.2%. Both t-tests for themean as well as the sign-rank tests for the median reject equality from zero at the0.01 level. For non-chaebol firms, the mean and median HPRs are 35.9% and30.8%. Equality of HPRs ð�5; 30Þ between chaebol and non-chaebol firms is rejectedusing both t-tests and Wilcoxon sign-rank tests. These results suggest that the creditroll-over was more favorable for small non-chaebol firms. The mean and medianHPRs for other intervals show similar patterns.In unreported tests, we also check the performance of firms belonging to the top
four chaebols (Hyundai, Samsung, LG, and Daewoo) separately around each eventdate. During the initial shock, firms belonging to the Samsung and LG groupsperformed better than those belonging to the Daewoo and Hyundai groups, whichdefaulted on their debts in 1999 and 2000, respectively. The average HPRs ð�5; 32Þfor firms belonging to the Samsung and LG groups are �34.4% and �33.6%, andfor those belonging to the Daewoo and Hyundai groups �42.5% and �37.4%.However, the differences in average HPRs between any two of the groups are not
ARTICLE IN PRESSJ.-S. Baek et al. / Journal of Financial Economics 71 (2004) 265–313 281
ARTIC
LEIN
PRES
S
Table 2
Holding period returns (HPRs) around the time of the economic crisis, the Daewoo default announcement, and the roll-over announcement
The sample includes 644 nonfinancial firms listed on the Korean Stock Exchange (KSE) between November 1997 and December 1998. The holding period
returns are computed as buy-and-hold returns. November 18, 1997, July 20, 1999, and December 31, 1997 are set as event dates (day 0) for the initial period of
crisis, the Daewoo default period, and the roll-over period, respectively. November 18, 1997 is the date when the IMF proposed a rescue package to Korea to
help overcome the financial crisis that had started in the middle of that month. July 20, 1999 is the date when the Daewoo group, the third largest chaebol in
Korea, announced its default. December 31, 1997 is the date when 13 major foreign creditors agreed to roll over Korea’s short-term debt. Chaebol firms are
those belonging to one of the 30 largest business groups in Korea. ���, ��, and � denote significance at the 1%, 5%, and 10% levels, respectively.
Panel A: Around the initial economic shock (Event date: November 18, 1997)
Periods By chaebol affiliation
Total samples Chaebol firms Non-chaebol firms Test of difference (p-value)
(N=644) (N=148) (N=496)t-test Wilcoxon z-test
(�5, 32) Mean �51.97%��� �47.39%��� �53.34%��� 0.003 0.000
[Median] [�56.41%]��� [�50.78%]��� [�57.97%]���
(�5, 5) Mean �20.69%��� �18.21%��� �21.43%��� 0.000 0.000
[Median] [�21.27%]��� [�19.43%]��� [�21.94%]���
(0, 5) Mean �18.66%��� �15.53%��� �19.73%��� 0.000 0.000
[Median] [�19.74%]��� [�15.71%]��� [�21.01%]���
November 1997–October 1998 Mean �29.16%��� �23.56%��� �31.25%��� 0.010 0.013
[Median] [�34.64%]��� [�29.18%]��� [�36.07%]���
J.-S
.B
aek
eta
l./
Jo
urn
al
of
Fin
an
cial
Eco
no
mics
71
(2
00
4)
26
5–
31
3282

ARTIC
LEIN
PRES
SPanel B: Around the default announcement of the Daewoo group (Event date: July 20, 1999)
Periods By chaebol affiliation
Total samples Chaebol firms Non-chaebol firms Test of difference (p-value)
(N=619) (N=147) (N=472)t-test Wilcoxon z-test
(�5, 30) Mean �10.41%��� �9.86%��� �10.91%��� 0.737 0.201
[Median] [�16.48%]��� [�13.52%]��� [�17.01%]���
(�5, 5) Mean �6.59%��� �11.21%��� �5.62%��� 0.002 0.016
[Median] [�11.11%]��� [�13.07%]��� [�10.71%]���
(0, 5) Mean �5.64%��� �8.74%��� �4.84%��� 0.000 0.049
[Median] [�6.83%]��� [�7.72%]��� [�6.58%]���
Panel C: Around the roll-over announcement (Event date: December 31, 1997)
Periods Total samples By chaebol affiliation
(N=644)Chaebol firms Non-chaebol firms Test of difference (p-value)
(N=148) (N=496)t-test Wilcoxon z-test
(�5, 30) Mean 33.26%��� 24.07%��� 35.94%��� 0.002 0.001
[Median] [28.21%]��� [18.21%]��� [30.77%]���
(�5, 5) Mean 3.92%��� 0.99%��� 4.77%��� 0.065 0.039
[Median] [2.50%]��� [0.01%]��� [3.23%]���
(0, 5) Mean 16.01%��� 12.08%��� 17.15%��� 0.000 0.000
[Median] [16.88%]��� [9.84%]��� [19.01%]���
J.-S
.B
aek
eta
l./
Jo
urn
al
of
Fin
an
cial
Eco
no
mics
71
(2
00
4)
26
5–
31
3283
significant. At the time of the Daewoo group’s default announcement, firmsbelonging to that group suffered substantially, showing an average HPR (�5, 30) of�67.6%, while those belonging to the Hyundai, Samsung, and LG groupsexperienced insignificant average HPRs (�5, 30) of �5.7%, 9.1%, and 10.1%. Incontrast, it was the Samsung group that performed the best during the roll-overperiod. The average HPR (�5,30) for its firms is 72.3%. The corresponding HPRsfor firms belonging to the Hyundai, LG, and Daewoo groups are 27.2%, 21.9%, and22.4%. The tests of differences in mean HPRs between the Samsung group and theother three reject the null hypothesis of equal returns.
4.2. The determinants of firm value
To understand the cross-sectional variation in firm returns, we present theestimates from multivariate regressions.
4.2.1. Replication of previous research
Before we move on to a detailed analysis of the effects of corporate governance onfirm values, we carry out a replication of previous research. Table 3 replicates thetests performed by Mitton (2002) to determine whether or not his results hold for thelarge sample of firms used in our study. The dependent variable is the HPR (�5, 32)around the initial shock period and the independent variables are the values at theend of the fiscal year 1996. We also include four industry dummy variables(construction, manufacturing, wholesale and retail, and transportation and services)to control for a possible industry effect in all regressions. To conserve space, thetable does not report coefficients on these industry dummies.4
In Panel A of Table 3, we use equity ownership by blockholders and disclosurequality of firms as corporate governance measures. In regressions (1), (3), and (5), weregress HPRs (�5, 32) on largest blockholder concentration, summed blockholderconcentration, and the ADR dummy, respectively. The results show that thecoefficients on these variables are all significant and positive at the 0.01 level,suggesting that firms with higher ownership concentration and higher disclosurequality were less affected by the crisis. These results are consistent with those ofMitton (2002). In regressions (2), (4), and (6), we control for firm size and leverageratio and find that it does not change the results. The coefficients on the size variableare significant and positive at the 0.01 level, suggesting that large firms are better ableto overcome a financial crisis. As expected, the coefficients on the leverage ratio aresignificant and negative in regressions (2) and (4).In Panel B of Table 3, we use equity ownership by the largest managerial and
nonmanagerial blockholders as proxies for corporate governance. In regressions (1)
ARTICLE IN PRESS
4Following Mitton (2002), we do not control for the correlation of the stock return with the market
movement. Instead, we control for factors that could affect the stock return by including firm size,
leverage, and industry dummies in the regressions. However, since the market performed poorly during a
crisis period, one would expect high beta stocks to perform poorly. To make sure that our results are not
just driven by the fact that some firms are always more correlated with market movements than others, in
Section 4.2.1, we explicitly control for the market risk by including beta in the regressions.
J.-S. Baek et al. / Journal of Financial Economics 71 (2004) 265–313284

ARTIC
LEIN
PRES
S
Table 3
OLS regression of the holding period returns (�5, 32) on governance characteristics: Replication of Mitton (2002)
The sample includes 644 nonfinancial firms listed on the Korean Stock Exchange (KSE) between November 1997 and December 1998. The dependent variable
is the holding period return (�5, +32). November 18, 1997 is set as an event day (day 0), which is the date when the IMF proposed a rescue package to Korea
to help overcome the financial crisis that had started in the middle of that month. Independent variables are the values at the end of the fiscal year 1996.
Largest blockholder concentration denotes block holdings by the largest shareholder owning 5% or more of issued shares. Summed blockholder concentration
is the sum of block holdings by all shareholders owning 5% or more of issued shares. The ADR dummy takes the value of one if the firm’s stock is listed on the
US stock exchanges. Largest managerial blockholder concentration refers to block holdings by owners involved with management and largest nonmanagerial
blockholder concentration to block holdings by other largest shareholders. Cash flow rights of controlling shareholders are the sum of direct equity ownership
and the product of the ownership stakes obtained indirectly along the chain of a pyramid structure for controlling shareholders. Voting rights of controlling
shareholders are the sum of direct equity ownership and the minimum of the level of ownership in the pyramid structure. Pyramidal ownership structure
dummy takes the value of one if the controlling shareholder controls the firm through indirect as well as direct ownership. Diversification dummy takes the
value of zero if 90% or more of a firm’s sales come from one three-digit SIC. Number of industries denotes the number of industries in which the firm operates.
Firms are classified as having high (low) variation if the standard deviation of the Tobin’s q ratios of matched nondiversified firms for all segments of a
diversified firm is above (below) the median for all diversified firms. Numbers in parentheses are t-statistics. ���, ��, and � denote significance at the 1%, 5%,
and 10% levels, respectively.
Panel A: Equity ownership by blockholders and disclosure quality
(1) (2) (3) (4) (5) (6)
Intercept �0.528��� �1.357��� �0.582��� �1.454��� �0.517��� �1.155���
[�14.93] [�9.49] [�16.17] [�10.31] [�18.05] [�7.77]Largest blockholder concentration 0.236��� 0.279���
[2.60] [3.20]
Summed blockholder concentration 0.324��� 0.348���
[5.41] [6.05]
ADR dummy 0.349��� 0.234���
[5.84] [3.67]
Log (total assets) 0.047��� 0.048��� 0.034���
[6.62] [7.01] [4.63]
Total debt/total assets �0.115��� �0.103��� �0.042[�3.22] [�2.94] [�1.40]
Industry dummies Yes Yes Yes Yes Yes Yes
Adjusted R2 0.012 0.088 0.047 0.126 0.051 0.082
F -value 2.885 10.713 8.541 15.487 9.590 10.499
Number of sample 601 601 602 602 638 638
J.-S
.B
aek
eta
l./
Jo
urn
al
of
Fin
an
cial
Eco
no
mics
71
(2
00
4)
26
5–
31
3285

ARTIC
LEIN
PRES
S
Panel B: Equity ownership by the largest managerial and nonmanagerial blockholders
(1) (2) (3) (4) (5) (6)
Intercept �0.489��� �1.332��� �0.520��� �1.232��� �0.537��� �1.356���
[�14.62] [�8.85] [�15.68] [�8.70] [�15.21] [�9.12]Largest managerial blockholder concentration �0.019 0.098 0.134 0.247���
[�0.22] [1.12] [1.41] [2.62]
Largest nonmanagerial blockholder concentration 0.308��� 0.274��� 0.363��� 0.366���
[3.61] [3.27] [3.87] [4.05]
Log (total assets) 0.046��� 0.041��� 0.046���
[6.37] [5.85] [6.33]
Total debt/total assets �0.108��� �0.125��� �0.118���
[�2.97] [�3.50] [�3.28]Industry dummies Yes Yes Yes Yes Yes Yes
Adjusted R2 0.002 0.074 0.023 0.088 0.024 0.097
F -value 1.202 8.945 4.484 10.657 3.990 10.201
Number of sample 600 600 600 600 600 600
Panel C: Cash flow rights and voting rights of controlling shareholders (using data on equity ownership by blockholders)
(1) (2) (3) (4) (5) (6)
Intercept �1.477��� �1.416��� �0.498��� �1.299��� �0.535��� �1.406���
[�9.90] [�9.55] [�15.77] [�8.73] [�13.60] [�9.60]Cash-flow rights of controlling shareholder 0.242���
[3.90]
Voting rights of controlling shareholder 0.187���
[2.88]
Voting rights/cash flow rights �0.001� �0.001�
[�1.78] [�1.98]Pyramidal ownership structure dummy 0.037 0.043
[1.10] [1.25]
Table 3. (Continued )
J.-S
.B
aek
eta
l./
Jo
urn
al
of
Fin
an
cial
Eco
no
mics
71
(2
00
4)
26
5–
31
3286
ARTIC
LEIN
PRES
SLog (total assets) 0.050��� 0.047��� 0.042��� 0.045���
[6.82] [6.46] [5.74] [6.57]
Total debt/total assets �0.0418 �0.044 �0.037 �0.033[�1.29] [�1.36] [�1.13] [�1.06]
Industry dummies Yes Yes Yes Yes Yes Yes
Adjusted R2 0.084 0.074 0.009 0.061 0.002 0.065
F -value 10.282 9.044 2.243 7.221 1.312 8.353
Number of sample 606 606 572 572 638 638
Panel D: Diversification and investment opportunities
(1) (2) (3) (4) (5) (6)
Intercept �0.474��� �1.252��� �0.451��� �1.181��� �0.474��� �1.275���
[�15.59] [�8.92] [�11.86] [�8.56] [�15.58] [�8.97]Diversification dummy �0.055��� �0.057���
[�2.74] [�2.94]Number of industries �0.048��� �0.053���
[�3.02] [�3.43]Diversification � �0.054�� �0.072���
high variation [�2.28] [�3.14]Diversification � �0.053� �0.029low variation [�1.83] [�1.02]Log (total assets) 0.044��� 0.043��� 0.045���
[6.58] [6.29] [6.48]
Total debt/total assets �0.117��� �0.133��� �0.122[�3.14] [�3.75] [�3.61]
Industry dummies Yes Yes Yes Yes Yes Yes
Adjusted R2 0.013 0.091 0.020 0.096 0.012 0.091
F -value 3.002 10.842 4.880 13.401 2.354 9.401
Number of sample 593 593 582 582 591 591
J.-S
.B
aek
eta
l./
Jo
urn
al
of
Fin
an
cial
Eco
no
mics
71
(2
00
4)
26
5–
31
3287
ARTIC
LEIN
PRES
S
Panel E: All governance variables combined
(1) (2) (3) (4)
Intercept �1.049��� �1.114��� �1.070��� �1.143���
[�7.01] [�6.99] [�7.05] [�7.09]ADR dummy 0.226�� 0.229��� 0.223��� 0.225���
[3.65] [3.70] [3.59] [3.63]
Largest managerial 0.238�� 0.237��
blockholder concentration [2.44] [2.43]
Largest nonmanagerial 0.295��� 0.292���
blockholder concentration [3.22] [3.19]
Diversification dummy �0.055��� �0.049��
[�2.86] [�2.50]Diversification � high variation �0.068��� �0.066���
[�2.97] [�2.86]Diversification � low variation �0.031 �0.016
[�1.10] [�0.56]Log (total assets) 0.034��� 0.034��� 0.035���
[4.34] [4.55] [4.48]
Total debt/total assets �0.112��� �0.119��� �0.113���
[�3.12] [�3.55] [�3.16]Industry dummies Yes Yes Yes Yes
Adjusted R2 0.109 0.121 0.109 0.121
F -value 11.391 9.632 10.010 8.795
Number of sample 593 566 591 564
Table 3. (Continued )J
.-S.
Ba
eket
al.
/J
ou
rna
lo
fF
ina
ncia
lE
con
om
ics7
1(
20
04
)2
65
–3
13
288

and (2), the coefficients on largest managerial blockholder concentration are shownto be insignificant, while in regressions (3) and (4), those on largest nonmanagerialblockholder concentration emerge as significant and positive at the 0.01 level. Whenwe include both the largest managerial and nonmanagerial blockholder concentra-tions in regression (5), the coefficient on largest managerial blockholder concentra-tion is again not significant, but that on largest nonmanagerial blockholderconcentration is significant and positive at the 0.01 level. These results confirm thework of Mitton (2002) and indicate that the presence of largest blockholders that arenot involved with management can reduce the agency problem between controllingand small shareholders during a crisis. However, the coefficients on both largestmanagerial and nonmanagerial blockholder concentrations become significant whenwe control for firm size and leverage ratio (regression (6)).Panel C of Table 3 regresses HPRs on cash flow rights and voting rights of
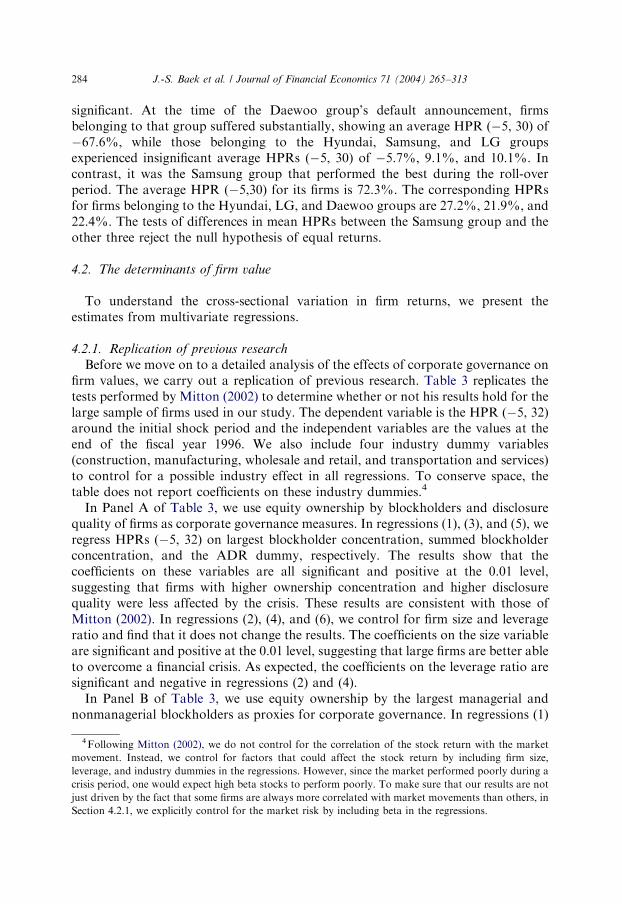
controlling block shareholders (regressions (1) and (2)), the ratio of voting rights tocash flow rights (regressions (3) and (4)), and the pyramidal ownership dummy thattakes the value of one if owner-managers control the firm through indirect as well asdirect ownership (regression (5) and (6)). In regressions (1) and (2), the coefficientson both cash flow rights and voting rights of controlling shareholders are significantand positive at the 0.01 level. However, in regression (3), the coefficient on the ratioof voting rights to cash flow rights, which represents the divergence between the cashflow rights and control rights of controlling shareholders, is significant and negativeat the 0.10 level. This result is consistent with the view that the separation of thecontrolling shareholders’ cash flow rights and control rights increases the incentivefor expropriation. Controlling for firm size and leverage in regression (4) does notchange the significance of the coefficient on the ratio of voting rights to cash flowrights. The coefficients on the pyramidal ownership dummy, however, are notsignificant in regressions (5) and (6). Overall, these results are consistent with thoseof Lemmon and Lins (2001), Mitton (2002), and Joh (2003).In Panel D of Table 3, we regress HPRs on diversification variables. The results
show that all three types of diversification measures including diversification dummy(regressions (1) and (2)), number of industries (regressions (3) and (4)), andinteraction between diversification dummy and high variation in investmentopportunity (regressions (5) and (6)) adversely affect firm value during an economiccrisis, again confirming the work of Mitton (2002).Panel E of Table 3 combines all the corporate governance variables considered in
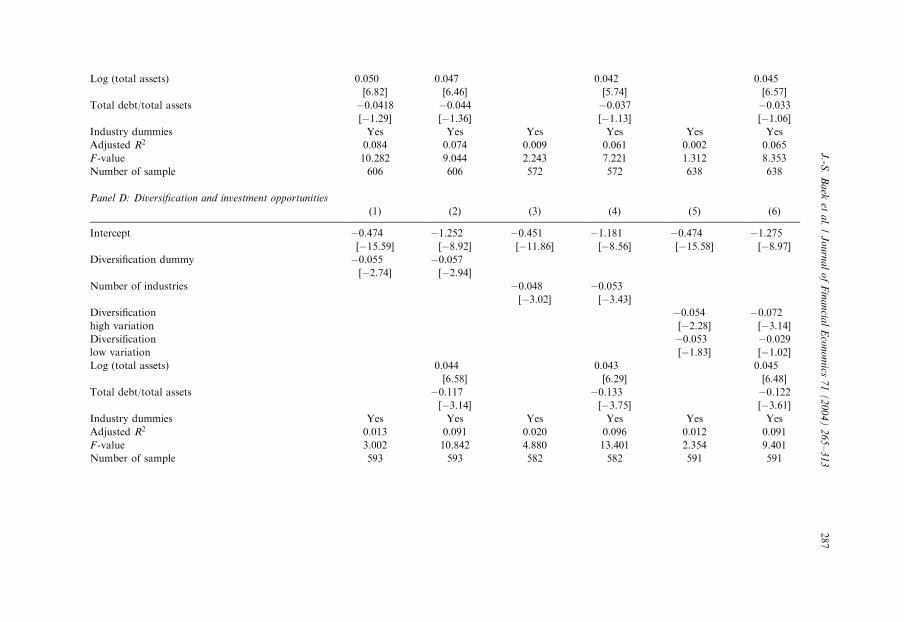
the previous panels. The coefficients on ADR dummy and the largest managerial andnonmanagerial blockholder concentration are significant and positive, while thoseon diversification measures are significant and negative. In summary, our results areconsistent with those of Mitton (2002) and further confirm the importance ofcorporate governance in determining firm values during an external economic shock.
4.2.2. Extension
To further examine the effect of corporate governance measures, we extend thespecifications of Mitton (2002) by considering the unique features of Koreanpractice. These results are reported in Table 4. In Panel A of Table 4, we
ARTICLE IN PRESSJ.-S. Baek et al. / Journal of Financial Economics 71 (2004) 265–313 289

ARTIC
LEIN
PRES
STable 4
OLS regression of the holding period returns (�5, 32) on governance characteristics: Extension of Mitton (2002)
The sample includes 644 nonfinancial firms listed on the Korean Stock Exchange (KSE) between November 1997 and December 1998. The dependent variable
is the holding period return (�5, +32). November 18, 1997 is set as an event day (day 0), which is the date when the IMF proposed a rescue package to Korea
to help overcome the financial crisis that had started in the middle of that month. Independent variables are the values at the end of the fiscal year 1996. Top 30
chaebol dummy takes the value of one if the firm belongs to one of the largest 30 chaebols. Largest blockholder concentration denotes block holdings by the
largest shareholder owning 5% or more of issued shares. Largest managerial blockholder concentration refers to block holdings by owners involved with
management and largest nonmanagerial blockholder concentration to block holdings by other largest shareholders. Cash flow rights of controlling
shareholders are the sum of direct equity ownership and the product of the ownership stakes obtained indirectly along the chain of a pyramid structure for
controlling shareholders. Voting rights of controlling shareholders are the sum of direct equity ownership and the minimum of the level of ownership in the
pyramid structure. Pyramidal ownership structure dummy takes the value of one if the controlling shareholder controls the firm through indirect as well as
direct ownership. Diversification dummy takes the value of zero if 90% or more of a firm’s sales come from one three-digit SIC. Number of industries denotes
the number of industries in which the firm operates. Firms are classified as having high (low) variation if the standard deviation of the Tobin’s q ratios of
matched nondiversified firms for all segments of a diversified firm is above (below) the median for all diversified firms. Numbers in parentheses are t-statistics.���, ��, and � denote significance at the 1%, 5%, and 10% levels, respectively.
Panel A: Chaebol affiliation and equity ownership by blockholders
(1) (2) (3) (4) (5) (6) (7) (8) (9)
Intercept �0.536��� �1.403��� �1.252��� �1.280��� �1.436��� �1.469��� �1.317��� �1.278��� �1.366���
[�17.42] [�8.62] [�8.29] [�7.59] [9.44] [�8.66] [�7.84] [�7.82] [�8.23]Top 30 chaebol dummy (a) 0.067��� �0.016 0.063 0.048 0.033 0.009 0.084�
[2.99] [�0.61] [1.23] [0.94] [1.03] [0.22] [1.74]
Largest blockholder concentration by 0.181� 0.241��
owner-managers and their family members (b) [1.74] [2.18]
Largest blockholder concentration 0.352��� 0.433���
by affiliated firms (c) [3.72] [3.90]
Largest blockholder concentration 0.548�� 0.626��
by unaffiliated investors (d) [2.09] [1.97]
a � b �0.583�
[�1.71]a � c �0.360�
[�1.63]a � d �0.481
[�0.82]Summed blockholder concentration by 0.296��� 0.335���
owner-managers and their family members (e) [4.09] [4.34]
J.-S
.B
aek
eta
l./
Jo
urn
al
of
Fin
an
cial
Eco
no
mics
71
(2
00
4)
26
5–
31
3290

ARTIC
LEIN
PRES
SSummed blockholder concentration 0.392��� 0.471��
by affiliated firms (f) [5.47] [5.51]
Summed blockholder concentration 0.351�� 0.306�
by unaffiliated investors (g) [2.52] [1.82]
a � e �0.391�
[�1.70]a � f �0.276�
[�1.73]a � g 0.128
[0.42]
Largest managerial blockholder 0.159� 0.324���
concentration (h) [1.68] [3.21]
Largest nonmanagerial blockholder 0.319��� 0.445���
Concentration (i) [3.30] [4.29]
a � h �0.530� �0.647��
[�1.89] [�2.19]a � i �0.162 �0.358�
[�0.82] [�1.70]Log (total assets) 0.048��� 0.042��� 0.042��� 0.045��� 0.046�� 0.045��� 0.044�� 0.045���
[5.70] [5.65] [4.90] [6.08] [5.33] [5.27] [5.15] [5.31]
Total debt/total assets �0.043 �0.122��� �0.120��� �0.032� �0.029� �0.104��� �0.127��� �0.115���
[�1.41] [�3.39] [�3.31] [�1.96] [�1.89] [�2.83] [�3.50] [�3.18]Industry dummies Yes Yes Yes Yes Yes Yes Yes Yes Yes
Adjusted R2 0.014 0.063 0.093 0.093 0.122 0.112 0.076 0.087 0.101
F -value 3.260 8.146 8.693 6.121 10.370 7.395 7.171 8.100 7.762
Number of sample 638 638 599 599 607 607 600 600 600
Panel B: Chaebol affiliation, equity ownership by all controlling shareholders, and equity ownership by all unaffiliated investors
(1) (2) (3) (4) (5) (6) (7)
Intercept �0.527��� �1.394��� �1.327��� �1.378��� �1.110��� �1.025��� �1.088���
[�15.34] [�9.79] [�9.06] [�8.41] [�7.14] [�6.67] [�6.42]Total equity ownership by all 0.201��� 0.230���
controlling shareholder [3.01] [3.69]
Equity ownership by controlling 0.178��� 0.225���
owner-managers and their family members (a) [2.61] [3.01]
J.-S
.B
aek
eta
l./
Jo
urn
al
of
Fin
an
cial
Eco
no
mics
71
(2
00
4)
26
5–
31
3291

ARTIC
LEIN
PRES
S
Equity ownership by affiliated 0.317�� 0.425��
firms (b) [4.10] [4.38]
Top 30 chaebol dummy (c) 0.059 �0.052[1.19] [�0.85]
c � a �0.320[�1.59]
c � b �0.299�
[�1.82]Total equity ownership by all 0.172���
unaffiliated investors [3.29]
Equity ownership by domestic 0.064 0.069
institutional investors (d) [1.14] [1.00]
Equity ownership by foreigners (e) 0.791��� 0.792��
[5.98] [5.18]
c � d 0.061
[0.46]
c � e 0.003
[0.01]
Log (total assets) 0.048��� 0.045��� 0.047��� 0.029��� 0.024��� 0.028���
[6.90] [6.29] [5.55] [3.54] [2.94] [3.07]
Total debt/total assets �0.109��� �0.114��� �0.114��� �0.030 �0.008 �0.006[�3.03] [�3.17] [�3.15] [�1.00] [�0.28] [�0.20]
Industry dummies Yes Yes Yes Yes Yes Yes Yes
Adjusted R2 0.018 0.096 0.100 0.102 0.075 0.111 0.108
F -value 3.792 11.804 10.677 7.984 9.620 12.251 8.674
Number of sample 612 612 612 612 634 634 634
Panel C: Chaebol affiliation, cash flow rights, voting rights, and diversification
(1) (2) (3) (4) (5) (6)
Intercept �1.429��� �1.411��� �1.285��� �1.288��� �1.188��� �1.303���
[�8.54] [�8.38] [�7.51] [�7.82] [�7.23] [�7.89]Cash flow rights of controlling shareholder: 0.295���
using data on equity ownership by all [4.22]
shareholders (a)
Table 4. (Continued )J
.-S.
Ba
eket
al.
/J
ou
rna
lo
fF
ina
ncia
lE
con
om
ics7
1(
20
04
)2
65
–3
13
292

ARTIC
LEIN
PRES
SVoting rights of controlling shareholder: 0.238���
using data on equity ownership by all shareholders (b) [3.30]
Voting rights/cash flow rights of �0.002��
controlling shareholder: using data on equity [�2.39]ownership by all shareholders (c)
Diversification dummy (d) �0.063���
[�2.81]Number of industries (e) �0.060���
[�3.23]Diversification � high variation (f) �0.086���
[�3.10]Diversification � low variation �0.030
[�1.07]Top 30 chaebol dummy (g) 0.055 0.060 �0.009 �0.023 �0.041 �0.025
[1.46] [1.32] [�0.31] [�0.78] [�0.77] [�0.86]g � a �0.283
[�1.60]g � b �0.294�
[�1.72]g � c 0.002
[1.42]
g � d 0.026
[0.58]
g � e 0.023
[0.69]
g � f 0.046
[0.93]
Log (total asset) 0.046��� 0.046��� 0.042��� 0.047��� 0.044��� 0.048���
[5.36] [5.25] [4.77] [5.54] [5.29] [5.62]
Total debt/total assets �0.042 �0.044 �0.035 �0.118��� �0.132��� �0.123���
[�1.28] [�1.34] [�1.07] [�3.48] [�3.70] [�3.58]Industry dummies Yes Yes Yes Yes Yes Yes
Adjusted R2 0.085 0.088 0.061 0.089 0.094 0.089
F -value 8.070 7.161 5.670 8.192 9.630 7.433
Number of sample 606 606 572 593 582 591
J.-S
.B
aek
eta
l./
Jo
urn
al
of
Fin
an
cial
Eco
no
mics
71
(2
00
4)
26
5–
31
3293

disaggregate equity ownership by blockholders into block holdings by owner-managers and their family members, affiliated firms, and unaffiliated investors. Wealso include a top 30 chaebol dummy variable and interaction variables between thechaebol dummy and the ownership variables. The regression (1) regresses HPRs (�5,32) around the initial shock period on the chaebol dummy. The estimate on thecoefficient of the chaebol dummy is 0.067, which is significant at the 0.01 level.However, the significance of the coefficient on the chaebol dummy disappears whenthe regression controls for firm size and leverage ratio, as in regression (2).In regression (3), we add three variables that break down the largest blockholder
concentration into block holdings by owner-managers and their family members,affiliated firms, and unaffiliated investors. All of the coefficients on these threevariables are significant and positive. In regression (4), we include the interactionterms between the chaebol dummy and the three blockholder concentrationvariables. The important findings are that the coefficients on the interaction termbetween the chaebol dummy and the largest blockholder concentration by owner-managers and their family members is �0.583 and for affiliated firms �0.360. Bothare significant at the 0.10 level. The same results are obtained when we replace thelargest blockholder concentration by the summed blockholder concentration(regressions (5) and (6)). These results suggest that higher equity ownership byinsiders or affiliated firms has a greater adverse effect on firm value when the firmbelongs to one of the top 30 chaebols.In regressions (7)–(9), we use the largest managerial and nonmanagerial
blockholder concentrations as explanatory variables. Again, although theseblockholder concentrations have a positive effect on firm value during a crisis, thecoefficients on the interaction term between the chaebol dummy and both the largestmanagerial and nonmanagerial blockholder concentrations are significant andnegative.Overall, our results suggest that the effect of controlling ownership on firm value
differs between chaebol and non-chaebol firms and the degree of conflict betweencontrolling and minority shareholders is more severe for firms within chaebols thanthose outside.Panel B of Table 4 regresses HPRs ð�5; 32Þ on the chaebol dummy, equity
ownership by all controlling shareholders (not just blockholders), their interactionvariables, and equity ownership by unaffiliated domestic and foreign institutionalinvestors. Regression (1) shows that higher equity ownership by all controllingshareholders is positively related to firm value. Controlling for firm size and leverageratio does not change the result (regression (2)). In regression (3), we disaggregateequity ownership by all controlling shareholders into equity ownership by owner-managers and their family members, and equity ownership by affiliated firms. Wefind that the coefficients on both variables are positive and significant at the 0.05level or above. In regression (4), we add the chaebol dummy and its interaction termswith two equity ownership variables. The coefficient on the chaebol dummy is notsignificant, but the coefficient on the interaction term between the chaebol dummyand equity ownership by affiliated firms is negative and significant at the 0.10 level.To the extent that equity ownership by affiliated firms reflects the divergence between
ARTICLE IN PRESSJ.-S. Baek et al. / Journal of Financial Economics 71 (2004) 265–313294
cash flow rights and control rights of the controlling shareholder (Joh, 2003), thisresult indicates that the owner-managers of firms in the top 30 chaebols use it tostrengthen their control rights, and that their influence on affiliated shareholdersincreases the incentive for expropriation. The coefficient on the interaction termbetween the chaebol dummy and equity ownership by controlling owner-managersand their family members is also negative, but this is not significant.In regression (5), we use equity ownership by all unaffiliated investors as an
explanatory variable. The coefficient on this variable is significant, with an estimateof 0.172. However, when we break down equity ownership by unaffiliated investorsinto that controlled by domestic and foreign institutional investors we see that theresult is mainly driven by the latter. This indicates that foreign institutional investorsserve a more valuable monitoring function than domestic institutional investors(regression (6)). In regression (7), we add the chaebol dummy and its interactionterms with equity ownership by domestic and foreign investors. None of thesevariables are significant.Panel C of Table 4 shows the interaction effects between the chaebol dummy and
cash flow rights, voting rights of controlling shareholders, and diversificationmeasures. Unlike Mitton (2002), who uses block holdings data to measure the cashflow rights and voting rights of controlling shareholders, we use total holdings data.Regression (1) includes the cash flow rights of controlling shareholders, the chaeboldummy, and their interaction term as explanatory variables. The coefficient on cashflow rights is positive and significant at the 0.01 level, but the coefficients on thechaebol dummy and its interaction term with cash flow rights are not significant. Inregression (2), we replace cash flow rights with voting rights. Again, the coefficienton voting rights is positive and significant at the 0.01 level and the coefficient on thechaebol dummy is not significant. However, the interaction term between thechaebol dummy and voting rights is significant and negative at the 0.10 level,suggesting that the more substantial voting rights of controlling shareholders inchaebol firms have an adverse effect on firm value.Regression (3) uses the ratio of voting rights to cash flow rights. We find that the
coefficient on this variable is significant and negative, but the coefficients on thechaebol dummy and its interaction with the ratio of voting rights to cash flow rightsare not significant. Regressions (4)–(6) include the chaebol dummy, diversificationmeasures, and interaction terms between these variables. Diversification measuresare negatively related to HPRs, but the chaebol dummy and its interaction termswith diversification measures have no statistically discernible effect on HPRs. Firmsize and leverage ratio have, respectively, positive and negative effects on firm value,which is consistent with the results in Table 3.Overall, our results show that chaebol firms with concentrated ownership by
controlling shareholders experience a larger drop in the value of their equity during acrisis than those owned mainly by unaffiliated investors. This result suggests thatchaebol controlling shareholders’ considerable discretionary power has a detrimentaleffect on firm value during a crisis. In contrast, large outside shareholders, who areless likely to be influenced by owner-managers, discharge a valuable monitoringfunction that helps to preserve firm value.
ARTICLE IN PRESSJ.-S. Baek et al. / Journal of Financial Economics 71 (2004) 265–313 295

Table 5 shows the effect of the relationship with the main bank on firm valueduring a crisis. Regression (1) uses the ratio of bank loans to total debt as anexplanatory variable. The coefficient on this variable is negative and significant at the0.05 level. When we add other debt composition and leverage variables, as shown inregression (2), the coefficient is still negative and significant at the 0.01 level,suggesting that close ties with banks before the shock adversely affects the value ofclient firms. These results support the proposition that client firms are adverselyaffected when a bank itself suffers from economic shock and is less able to lend. Thenegative coefficient on the bank loan ratio is consistent with the findings of Kang
ARTICLE IN PRESS
Table 5
OLS regression of the holding period returns (�5, 32) on main bank relation
The sample includes 644 nonfinancial firms listed on the Korean Stock Exchange (KSE) between
November 1997 and December 1998. The dependent variable is the holding period return (�5, +32).
November 18, 1997 is set as an event day (day 0), which is the date when the IMF proposed a rescue
package to Korea to help overcome the financial crisis that had started in the middle of that month.
Independent variables are the values at the end of the fiscal year 1996. The list of main banks is obtained
from the Annual Statistics published by the Korean Listed Companies Association. Although a firm can
borrow from several banks, the Annual Statistics lists only one bank as the main bank that provides the
major (but not necessary the largest) segment of the firm’s financing. The ADR dummy takes the value of
one if the firm’s stock is listed on the US stock exchanges. Top 30 chaebol dummy takes the value of one if
the firm belongs to one of the largest 30 chaebols. Numbers in parentheses are t-statistics. ���, ��, and �
denote significance at the 1%, 5%, and 10% levels, respectively.
(1) (2) (3) (4) (5) (6)
Intercept �0.471��� �1.399��� �1.295��� �0.473��� �1.399��� �1.293���
[�14.11] [�10.04] [�7.74] [�14.12] [�10.04] [�7.73]Bank loans/total debt �0.093�� �0.136��� �0.138���
[�2.23] [�3.37] [�3.45]Loans from the main bank/ �0.115�� �0.158��� �0.158���
total debt [�2.50] [�3.55] [�3.59]Loans from other banks/ �0.079� �0.123��� �0.126���
total debt [�1.82] [�2.95] [�3.04]Bond/total debt �0.423��� �0.423��� �0.426��� �0.424���
[�7.96] [�8.02] [�8.00] [�8.05]Foreign debt/total debt 0.010 0.014 0.008 0.012
[0.11] [0.15] [0.09] [0.13]
ADR dummy 0.226��� 0.225���
[3.72] [3.71]
Top 30 chaebol dummy �0.028 �0.027[�1.14] [�1.09]
Log (total assets) 0.055��� 0.050��� 0.055��� 0.049���
[7.75] [5.62] [7.73] [5.59]
Total debt/total assets �0.054� �0.050� �0.052� �0.047�
[�1.85] [�1.70] [�1.75] [�1.63]Industry dummies Yes Yes Yes Yes Yes Yes
Adjusted R2 0.008 0.155 0.172 0.008 0.155 0.172
F-value 2.256 15.591 14.263 2.052 14.011 13.073
Number of sample 638 638 638 638 638 638
J.-S. Baek et al. / Journal of Financial Economics 71 (2004) 265–313296

and Stulz (2000), who show that the performance of Japanese firms that were moredependent on banks was worse than that of less dependent firms during the early1990s when the banks experienced severe adverse shocks. The coefficients on theleverage ratio and the ratio of bond debt to total debt are also significantly negative.5
In contrast, the coefficient on the ratio of foreign debt to total debt is not significant.Although it has been argued that the dramatic devaluation of the Korean currencycaused financial difficulties for many firms, our evidence suggests that currencycollapses have no power to explain changes in firm value.Overall, our results provide strong support for the hypothesis that an economic
shock has a greater negative effect on firm value for financially constrained firmswith high leverage, particularly those with close ties to banks. However, thesignificant devaluation of the Korean won against the US dollar seems to have littleeffect.In regression (3) we add the ADR and chaebol dummies. The coefficient on the
ADR dummy is significant 0.226 at the 0.01 level. This coefficient suggests that firmslisted on both the KSE and the US stock exchanges have higher returns, by about22.6%, than those listed only on the KSE. It also suggests that managerialtransparency and the ability of firms to access to alternative sources of financing areimportant determinants of firm value during the period of economic crisis. Thechaebol dummy, however, is not significant.To examine the effect of bank loans on firm value more closely, regressions (4)–(6)
split the bank loan ratio into two parts: the ratio of the debt from the firm’s mainbank to total assets and the ratio of the debt from other banks to total assets. Thecoefficients on both ratios are negative and significant. However, both the magnitudeof the estimate and the significance level are larger for the main bank debt, indicatingthat this is more important in explaining the change in the value of client firmsduring a crisis. In regression (4), the coefficient on the main bank loan ratio isstatistically different from the coefficient on the other bank debt ratio (F=3.00 witha p-value of 0.05).In Table 6, we include all governance measures used in the previous regressions. In
regression (1), we use the summed blockholder concentrations by owner-managersand their family members, affiliated firms, and unaffiliated investors as indicators ofownership concentration. We also include equity ownership by foreigners,diversification measures, leverage and debt composition variables, ADR dummy,and firm size. The coefficients on summed blockholder concentration by owner-managers and their family members, summed blockholder concentration byaffiliated firms, equity ownership by foreigners, and ADR dummy are all significantand positive at the 0.01 level. In contrast, the coefficients on diversification measure,leverage ratio, main bank loan ratio, other bank debt ratio, and bond debt ratio are
ARTICLE IN PRESS
5As an alternative approach, we investigate the impact of debt composition on firm value by
partitioning total debt into short-term and long-term debt. We would expect the leverage effect to be more
pronounced if the firm has a higher proportion of short-term debt in its capital structure. This is because
firms with more short-term debt are more likely to suffer financial distress if they cannot meet their debt
obligation in the near future. We find that the coefficients on both variables are negative and significant at
the 0.01 level.
J.-S. Baek et al. / Journal of Financial Economics 71 (2004) 265–313 297
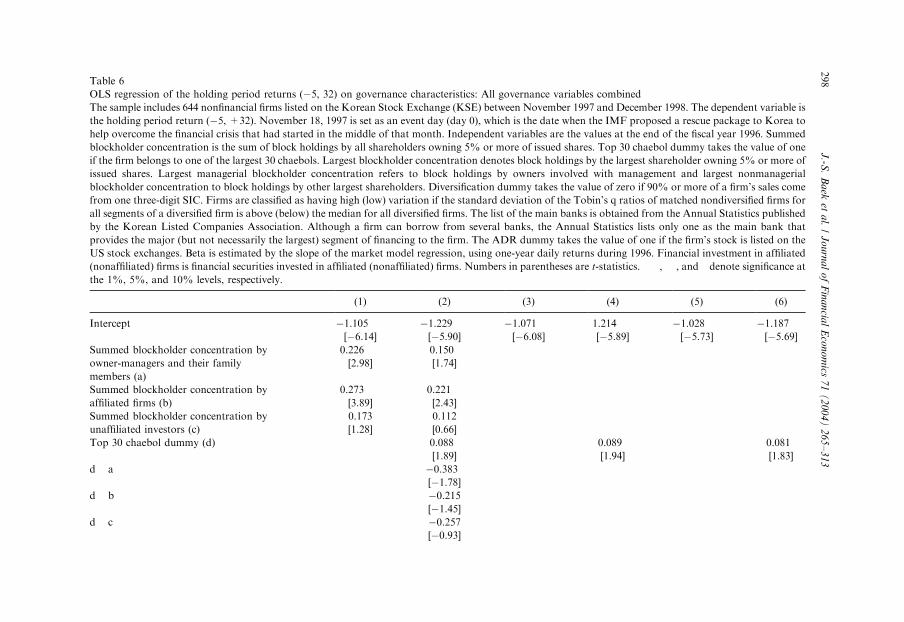
ARTIC
LEIN
PRES
S
Table 6
OLS regression of the holding period returns (�5, 32) on governance characteristics: All governance variables combined
The sample includes 644 nonfinancial firms listed on the Korean Stock Exchange (KSE) between November 1997 and December 1998. The dependent variable is
the holding period return (�5, +32). November 18, 1997 is set as an event day (day 0), which is the date when the IMF proposed a rescue package to Korea to
help overcome the financial crisis that had started in the middle of that month. Independent variables are the values at the end of the fiscal year 1996. Summed
blockholder concentration is the sum of block holdings by all shareholders owning 5% or more of issued shares. Top 30 chaebol dummy takes the value of one
if the firm belongs to one of the largest 30 chaebols. Largest blockholder concentration denotes block holdings by the largest shareholder owning 5% or more of
issued shares. Largest managerial blockholder concentration refers to block holdings by owners involved with management and largest nonmanagerial
blockholder concentration to block holdings by other largest shareholders. Diversification dummy takes the value of zero if 90% or more of a firm’s sales come
from one three-digit SIC. Firms are classified as having high (low) variation if the standard deviation of the Tobin’s q ratios of matched nondiversified firms for
all segments of a diversified firm is above (below) the median for all diversified firms. The list of the main banks is obtained from the Annual Statistics published
by the Korean Listed Companies Association. Although a firm can borrow from several banks, the Annual Statistics lists only one as the main bank that
provides the major (but not necessarily the largest) segment of financing to the firm. The ADR dummy takes the value of one if the firm’s stock is listed on the
US stock exchanges. Beta is estimated by the slope of the market model regression, using one-year daily returns during 1996. Financial investment in affiliated
(nonaffiliated) firms is financial securities invested in affiliated (nonaffiliated) firms. Numbers in parentheses are t-statistics. ���, ��, and � denote significance atthe 1%, 5%, and 10% levels, respectively.
(1) (2) (3) (4) (5) (6)
Intercept �1.105��� �1.229��� �1.071��� 1.214��� �1.028��� �1.187���
[�6.14] [�5.90] [�6.08] [�5.89] [�5.73] [�5.69]Summed blockholder concentration by 0.226��� 0.150�
owner-managers and their family [2.98] [1.74]
members (a)
Summed blockholder concentration by 0.273��� 0.221��
affiliated firms (b) [3.89] [2.43]
Summed blockholder concentration by 0.173 0.112
unaffiliated investors (c) [1.28] [0.66]
Top 30 chaebol dummy (d) 0.088� 0.089� 0.081�
[1.89] [1.94] [1.83]
d � a �0.383�
[�1.78]d � b �0.215
[�1.45]d � c �0.257
[�0.93]
J.-S
.B
aek
eta
l./
Jo
urn
al
of
Fin
an
cial
Eco
no
mics
71
(2
00
4)
26
5–
31
3298

ARTIC
LEIN
PRES
SEquity ownership by controlling 0.096 0.023
owner-managers and their family members (e) [1.33] [0.27]
Equity ownership by affiliated firms (f) 0.209��� 0.130
[2.68] [1.26]
d � e �0.419��
[�2.20]d � f �0.290�
[�1.86]Largest managerial blockholder 0.141 0.127
concentration (g) [1.47] [1.16]
Largest nonmanagerial blockholder 0.219�� 0.194�
concentration (h) [2.49] [1.70]
d � g �0.525�
[�1.87]d � h �0.269
[�1.37]Equity ownership by foreigners 0.549��� 0.368��� 0.578��� 0.360��� 0.576��� 0.375���
[4.26] [2.93] [4.54] [2.92] [4.53] [3.07]
Diversification � high variation �0.045�� �0.043� �0.046�� �0.046�� �0.050�� �0.047��
[�2.06] [�2.01] [�2.06] [�2.18] [�2.26] [�2.19]Diversification � low variation �0.011 �0.029 �0.009 �0.034 �0.012 �0.032
[�0.41] [�0.97] [�0.32] [�1.18] [�0.45] [�1.09]Log (total assets) 0.036��� 0.046��� 0.037��� 0.048��� 0.034��� 0.045���
[3.83] [4.28] [3.95] [4.60] [3.59] [4.19]
Total debt/total assets �0.089�� �0.196��� �0.089�� �0.208��� �0.099��� �0.208���
[�2.56] [�3.57] [�2.51] [�3.74] [�2.79] [�3.74]Loans from main bank/total debt �0.099�� �0.104�� �0.095�� �0.096�� �0.100�� �0.099���
[�2.13] [�2.29] [�1.98] [�2.11] [�2.14] [�2.17]Loans from other banks/total debt �0.087�� �0.087�� �0.077� �0.076� �0.086� �0.084�
[�1.98] [�1.99] [�1.73] [�1.74] [�1.93] [�1.90]Bond/total debt �0.344��� �0.314��� �0.363��� �0.340��� �0.364��� �0.326���
[�6.23] [�5.41] [�6.57] [�5.92] [�6.58] [�5.65]Foreign debt/total debt �0.098 �0.089 �0.095 �0.078 �0.103 �0.107
[�1.10] [�0.92] [�1.07] [�0.82] [�1.15] [�1.11]ADR dummy 0.205��� 0.112� 0.206��� 0.095� 0.204��� 0.105�
[3.49] [1.91] [3.46] [1.82] [3.44] [1.77]
J.-S
.B
aek
eta
l./
Jo
urn
al
of
Fin
an
cial
Eco
no
mics
71
(2
00
4)
26
5–
31
3299

ARTIC
LEIN
PRES
S
Cash flow (operating income + 0.674��� 0.677��� 0.657���
depreciation)/total assets [3.21] [3.23] [3.13]
Liquid assets (cash+marketable 0.254�� 0.206� 0.233�
securities)/total assets [2.12] [1.72] [1.94]
Tobin’s q 0.053� 0.067�� 0.050�
[1.80] [2.37] [1.77]
Beta �0.112��� �0.133��� �0.112���
[�3.49] [�4.10] [�3.53]Exports/sales 0.078� 0.062 0.076�
[1.91] [1.53] [1.87]
Advertising expenses/sales 0.458 0.376 0.470
[1.13] [0.93] [1.15]
Financial investment in affiliated �0.206�� �0.176� �0.195�
firms/total assets [�2.16] [�1.81] [�1.95]Financial investment in nonaffiliated 0.008 0.007 �0.003firms/total asset [0.08] [0.06] [�0.03]Market share in 4-digit industry 0.059 0.069 0.063
[0.86] [1.00] [0.93]
Industry dummies Yes Yes Yes Yes Yes Yes
Adjusted R2 0.222 0.329 0.210 0.331 0.208 0.325
F-value 10.494 8.490 10.515 9.184 10.202 8.817
Number of sample 565 442 572 447 561 438
Table 6. (Continued )
(1) (2) (3) (4) (5) (6)
J.-S
.B
aek
eta
l./
Jo
urn
al
of
Fin
an
cial
Eco
no
mics
71
(2
00
4)
26
5–
31
3300
significant and negative. These results are generally consistent with those in theprevious regressions.In regression (2), we add the chaebol dummy and its interaction terms with the
summed blockholder concentrations. We also control for the other variablesdiscussed in Section 2. The coefficient on the interaction term between the chaeboldummy and the summed blockholder concentrations by owner-managers and theirfamily members is significant �0.383 at the 0.10 level. The coefficient on theinteraction term between the chaebol dummy and the summed blockholderconcentrations by affiliated firms is �0.215, but this is not significant.We also find that the coefficients on the ratio of both cash flow and liquid assets to
total assets are significant and positive with t-statistics of 3.21 and 2.12, respectively.Therefore, firms that have good liquidity prior to economic shock on averageexperience a smaller reduction in the market value of their equity during the crisis.The Tobin’s q is also positively related to HPRs. This means that firms whoseperformance was good before the shock experienced a smaller drop in the value oftheir equity during the crisis. The coefficient on the ratio of export to sales issignificant and positive at the 0.10 level. To the extent that firms with more exportshave greater access to foreign currency, this result supports the view that high levelsof exports help firms overcome the problem of currency devaluation. In contrast,the coefficient on beta is negative and significant at the 0.01 level, supportingthe hypothesis that firms with high exposure to economic activity suffer more in thecrisis. The ratio of financial investment in affiliated firms to total assets is alsonegatively related to the HPRs. Given that the close ties between member firms,sustained through financial investments, tend to delay the demise of failing firms andincrease the possibility of cross-subsidies and wealth transfers, this result supportsthe tunneling hypothesis advanced by Johnson, La Porta, Lopez-de-Silanes, andShleifer (2000). The result is also consistent with that of Joh (2003) who shows thatfinancial investment in affiliated firms lowered the profitability of firms in Koreabefore the crisis took place.Regressions (3) and (4) use equity ownership by all controlling owner-managers
and their family members and equity ownership by all affiliated firms as indicators ofownership concentration. The coefficients on the interaction variables between thechaebol dummy and these two ownership variables are significant �0.419 and�0.290, respectively, confirming that large controlling ownership in chaebol firmshas a negative impact. These results suggest that for chaebol firms, each increase of10% in equity ownership by controlling family shareholders (affiliated firms) isassociated with a lower return of 4.19% (2.90%). Since the average market value ofequity for chaebol firms is 315 billion won at the end of the fiscal year 1996 and theaverage equity ownership by controlling family shareholders (affiliated firms) is9.03% (17.52%), the average loss to shareholders due to a 9.03% (17.52%) increasein ownership by controlling family shareholders (affiliated firms) would amount toalmost 11.92 (16) billion won, which is about 3.78% (5.08%) of the market value.Since the coefficient on the ratio of debt to total asset is �0.208 in regression (4), ourresults imply that for chaebol firms, a 10% increase in equity ownership bycontrolling family shareholders (affiliated firms) has a similar negative effect to
ARTICLE IN PRESSJ.-S. Baek et al. / Journal of Financial Economics 71 (2004) 265–313 301

increasing the leverage ratio by 20.14% (13.94%). The coefficient on the ratio ofloans from main bank to total debt is �0.096 in regression (4), which is significant atthe 0.05 level. This coefficient implies that an increase in the main bank loan ratio of10% leads to a decrease in the holding period returns of 0.96% and that increasingthe main bank loan ratio by 10% had a similar effect to increasing the total leverageby about 4.62%. We note that the adjusted R-square of regression (4) is 33.1%,suggesting that the regression model fits the data well.Regressions (5) and (6) replace equity ownership by controlling owner-managers
and their family members and equity ownership by all affiliated firms with the largestmanagerial and nonmanagerial blockholder concentrations. The results obtained aresimilar to those in regression (2) in as much as the coefficient on the interactionvariables between the chaebol dummy and the largest managerial blockholderconcentration is significant and negative.To summarize the results, chaebol firms largely owned by owner-managers and
affiliates suffer more in a time of economic crisis. Other vulnerable firms are thoseheavily dependent on bank financing, particularly main bank financing, anddiversified firms. In contrast, chaebol firms mainly owned by foreign-controlledfirms experience a smaller drop in value, indicating that the presence of foreigninvestors is greeted positively by the stock market. Firms with higher disclosurequality and access to alternative means of financing are also more robust. Finally,firms that are small and risky, have a high leverage ratio, and have low cash flow andliquidity realize a large drop in equity value when there is a crisis in the economy.We conduct a number of tests of the model in order to check the robustness of the
results, as reported in Table 7. Regressions (1) and (2) of Panel A change thedefinition of the main bank to denote the firm’s largest lender. The results show thatthe magnitude of the coefficients on the main bank loan ratio increase furthercompared to that of the coefficients on the previous regressions in Table 5. The signand significance of the coefficients on other explanatory variables remains about thesame.Regressions (3) through (6) use alternative definitions of chaebol to show that our
results are robust for different characterizations of business groups. Regressions (3)and (4) use the top 50 chaebols as a definition, and regressions (5) and (6) use the top70.6 When only the top 50 chaebol or the top 70 chaebol dummy is used without anyother explanatory variables (regressions (3) and (5)), the coefficients on bothdummies are significant and positive at the 0.01 level. However, they becomeinsignificant once other variables are included (regressions (4) and (6)). Changing the
ARTICLE IN PRESS
6To examine the extent to which some Korean firms are independent of chaebol affiliation, Appendix B
shows the mean and median numbers of affiliated firms belonging to the top one hundred chaebols as of
1996, 1997, and 1998. In 1998, the mean and median numbers of listed affiliated firms for the top ten
chaebols are 9.4 and 8, respectively. The corresponding numbers for the top 61 to 70 (91 to 100) chaebols
are only 1.6 (1.2) and 1 (1), respectively. Typically, chaebols outside of the top 60 do not have more than
one firm as the listed member. Since 748 firms were listed on the KSE at the end of 1998, and the total
number of listed firms belonging to the top one hundred chaebols was 301, it would appear that 59.8% of
the firms listed on the KSE belong to other smaller chaebols or are independent. Taken as a whole,
Appendix B clearly shows that many Korean firms are, in fact, independent.
J.-S. Baek et al. / Journal of Financial Economics 71 (2004) 265–313302

ARTIC
LEIN
PRES
S
Table 7
Robustness checks
The sample includes 644 nonfinancial firms listed on the Korean Stock Exchange (KSE) between November 1997 and December 1998. For Panel A, the
dependent variable is the holding period return (�5, +32) in which November 18, 1997 is set as an event date (day 0). For Panel B, the dependent variable is the
holding period return from November 1, 1997 to October 31, 1998. Independent variables are the values at the end of the fiscal year 1996. For regressions (1)
and (2) of Panel A, the main bank is defined as the firm’s largest lender. For other regressions, the list of the main banks is obtained from the Annual Statistics
published by the Korean Listed Companies Association. Although a firm can borrow from several banks, the Annual Statistics lists only one as the main bank
that provides the major (but not necessary the largest) segment of the firm’s financing. Top 30 (50, 70) chaebol dummy takes the value of one if the firm belongs
to one of the largest 30 (50, 70) chaebols. Definitions of other variables are the same as those in Table 6.
Panel A: Alternative definitions of main bank (firm’s largest lender) and chaebol affiliation (top 50 and top 70 chaebols)
Main bank relation Top 50 chaebols Top 70 chaebols
(1) (2) (3) (4) (5) (6)
Intercept �1.381��� �1.174��� �0.537��� �1.171��� �0.542��� �1.052���
[�9.64] [�5.67] [�17.47] [�5.71] [�17.64] [�5.02]Equity ownership by controlling 0.018 �0.063 �0.091owner-managers and their family members (a) [0.21] [�0.71] [�1.00]Equity ownership by affiliated firms (b) 0.122 0.156 0.165
[1.19] [1.46] [1.46]
Top 30 chaebol dummy (c) 0.086�
[1.89]
c � a �0.423�
[�2.22]c � b �0.283�
[�1.81]Top 50 chaebol dummy (d) 0.064��� 0.027
[3.10] [0.59]
d � a 0.071
[0.43]
d � b �0.272�
[�1.75]Top 70 chaebol dummy (e) 0.071��� 0.031
[3.57] [0.69]
e � a 0.164
J.-S
.B
aek
eta
l./
Jo
urn
al
of
Fin
an
cial
Eco
no
mics
71
(2
00
4)
26
5–
31
3303

ARTIC
LEIN
PRES
S
[1.08]
e � b �0.265�
[�1.70]Equity ownership by foreigners 0.363��� 0.314�� 0.299��
[2.95] [2.55] [2.44]
Diversification � high variation �0.049�� �0.048�� �0.047��
[�2.31] [�2.22] [�2.18]Diversification � low variation �0.039 �0.040 �0.042
[�1.32] [�1.36] [�1.43]Log (total assets) 0.054��� 0.047��� 0.048��� 0.041���
[7.59] [4.47] [4.57] [3.87]
Total debt/total assets �0.056� �0.194�� �0.214��� �0.218���
[�1.88] [�3.47] [�3.84] [�3.95]Loans from the main bank/total debt �0.205��� �0.186�� �0.085� �0.091��
[�2.83] [�2.58] [�1.85] [�2.01]Loans from other banks/total debt �0.172�� �0.167�� �0.070� �0.077�
[�2.36] [�2.29] [�1.68] [�1.76]Bond debt/total debt 0.443��� �0.374��� �0.341��� �0.337���
[�7.93] [�6.19] [�5.97] [�5.90]Foreign debt/total debt 0.056 �0.035 �0.093 �0.079
[0.58] [�0.35] [�0.97] [�0.82]ADR dummy 0.102� 0.115� 0.125��
[1.72] [1.95] [2.12]
Cash flow (operating income+depreciation)/ 0.649��� 0.688��� 0.686���
total assets [3.12] [3.29] [3.29]
Liquid assets (cash+marketable securities)/ 0.216� 0.190 0.197�
total assets [1.80] [1.58] [1.65]
Tobin’s q 0.067�� 0.066�� 0.064��
[2.33] [2.28] [2.26]
Beta �0.129��� �0.131��� �0.130���
[�4.00] [�4.03] [�4.03]Exports/sales 0.077� 0.069� 0.072�
[1.89] [1.70] [1.77]
Advertising expenses/sales 0.421 0.306 0.336
Table 7. (Continued )J
.-S.
Ba
eket
al.
/J
ou
rna
lo
fF
ina
ncia
lE
con
om
ics7
1(
20
04
)2
65
–3
13
304
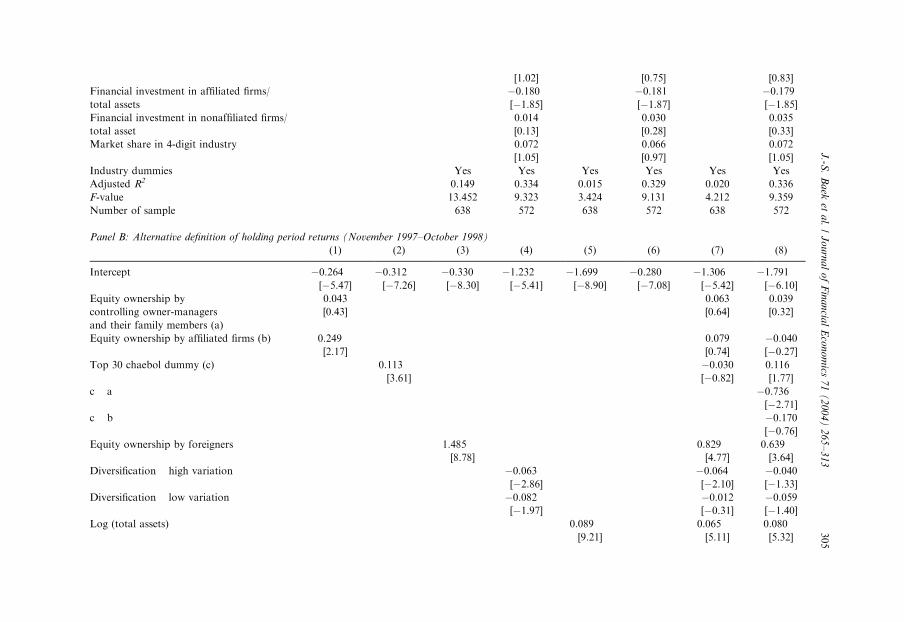
ARTIC
LEIN
PRES
S[1.02] [0.75] [0.83]
Financial investment in affiliated firms/ �0.180� �0.181� �0.179�
total assets [�1.85] [�1.87] [�1.85]Financial investment in nonaffiliated firms/ 0.014 0.030 0.035
total asset [0.13] [0.28] [0.33]
Market share in 4-digit industry 0.072 0.066 0.072
[1.05] [0.97] [1.05]
Industry dummies Yes Yes Yes Yes Yes Yes
Adjusted R2 0.149 0.334 0.015 0.329 0.020 0.336
F-value 13.452 9.323 3.424 9.131 4.212 9.359
Number of sample 638 572 638 572 638 572
Panel B: Alternative definition of holding period returns (November 1997–October 1998)
(1) (2) (3) (4) (5) (6) (7) (8)
Intercept �0.264��� �0.312��� �0.330�� �1.232��� �1.699��� �0.280��� �1.306��� �1.791���
[�5.47] [�7.26] [�8.30] [�5.41] [�8.90] [�7.08] [�5.42] [�6.10]Equity ownership by 0.043 0.063 0.039
controlling owner-managers [0.43] [0.64] [0.32]
and their family members (a)
Equity ownership by affiliated firms (b) 0.249�� 0.079 �0.040[2.17] [0.74] [�0.27]
Top 30 chaebol dummy (c) 0.113��� �0.030 0.116�[3.61] [�0.82] [1.77]
c � a �0.736���
[�2.71]c � b �0.170
[�0.76]Equity ownership by foreigners 1.485��� 0.829��� 0.639���
[8.78] [4.77] [3.64]
Diversification � high variation �0.063�� �0.064�� �0.040[�2.86] [�2.10] [�1.33]
Diversification � low variation �0.082�� �0.012 �0.059[�1.97] [�0.31] [�1.40]
Log (total assets) 0.089��� 0.065��� 0.080��
[9.21] [5.11] [5.32]
J.-S
.B
aek
eta
l./
Jo
urn
al
of
Fin
an
cial
Eco
no
mics
71
(2
00
4)
26
5–
31
3305

ARTIC
LEIN
PRES
S
Total debt/total assets �0.202��� �0.141��� �0.200���
[�4.43] [�2.91] [�2.52]Loans from the main bank/ �0.187��� �0.164�� �0.161��
total debt [�2.98] [�2.58] [�2.50]Loans from other banks/ �0.149��� �0.143�� �0.130��
total debt [�2.50] [�2.35] [�2.09]Bond debt/total debt �0.540��� �0.498��� �0.469���
[�7.30] [�6.59] [�5.73]Foreign debt/total debt 0.156 0.111 0.102
[1.26] [0.91] [0.74]
ADR dummy 0.586��� 0.324��� 0.191��
[6.96] [3.89] [2.26]
Cash flow (operating income+ 0.985���
depreciation)/total assets [3.31]
Liquid assets (cash + marketable securities)/ 0.439��
total assets [2.57]
Tobin’s q 0.138���
[3.38]
Beta 0.075�
[�1.64]Exports/sales 0.215���
[3.70]
Advertising expenses/sales 1.547���
[2.68]
Financial investment in �0.318��
affiliated firms/total assets [�2.30]Financial investment in nonaffiliated �0.112firms/total asset [�0.73]Market share in 4-digit 0.093
industry [0.94]
Industry dummies Yes Yes Yes Yes Yes Yes Yes Yes
Adjusted R2 0.060 0.071 0.160 0.056 0.247 0.122 0.294 0.402
F-value 8.412 12.374 29.323 8.041 22.680 21.775 15.762 12.134
Number of sample 580 596 596 584 596 596 566 447
Table 7. (Continued )J
.-S.
Ba
eket
al.
/J
ou
rna
lo
fF
ina
ncia
lE
con
om
ics7
1(
20
04
)2
65
–3
13
306

definition of chaebol does not alter the qualitative impact of the other variables inthe model.In Panel B of Table 7, we change the definition of the initial crisis period from
(�5, 32) to (November 1, 1997, October 31, 1998), but use the same explanatoryvariables as those in Table 6. This analysis arises from the work of Mitton (2002),who measures the crisis-period stock return over a period of one year. Again, weobtain qualitatively identical results, suggesting the measurement period of ð�5; 32Þused in the previous regressions is robust enough to illustrate the effect of externaleconomic shock on firm value.
4.3. Effects of corporate governance on accounting profitability
Using a sample of 5,829 Korean firms during 1993–1997, Joh (2003) examines howcorporate governance measures affected the profitability of firms before theeconomic crisis. She demonstrates that ownership concentration (measured equityholdings by owner-managers and their family members) has a positive effect onaccounting profitability. She also shows that firms with a high disparity betweencontrol rights and cash flow rights (measured as equity holdings by affiliated firms)and those with a high ratio of financial investment in affiliated firms to total assetshave low profitability. To investigate whether the measures of corporate governancediscussed in Joh (2003) explain firm profitability before and during the Korean crisis,Table 8 uses the ratio of net income to total assets as the dependent variable andvariables from Table 6 as independent variables. Net income is the value reported forthe fiscal year of 1998 and total assets those measured at the end of fiscal year 1997.In unreported tests, we use industry-adjusted ratio of net income to total assets as thedependent variables, and obtain results very similar to those reported usingunadjusted ratio.Regression (1) presents the result for the level of ownership concentration. Equity
ownership by controlling owner-managers and their family members is positive andstatistically significant at the 0.05 level. This result is consistent with that of Joh(2003). In contrast, the coefficient on equity ownership by affiliated firms is notsignificant.Regression (2) examines the effect of chaebol affiliation on firm profitability.
Unlike Joh (2003), who finds membership of a chaebol before the crisis to have astrong negative effect, we find that the coefficient on the top 30 chaebol is positivebut insignificant. This result suggests that the ability to share risks between memberfirms and the operation of an internal capital market within a chaebol help firmsmaintain profitability during an external crisis and partly offset the disadvantages oftheir governance structures.Regressions (3) and (4) include equity ownership by foreigners and diversification
measures as explanatory variables, respectively. Consistent with our expectation, thecoefficient on equity ownership by foreigners is positive and significant at the 0.01level, but the coefficients on diversification measures are not significant.Regression (5) includes leverage and debt composition variables. As for the results
in Table 5 that use the HPR as the dependent variable, the coefficients on leverage
ARTICLE IN PRESSJ.-S. Baek et al. / Journal of Financial Economics 71 (2004) 265–313 307

ARTICLE IN PRESS
Table 8
OLS regression of the ratio of net income to total assets on governance characteristics
The sample includes 644 nonfinancial firms listed on the Korean Stock Exchange (KSE) between
November 1997 and December 1998. The dependent variable is the ratio of net income to total assets. Net
income is the value for the fiscal year of 1998 and total assets are measured at the end of the fiscal year
1997. Definitions of other variables are the same as those in Table 6.
(1) (2) (3) (4) (5) (6)
Intercept �0.019 0.259 0.375� 0.387�� 0.243 1.014���
[�0.09] [1.07] [1.70] [2.02] [1.08] [2.94]
Equity ownership by controlling 0.231�� 0.102
owner-managers and their family [2.28] [0.70]
members (a)
Equity ownership by affiliated 0.058 �0.324�
firms (b) [0.49] [�1.87]Top 30 chaebol dummy (c) 0.037 0.054
[0.92] [0.70]
c � a 0.065
[0.21]
c � b 0.159
[0.61]
Equity ownership by foreigners 0.662��� 0.509��
[3.12] [2.28]
Diversification � high variation �0.005 �0.005[�0.16] [�0.13]
Diversification � low variation �0.045 �0.087�
[�1.12] [�1.71]Log (total assets) 0.004 �0.009 �0.017 �0.014 0.001 �0.041��
[0.36] [�0.69] [�1.49] [�1.47] [0.08] [�2.29]Total debt/total assets �0.188��� �0.189��� �0.149��� �0.191��� �0.146��� �0.269���
[�3.25] [�3.37] [�2.62] [�3.71] [�2.63] [�2.59]Loans from the main bank/ �0.393��� �0.254���
total debt [�5.53] [�3.20]Loans from other banks/ �0.333��� �0.198���
total debt [�4.92] [�2.56]Bond debt/total debt �0.428��� �0.383���
[�5.07] [�3.87]Foreign debt/total debt 0.188 �0.048
[1.38] [�0.30]ADR dummy 0.056
[0.57]
Cash flow (operating income + 0.237
depreciation)/total assets [0.68]
Liquid assets (cash+marketable �0.302securities)/total assets [�1.48]Tobin’s q 0.030
[0.63]
Beta �0.043[�0.78]
Exports/sales 0.135�
[1.95]
Advertising expenses/sales 0.078
[0.12]
J.-S. Baek et al. / Journal of Financial Economics 71 (2004) 265–313308

ratio, main bank loan ratio, other bank loan ratio, and bond debt ratio, are negativeand significant.Regression (6) includes all the measures of corporate governance used in the
previous regressions and also adds the other variables discussed in Section 2. Thecoefficient on equity ownership by affiliated firms is now negative and significant atthe 0.10 level,7 which is consistent with Joh (2003). To the extent that this variablemeasures the disparity between control rights and cash flow rights of controllingshareholders, the findings of both studies suggest that the existence of affiliatedshareholders adversely affects firm performance both before and during theeconomic crisis.Again, accounting profitability is significantly and positively related to foreign
equity ownership but significantly and negatively related to leverage ratio, mainbank loan ratio, other bank loan ratio, and bond debt ratio. However, the othercorporate governance measures that were significant in Table 6, such as interactionterms between the chaebol dummy and ownership concentration and the ratio offinancial investment in affiliated firms to total assets, are not significant here. Wewould attribute this inconsistency to the weak correlation between net income ratioduring 1998 and HPRs (�5, 32) during the initial crisis period. Although thecorrelation between the two performance variables is positive and significant with ap-value of 0.01, its coefficient is only 0.24. This means that while stock price changesat the start of the crisis predict differences in accounting performance later, therelation is not a one-to-one correspondence. Alternatively, an accounting-basedmeasure of performance can be subject to manipulation by corporate managers and
ARTICLE IN PRESS
Financial investment in affiliated 0.032
firms/total assets [0.17]
Financial investment in 0.080
nonaffiliated firms/total assets [0.12]
Market share in 4-digit industry 0.206�
[1.79]
Industry dummies Yes Yes Yes Yes Yes Yes
Adjusted R2 0.024 0.015 0.030 0.023 0.086 0.114
F-value 2.964 2.487 3.973 2.841 6.422 3.013
Number of sample 569 575 572 541 575 421
Table 8. (Continued )
(1) (2) (3) (4) (5) (6)
71998 was a year when many Korean firms struggled for survival in the aftermath of the Asian crisis.
The main concern of controlling owner-managers was to rescue failing affiliates through diverse methods
of corporate restructuring and aggressive deals among affiliates, such as financial subsidization and cross-
debt guarantees within member firms. Therefore, during this period, the controlling owner-managers of a
struggling firm might have strong incentives to use the voting rights of other affiliated firms to delay the
exit of their own firm from the group. Although this delay might have a positive effect on its own value, it
could have a detrimental effect on the value of other affiliated firms within the same group. The negative
effect of equity ownership by affiliated firms on net income during a crisis is consistent with these
explanations.
J.-S. Baek et al. / Journal of Financial Economics 71 (2004) 265–313 309
serve to reflect only the short-term profitability of the firm’s operations. This wouldhave been particularly true in 1998 since firms will have a strong incentive to manageearnings during an economic crisis. In contrast, stock returns are unaffected bychanges in accounting procedures, which enables us to capture the long-term impactsof corporate actions. Finally, unlike accounting profitability measures, stock returnscan incorporate the ability of certain governance structures to recover fromeconomic shock. For example, if chaebol firms recover quickly from the initial crisis,and if this information is reflected in stock returns, then, ceteris paribus, chaebolfirms will experience a smaller decline in stock returns. Thus, accounting profitabilityduring a crisis might serve as a relatively unreliable proxy for firm performance.
5. Summary and conclusion
In this paper we examine the importance of corporate governance measures indetermining firm value during a crisis. Firms with larger equity ownership by foreigninvestors experience a smaller reduction in their share value. Firms that have higherdisclosure quality and alternative sources of external financing also suffer less. Incontrast, chaebol firms where ownership is concentrated in owner-managers and/oraffiliated firms exhibit a larger drop in equity value. Firms in which the controllingshareholder’s voting rights exceed his cash flow rights and those that borrow morefrom the main banks also have significantly lower returns. We find similar effects forhighly diversified firms, those with high leverage, and those that are small and risky.The existence of such systematic evidence on the extent to which firm value is relatedto several key indicators of corporate governance suggests that differences ingovernance practice at the firm level play an important role in determining valueduring a crisis.Unlike the US, where managers are subject to disciplinary pressures from the
capital markets, Korea generally lacks such pressures. To the extent that theincentives for expropriation by controlling shareholders will increase during afinancial crisis, the agency problem between controlling and minority shareholders isparticularly serious at such times. Under these circumstances, chaebol owner-managers with concentrated ownership have strong incentives to maximize eithertheir own utility or the overall size of the chaebol rather than the value of individualfirms. The differences in the valuation effects between chaebol and non-chaebol firmsshown in this paper seem largely attributable to these distorted incentives of chaebolowner-managers.
Appendix A. Major events during the Korean financial crisis (November 1997–
December 1997)
November 2, 1997 Haetae business group announces its default.November 6, 1997 Union Bank of Switzerland warns of a possible financial crisis
in Korea.
ARTICLE IN PRESSJ.-S. Baek et al. / Journal of Financial Economics 71 (2004) 265–313310

November 18, 1997 IMF proposes the rescue fund to Korea. Korea abandons thedefense of its currency. The Korean Stock Price Index plungesbelow 500.
November 22, 1997 Korean government seeks a rescue package from the IMF tocontrol the financial crisis.
December 6, 1997 Korean government and IMF agree on the terms of the rescuepackage.
December 7, 1997 Koryo Securities Co. announces its default.December 9, 1997 Halla business group, Korea’s twelfth largest conglomerate,
announces its default.December 10, 1997 Korean government announces the nationalization of the
Korea First Bank and the Seoul Bank.December 11, 1997 Korean government closes five merchant banks.December 12, 1997 Korean government closes Dongseo Securities Co.December 13, 1997 Bank of Korea provides special rescue loans to commercial
banks and securities companies.December 23, 1997 Moody’s downgrades the sovereign rating of Korea.December 24, 1997 S&P downgrades the sovereign rating of Korea into Junk bond
level. Korean won plunges to over 2,000 per dollar.December 25, 1997 IMF and G-7 countries make $US 10 billion available to
Korea.December 31, 1997 World’s 13 major banks agree to roll over Korea’s short-term
debt by an additional month.
Appendix B. The number of affiliated firms within the top 100 chaebols
Appendix B presents the mean and median numbers of affiliated firms belongingto the top one hundred chaebols. Numbers in parentheses are the mean and mediannumbers of listed affiliated firms. Numbers in brackets are the mean and mediannumbers of all affiliated firms including unlisted firms.
ARTICLE IN PRESS
1996 1997 1998
Top 1–10 chaebols (9.8; 9) (9.6; 9) (9.4; 8)
[34.3; 31] [38.7; 31] [39.6; 32]
Top 11–20 chaebols (4.5; 5) (4.7; 4) (4.7; 6)
[19.8; 18] [23.5; 21] [21.6; 21]
Top 21–30 chaebols (2.7; 3) (2.9; 4) (2.7; 4)
[15.8; 15] [20.4; 20] [19.7; 18]
Top 31–40 chaebols (2.0; 3) (2.0; 3) (2.2; 3)
[12.6; 10] [13.4; 12] [13.8; 12]
Top 41–50 chaebols (2.5; 2) (2.5; 3) (2.6; 3)
[10.2; 10] [9.8; 11] [12.0; 13]
Top 51–60 chaebols (1.8; 2) (1.8; 2) (1.8; 2)
[9.2; 8] [10.1; 9] [11.3; 8]
J.-S. Baek et al. / Journal of Financial Economics 71 (2004) 265–313 311

References
Amihud, Y., Lev, B., 1981. Risk reduction as a managerial motive for conglomerate mergers. Bell Journal
of Economics 12, 605–617.
Aoki, M., 1990. Toward an economic model of Japanese firms. Journal of Economic Literature 28, 1–27.
Bae, K.-H., Kang, J.-K., Kim, J.-M., 2002. Tunneling or value added? Evidence from merger by Korean
business groups. Journal of Finance 57, 2695–2740.
Bae, K.-H., Kang, J.-K., Lim, C.-W., 2002. The value of durable bank relationships: evidence from
Korean banking shocks. Journal of Financial Economics 64, 181–214.
Barclay, M., Holderness, C.G., 1989. Private benefits from control of corporations. Journal of Financial
Economics 25, 371–395.
Barclay, M., Holderness, C.G., Pontiff, J., 1993. Private benefits from block ownership and discounts on
closed-end finds. Journal of Financial Economics 33, 263–291.
Bertrand, M., Mehta, P., Mullainathan, S., 2002. Ferreting out tunneling: an application to Indian
business groups. Quarterly Journal of Economics 117, 121–148.
Claessens, S., Djankov, S., Lang, L., 2000. The separation of ownership and control in East Asian
corporations. Journal of Financial Economics 58, 81–112.
Claessens, S., Djankov, S., Fan, J., Lang, L., 2002. Disentangling the incentive and entrenchment effects of
large shareholdings. Journal of Finance 57, 2741–2771.
Demsetz, H., Lehn, K.M., 1985. The structure of corporate ownership: cause and consequence. Journal of
Political Economy 93, 375–390.
Fauver, L., Houston, J., Naranjo, A., 2003. Capital market development, international integration, legal
systems, and the value of corporate diversification: a cross-country analysis. Journal of Financial and
Quantitative Analysis 38, 135–157.
Gibson, M.S., 1995. Can bank health affect investment? Evidence from Japan. Journal of Business 68,
281–308.
Hoshi, T., Kashyap, A., Scharfstein, D., 1991. Corporate structure, liquidity and investment: evidence
from Japanese industrial groups. Quarterly Journal of Economics 106, 33–60.
Jensen, M.C., Meckling, W.H., 1976. Theory of the firm: managerial behavior, agency costs and
ownership structure. Journal of Financial Economics 3, 305–360.
Joh, S.W., 2003. Corporate governance and firm profitability: evidence from Korea before the economic
crisis. Journal of Financial Economics 68, 287–322.
Johnson, S., Boone, P., Breach, A., Friedman, E., 2000. Corporate governance in the Asian financial crisis,
1997–1998. Journal of Financial Economics 58, 141–186.
Johnson, S., La Porta, R., Lopez-de-Silanes, F., Shleifer, A., 2000. Tunneling. American Economic
Review Papers and Proceedings 90, 22–27.
ARTICLE IN PRESS
Top 61–70 chaebols (1.6; 1) (1.6; 1) (1.6; 1)
[8.6; 7] [9.3; 8] [11.4; 10]
Top 71–80 chaebols (1.4; 1) (1.5; 1) (1.5; 1)
[9.0; 8] [10.1; 10] [11.2; 8]
Top 81–90 chaebols (1.5; 1) (1.5; 1) (1.6; 1)
[8.5; 7] [9.6; 8] [9.1; 9]
Top 91–100 chaebols (1.2; 1) (1.2; 1) (1.2; 1)
[8.2; 7] [9.6; 8] [9.0; 8]
Total number of listed firms belonging to top 100 chaebols (a) 311 323 301
Total number of firms listed on the Korean Stock Exchange (b) 760 776 748
a/b 40.9% 41.6% 40.2%
Appendix B. (Continued )
J.-S. Baek et al. / Journal of Financial Economics 71 (2004) 265–313312

Kang, J.-K., 1998. Bank-centered corporate governance systems. Economic Analysis 4, Bank of Korea,
pp. 120–161 (in Korean).
Kang, J.-K., Shivdasani, A., 1995. Firm performance, corporate governance, and top executive turnover in
Japan. Journal of Financial Economics 38, 29–58.
Kang, J.-K., Stulz, R.M., 2000. Do banking shocks affect borrowing firm performance? An analysis of the
Japanese experience. Journal of Business 73, 1–23.
Kaplan, S.N., 1994. Top executive rewards and firm performance: a comparison of Japan and the United
States. Journal of Political Economy 102, 510–546.
Kaplan, S.N., Minton, B.A., 1994. Appointments of outsiders to Japanese boards: determinants and
implications for managers. Journal of Financial Economics 36, 225–258.
Khanna, T., Palepu, K.G., 1999. Emerging market business groups, foreign investors, and corporate
governance. NBER working paper #6955.
Khanna, T., Palepu, K.G., 2000. Is group affiliation profitable in emerging markets: an analysis of
diversified Indian business groups. Journal of Finance 55, 867–891.
Lang, L., Stulz, R.M., 1992. Contagion and competitive intra-industry effects of bankruptcy
announcements. Journal of Financial Economics 33, 45–60.
La Porta, R., Lopez-de-Silanes, F., Shleifer, A., Vishny, R., 1997. Legal determinants of external finance.
Journal of Finance 52, 1131–1150.
La Porta, R., Lopez-de-Silanes, F., Shleifer, A., Vishny, R., 1998. Law and finance. Journal of Political
Economy 106, 1115–1155.
La Porta, R., Lopez-de-Silanes, F., Shleifer, A., Vishny, R., 1999. The quality of government. Journal of
Law, Economics and Organization 15, 222–279.
La Porta, R., Lopez-de-Silanes, F., Shleifer, A., Vishny, R., 2000. Investor protection and corporate
governance. Journal of Financial Economics 58, 3–27.
La Porta, R., Lopez-de-Silanes, F., Shleifer, A., Vishny, R., 2002. Investor protection and corporate
valuation. Journal of Finance 57, 1147–1170.
Lemmon, M., Lins, K., 2001. Ownership structure, corporate governance, and firm value: evidence from
the East Asian financial crisis. Unpublished working paper, University of Utah.
Lins, K., Servaes, H., 2002. Is corporate diversification beneficial in emerging markets? Financial
Management 31, 5–31.
Mitton, T., 2002. A cross-firm analysis of the impact of corporate governance on the East Asian financial
crisis. Journal of Financial Economics 64, 215–241.
Opler, C.T., Titman, S., 1994. Financial distress and corporate performance. Journal of Finance 49,
1015–1040.
Rajan, R., Zingales, L., 1998. Which capitalism? Lessons from the East Asian crisis. Journal of Applied
Corporate Finance 11, 40–48.
Rajan, R., Servaes, H., Zingales, L., 2000. The cost of diversity: the diversification discount and inefficient
investment. Journal of Finance 55, 35–80.
Reese Jr., W., Weisbach, M., 2002. Protection of minority shareholder interests, cross-listings in the
United States, and subsequent equity offerings. Journal of Financial Economics 66, 65–104.
Shin, H.H., Park, Y.S., 1999. Financing constraints and internal capital markets: evidence from Korean
chaebols. Journal of Corporate Finance 5, 169–191.
Shleifer, A., Vishny, R., 1986. Large shareholders and corporate control. Journal of Political Economy 94,
461–488.
Slovin, B.M., Sushka, M.E., Polonchek, J.A., 1993. The value of bank durability: borrowers and bank
stakeholders. Journal of Finance 48, 247–266.
ARTICLE IN PRESSJ.-S. Baek et al. / Journal of Financial Economics 71 (2004) 265–313 313