GENEVA - UNECECNG price (1976-85) • Incentives/ subsidies continues • Funding for refuelling...
39
mm/y ©ENGVA, 2004 EMERGING MODELS of NGV MARKET DEVELOPMENT United Nations Working Party on Gas 20 January 2005 Dr. Jeffrey M. Seisler Executive Director GENEVA GENEVA
Transcript of GENEVA - UNECECNG price (1976-85) • Incentives/ subsidies continues • Funding for refuelling...
mm/y ©ENGVA, 2004
EMERGING MODELS of NGV MARKET DEVELOPMENT
United NationsWorking Party on Gas
20 January 2005Dr. Jeffrey M. Seisler
Executive Director
GENEVAGENEVA
mm/y ©ENGVA, 2004
GLOBAL NGV MARKET
mm/y ©ENGVA, 2004
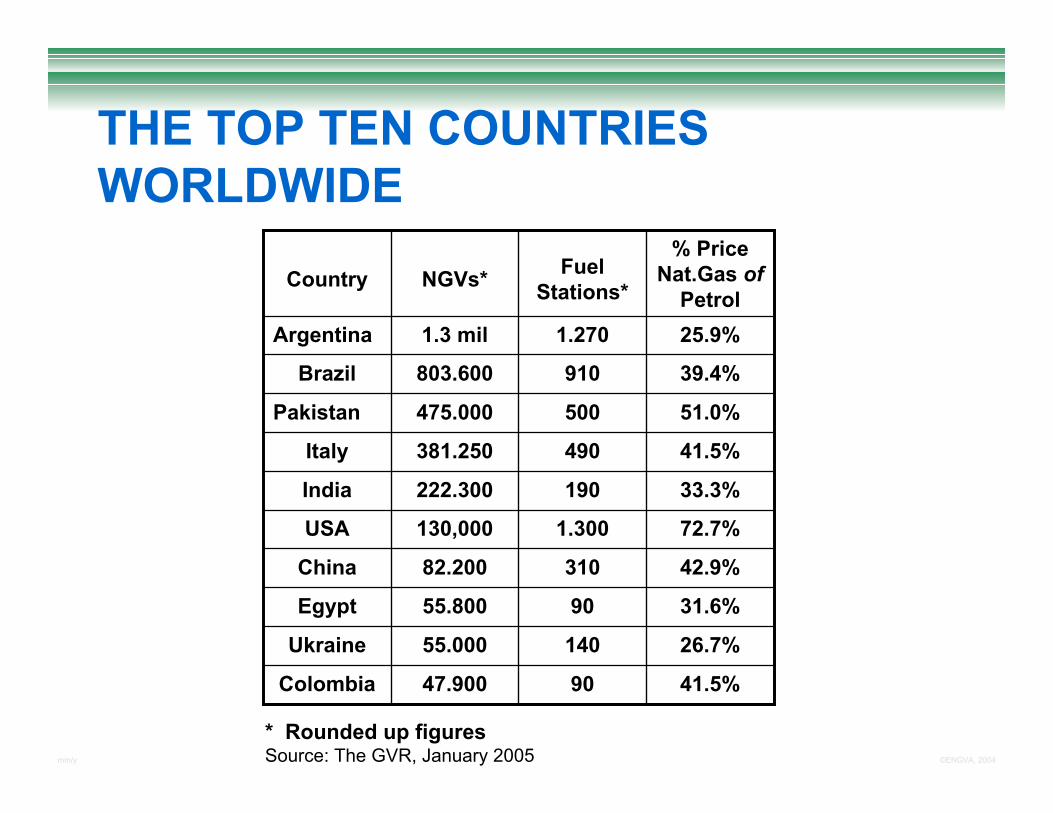
THE TOP TEN COUNTRIES WORLDWIDE
26.7%14055.000Ukraine
41.5%9047.900Colombia
31.6%9055.800Egypt
42.9%31082.200China
72.7%1.300130,000USA
33.3%190222.300India
41.5%490381.250Italy
51.0%500475.000Pakistan
39.4%910803.600Brazil
25.9%1.2701.3 milArgentina
% Price Nat.Gas of
PetrolFuel
Stations*NGVs*Country
January 2004 * Rounded up figuresSource: The GVR, January 2005
mm/y ©ENGVA, 2004
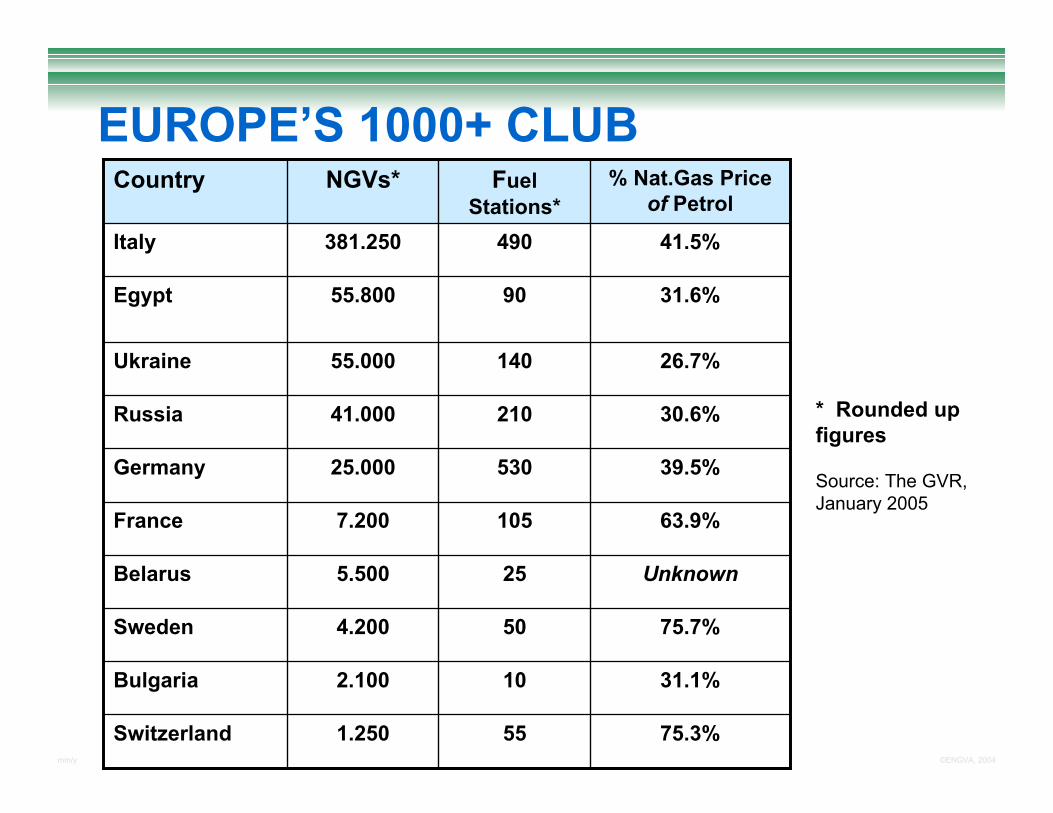
EUROPE’S 1000+ CLUB
26.7%14055.000Ukraine
31.1%102.100Bulgaria
75.3%551.250Switzerland
75.7%504.200Sweden
Unknown255.500Belarus
63.9%1057.200France
39.5%53025.000Germany
30.6%21041.000Russia
31.6%9055.800Egypt
41.5%490381.250Italy
% Nat.Gas Price of Petrol
Fuel Stations*
NGVs*Country
* Rounded up figures
Source: The GVR, January 2005
mm/y ©ENGVA, 2004
EUROPEAN COUNTRY MODELS
mm/y ©ENGVA, 2004
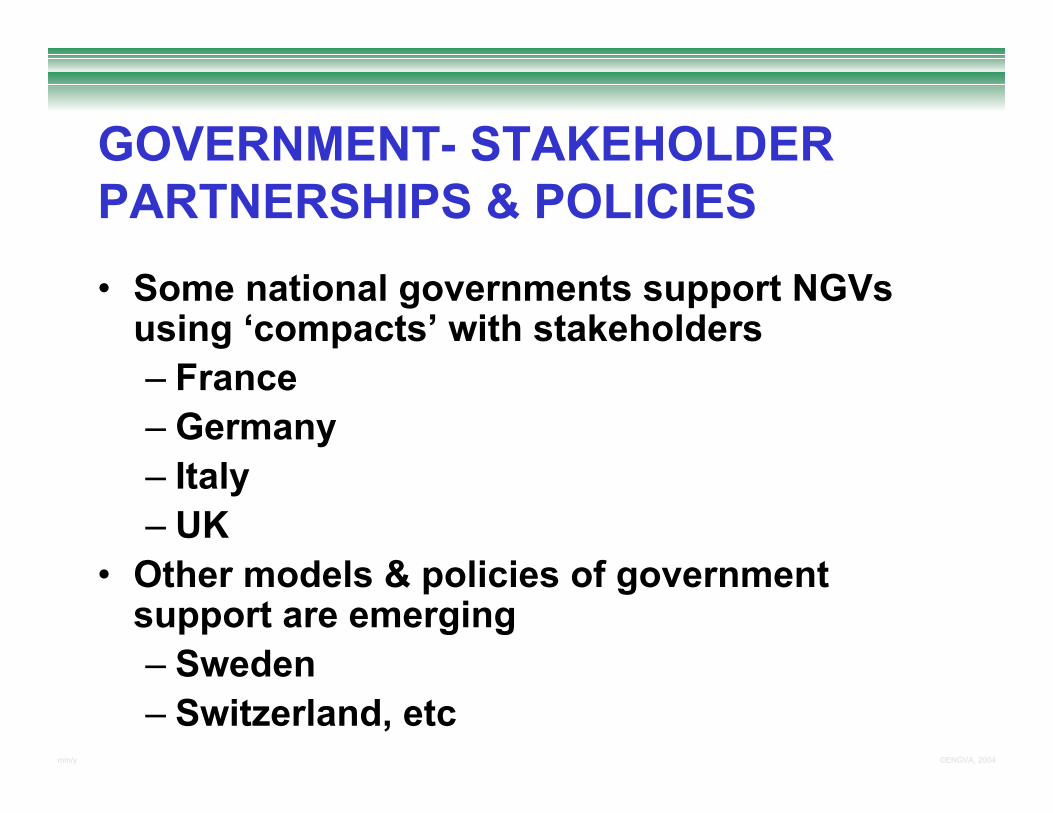
GOVERNMENT- STAKEHOLDERPARTNERSHIPS & POLICIES• Some national governments support NGVs
using ‘compacts’ with stakeholders– France– Germany– Italy– UK
• Other models & policies of government support are emerging– Sweden– Switzerland, etc
mm/y ©ENGVA, 2004
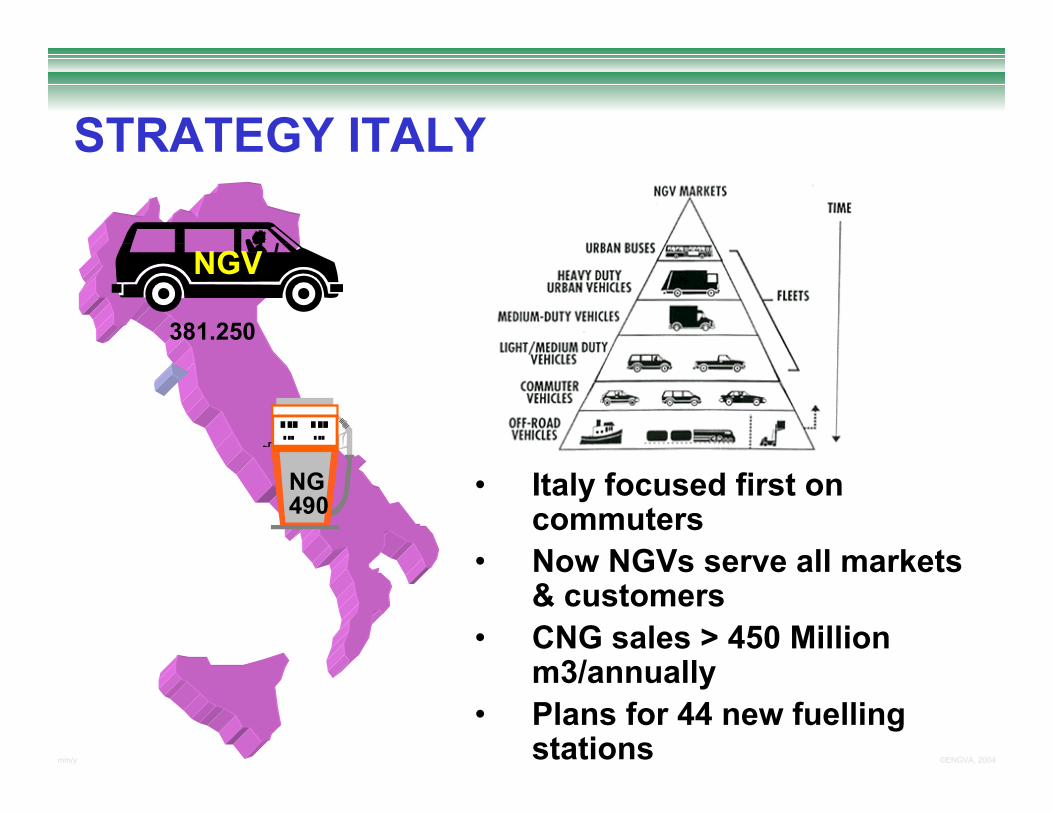
STRATEGY ITALY
• Italy focused first on commuters
• Now NGVs serve all markets & customers
• CNG sales > 450 Million m3/annually
• Plans for 44 new fuelling stations
NGV
NG
381.250
490
mm/y ©ENGVA, 2004
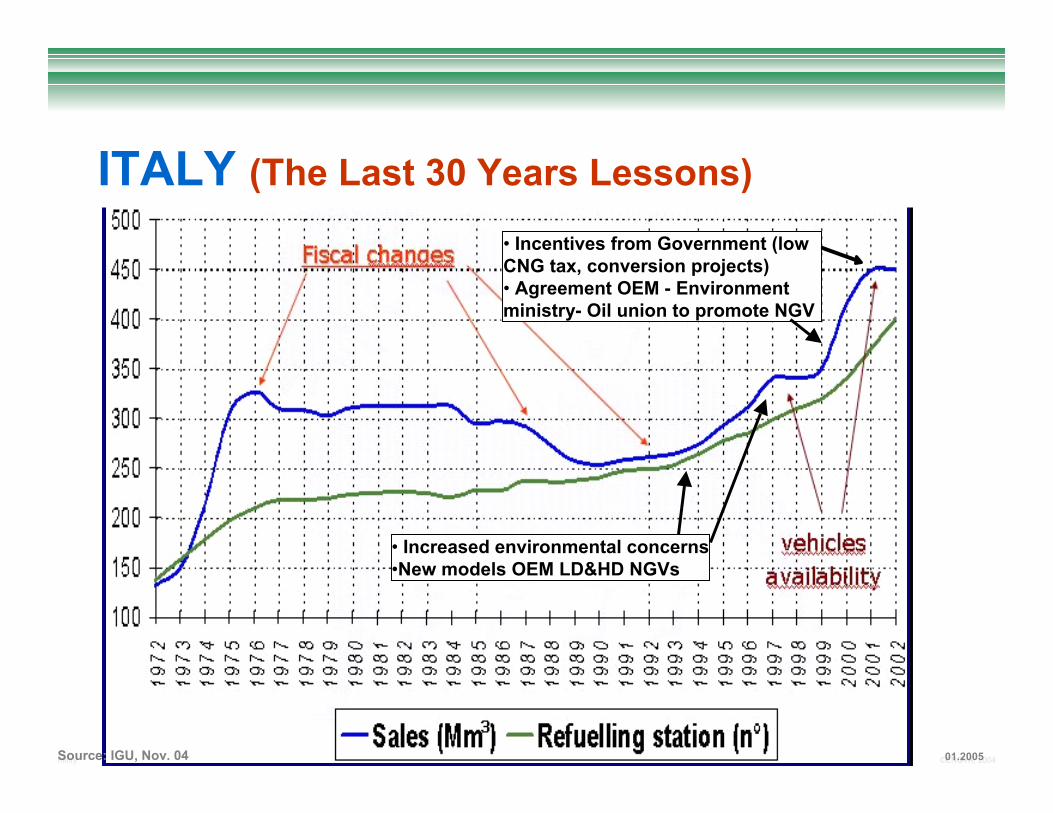
ITALY (The Last 30 Years Lessons)
• Increased environmental concerns•New models OEM LD&HD NGVs
• Incentives from Government (low CNG tax, conversion projects)• Agreement OEM - Environment ministry- Oil union to promote NGV
Source: IGU, Nov. 04 01.2005
mm/y ©ENGVA, 2004
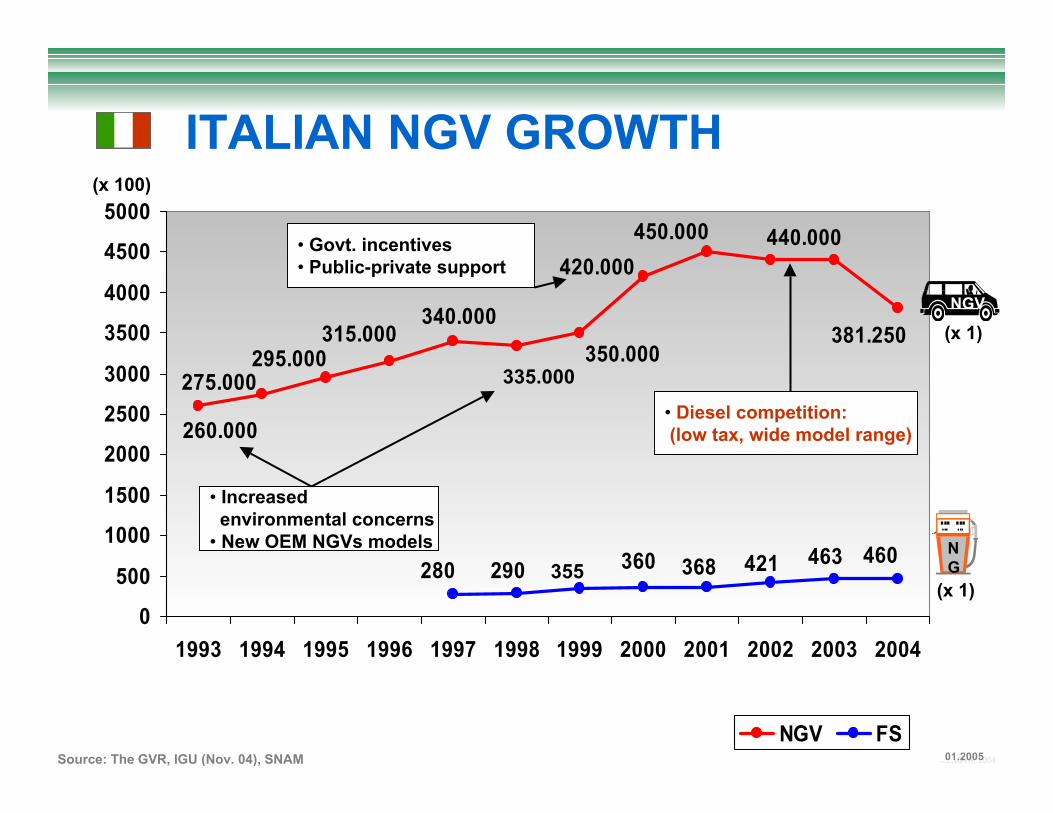
ITALIAN NGV GROWTH
440.000
381.250
275.000
260.000
295.000
450.000
340.000315.000
350.000
420.000
460463368360280 290 421
0
500
1000
1500
2000
2500
3000
3500
4000
4500
5000
1993 1994 1995 1996 1997 1998 1999 2000 2001 2002 2003 2004
NGV FS
355
NGV
(x 1)
NG
(x 1)
Source: The GVR, IGU (Nov. 04), SNAM 01.2005
(x 100)
335.000
• Increased environmental concerns
• New OEM NGVs models
• Govt. incentives• Public-private support
• Diesel competition: (low tax, wide model range)
mm/y ©ENGVA, 2004
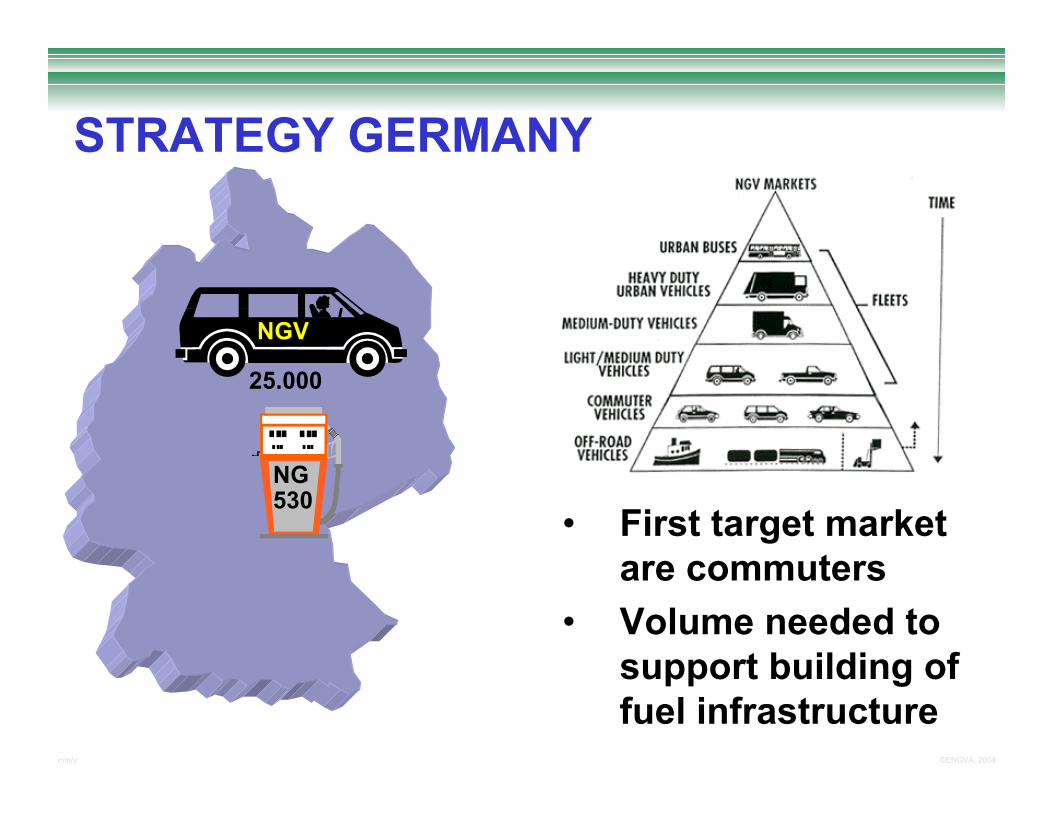
STRATEGY GERMANY
• First target market are commuters
• Volume needed to support building of fuel infrastructure
NGV
NG
25.000
530
mm/y ©ENGVA, 2004
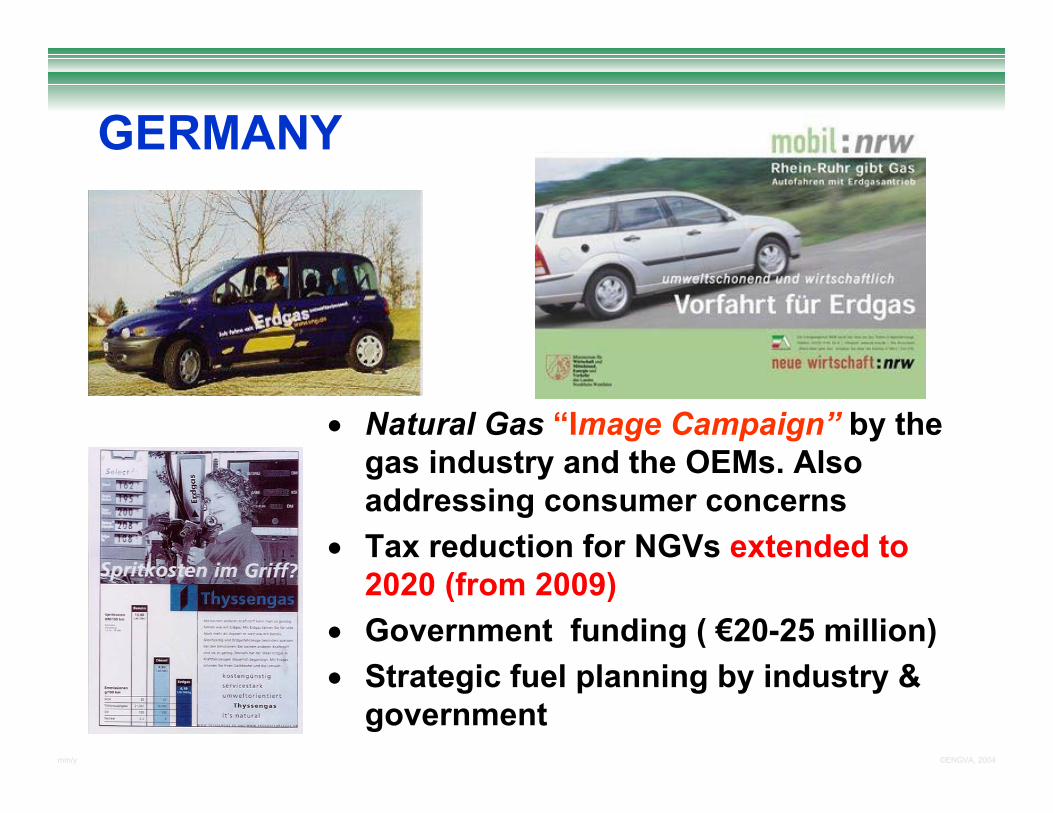
• Natural Gas “Image Campaign” by the gas industry and the OEMs. Also addressing consumer concerns
• Tax reduction for NGVs extended to 2020 (from 2009)
• Government funding ( €20-25 million)• Strategic fuel planning by industry &
government
GERMANY
mm/y ©ENGVA, 2004
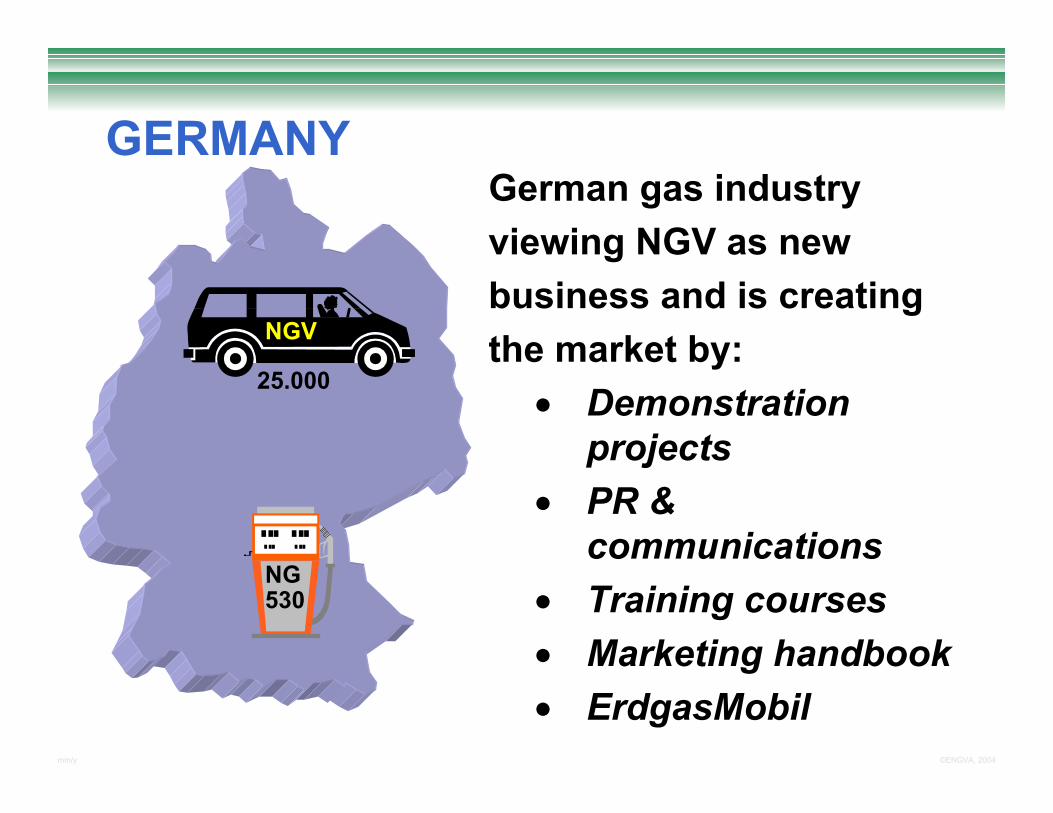
GERMANYGerman gas industryviewing NGV as newbusiness and is creating the market by:
• Demonstration projects
• PR & communications
• Training courses• Marketing handbook• ErdgasMobil
NGV
NG
25.000
530

mm/y ©ENGVA, 2004
GERMANY NGV GROWTH25.000
19.400
11.000
15.000
7.500
5.5004.200
3.0002.0001.000400
120100
80
250
190
14065
5035
530
390
0
5000
10000
15000
20000
25000
30000
1994 1995 1996 1997 1998 1999 2000 2001 2002 2003 20040
50
100
150
200
250
300
350
400
450
500
550
600
Number of natural gas vehicles Number of fuelling stations
NGV
(x 1)
NG
(x 1)
Source: IGU, Nov. 04 01.2005
• Reduced mineral oiltax (up to 2009)
• Political funding•1st OEM NGV (BMW)
• Increase oil prices• Sales incentives (OEM & gas industry)
• Establish ErdgasMobil (by gas & oil companies)
• Target 1.000 CNG stations• Fuel tax extension to 2020• More OEM NGVs
• More OEM NGV models• 1st NGVs with under floorgas tank
• Wide NG(V) campaign(public-private sectors)
mm/y ©ENGVA, 2004
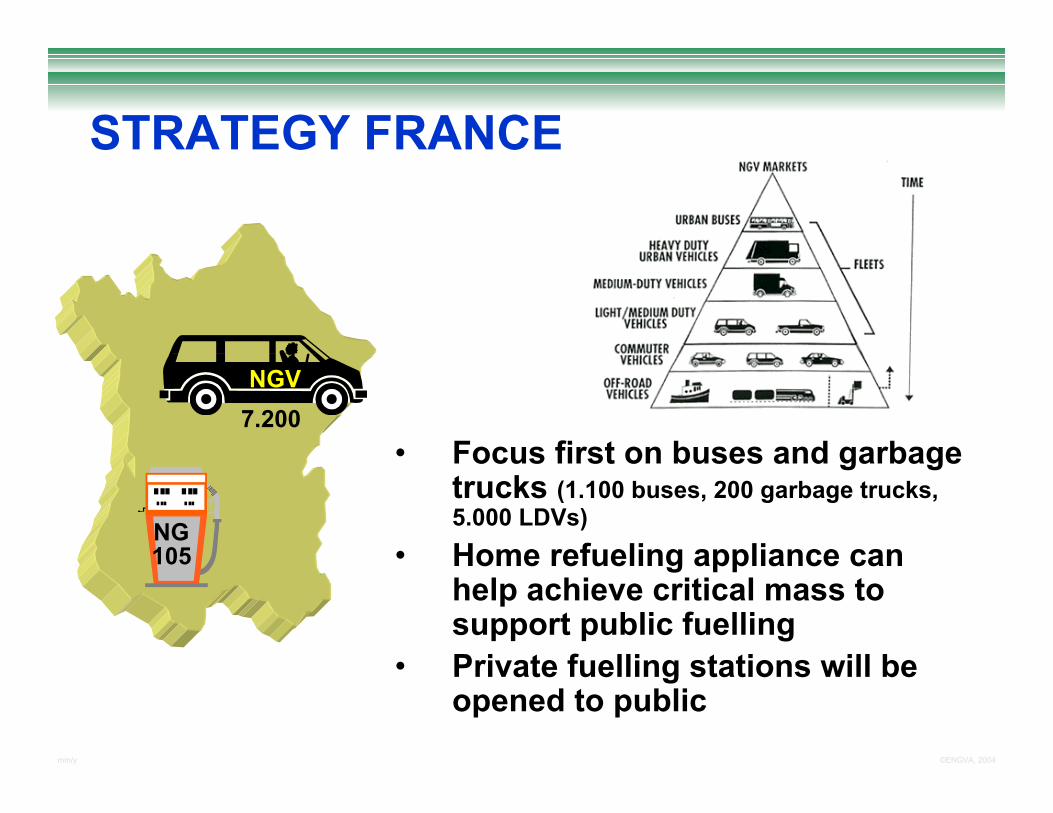
• Focus first on buses and garbage trucks (1.100 buses, 200 garbage trucks, 5.000 LDVs)
• Home refueling appliance can help achieve critical mass to support public fuelling
• Private fuelling stations will be opened to public
NGV7.200
NG105
STRATEGY FRANCE
mm/y ©ENGVA, 2004
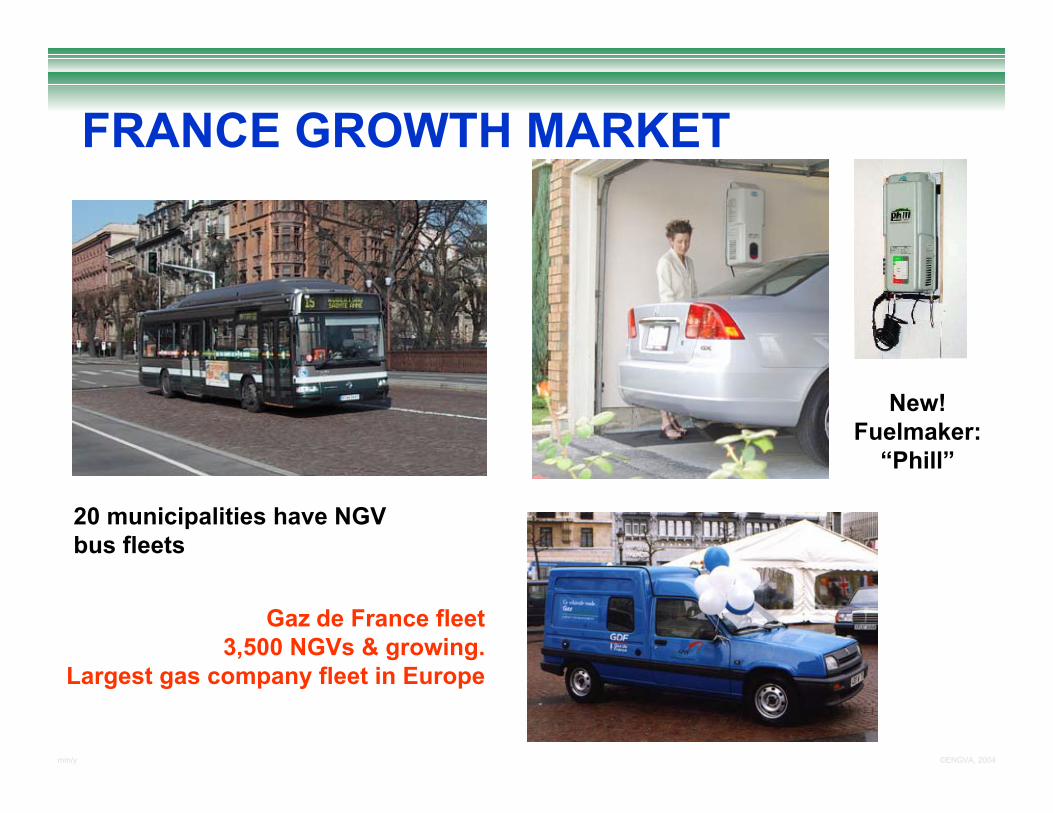
FRANCE GROWTH MARKET
Strasbourg, France
Gaz de France fleet 3,500 NGVs & growing.
Largest gas company fleet in Europe
New! Fuelmaker:
“Phill”
20 municipalities have NGV bus fleets
mm/y ©ENGVA, 2004
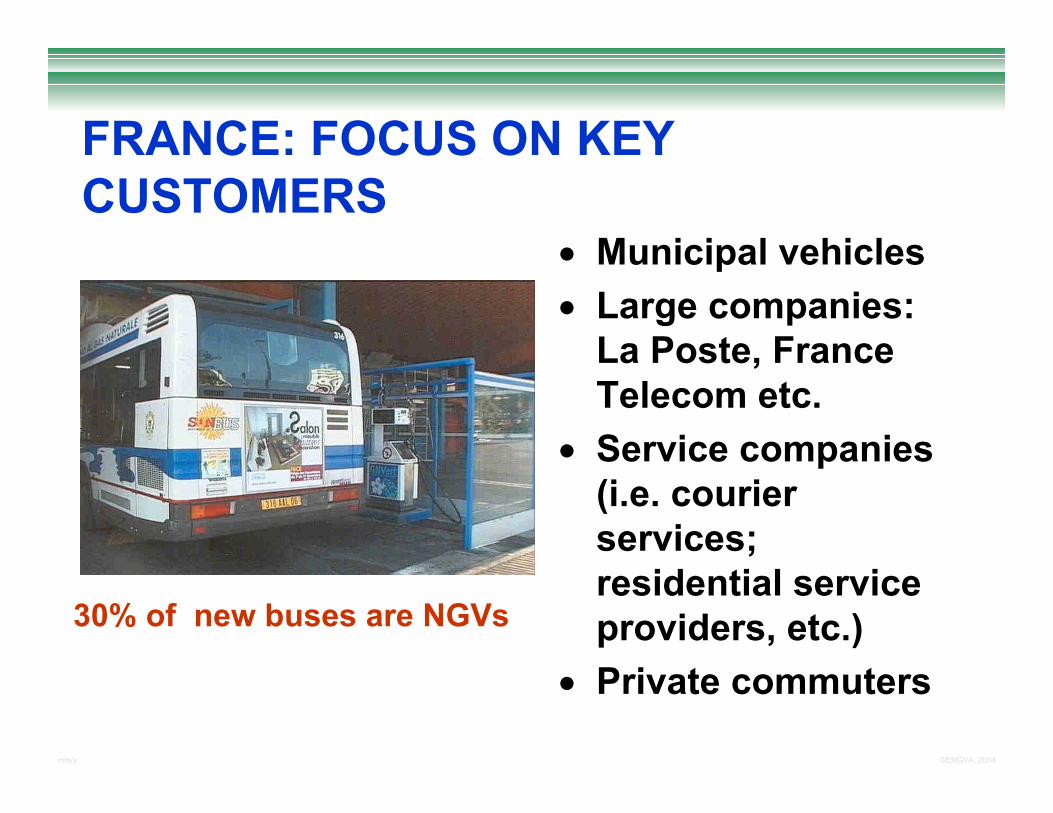
FRANCE: FOCUS ON KEY CUSTOMERS
• Municipal vehicles• Large companies:
La Poste, France Telecom etc.
• Service companies (i.e. courier services; residential service providers, etc.)
• Private commuters
30% of new buses are NGVs
mm/y ©ENGVA, 2004
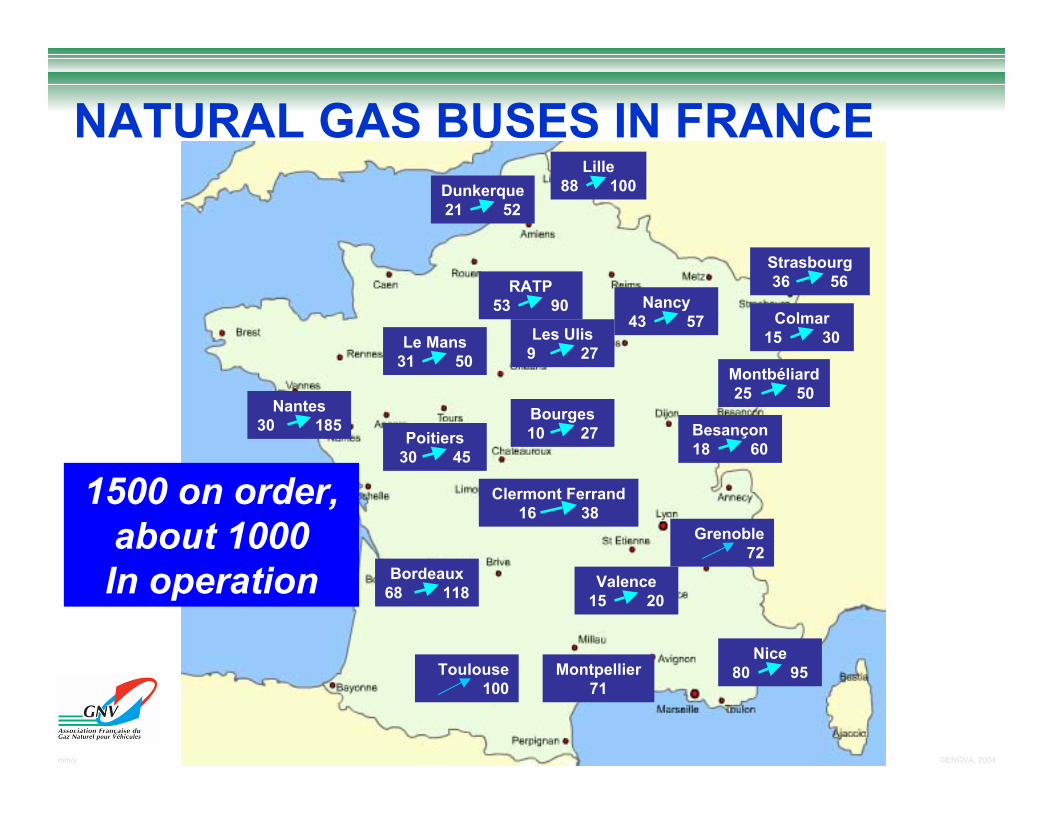
Strasbourg 36 56
Lille 88 100
Montbéliard 25 50
NATURAL GAS BUSES IN FRANCE
Le Mans 31 50
Nantes 30 185
Poitiers 30 45
Bordeaux 68 118
Clermont Ferrand 16 38
RATP 53 90
Les Ulis 9 27
Nancy 43 57
Dunkerque 21 52
Colmar 15 30
Besançon 18 60
Bourges 10 27
Valence 15 20
Grenoble 72
Toulouse 100
1500 on order,about 1000In operation
Nice 80 95Montpellier
71

mm/y ©ENGVA, 2004
• Governmental Support• Strong Gas industry support• OEMs producing NGVs• CNG price = -34% of petrol price
= -16% of diesel price Challenge
MARKET CONDITIONS
mm/y ©ENGVA, 2004
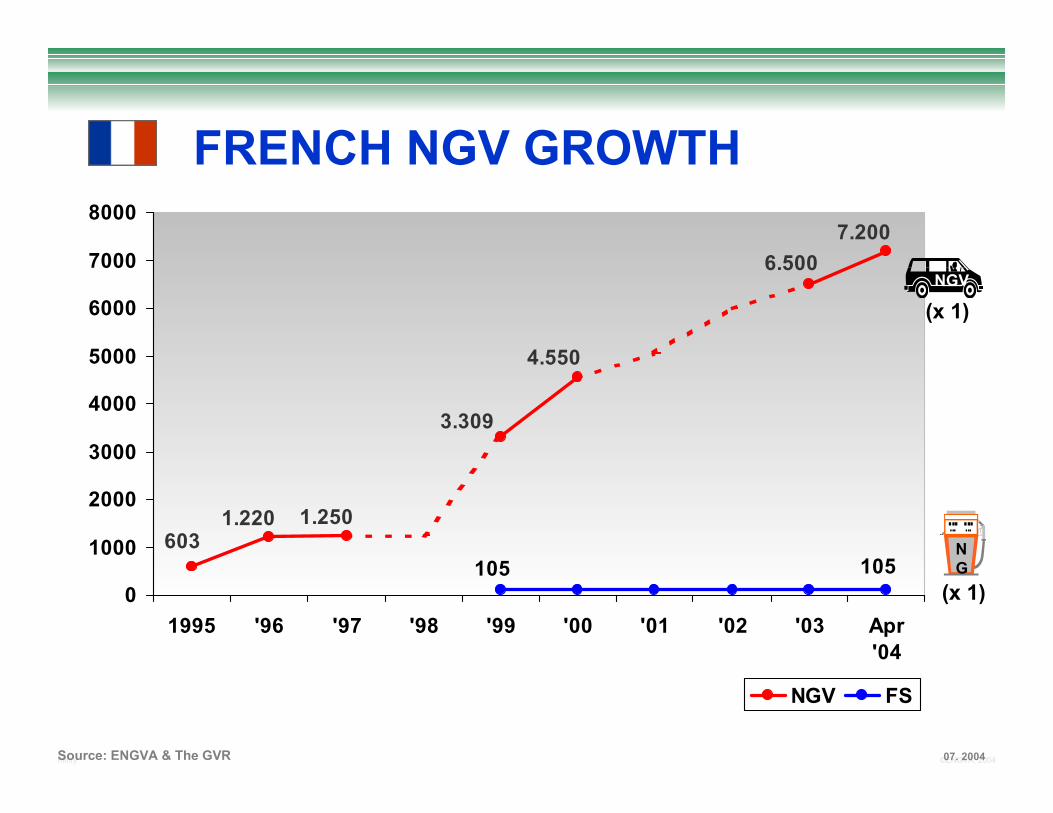
FRENCH NGV GROWTH
4.550
3.309
7.2006.500
1.250603
1.220
1051050
1000
2000
3000
4000
5000
6000
7000
8000
1995 '96 '97 '98 '99 '00 '01 '02 '03 Apr'04
NGV FS
NGV
(x 1)
NG
(x 1)
Source: ENGVA & The GVR 07. 2004
mm/y ©ENGVA, 2004
SWEDEN NGV GROWTH NGV
(x 1)
NG
(x 1)
Source: IGU, Nov. 04 01.2005
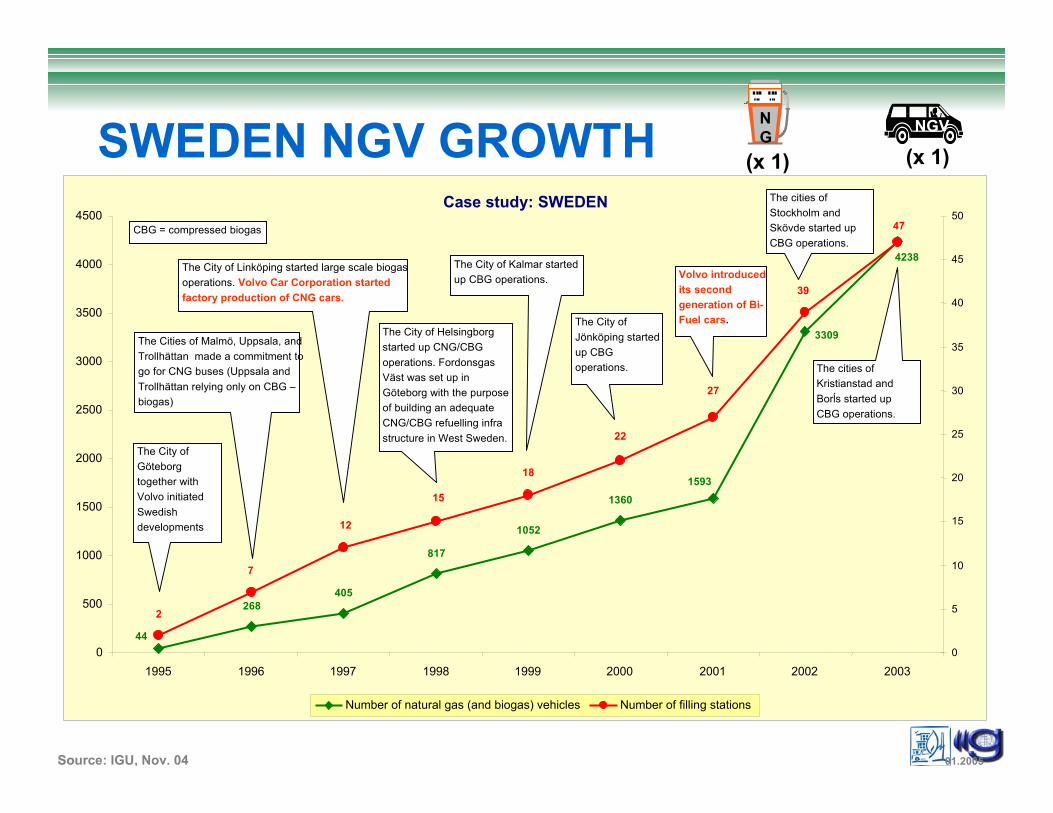
Case study: SWEDEN
268405
817
1052
13601593
4238
3309
44
2
7
12
27
39
47
15
18
22
0
500
1000
1500
2000
2500
3000
3500
4000
4500
1995 1996 1997 1998 1999 2000 2001 2002 20030
5
10
15
20
25
30
35
40
45
50
Number of natural gas (and biogas) vehicles Number of filling stations
The City of Göteborg together with Volvo initiated Swedish developments
CBG = compressed biogas
The Cities of Malmö, Uppsala, and Trollhättan made a commitment to go for CNG buses (Uppsala and Trollhättan relying only on CBG –biogas)
The City of Linköping started large scale biogas operations. Volvo Car Corporation started factory production of CNG cars.
The City of Helsingborg started up CNG/CBG operations. Fordonsgas Väst was set up in Göteborg with the purpose of building an adequate CNG/CBG refuelling infra structure in West Sweden.
The City of Kalmar started up CBG operations.
The City of Jönköping started up CBG operations.
Volvo introduced its second generation of Bi-Fuel cars.
The cities of Stockholm and Skövde started up CBG operations.
The cities of Kristianstad and Borĺs started up CBG operations.

mm/y ©ENGVA, 2004
SELECTED COUNTRY MODELS
MIDDLE EAST&
JAPAN
mm/y ©ENGVA, 2004
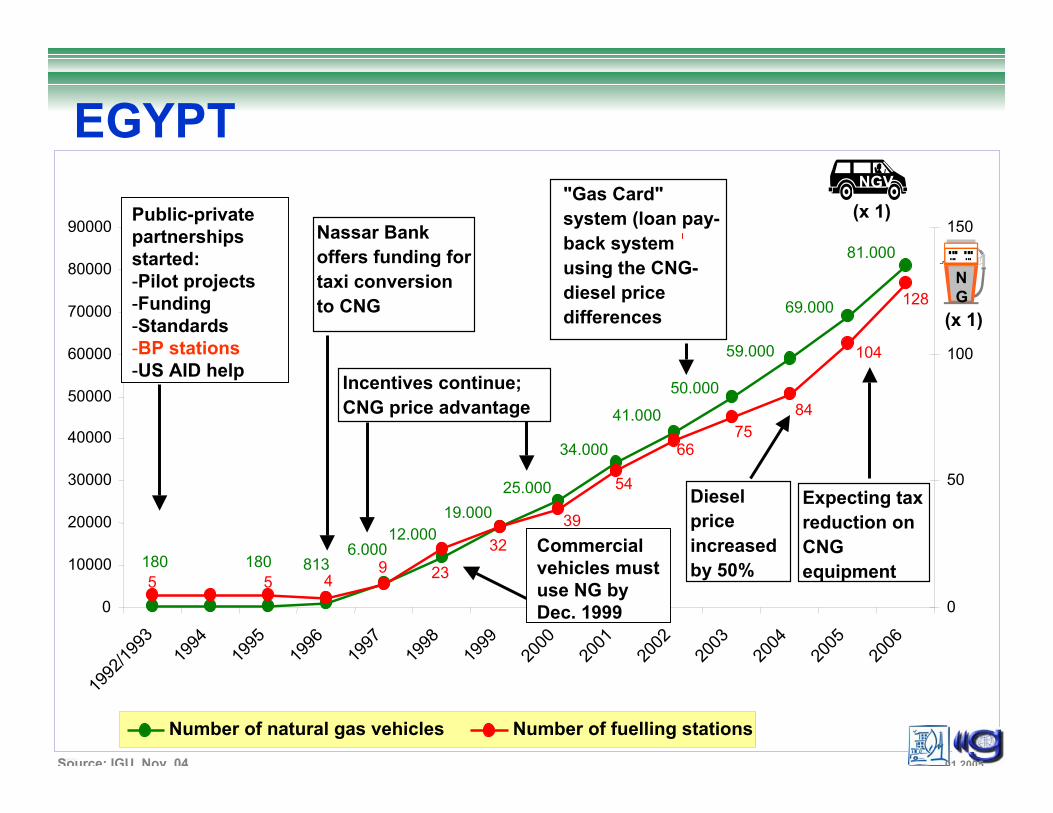
EGYPT
50.000
34.000
59.000
69.000
81.000
41.000
25.00019.000
12.0006.000
813180180
84
66
5 5
3239
54
49 23
128
104
75
0
10000
20000
30000
40000
50000
60000
70000
80000
90000
1992
/1993
1994
1995
1996
1997
1998
1999
2000
2001
2002
2003
2004
2005
2006
0
50
100
150
Number of natural gas vehicles Number of fuelling stations
Nassar Bank offers funding for taxi conversion to CNG
Incentives continue;CNG price advantage
"Gas Card" system (loan pay-back system using the CNG-diesel price differences
Diesel price increased by 50%
Expecting tax reduction on CNG equipment
Public-private partnerships started:-Pilot projects-Funding-Standards-BP stations-US AID help
Commercial vehicles must use NG by Dec. 1999
NGV
(x 1)
NG
(x 1)
Source: IGU Nov 04 01 2005
mm/y ©ENGVA, 2004
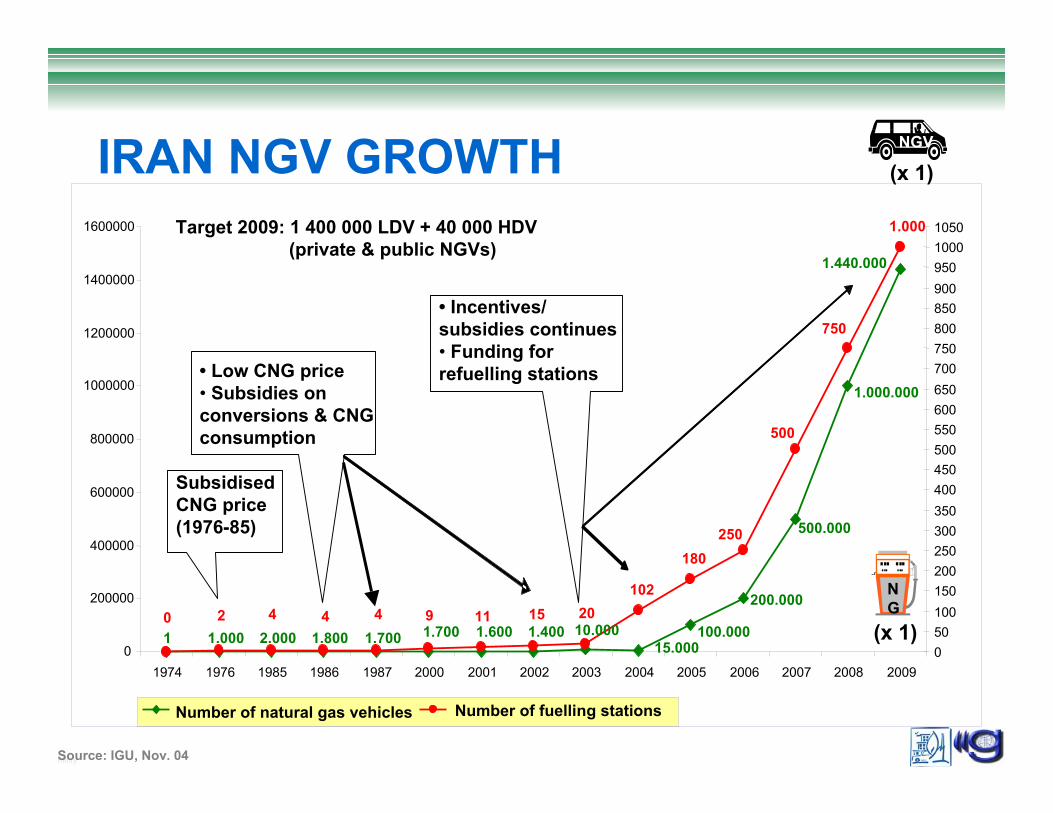
IRAN NGV GROWTH
1 1.000 2.000 1.800 1.700 1.700 1.600 1.400 10.00015.000
100.000
200.000
500.000
1.000.000
1.440.000
102
180250
500
750
1.000
0 2 4 11 15 204 4 9
0
200000
400000
600000
800000
1000000
1200000
1400000
1600000
1974 1976 1985 1986 1987 2000 2001 2002 2003 2004 2005 2006 2007 2008 200905010015020025030035040045050055060065070075080085090095010001050
Number of natural gas vehicles Number of fuelling stations
SubsidisedCNG price(1976-85)
• Incentives/ subsidies continues• Funding for refuelling stations
Target 2009: 1 400 000 LDV + 40 000 HDV(private & public NGVs)
Source: IGU, Nov. 04 01.2005
• Low CNG price• Subsidies on conversions & CNG consumption
NGV
(x 1)
NG
(x 1)

mm/y ©ENGVA, 2004
Vehicle growth scenario.2000Vehicle growth scenario.2000--20202020
5000000
10000000
15000000
20000000
25000000
30000000
35000000
0
2000
2005
2010
2015
2020
lowgrowth,(EIA)
mediumgrowth
high growth
Vehicle growth prognoses for Iran
mm/y ©ENGVA, 2004
3.640
12.012
7.811
5.252
2.0931.211759
20.638
16.561
34
82
107
62
47
138
181
271
224
0
5000
10000
15000
20000
25000
0
50
100
150
200
250
300
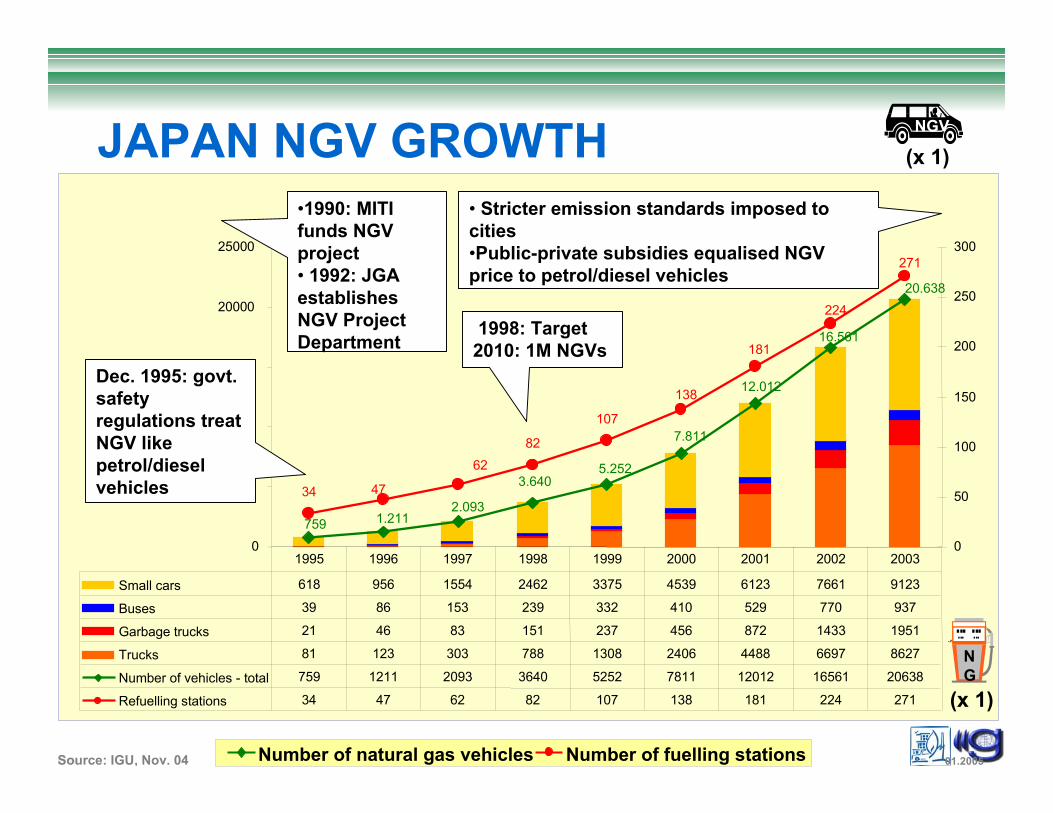
Small cars 618 956 1554 2462 3375 4539 6123 7661 9123
Buses 39 86 153 239 332 410 529 770 937
Garbage trucks 21 46 83 151 237 456 872 1433 1951
Trucks 81 123 303 788 1308 2406 4488 6697 8627
Number of vehicles - total 759 1211 2093 3640 5252 7811 12012 16561 20638
Refuelling stations 34 47 62 82 107
JAPAN NGV GROWTH
Number of natural gas vehicles Number of fuelling stations
NGV
(x 1)
NG
(x 1)
Source: IGU, Nov. 04 01.2005
138 181 224 271
1995 1996 1997 1998 1999 2000 2001 2002 2003
•1990: MITI funds NGV project• 1992: JGA establishes NGV Project Department
• Stricter emission standards imposed to cities•Public-private subsidies equalised NGV price to petrol/diesel vehicles
Dec. 1995: govt. safety regulations treat NGV like petrol/diesel vehicles
1998: Target 2010: 1M NGVs
mm/y ©ENGVA, 2004
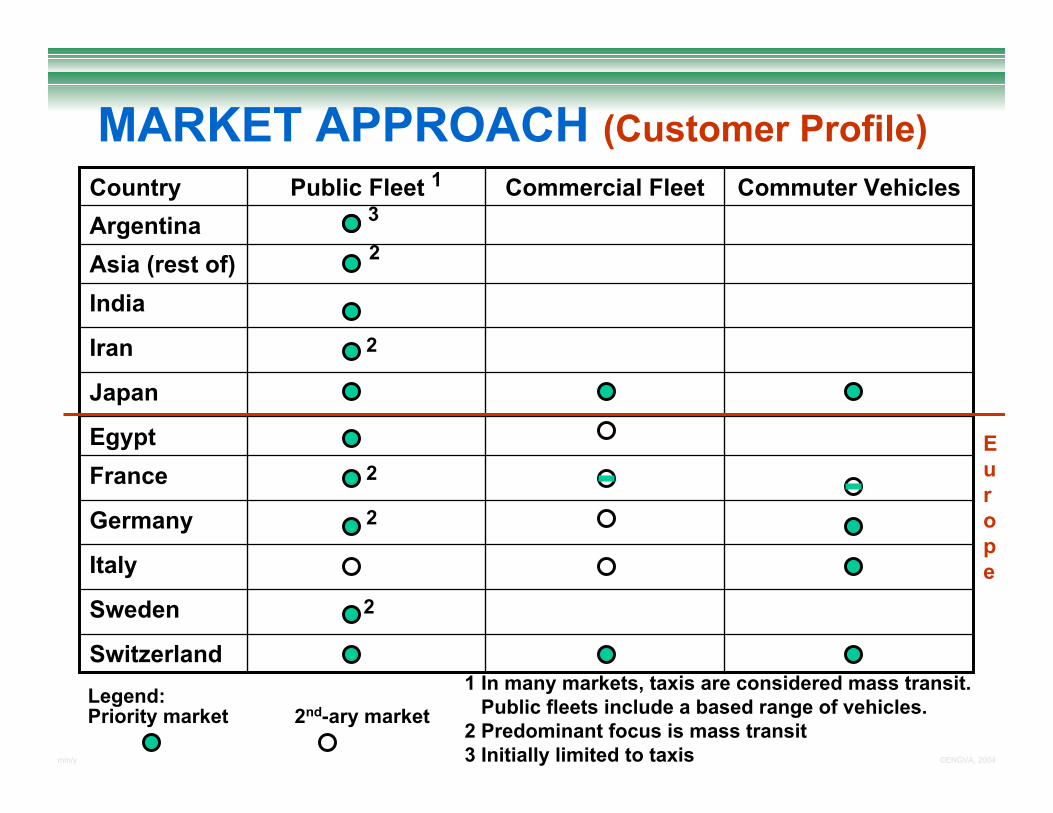
MARKET APPROACH (Customer Profile)
Egypt
2Sweden
Switzerland
Italy
2Germany
2France
Japan
2Iran
India
2Asia (rest of)
3ArgentinaCommuter VehiclesCommercial FleetPublic Fleet 1Country
January 2004
1 In many markets, taxis are considered mass transit. Public fleets include a based range of vehicles.
2 Predominant focus is mass transit3 Initially limited to taxis
Europe
Legend: Priority market 2nd-ary market
mm/y ©ENGVA, 2004
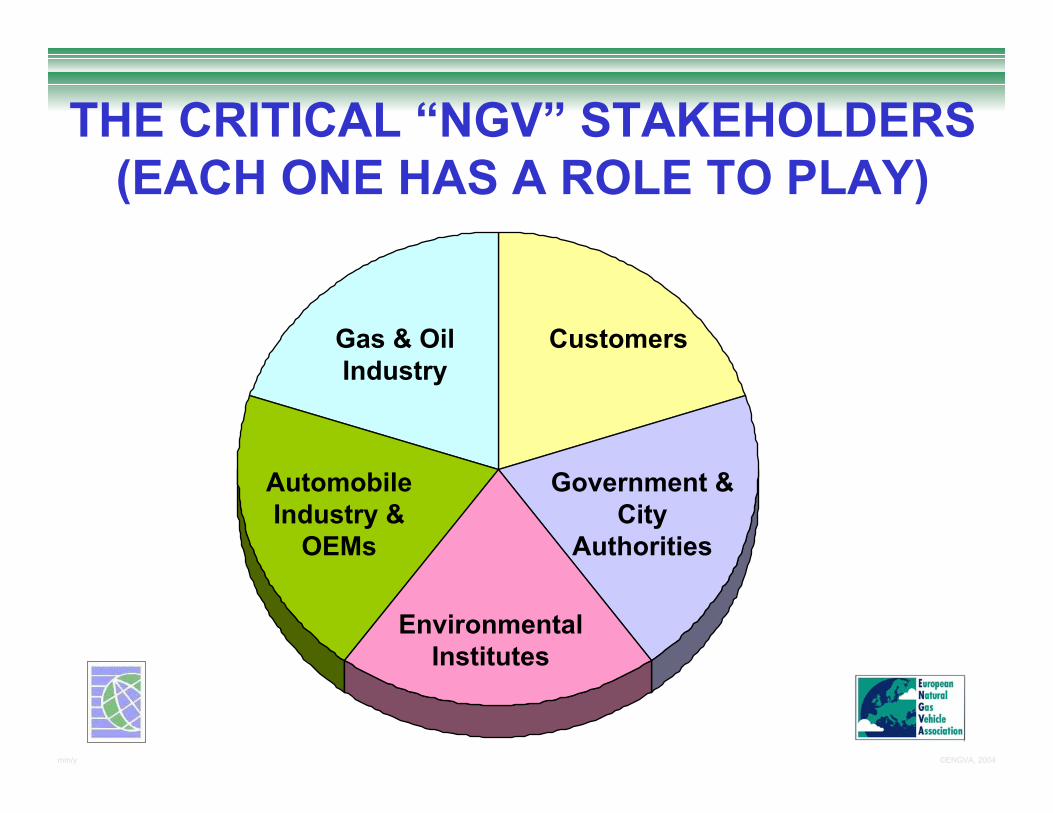
THE CRITICAL “NGV” STAKEHOLDERS (EACH ONE HAS A ROLE TO PLAY)
Gas & Oil Industry
Customers
Government & City
Authorities
Environmental Institutes
Automobile Industry &
OEMs
mm/y ©ENGVA, 2004
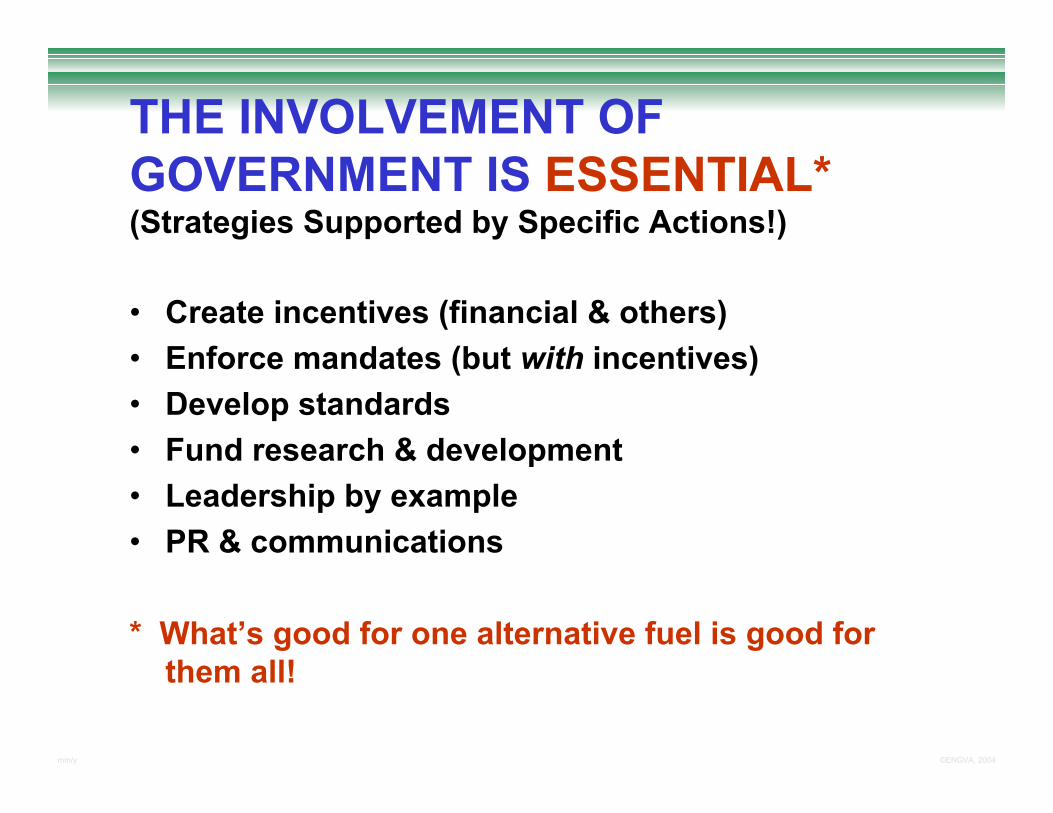
THE INVOLVEMENT OF GOVERNMENT IS ESSENTIAL*(Strategies Supported by Specific Actions!)
• Create incentives (financial & others)• Enforce mandates (but with incentives)• Develop standards• Fund research & development• Leadership by example• PR & communications
* What’s good for one alternative fuel is good for them all!
mm/y ©ENGVA, 2004
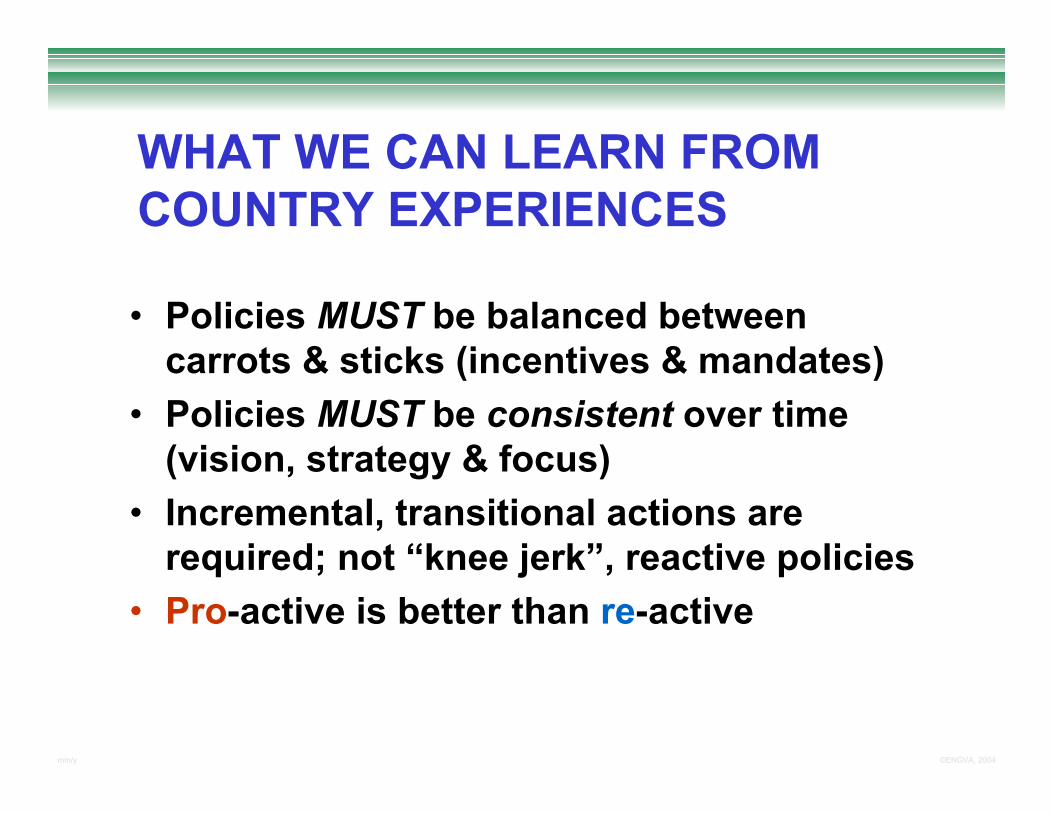
WHAT WE CAN LEARN FROM COUNTRY EXPERIENCES
• Policies MUST be balanced between carrots & sticks (incentives & mandates)
• Policies MUST be consistent over time (vision, strategy & focus)
• Incremental, transitional actions are required; not “knee jerk”, reactive policies
• Pro-active is better than re-active
mm/y ©ENGVA, 2004
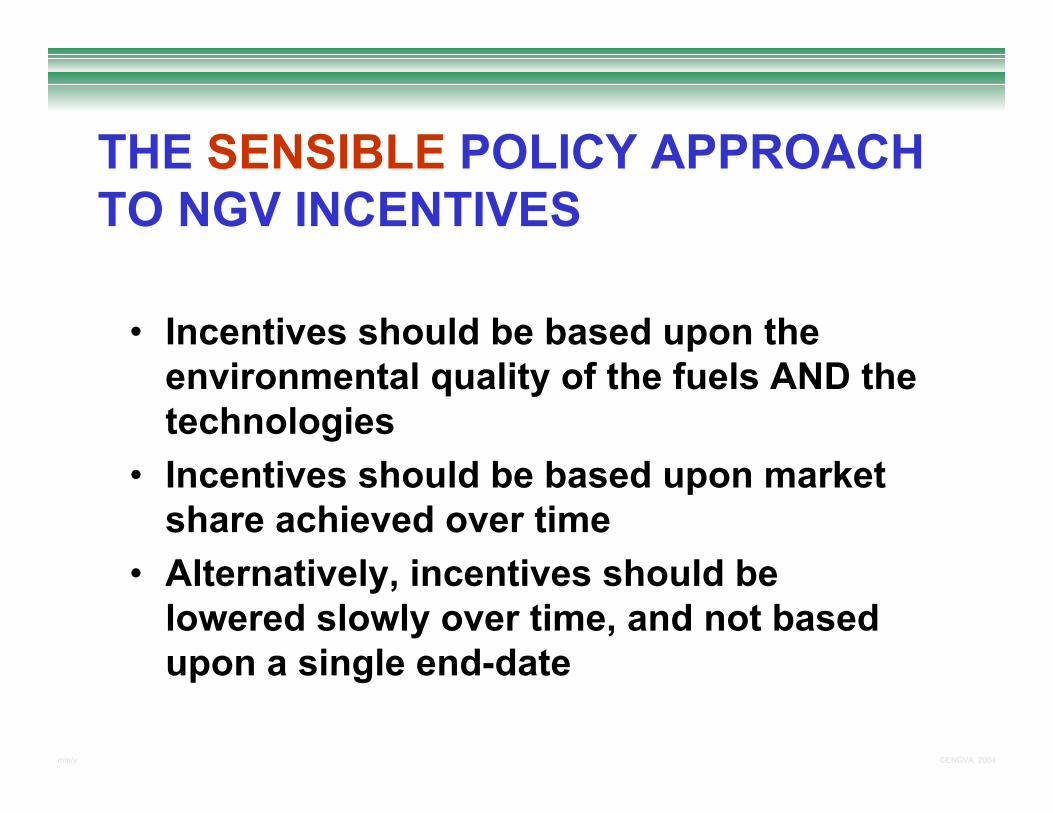
THE SENSIBLE POLICY APPROACH TO NGV INCENTIVES
• Incentives should be based upon the environmental quality of the fuels AND the technologies
• Incentives should be based upon market share achieved over time
• Alternatively, incentives should be lowered slowly over time, and not based upon a single end-date
mm/y ©ENGVA, 2004
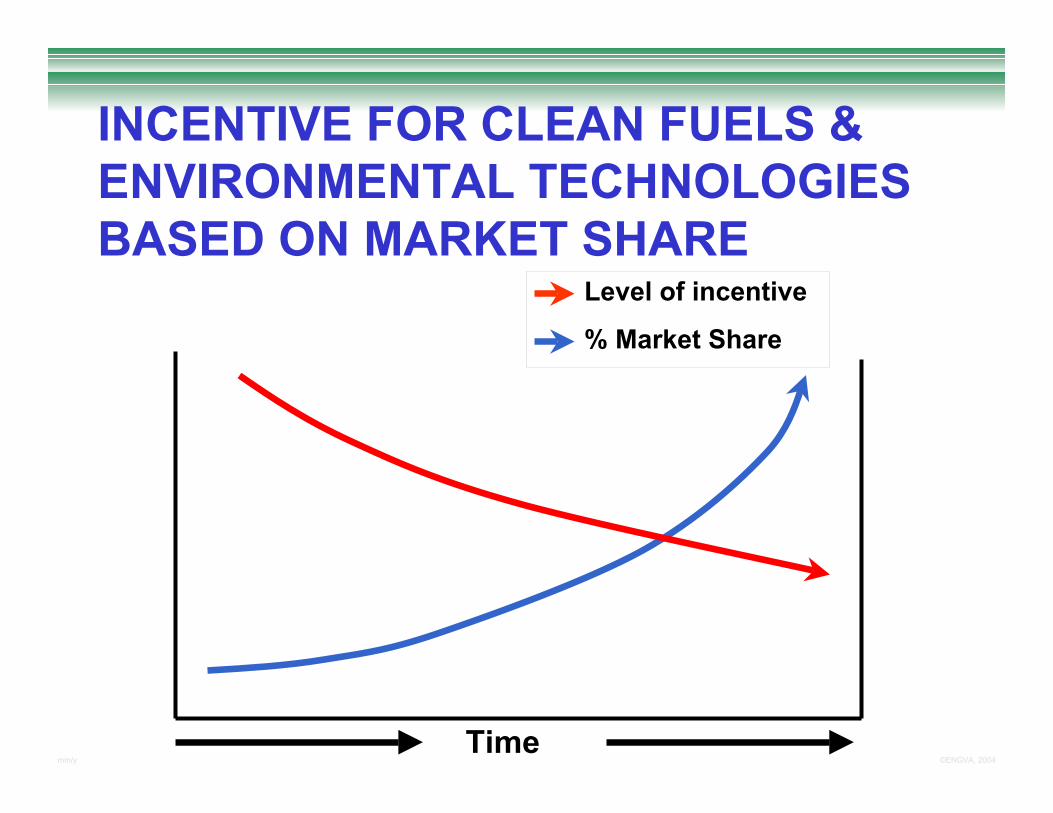
INCENTIVE FOR CLEAN FUELS & ENVIRONMENTAL TECHNOLOGIES BASED ON MARKET SHARE
Level of incentive
% Market Share
Time
mm/y ©ENGVA, 2004
IN CONCLUSION• There are no fuel panaceas.• NGVs, even with issues of fuel storage
and infrastructure development remain a fuel of choice (environment & energy security).
• More people have to be informed of its potential, the benefits, and of the contribution to improved air quality and energy security.
• Not easy market…but valuable in pursuing! It takes a long time…to be sustainable.
• Hydrogen link to the future is important!
mm/y ©ENGVA, 2004
UNITED NATIONS INITIATIVES 2005
• World harmonisation of gaseous fuel & vehicle standards (with ISO & UN)
• Road signage for cng fuelling stations (WP1 Traffic Safety)
• On-going amendments and harmonisation of standards(WP.29 & GRPE)
mm/y ©ENGVA, 2004
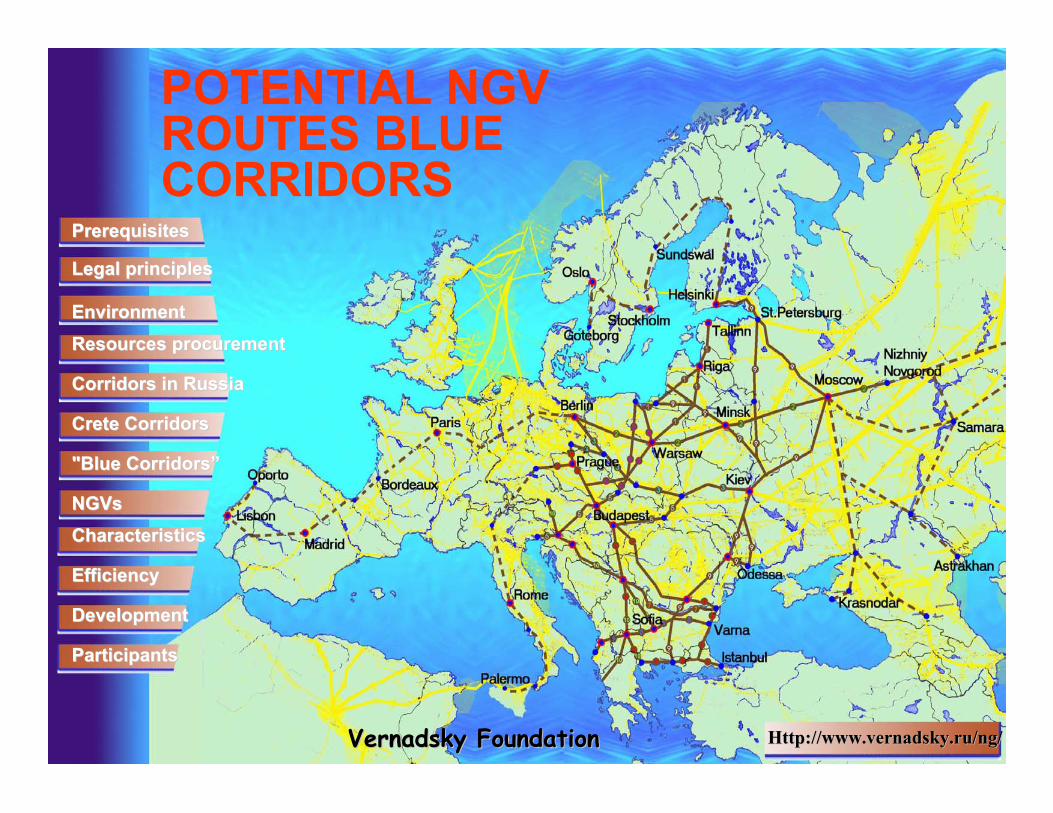
POTENTIAL NGV ROUTES BLUE CORRIDORS
Http://www.vernadsky.ru/ng/Http://www.vernadsky.ru/ng/
PrerequisitesPrerequisites
Legal principlesLegal principles
Environment Environment
Resources procurementResources procurement
Corridors in RussiaCorridors in Russia
CharacteristicsCharacteristics
EfficiencyEfficiency
DevelopmentDevelopment
ParticipantsParticipants
"Blue Corridors”"Blue Corridors”
NGVsNGVs
Crete CorridorsCrete Corridors
VernadskyVernadsky FoundationFoundation
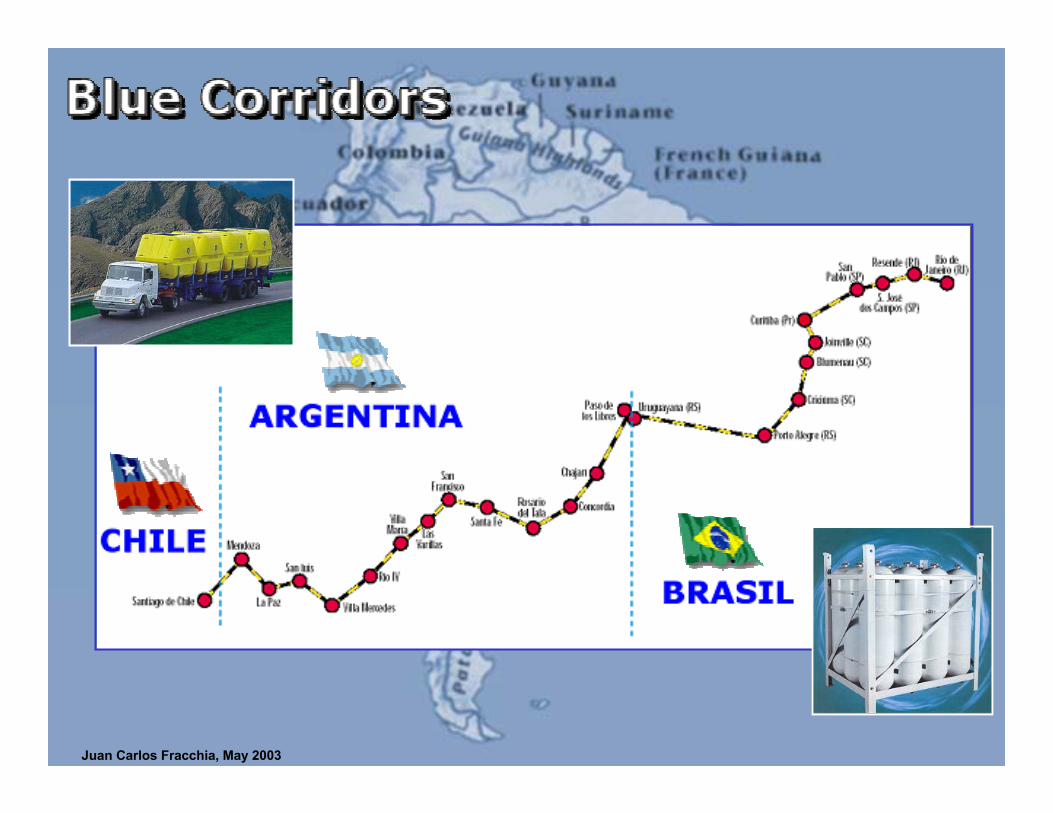
mm/y ©ENGVA, 2004Juan Carlos Fracchia, May 2003
mm/y ©ENGVA, 2004
VISIT THE ASSOCIATION WEBSITES!!!
• www.iangv.org.nz
• www.engva.org
• www.ngvc.org
mm/y ©ENGVA, 2004
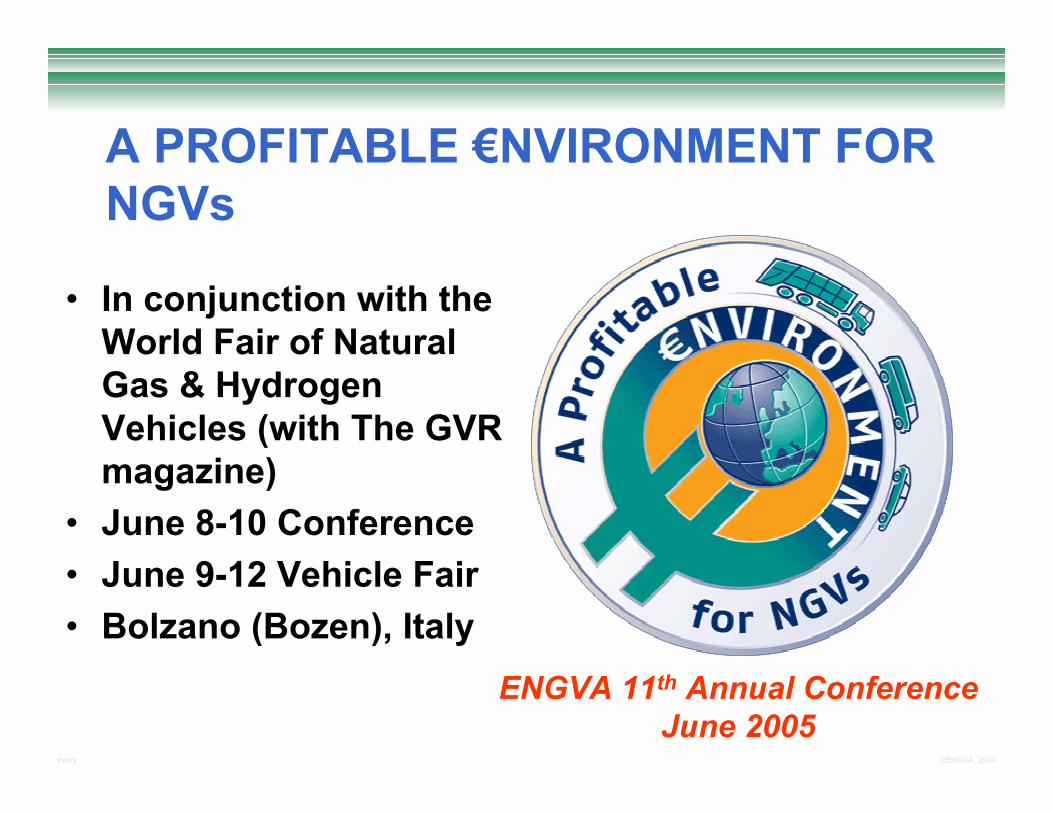
• In conjunction with the World Fair of Natural Gas & Hydrogen Vehicles (with The GVR magazine)
• June 8-10 Conference• June 9-12 Vehicle Fair• Bolzano (Bozen), Italy
A PROFITABLE €NVIRONMENT FOR NGVs
ENGVA 11th Annual ConferenceJune 2005
mm/y ©ENGVA, 2004
23rd WORLD GAS CONFERENCE
Anyone interested in participating in this Study Group 5.3. Natural Gas for Vehicles: Global Opportunities for Natural Gas as a Transportation Fuel for Today and Tomorrow, please contact [email protected] or [email protected]

mm/y ©ENGVA, 2004
EMERGING MODELS of NGV MARKET DEVELOPMENT
United NationsWorking Party on Gas
20 January 2005Dr. Jeffrey M. Seisler
Executive Director
GENEVAGENEVA