Genetic structure and core collection of the World Olive ...
12
Genetic structure and core collection of the World Olive Germplasm Bank of Marrakech: towards the optimised management and use of Mediterranean olive genetic resources Hicham Haouane • Ahmed El Bakkali • Abdelmajid Moukhli • Christine Tollon • Sylvain Santoni • Ahmed Oukabli • Cherkaoui El Modafar • Bouchaib Khadari Received: 11 March 2011 / Accepted: 5 September 2011 Ó The Author(s) 2011. This article is published with open access at Springerlink.com Abstract The conservation of cultivated plants in ex-situ collections is essential for the optimal management and use of their genetic resources. For the olive tree, two world germplasm banks (OWGB) are presently established, in Co ´rdoba (Spain) and Marrakech (Morocco). This latter was recently founded and includes 561 accessions from 14 Mediterranean countries. Using 12 nuclear microsatellites (SSRs) and three chloroplast DNA markers, this collection was characterised to examine the structure of the genetic diversity and propose a set of olive accessions encom- passing the whole Mediterranean allelic diversity range. We identified 505 SSR profiles based on a total of 210 alleles. Based on these markers, the genetic diversity was similar to that of cultivars and wild olives which were previously characterised in another study indicating that OWGB Marrakech is representative of Mediterranean olive germplasm. Using a model-based Bayesian clustering method and principal components analysis, this OWGB was structured into three main gene pools corresponding to eastern, central and western parts of the Mediterranean Basin. We proposed 10 cores of 67 accessions capturing all detected alleles and 10 cores of 58 accessions capturing the 186 alleles observed more than once. In each of the 10 cores, a set of 40 accessions was identical, whereas the remaining accessions were different, indicating the need to include complementary criteria such as phenotypic adap- tive and agronomic traits. Our study generated a molecular database for the entire OWGB Marrakech that may be used to optimise a strategy for the management of olive genetic Electronic supplementary material The online version of this article (doi:10.1007/s10709-011-9608-7) contains supplementary material, which is available to authorized users. H. Haouane B. Khadari (&) INRA, UMR 1334 Ame ´lioration Ge ´ne ´tique et Adaptation des Plantes (AGAP), 34398 Montpellier, France e-mail: [email protected] H. Haouane A. El Bakkali Montpellier SupAgro, UMR 1334 AGAP, 34398 Montpellier, France H. Haouane C. El Modafar Universite ´ Cadi Ayyad, Faculte ´ des Sciences et Techniques Gue ´liz, Laboratoire AgroBiotechL02B005, 40000 Marrakech, Morocco A. El Bakkali A. Oukabli INRA, UR Ame ´lioration des Plantes et Conservation des Ressources Phytoge ´ne ´tiques, Mekne `s, Morocco A. El Bakkali Faculty of Bioscience Engineering, University of Ghent, Coupure links 653, 9000 Ghent, Belgium A. Moukhli INRA, UR Ame ´lioration des Plantes, Marrakech, Morocco C. Tollon S. Santoni INRA, UMR 1334 Ame ´lioration Ge ´ne ´tique et Adaptation des Plantes (AGAP), 34060 Montpellier, France B. Khadari Conservatoire Botanique National Me ´diterrane ´en de Porquerolles (CBNMED), UMR 1334 AGAP, 34398 Montpellier, France 123 Genetica DOI 10.1007/s10709-011-9608-7
Transcript of Genetic structure and core collection of the World Olive ...

Genetic structure and core collection of the World OliveGermplasm Bank of Marrakech: towards the optimisedmanagement and use of Mediterranean olive genetic resources
Hicham Haouane • Ahmed El Bakkali • Abdelmajid Moukhli •
Christine Tollon • Sylvain Santoni • Ahmed Oukabli •
Cherkaoui El Modafar • Bouchaib Khadari
Received: 11 March 2011 / Accepted: 5 September 2011
� The Author(s) 2011. This article is published with open access at Springerlink.com
Abstract The conservation of cultivated plants in ex-situ
collections is essential for the optimal management and use
of their genetic resources. For the olive tree, two world
germplasm banks (OWGB) are presently established, in
Cordoba (Spain) and Marrakech (Morocco). This latter was
recently founded and includes 561 accessions from 14
Mediterranean countries. Using 12 nuclear microsatellites
(SSRs) and three chloroplast DNA markers, this collection
was characterised to examine the structure of the genetic
diversity and propose a set of olive accessions encom-
passing the whole Mediterranean allelic diversity range.
We identified 505 SSR profiles based on a total of 210
alleles. Based on these markers, the genetic diversity was
similar to that of cultivars and wild olives which were
previously characterised in another study indicating that
OWGB Marrakech is representative of Mediterranean olive
germplasm. Using a model-based Bayesian clustering
method and principal components analysis, this OWGB
was structured into three main gene pools corresponding to
eastern, central and western parts of the Mediterranean
Basin. We proposed 10 cores of 67 accessions capturing all
detected alleles and 10 cores of 58 accessions capturing the
186 alleles observed more than once. In each of the 10
cores, a set of 40 accessions was identical, whereas the
remaining accessions were different, indicating the need to
include complementary criteria such as phenotypic adap-
tive and agronomic traits. Our study generated a molecular
database for the entire OWGB Marrakech that may be used
to optimise a strategy for the management of olive geneticElectronic supplementary material The online version of thisarticle (doi:10.1007/s10709-011-9608-7) contains supplementarymaterial, which is available to authorized users.
H. Haouane � B. Khadari (&)
INRA, UMR 1334 Amelioration Genetique et Adaptation des
Plantes (AGAP), 34398 Montpellier, France
e-mail: [email protected]
H. Haouane � A. El Bakkali
Montpellier SupAgro, UMR 1334 AGAP, 34398 Montpellier,
France
H. Haouane � C. El Modafar
Universite Cadi Ayyad, Faculte des Sciences et Techniques
Gueliz, Laboratoire AgroBiotechL02B005, 40000 Marrakech,
Morocco
A. El Bakkali � A. Oukabli
INRA, UR Amelioration des Plantes et Conservation des
Ressources Phytogenetiques, Meknes, Morocco
A. El Bakkali
Faculty of Bioscience Engineering, University of Ghent,
Coupure links 653, 9000 Ghent, Belgium
A. Moukhli
INRA, UR Amelioration des Plantes, Marrakech, Morocco
C. Tollon � S. Santoni
INRA, UMR 1334 Amelioration Genetique et Adaptation des
Plantes (AGAP), 34060 Montpellier, France
B. Khadari
Conservatoire Botanique National Mediterraneen de
Porquerolles (CBNMED), UMR 1334 AGAP,
34398 Montpellier, France
123
Genetica
DOI 10.1007/s10709-011-9608-7

resources and their use for subsequent genetic and genomic
olive breeding.
Keywords Olea europaea � SSR characterisation �Chloroplast DNA markers � Model-based Bayesian
clustering � Allelic diversity capture
Introduction
The olive tree (Olea europaea L.) is one of the most
important fruit crops of the Mediterranean area (Zohary
and Spiegel-Roy 1975). Palynological and anthracological
(fossil charcoal) studies have shown that wild olive popu-
lations were present in eastern and western Mediterranean
zones before the Neolithic (Terral et al. 2004; Carrion et al.
2010). Early domesticated forms were probably dissemi-
nated during successive human migrations (especially from
east to west) throughout the Mediterranean Basin, but olive
selection from local western populations has also been
revealed by genetic studies (Besnard et al. 2002; Breton
et al. 2006; Khadari et al. 2008).
Today, the area devoted to olive growing worldwide is
estimated at 8.8 Mha (IOC 2007). It is one of the most
economically important trees in Mediterranean areas, lar-
gely due to its multiple uses (e.g. oil, canned fruit, wood,
ornamental uses, medicinal applications). Over 2,000
cultivars have been described, exhibiting significant levels
of variation in oil content, fruit size and adaptation to
local environmental conditions (Bartolini et al. 1998), but
this number is probably underestimated since there is a
lack of information on minor local varieties (Cantini et al.
1999).
Olive growing is undergoing a sharp transition from
traditional to modern orchards, with a reduced number of
main varieties featuring interesting agronomic traits such
as yield, oil quality, and adaptive traits related to biotic
and abiotic stresses. For instance, the ‘‘Picual’’ and ‘‘Ar-
bequina’’ varieties have been massively planted over the
last two decades in Andalusia and Catalonia, respectively
(Belaj et al. 2010). A similar trend was noted in Portugal,
with the main cultivar ‘‘Galega’’ grown in about 80% of
the olive groves (Gemas et al. 2004), and in Morocco
where ‘‘Picholine Marocaine’’ is the dominant cultivar
throughout the country (Khadari et al. 2008). Hence,
despite the high initial varietal diversity, a recent trend
towards establishing modern orchards based on the most
productive cultivars leads to high erosion of this germ-
plasm. Several olive germplasm collections have been
created at national and regional levels to manage ex-situ
olive genetic resources for conservation purposes and
eventual use in subsequent breeding programs (Bartolini
2008). The first major attempt to conserve and
characterise the most important cultivars from all olive
growing countries led to the establishment of the World
Olive Germplasm Bank in Cordoba, Spain (OWGB Cor-
doba). This bank was initiated by FAO-INIA in 1970,
with the contribution of the International Olive Oil
Council (IOOC; Caballero et al. 2006). It includes Spanish
cultivars that were collected by Barranco and Rallo (2000)
and varieties originating from other Mediterranean coun-
tries. OWGB Cordoba has served for many studies using
morphological descriptors (Caballero and del Rıo 2002)
and molecular markers such as random amplified poly-
morphism DNA (RAPDs) and single sequence repeat
(SSRs; Belaj et al. 2003, 2004).
Over the course of the RESGEN project, numerous
surveys and studies on conservation and characterisation
have been conducted by each of the following 15 par-
ticipating countries: Algeria, Croatia, Cyprus, Egypt,
France, Greece, Israel, Italy, Morocco, Portugal, Serbia-
Montenegro, Slovenia, Spain, Syria, Tunisia (Caballero
et al. 2006). These partners have completed their sam-
pling by collecting local olive cultivars based on a
morphological characterisation. As genetic redundancies,
homonymy and synonymy cases are common problems
in the management of ex-situ collections (Engels and
Visser 2003), morphological description has been com-
plemented by the use of molecular markers. Recently, the
development of SSRs in olive (e.g. Sefc et al. 2000; de
La Rosa et al. 2002) has significantly enhanced the
possibility of individual olive cultivar identification.
After testing 37 SSR loci for their reproducibility and
discriminating power in four independent laboratories,
Baldoni et al. (2009) proposed a consensus list of SSRs
for genotyping of cultivated olive.
More recently, a second international germplasm bank
was set up at the experimental orchard of Tessaout
[National Institute of Agronomic Research, Marrakech,
Morocco; (OWGB Marrakech)] in 2003. Compared to
OWGB Cordoba, OWGB Marrakech was set up in a dif-
ferent scientific context with more knowledge available
about the plant material. To optimise olive germplasm
sampling, local genetic resources had been characterised in
several Mediterranean countries using standardised mor-
phological descriptors. The bank was established by
introducing previously characterised genetic resources
from each Mediterranean area. For some partner countries
(e.g. Spain; Barranco and Rallo 2000), a set of accessions
representative of the local diversity was proposed follow-
ing morphological or molecular characterisation. In 2010,
OWGB Marrakech included 561 accessions originating
from 14 Mediterranean countries and further introduction
of additional olive germplasm is ongoing.
To optimise the management and use of the large olive
ex-situ collections, it is essential to select a sub-sample of
Genetica
123

accessions, so-called core collections, displaying the
overall genetic diversity and phenotypic variability, as first
proposed by Frankel and Brown (1984). Several strategies
have been proposed to facilitate the construction of core
collections, which can be classified into two groups
according to the allocation methods. The first one is based
on maximising the variability, including the M-Method
strategy developed by Schoen and Brown (1993) and
implemented in the MSTRAT software package (Goues-
nard et al. 2001); and the second group, known as the
stratified method, is based on similarity clustering (Es-
cribano et al. 2008). Among numerous potential applica-
tions, core collections can be used as a first step in genetic
association studies for detecting quantitative trait loci
(QTLs) related to agromonic traits (Barnaud et al. 2006; Le
Cunff et al. 2008; Aranzana et al. 2010).
Several molecular characterisation studies have focused
on olive germplasm at local or national levels (Belaj et al.
2004; Banilas et al. 2003), but also at the scale of the
Mediterranean Basin (Besnard et al. 2001a; Sarri et al.
2006). Olive cultivars analysed in these latter studies were
considered as representative of local or Mediterranean
genetic diversity, but to date no genetic studies of the entire
OWGB have been published. Different aspects have been
addressed in previous studies and, for instance, an analysis
of genetic relationships among Mediterranean olive culti-
vars revealed a correlation between genetic structure and
geographical origin of cultivars, suggesting multilocal
olive selection from different genetic pools (Besnard et al.
2001a). More recently, Sarri et al. (2006) conducted a study
of genetic relationships based on SSRs among 118 cultivars
sampled in several Mediterranean countries and showed
that Mediterranean olive germplasm was structured into
three main gene pools, corresponding to the western, cen-
tral and eastern Mediterranean regions. Studies on genetic
structure have also been conducted on wild olive trees (or
oleasters) or for investigating genetic relationships between
wild and cultivated olives (Besnard et al. 2002, 2007;
Breton et al. 2006; Belaj et al. 2010).
The purpose of this study was to investigate the genetic
structure of the entire OWGB Marrakech, including all 561
accessions, using both nuclear SSRs and chloroplast DNA
markers. The genetic structure of Mediterranean olive
germplasm was investigated using model-based Bayesian
clustering method to assign individuals into defined gene
pools according to genetic and geographic criteria. This
study also provides critical baseline information for the
development of core collections to maximise the repre-
sentativeness of olive genetic diversity. Our results repre-
sent an essential step towards optimised conservation of
olive genetic resources and subsequently for genetic asso-
ciation studies to detect QTLs of adaptive and agronomic
interest.
Materials and methods
Plant material
A total of 561 accessions maintained in the ex-situ World
Olive Germplasm Bank at the experimental orchard of
Tessaout (OWGB, INRA Marrakech, Morocco) were ana-
lysed. These accessions were derived from 14 olive-
growing countries: Algeria (43 accessions), Croatia (16),
Cyprus (28), Egypt (19), France (12), Greece (13), Italy
(167), Lebanon (16), Morocco (40), Portugal (14), Slovenia
(9), Spain (89), Syria (71) and Tunisia (24) (Table 1 and
Supplementary file, Table S1). This second OWGB was
launched in 2003 under IOOC supervision (see website:
http://www.internationaloliveoil.org/), approximately
20 years after the first one was set up at IFAPA Cordoba
(OWGB Cordoba, Spain). OWGB Cordoba mainly
includes Spanish accessions (271) and 172 accessions from
the following countries: Albania (7 accessions), Algeria
Table 1 Locality, sample size, multilocus SSR profiles and maternal
lineages of olive accessions maintained in the OWGB collection
Marrakech (INRA, Morocco)
Geographical origin Sample
size
SSR
profile
Maternal lineagea
Western
Mediterraneanb
Morocco 40 31 31 E
Portugal 14 14 14 E1
Spain 89 89 80 E1, 6 E2, 3 E3
Central
Mediterraneanb
Algeria 43 40 32 E1, 8 E3
Tunisia 24 24 24 E1
France 12 12 10 E1, 1 E2, 1 E3
Italy 167 165 161 E1, 2 E2, 2 E3
Croatia 16 14 14 E1
Slovenia 9 9 9 E1
Greece 13 13 11 E1, 2 E2
Eastern
Mediterraneanb
Egypt 19 19 19 E1
Cyprus 28 23 23 E1
Lebanon 16 13 13 E1
Syria 71 47 47 E1
Total 561 513 488 E1, 11 E2, 14
E3
a Number of individuals classified into the three maternal lineages as
defined by Besnard et al. (2007): E1 from the eastern Mediterranean;
E2 and E3 from the western Mediterraneanb Olive accessions were classified into three main gene pools
according to model-Bayesian clustering: western, central and eastern
Mediterranean gene pools (see Fig. 1)
Genetica
123

(2), Argentina-Chile (1), Croatia (5), Egypt (4), France
(10), Greece (19), Israel (3), Italy (32), Lebanon (3),
Morocco (3), Portugal (12), Slovenia (1), Syria (36)
Tunisia (9), Turkey (23), USA (2) (http://www.
oleadb.it/olivodb.html; Bartolini et al. 1998). Among the
384 and 491 cultivars identified in OWGB Cordoba and
OWGB Marrakech, respectively; only 153 are present in
both collections, while most of the accessions are exclu-
sively present in one collection (338 only present in
OWGB Marrakech and 231 present in OWGB Cordoba
including 157 Spanish cultivars; Supplementary file, Table
S1).
OWGB Marrakech was set up following the ResGen
project, which included most Mediterranean olive-growing
countries. Olive genetic resources for each partner Medi-
terranean country have been characterised using standard-
ised morphological descriptors. Hence, OWGB Marrakech
included different national olive germplasm previously
characterised using morphological descriptors alone, or
both morphological descriptors and molecular markers. The
composition of national olive genetic resources refers to the
number of accessions, the representativeness of ancient and
modern olive orchards in different areas and agro-ecosys-
tems, and the ratio between main, minor and local cultivars,
as supervised by each national institute in charge of their
olive genetic resource management. According to a recent
study (Sarri et al. 2006), cultivated olive accessions were
clustered into three main gene pools respectively distributed
in the eastern, central and western Mediterranean Basin.
Based on this study, the accessions analysed here are clas-
sified into three distinct regional groups: (1) a western
Mediterranean group, including accessions originating from
Morocco, Portugal, and Spain; (2) a central Mediterranean
group, with accessions from Algeria, Tunisia, France, Italy,
Slovenia, Croatia, and Greece; and (3) an eastern Mediter-
ranean group, including accessions from Egypt, Cyprus,
Lebanon, and Syria (Table 1).
DNA preparation and genotyping procedure
Genomic DNA was extracted from 100 mg of fresh leaf
tissue, as described in Khadari et al. (2008). DNA quality
was checked on 2% agarose gel and the DNA concentra-
tion was estimated using spectrofluorometry.
Twelve nuclear DNA SSR loci were selected according
to their level of polymorphism and reproducibility, as well
as by an easy and accurate scoring method (data not
shown): DCA03, DCA04, DCA05, DCA08, DCA09,
DCA11, DCA15, DCA18 (Sefc et al. 2000); GAPU59,
GAPU71B (Carriero et al. 2002); UDO36 (Cipriani et al.
2002) and EMO90 (de La Rosa et al. 2002). In addition, the
three maternal lineages (E1, E2, and E3; Besnard et al.
2007) were detected using a combination of three
chloroplastic indel markers; psbK-trnS-polyT-A, trnS-G-
indel-1, and trnS-G-indel-2 (Besnard et al. 2003). PCR
amplification was carried out in a total volume of 20 ll
containing 20 or 10 ng of genomic DNA for nuclear SSR
or chloroplast indel genotyping, respectively, 1.5 mM
MgCl2, 0.2 M of each dNTP, 0.1 units of Taq DNA
polymerase, and 2 pmol of forward (fluorescent labelled;
Table 2) and reverse primers. Reactions were performed in
a thermal cycler (Mastercycler ep gradient S). PCR prod-
ucts were separated using an automatic capillary sequencer
(ABI 3130 Genetic Analyzer Applied Biosystems) and
chromatograms were then analysed with the GenMapper
3.7 software (Applied Biosystems).
Data analysis
Genetic diversity and multivariate analysis
Based on the scored-size SSR allele dataset, we computed
the following genetic diversity parameters: for each SSR
locus, the number of alleles (Na) and the observed heter-
ozygosity (HO) were calculated using Genetix 4.05 (Belk-
hir et al. 2004). The probability of identity PI (Paetkau
et al. 1995) was computed using IDENTITY 4.0 (Wagner
and Sefc 1999). The discriminating power (D) was com-
puted as defined by Tessier et al. (1999): Dj =P
pi
[(Npi - 1)/N - 1)], where pi is the frequency of the ith
molecular profile revealed at locus j, and N is the number
of identified genotypes.
Genetic relationships among the single genetic profiles
(i.e. 505 genotypes were distinguished based on SSRs, see
below) were studied via principal component analysis
(PCA) using the Genalex 6 program (Peakall and Smouse
2005). Genotypes were plotted on the first two principal
axes to visualise genetic affinities.
Bayesian model-based clustering approach
To identify the genetic structure in Mediterranean olive
germplasm, a model-based analysis was performed using
STRUCTURE 2.2.3 (Pritchard et al. 2000) based on SSR
data. This program assumes Hardy–Weinberg equilibrium
and linkage equilibrium within clusters. The analysis was
done without prior information concerning the geographic
origin of the accessions. The STRUCTURE algorithm was
run using the ‘‘admixture model’’, assuming a ‘‘correlation
among allele frequencies’’, with 10 independent replicate
runs per K value (number of clusters) ranging from 1 to 10.
Each run involved a burning period of 100,000 iterations,
and a post burning simulation length of 1,000,000.
Validation of the most likely number of clusters K was
performed using the statistics proposed by Evanno et al.
(2005). Q-matrix values for individual runs for each K were
Genetica
123

analysed by the CLUMPP 1.1 program (Jakobsson and
Rosenberg 2007). Matrixes of individuals are represented
as colored histograms of q values were constructed using
DISTRUCT 1.1 (Rosenberg 2004).
Core collection sampling
The M-strategy (Maximisation strategy) proposed by
Schoen and Brown (1993) and implemented in the
MSTRAT software (Gouesnard et al. 2001) was used to
generate core olive collections that maximise the number
of observed alleles in the data set. The M-strategy consists
in searching, among all potential core collections, for the
best sample size that can capture all observed alleles with
the highest genetic diversity score. After having deter-
mined the optimal size of the core subsets, 1,000 core
collections were generated independently using the
redundancy option with 10 independent runs and 1,000
iterations. Based on the 1,000 core collections obtained, we
selected the reference core collection according to its Nei
diversity index (Nei 1987) as first criterion, and then on the
basis of its composition (representativeness among three
gene pools and maternal lineages of accessions). Core
subsets were constructed using all the observed alleles and
without private alleles (observed once) to limit the impact
of the later on genetic structure and on linkage disequi-
librium (LD; Barnaud et al. 2006; Aranzana et al. 2010).
The distribution of the selected core accessions was plotted
on the first two PCA axes.
Results
SSR polymorphism
Based on SSR data (i.e. 210 alleles for the 12 loci;
Table 2), the analysis of 561 accessions revealed 505
genotypes. The number of alleles detected per locus ranged
from 8 at the DCA15 locus to 30 at the DCA04 locus. The
number of single genotypes identified per locus ranged
from 14 to 95, with an average of 50.4 genotypes. Fre-
quencies observed for the 210 alleles ranged from 0.001 to
0.71, with an average of 0.05. There were 151 alleles
(71.9%) with frequencies equal to or less than 5%, which
were considered as rare alleles (Supplementary file, Table
S2). The reliability of the 24 alleles observed once was also
checked by examining their occurrence in Mediterranean
oleaster populations (unpublished data). The observed
Table 2 Locus name, fluorescent dye-labelled, size range of amplified fragments (bp), number of alleles per locus (Na), observed heterozygosity
(HO), discriminating power (D) and probability of identity (PI)
Locus name Fluorescent
dye
Allele size range
(bp)
Alleles Profile D PI
Na Rare alleles*
(%)
Once observed alleles
(%)
HO
DCA04a,1 HEX 117–193 30 24 (80) 2 (6) 0.62 95 0.95 0.034
DCA09a,1 NED 162–219 24 17 (70) 2 (8) 0.93 92 0.96 0.025
DCA15a,1 FAM 231–266 08 4 (50) 3 (37) 0.65 14 0.77 0.191
DCA05a,2 FAM 192–218 14 10 (71) 2 (14) 0.49 31 0.71 0.273
DCA08a,3 FAM 125–168 19 14 (73) 4 (21) 0.90 50 0.92 0.054
DCA03a,2 NED 229–265 14 7 (50) 1 (7) 0.89 49 0.95 0.032
DCA18a,3 NED 155–207 19 13 (68) 1 (5) 0.83 58 0.93 0.044
DCA11a,4 HEX 126–196 25 20 (80) 3 (12) 0.71 83 0.93 0.054
GAPU59b,3 HEX 207–241 12 8 (67) 2 (16) 0.68 23 0.81 0.185
GAPU71Bb,4 FAM 117–166 14 9 (64) 1 (7) 0.90 38 0.93 0.051
UDO36c,2 HEX 134–168 16 13 (81) 1 (6) 0.69 41 0.89 0.110
EMO90d,4 FAM 160–210 15 11 (73) 2 (15) 0.79 31 0.85 0.132
Mean – – 17.5 12.5 2 0.76 50.41 0.88 2.55 9 10-14
Total – – 210 150 (70) 24 (11) – – – –
* Observed alleles with frequencies of less than (5%)a Sefc et al. (2000)b Carriero et al. (2002)c Cipriani et al. (2002)d de la Rosa et al. (2002)1–4 Number of the four used multiplexing PCRs
Genetica
123

heterozygosity (HO) ranged from 0.49 at the DCA05 locus
to 0.93 at the DCA09 locus, with a mean of 0.76. The
highest probability identity (PI) value (0.273) was at the
DCA05 locus and the lowest (0.025) was at the DCA03
locus (Table 2). Based on the 12 SSR loci, the cumulative
probability identity was 2.55 9 10-14, indicating that the
probability of two randomly sampled olive trees having the
same genotype was extremely low.
Characterisation of olive accessions
Among the identified 505 multilocus SSR profiles, 26
synonymous cases involving 82 accessions were detected
(Supplementary file, Table S3). For instance, some acces-
sions shared the same genotype: accessions ‘‘PM4 5116’’,
‘‘PM3 5112’’, ‘‘ZDH1’’, ‘‘ZDH3’’, ‘‘ZDH7’’, ‘‘Zsb10’’ and
‘‘ZZ1’’ in Morocco shared SSR profile no. 002, and ‘‘Hu-
maissi’’, ‘‘Adgam’’ and ‘‘Souri’’ in Syria shared SSR pro-
file no. 464. Otherwise, some accessions from different
countries shared the same SSR profile, such as the ‘‘Zmj1’’
accession from Morocco and the ‘‘Zabarka’’ accession
from Croatia (see Supplementary file, Table S3).
In the 127,260 pairwise comparisons among the 505
identified genotypes, only 366 comparisons (0.28%) repre-
sented closely related genotypes that differed by one to seven
dissimilar alleles, whereas the remaining pairwise genotypes
were distinguished by 8–44 dissimilar alleles (Supplementary
file, Fig. S1). The highest SSR dissimilarity (44 dissimilar
SSR alleles) was noted in only one genotype pair, i.e.
‘‘Souidi’’ from Algeria and ‘‘Baladi’’ from Lebanon.
Genetic structure of Mediterranean olive tree
accessions
Using model-based Bayesian clustering, the genetic struc-
ture of Mediterranean olive genotypes was examined under
the models with K = 2–6 clusters (Fig. 1). According to
the K = 2 model, most olive accessions from Morocco,
Portugal and Spain were distinguished from other Medi-
terranean olive trees. At K = 3, cultivars from France,
Algeria, Tunisia, Italy, Slovenia, Croatia and Greece
(central Mediterranean group) were mostly assigned to
cluster 3 and distinguished from cluster 2, which mostly
included accessions from the eastern Mediterranean region.
Actually, cluster 3 also included several accessions with
mixed inferred ancestry from the western and eastern
Mediterranean gene pools (Table 3, Fig. 1, and Supple-
mentary file Table S4). At K = 4–6, the Mediterranean
olive germplasm, structured into three gene pools, i.e.
eastern, western and central Mediterranean groups, was not
modified since the fourth, fifth and sixth inferred ancestry
gene pools were detected mainly in accessions of the
central Mediterranean group (Fig. 1).
Based on the highest DK and H0 values, K = 3 appeared
to be the best model for olive genetic structure (Fig. 1; and
see Supplementary file, Fig. S2), supporting the existence
of the three gene pools described above. For groups 1 and
3, most genotypes were classified into one cluster based on
the shared ancestry values, which were higher than 0.80;
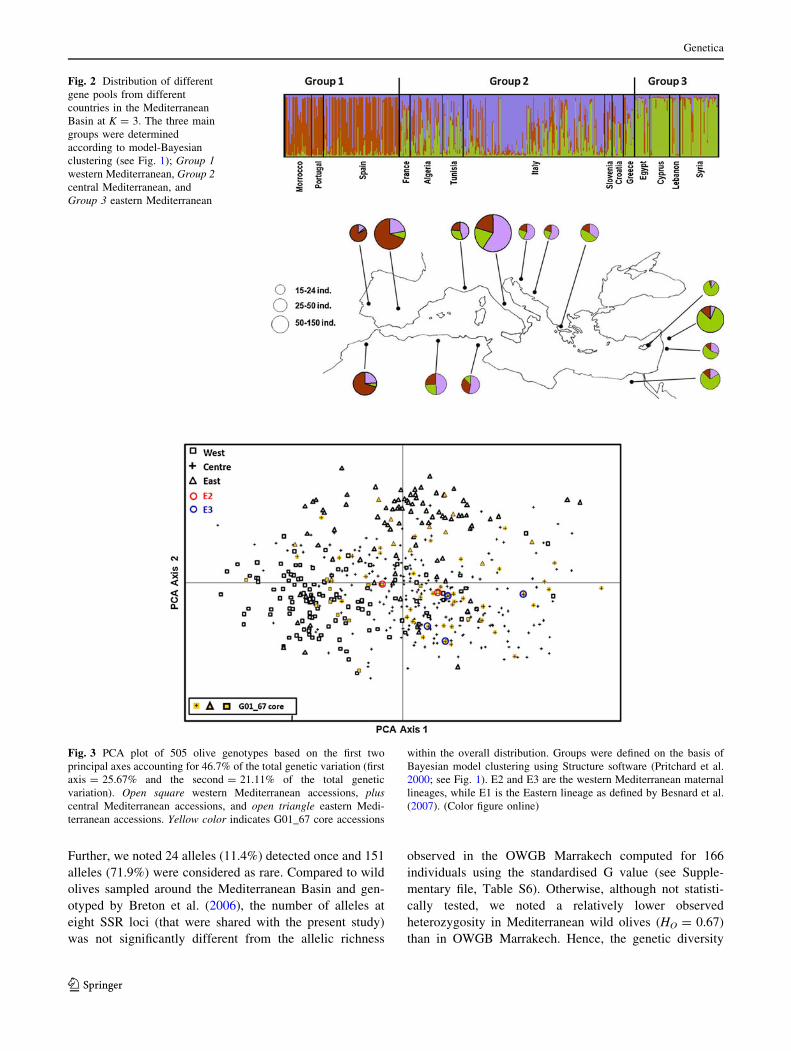
while for group 2, most genotypes were admixed (Fig. 2,
Table 3, and Supplementary file Table S4).
Table 3 Number and
proportion of genotypes from
different countries assigned to
the three clusters identified by
structure
a Under the assignation
probability P (qI) C 80%b No genotype assigned
Country Genotypes Assigned
genotypesaCluster 1 Cluster 2 Cluster 3
N % N % N %
Morocco 31 16 15 94 1 6 -b 0
Portugal 14 12 11 92 1 8 -b 0
Spain 89 69 59 85 9 13 1 2
Total for the group 1 134 97 85 88 11 11 1 1
Algeria 40 15 4 27 11 73 -b 0
Tunisia 24 10 -b 0 8 80 2 20
France 12 2 -b 0 2 100 -b 0
Italy 165 89 6 7 75 84 8 9
Slovenia 9 2 -b 0 2 100 -b 0
Croatia 14 5 -b 0 5 100 -b 0
Greece 13 2 1 50 -b 0 1 50
Total for the group 2 277 125 11 9 103 82 11 9
Egypt 19 11 1 9 -b 0 10 91
Cyprus 23 22 -b 0 2 9 20 91
Lebanon 13 12 1 8 3 25 8 67
Syria 47 42 3 7 -b 0 39 93
Total for the group 3 102 87 5 6 5 6 77 88
Genetica
123

The three groups defined by model-based Bayesian
clustering were plotted on the two first PCA axes (Fig. 3).
The western and eastern groups were distinguished by both
of the axes, while the central Mediterranean group was in
an intermediate position, as shown by the admixed inferred
ancestry origins of their genotypes (Fig. 2).
Construction of nested core collections maximising
diversity
When comparing the two strategies to capture the maxi-
mum genetic diversity, the sampling efficiency of the
M-strategy was always superior to a random strategy and
the relative efficiency was highest for small-size samples
(Fig. 4). Based on the M-strategy, the total allelic diversity
could be captured with 67 genotypes (Fig. 4A). After
exclusion of alleles observed only once, a minimum of 58
genotypes was necessary to capture the allelic diversity
(based on 186 alleles; Fig. 4B).
Under the optimal size of a core collection (67 acces-
sions) capturing all 210 alleles, 10 cores (G01 to G10)
obtained by the M-strategy were classified according to
their observed heterozygosity and Nei’s index diversity.
The genetic diversity of the best 10 cores ranged from 0.77
to 0.78 for the observed heterozygosity and from 9.55 to
9.73 for the Nei’s index diversity (Table 4). Each of the 10
cores (G01 to G10; Table 4) consisted of accessions from
the western Mediterranean (group 1;14.40 ± 2.17), central
Mediterranean (group 2; 38.10 ± 2.68) and eastern Medi-
terranean gene pools (group 3; 14.5 ± 1.90; Table 4).
Within each of the 10 cores, 60–63 accessions displayed
cpDNA lineage E1, while western cpDNA lineages E2 and
E3 were both represented by two to four accessions
(Table 4). To illustrate the representativeness of the ref-
erence core collection, the position of the G01_67 core
accessions is presented on the first two axes of the PCA
(Fig. 3).
Under the optimal size of a core collection (58 acces-
sions) capturing alleles scored at least twice (186 alleles),
the genetic diversity of the best 10 cores ranged from 0.75
to 0.77 for the observed heterozygosity and from 9.55 to
9.73 for the Nei’s index diversity (Supplementary file;
Table S5).
Discussion
Is the ex-situ OWGB Marrakech representative
of the Mediterranean olive germplasm?
All olive accessions analysed in this study are maintained
in an ex-situ collection considered as being representative
of Mediterranean olive germplasm since it was set up with
genetic resources from 14 Mediterranean countries. Each
national institute in charge of olive genetic resource man-
agement has defined the composition of their national
germplasm. However, sampling criteria such as the number
of accessions, the representativeness of ancient and modern
olive orchards in different areas and agro-ecosystems, and
the ratio between main, minor and local cultivars, have not
been uniformly used by the different Mediterranean partner
countries (Caballero et al. 2006). Because of this strategy
for setting up the studied ex-situ collection, we noted dis-
crepancies in the composition of different national olive
genetic resource sets, e.g. Spanish and Italian germplasm
included 89 and 167 accessions, respectively, while
Moroccan germplasm included only 40 accessions. Despite
such discrepancies, is the ex-situ OWGB Marrakech rep-
resentative of Mediterranean olive germplasm? We
observed no significant independence between the number
of alleles detected in 118 Mediterranean cultivars (Sarri
et al. 2006) and the allelic richness in OWGB Marrakech,
which was computed for 118 individuals using the stand-
ardised G value (see Supplementary file; Table S6).
Fig. 1 Inferred population
structure for K = 2 to K = 6 as
the presumed number of
subpopulations within the
Mediterranean ex situ
collection, including 561
accessions classified into 505
multilocus SSR profiles.
CLUMPP H’ (Jakobsson and
Rosenberg 2007) represents the
similarity coefficient between
runs for each K, and DKrepresents the ad-hoc measure
of (Evanno et al. 2005)
Genetica
123
Further, we noted 24 alleles (11.4%) detected once and 151
alleles (71.9%) were considered as rare. Compared to wild
olives sampled around the Mediterranean Basin and gen-
otyped by Breton et al. (2006), the number of alleles at
eight SSR loci (that were shared with the present study)
was not significantly different from the allelic richness
observed in the OWGB Marrakech computed for 166
individuals using the standardised G value (see Supple-
mentary file, Table S6). Otherwise, although not statisti-
cally tested, we noted a relatively lower observed
heterozygosity in Mediterranean wild olives (HO = 0.67)
than in OWGB Marrakech. Hence, the genetic diversity
Fig. 2 Distribution of different
gene pools from different
countries in the Mediterranean
Basin at K = 3. The three main
groups were determined
according to model-Bayesian
clustering (see Fig. 1); Group 1western Mediterranean, Group 2central Mediterranean, and
Group 3 eastern Mediterranean
Fig. 3 PCA plot of 505 olive genotypes based on the first two
principal axes accounting for 46.7% of the total genetic variation (first
axis = 25.67% and the second = 21.11% of the total genetic
variation). Open square western Mediterranean accessions, pluscentral Mediterranean accessions, and open triangle eastern Medi-
terranean accessions. Yellow color indicates G01_67 core accessions
within the overall distribution. Groups were defined on the basis of
Bayesian model clustering using Structure software (Pritchard et al.
2000; see Fig. 1). E2 and E3 are the western Mediterranean maternal
lineages, while E1 is the Eastern lineage as defined by Besnard et al.
(2007). (Color figure online)
Genetica
123

observed in OWGB Marrakech may be similar to the
existing Mediterranean wild and domesticated olive
diversity.
SSR markers as Mediterranean olive characterisation
tools
Among the 12 SSR loci used in this study, the three loci
(DCA09, DCA04, and DCA03) with the highest discrimi-
nating power were able to distinguish about 80% of the 505
defined genotypes (see Supplementary file, Table S7). This
level of discrimination could be even higher without the
closely related genotypes, which likely correspond to
mutants of clones, as previously shown (Khadari et al.
2008; Baali-Cherif and Besnard 2005). Olive discrimina-
tion based only on these three most discriminating loci was
validated by the low probability of classifying two random
accessions under the identical SSR profile (PI = 2.72 9
10-5). This probability decreased substantially when all 12
SSR loci used were taken into account (PI = 2.55 9
10-14). Six of these loci were included in the best con-
sensus set of SSR markers (Baldoni et al. 2009) that has
already been used for genetic structure studies (Sarri et al.
2006), and our study again confirmed that these markers
are reliable tools for olive characterisation.
When considering accessions from the different Medi-
terranean countries, the olive cultivars were not distin-
guished with the same efficiency. All Spanish accessions
were characterised as distinct genotypes (89 accessions
corresponding to 89 distinct SSR profiles). Similar results
were noted for Italian olive germplasm since 167 acces-
sions were classified into 165 genotypes. These results may
be attributed to previous characterisation, based on mor-
phological descriptors (Barranco et al. 2005), and molec-
ular markers such as RAPDs (Belaj et al. 2003) and SSRs
(Belaj et al. 2003, 2004), before selecting accessions for
introduction into OWGB Marrakech. In contrast, Syrian
germplasm displayed 14 of the 26 cases of synonymy
detected in OWGB Marrakech and a relatively higher
number of Syrian accessions pairs displayed closely related
genotypes (Supplementary file, Table S3). Beyond the fact
that these related genotypes may be derived from local
selection with a narrow genetic base, these observations
could be explained by the scattered and partial olive
characterisation (Baldoni et al. 2009). However, it is also
very likely that mutations on SSR alleles have led to the
distinction of very similar profiles for accessions belonging
to the same original genotype, particularly when a clone is
vegetatively multiplicated for a very long time (Khadari
et al. 2008; Lopes et al. 2004). Even ramets of the same
individual have been distinguished in relict Laperrine’s
olive populations, demonstrating that SSR mutations can
be relatively frequent under some environmental condi-
tions (Baali-Cherif and Besnard 2005). One can also expect
that the oldest cultivars have accumulated more mutations
than more recently selected cultivars, and the occurrence of
ancient clones in the Near East (e.g. Zohary and Spiegel-
Roy 1975) could thus explain our observations. Further-
more, some accessions from different countries were
classified under the same multilocus SSR profile, e.g. the
‘‘Zmj1’’ accession from Morocco and the ‘‘Zabarka’’
accession from Croatia. Such cases of cultivar identity
from different origins might be related to their dissemina-
tion to different cropping areas where growers might have
given them different local names (Trujillo et al. 1995;
Besnard et al. 2001b; Sarri et al. 2006). In olive germplasm
collections, over the last two decades, substantial efforts
have been focused on identifying these redundant acces-
sions using morphological and molecular data (Belaj et al.
2004; Barranco et al. 2005).
Mediterranean olive germplasm is structured into three
main gene pools
Our study showed that Mediterranean olive germplasm was
structured into three main gene pools, which strongly
matched three distinct geographic areas, i.e. western, cen-
tral and eastern Mediterranean regions. First, we showed
Fig. 4 Sampling efficiency based on the ability to capture the genetic
diversity via the M-strategy (M-method) and a random strategy:
A based on the total number of alleles (210), and B after exclusion of
observed alleles once. In each case, the size of the proposed core
collection was determined
Genetica
123

that K = 3 was the best genetic structure model, as also
reported by Baldoni et al. (2009) and Sarri et al. (2006).
Second, on the basis of this genetic structure, most acces-
sions clearly clustered according to their geographic origin.
Numerous genetic studies have reported genetic differen-
tiation between western and eastern Mediterranean areas
(Besnard et al. 2002, 2007; Breton et al. 2006; Sarri et al.
2006). Furthermore, Mediterranean cultivars analysed by
RAPD markers showed relative differentiation among
Spanish and Italian varieties (Besnard et al. 2001a), and a
clear distinction between Spanish varieties and those from
Greece and Turkey (Owen et al. 2005). Such a genetic
structure indicates a correlation between the genetic dif-
ferentiation of olive trees and their geographic distribution.
Despite this genetic structure, we observed dominance of
the eastern maternal lineage (95% of E1 vs. only 5% of
western maternal lineages E2 and E3). As previously
shown in Mediterranean wild and domesticated olives
(Besnard et al. 2002, 2007; Breton et al. 2006), all eastern
Mediterranean accessions carried E1, whereas lineages E2
and E3 were only observed in the western Mediterranean
Basin, but with a relatively low frequency in cultivars
(16%; Besnard et al. 2001a). These cpDNA lineages again
confirm that cultivated olive has been selected from dif-
ferent gene pools from both eastern and western regions of
the Mediterranean Basin (Besnard et al. 2001c).
A set of 67 accessions was sufficient to capture
the allelic diversity
The purpose of core collections is to facilitate the use of
germplasm by providing a set of accessions displaying the
genetic diversity available in the larger collection (Brown
1989). Our approach was based exclusively on genetic
criteria, by capturing most of the diversity in a small set of
accessions (58) after the exclusion of alleles observed only
once. This sampling could be extended to a larger set of 67
accessions to capture the total allelic diversity (210 alleles).
When examining the cultivar composition in each of the 10
best core accessions, we noted that about 40 cultivars were
in common, whereas the remaining were different in each
core. These investigations indicated the need to include
complementary criteria such as phenotypic, agronomic and
adaptive traits, but also the cultivar value and their
importance at historical, economic and sociocultural levels
to ensure optimal management. Beyond this variability, it
is also essential to assess genetic structures and pedigree
relationships within the core collection used for genetic
association studies and for identifying QTLs related to
phenotypic traits (Barnaud et al. 2006; Aranzana et al.
2010).
Conclusion
The present study demonstrated that the OWGB Marrakech
collection gives an accurate picture of Mediterranean olive
germplasm diversity. We provided a molecular database
that should facilitate management of this germplasm. In
addition, core collections will also be very useful for
developing new breeding strategies for adaptive and
agronomic traits through genome-wide association studies
(Myles et al. 2009).
Acknowledgments The authors would like to thank Dr. Ph. Chat-
elet for his kind remarks on the early version of the manuscript, and
M. Latreille for her help in the genotyping. They also acknowledge
Table 4 SSR diversity within samples of the G-core classified according to their observed heterozygosity and their Nei’s index diversity
Sample name Observed
heterozygosity
Nei’s index Group 1a
(N = 134)
Group 2a
(N = 277)
Group 3a
(N = 102)
Maternal lineage
G01_67 core 0.78 9.73 13 43 11 61E1, 2E2, 4E3
G02_67 core 0.77 9.72 13 40 14 61E1, 4E2, 2E3
G03_67 core 0.77 9.70 13 39 15 62E1, 2E2, 3E3
G04_67 core 0.77 9.68 12 38 17 62E1, 2E2, 3E3
G05_67 core 0.78 9.66 17 33 17 62E1, 2E2, 3E3
G06_67 core 0.76 9.65 17 36 14 62E1, 3E2, 2E3
G07_67 core 0.76 9.63 13 39 15 62E1, 2E2, 3E3
G08_67 core 0.76 9.62 13 38 16 60E1, 3E2, 4E3
G09_67 core 0.77 9.58 18 36 13 63E1, 2E2, 2E3
G10_67 core 0.77 9.55 15 39 13 63E1, 2E2, 2E3
Mean 0.77 9.65 14.40 38.10 14.5 –
SD – – 2.17 2.68 1.90 –
a Groups defined on the basis of Bayesian model clustering using Structure software (see Fig. 2)
Genetica
123

the International Olive Oil Council and INRA Morocco for their
contribution to founding and management of OWGB Marrakech. This
study was supported by PRAD 08-01, Volubilis Ma-08-197, Agrop-
olis Foundation FruitMed no. 0901-007. The PhD student, H. Haou-
ane, was supported by fellowships from Erasmus-Averroes and
PRAD 08-01.
Open Access This article is distributed under the terms of the
Creative Commons Attribution Noncommercial License which per-
mits any noncommercial use, distribution, and reproduction in any
medium, provided the original author(s) and source are credited.
References
Aranzana MJ, Abassi EK, Howad W, Arus P (2010) Genetic
variation, population structure and linkage disequilibrium in
peach commercial varieties. BMC Genet 11:69
Baali-Cherif D, Besnard G (2005) High genetic diversity and clonal
growth in relict populations of Olea europaea subsp. laperrinei(Oleaceae) from Hoggar, Algeria. Ann Bot 96:823–830
Baldoni L, Cultrera NG, Mariotti R, Ricciolini C, Arcioni S,
Vendramin GG, Buonamici A, Porceddu A, Sarri V, Ojeda
MA, Trujillo I, Rallo L, Belaj A, Perri E, Salimonti A,
Muzzalupo I, Casagrande A, Lain O, Messina R, Testolin R
(2009) A consensus list of microsatellite markers for olive
genotyping. Mol Breed 24:213–231
Banilas G, Minas J, Gregoriu C, Demoliou C, Kourti A, Hatzopoulos
P (2003) Genetic diversity among accessions of an ancient olive
variety of Cyprus. Genome 46:370–376
Barnaud A, Lacombe T, Doligez A (2006) Linkage disequilibrium in
cultivated grapevine, Vitis vinifera L. Theor Appl Genet
112:708–716
Barranco D, Rallo L (2000) Olive cultivars in Spain. HortTechnology
10:107–110
Barranco D, Trujillo I, Rallo L (2005) Libro I. Elaiografia hispanica.
In: Rallo L, Barranco D, Caballero JM, Del Rıo C, Martın A,
Tous J, Trujillo I (eds) Variedades del olivo en Espana. Junta de
Andalucia, MAPA y Ediciones Mundi-Prensa, Madrid,
pp 45–229
Bartolini G (2008) Olive germplasm (Olea europaea L.). Available
at: http://www.oleadb.it/olivodb.html
Bartolini G, Prevost G, Messeri C, Carignani C, Menini UG (1998)
Olive germplasm: cultivars and world-wide collections. FAO,
Rome, Italy
Belaj A, Satovic Z, Cipriani G, Baldoni L, Testolin R, Rallo L,
Trujillo I (2003) Comparative study of the discriminating
capacity of RAPD, AFLP and SSR markers and of their
effectiveness in establishing genetic relationships in olive. Theor
Appl Genet 107:736–744
Belaj A, Cipriani G, Testolin R, Rallo L, Trujillo I (2004)
Characterization and identification of the main Spanish and
Italian olive cultivars by simple-sequence-repeat markers. Hort-
Science 39:1557–1561
Belaj A, Munoz-Diez C, Baldoni L, Satovic Z, Barranco D (2010)
Genetic diversity and relationships of wild and cultivated olives
at regional level in Spain. Sci Hortic 124:323–330
Belkhir K, Borsa P, Chikhi L, Raufaste N, Bonhomme F (2004)
GENETIX 4.05, logiciel sous WindowsTM
pour la genetique des
populations. Laboratoire Genome, Populations, Interactions,
Centre National de la Recherche Scientifique, Unite Mixte de
Recherche 5000. Universite de Montpellier II, Montpellier,
France
Besnard G, Baradat P, Berville A (2001a) Genetic relationships in the
olive (Olea europaea L.) reflect multilocal selection of cultivars.
Theor Appl Genet 102:251–258
Besnard G, Breton C, Baradat P, Khadari B, Berville A (2001b)
Cultivar identification in the olive (Olea europaea L.) based on
RAPDS. J Am Soc Hortic Sci 126:668–675
Besnard G, Baradat P, Breton C, Khadari B, Berville A (2001c) Olive
domestication from structure of oleasters and cultivars using
nuclear RAPDs and mitochondrial RFLPs. Genet Sel Evol
33:S251–S268
Besnard G, Khadari B, Baradat P, Berville A (2002) Olea europaea(Oleaceae) phylogeography based on chloroplast DNA poly-
morphism. Theor Appl Genet 104:1353–1361
Besnard G, Rubio de Casas R, Vargas P (2003) A set of primers for
length and nucleotide-substitution polymorphism in chloroplas-
tic DNA of Olea europaea L. (Oleaceae). Mol Ecol Notes
3:651–653
Besnard G, Rubio de Casas R, Vargas P (2007) Plastid and nuclear
DNA polymorphism reveals historical processes of isolation and
reticulation in the olive tree complex (Olea europaea L.).
J Biogeogr 34:736–752
Breton C, Tersac M, Berville A (2006) SSR genetic diversity in wild
olive (oleaster, Olea europaea L.) suggests several Plio-Pleis-
tocene refuge zones in the Mediterranean basin and gene flow
with olive. J Biogeogr 33:1916–1928
Brown AHD (1989) The case for core collection. Genome 31:
818–824
Caballero JM, del Rıo C (2002) Caracterizacion del banco de
germoplasma de olivo por caracteres agronomicos. Procedim-
ientos de Jornadas de Investigacion y Transferencıa de Techno-
logıa al Sector Oleicola, Programa de Mejora de la Calidad de la
Produccion de Aceite de Oliva. Cordoba, Espana, pp 13–15
Caballero JM, Del Rıo C, Barranco D, Trujillo I (2006) The olive
world germplasm of Cordoba, Spain. Olea 25:14–19
Cantini C, Cimato A, Sani G (1999) Morphological evaluation of
olive germplasm present in Tuscany region. Euphytica 109:
173–181
Carriero F, Fontanazza G, Cellini F, Giorio G (2002) Identification of
simple sequence repeats (SSRs) in olive (Olea europaea L.).
Theor Appl Genet 104:301–307
Carrion Y, Ntinou M, Badal E (2010) Olea europaea L. in the North
Mediterranean Basin during the Pleniglacial and the early-middle holocene. Quat Sci Rev 29:952–968
Cipriani G, Marrazzo MT, Marconi R, Cimato A, Testolin R (2002)
Microsatellite markers isolated in olive (Olea europaea L.) are
suitable for individual fingerprinting and reveal polymorphism
within ancient cultivars. Theor Appl Genet 104:223–228
de La Rosa R, James CM, Tobutt KR (2002) Isolation and
characterization of polymorphic microsatellites in olive (Oleaeuropaea L.) and their transferability to other genera in the
Oleaceae. Mol Ecol Notes 2:265–267
Escribano P, Viruel MA, Hormaza JI (2008) Comparison of different
methods to construct a core germplasm collection in woody
perennial species with simple sequence repeat markers. A case
study in cherimoya (Annona cherimola, Annonaceae), an
underutilised subtropical fruit tree species. Ann Appl Biol 153:
25–32
Engels JMM, Visser L (eds) (2003) A guide to effective management
of germplasm collections. IPGRI (ITA), Rome, pp 157–161
Evanno G, Regnaut S, Goudet J (2005) Detecting the number of
clusters of individuals using the software STRUCTURE: a
simulation study. Mol Ecol 14:2611–2620
Frankel OH, Brown AHD (1984) Plant genetic resources today: a
critical appraisal. Crop genetic resources. In: Holden JHW,
Williams JT (eds) Conservation and evaluation. Georges Allen
& Unwin Ltd, London, pp 249–257
Genetica
123

Gemas VJV, Almadanim MC, Tenreiro R, Martins A, Fevereiro P
(2004) Genetic diversity in the Olive tree (Olea europaea L.
subsp. europaea) cultivated in Portugal revealed by RAPD and
ISSR markers. Genet Resourc Crop Evol 51:501–511
Gouesnard B, Bataillon TM, Decoux G, Rozale C, Schoen DJ, David
JL (2001) MSTRAT: an algorithm for building germplasm core
collections by maximizing allelic or phenotypic richness.
J Hered 92:93–94
International Olive Council (IOC) (2007) Olive oil production and
consumption in the season 2006/07. Available at: www.
internationaloliveoil.org/downloads/
Jakobsson M, Rosenberg NA (2007) CLUMPP: a cluster matching
and permutation program for dealing with label switching and
multimodality in analysis of population structure. Bioinformatics
23:801–1806
Khadari B, Charafi J, Moukhli A, Ater M (2008) Substantial genetic
diversity in cultivated Moroccan olive despite a single major
cultivar: a paradoxical situation evidenced by the use of SSR
loci. Tree Genet Genomes 4:213–221
Le Cunff L, Fournier-Level A, Laucou V, Vezzulli S, Lacombe T,
Adam-Blondon AF, Boursiquot JM, This P (2008) Construction
of nested genetic core collections to optimize the exploitation of
natural diversity in Vitis vinifera L. subsp. sativa. BMC Plant
Biol 8:31
Lopes MS, Mendonca D, Sefc KM, Sabino GF, da Camara Machado
A (2004) Genetic evidence of intra-cultivar variability within
Iberian olive cultivars. Hort Science 39:1562–1565
Myles S, Peiffer J, Brown PJ, Ersoz ES, Zhang ZW, Cotich DE,
Buckler ES (2009) Association mapping: critical considerations
shift from genotyping to expiremental design. Plant Cell
21:2194–2202
Nei M (1987) Molecular evolutionary genetics. Columbia University
Press, Columbia
Owen CA, Bita EC, Banilas G, Hajjar SE, Sellianakis V, Aksoy U,
Hepaksoy S, Chamoun R, Talhook S, Metzidakis I, Hatzopoulos
P, Kalaitzis P (2005) AFLP reveals structural details of genetic
diversity within cultivated olive germplasm from the Eastern
Mediterranean. Theor Appl Genet 110:1169–1176
Paetkau D, Calvert W, Stirling I, Strobeck C (1995) Microsatellites
analysis of population structure in Canadian polar bears. Mol
Ecol 4:347–354
Peakall R, Smouse PE (2005) GenAlEx 6: genetic analysis in Excel.
population genetic software for teaching and research. Mol Ecol
Notes 6:288–295
Pritchard JK, Stephens M, Donnelly P (2000) Inference of population
structure using multilocus genotype data. Genetics 155:945–959
Rosenberg NA (2004) DISTRUCT: a program for the graphical
display of population. Mol Ecol Notes 4:137–138
Sarri V, Baldoni L, Porceddu A, Cultrera NGM, Contento A, Frediani
M, Belaj A, Trujillo I, Cionini PG (2006) Microsatellite markers
are powerful tools for discriminating among olive cultivars and
assigning them to geographically defined populations. Genome
49:1606–1615
Schoen DJ, Brown AHD (1993) Conservation of allelic richness in
wild crop relatives is aided by assessment of genetic markers.
Proc Natl Acad Sci USA 90:10623–10627
Sefc KM, Lopes MS, Mendonca D, Rodrigues Dos Santos M, Da
Camara Machado L (2000) Identification of microsatellites loci
in Olive (Olea europaea L.) and their characterization in Italian
and Iberian trees. Mol Ecol 9:171–1193
Szpiech ZA, Jakobsson M, Rosenberg NA (2008) ADZE: a rarefac-
tion approach for counting alleles private to combinations of
populations. Bioinformatics 24:2498–2504
Terral JF, Alonso N, Capdevila RBI, Chatti N, Fabre L, Fiorentino G,
Marinval P, Jorda GP, Pradat B, Rovira N, Alibert P (2004)
Historical biogeography of olive domestication (Olea europaeaL.) as revealed by geometrical morphometry applied to biolog-
ical and archaeological material. J Biogeogr 31:63–77
Tessier C, David J, This P, Boursiquot JM, Charrier A (1999)
Optimization of the choice of molecular markers for varietal
identification in Vitis vinifera L. Theor Appl Genet 98:171–177
Trujillo I, Rallo L, Arus P (1995) Identifying olive cultivars by
isozyme analysis. J Am Soc Hortic Sci 120:318–324
Wagner HW, Sefc KM (1999) Identity 1.0. Centre for applied
genetics. University of Agricultural Sciences, Vienna
Zohary D, Spiegel-Roy P (1975) Beginnings of fruit growing in the
Old World. Science 187:319–327
Genetica
123